

Analyzing Cooking Efficiency of Gradoli Purgatory Beans: Effects of Dehulling, Malting, and Monovalent Carbonates


Abstract

1. Introduction
2. Materials and Methods
2.1. Raw Materials
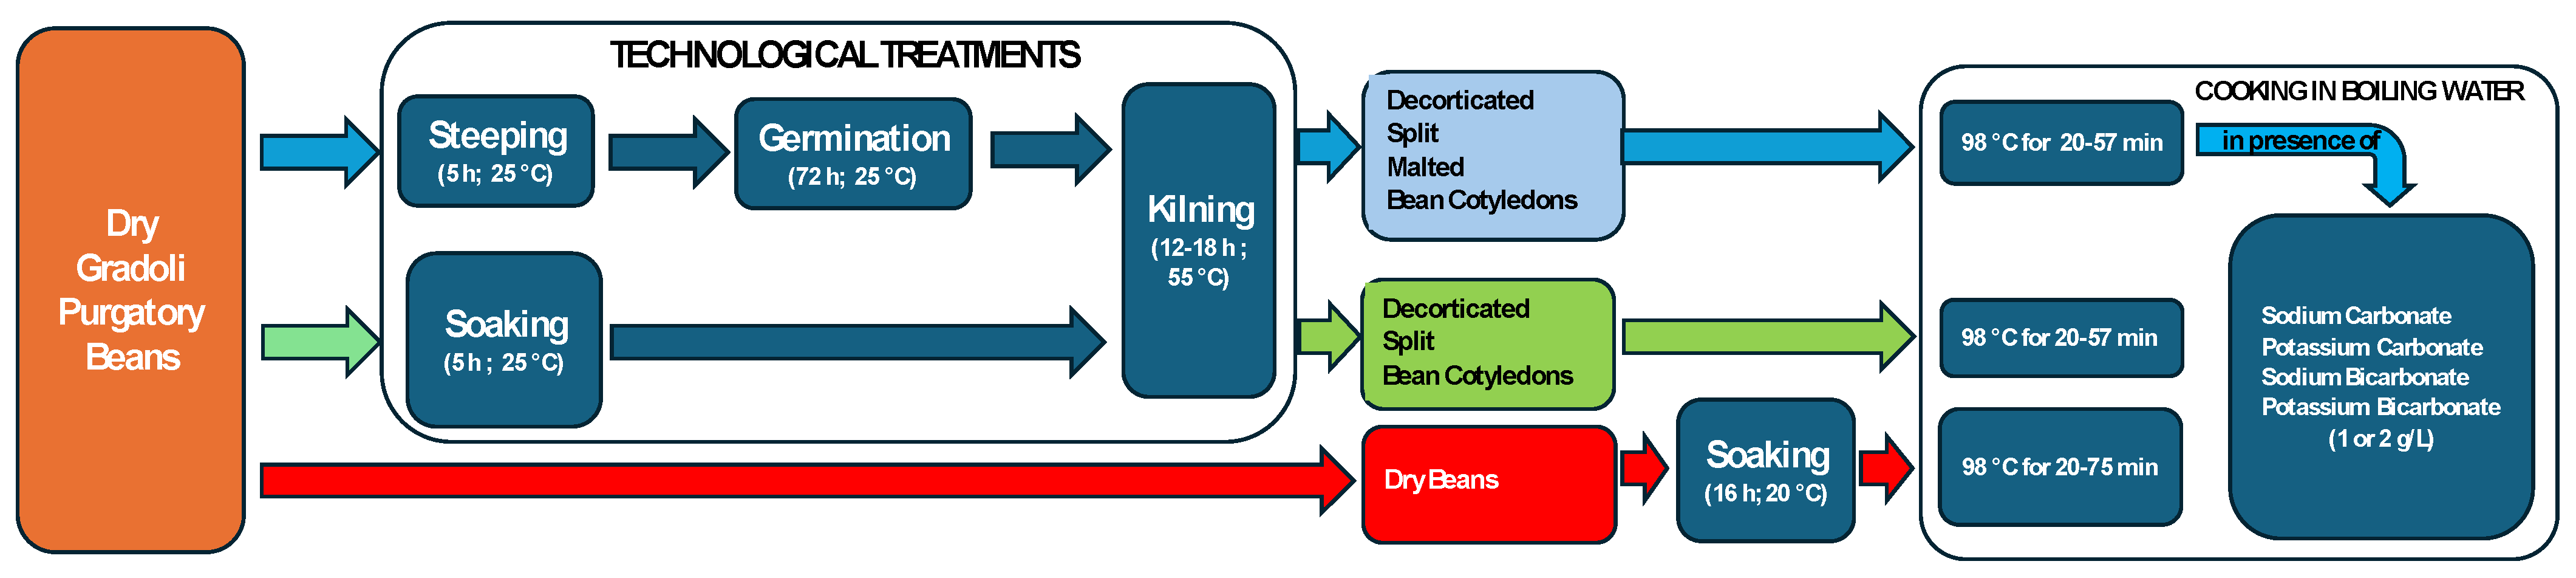
2.2. Processing
- (1)
- Washing: A total of 50 kg of dried GPBs was washed using 200 L of water and measured using an LZS-25 (D) Jectse flow meter with a measuring range of 60–600 L/h and an accuracy of 4% at the upper range.
- (2)
- Steeping: The first phase of the malting process involved soaking the beans for 5 h in 200 L of water at 25 °C. This increased the bean water level from 12 to 54.7 ± 1.4 % (w/w) [22].
- (3)
- Germination: After draining the steeping water, the beans were kept germinating at 25 °C with continuous humidification for 72 h. The degradation of major antinutrients, such as phytic acid and α-galactosides, was analyzed utilizing specific assay kits from Megazyme Ltd. (Bray, Ireland).
- (4)
- Dehydration: The germinated beans were dried to a final water fraction of 10 ± 2% (w/w) by setting the maximum temperature at 55 °C for 12–18 h.
2.3. Characterization of Bean Seeds
2.4. Bean Cooking Procedure
2.5. Analytical Methods
2.6. Energy Balance and GHG Emissions Associated with Bean Cooking
2.7. Statistical Analysis of Data
3. Results and Discussion
3.1. Physical Properties
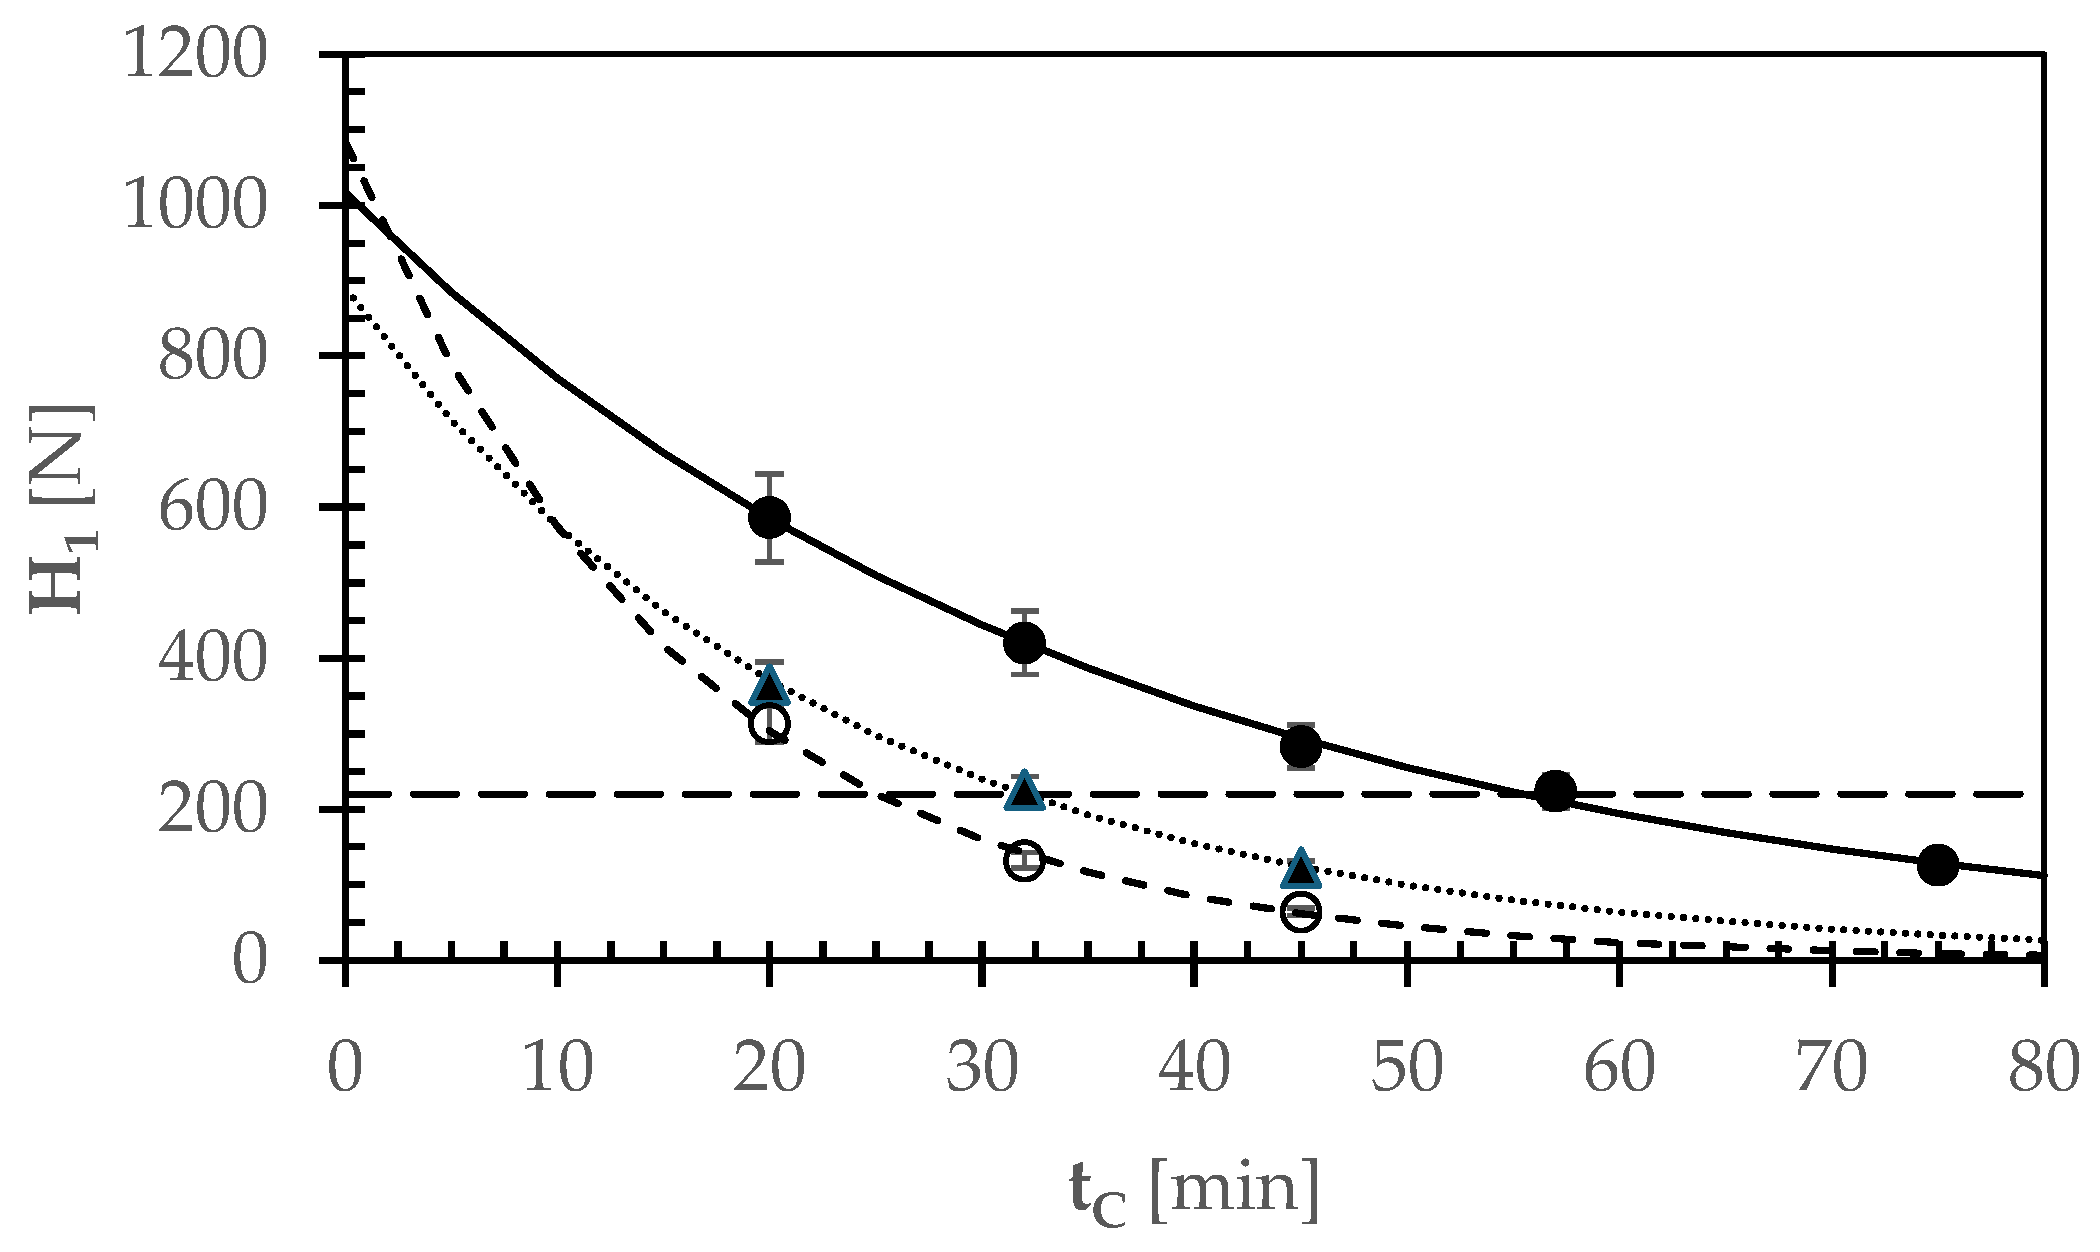
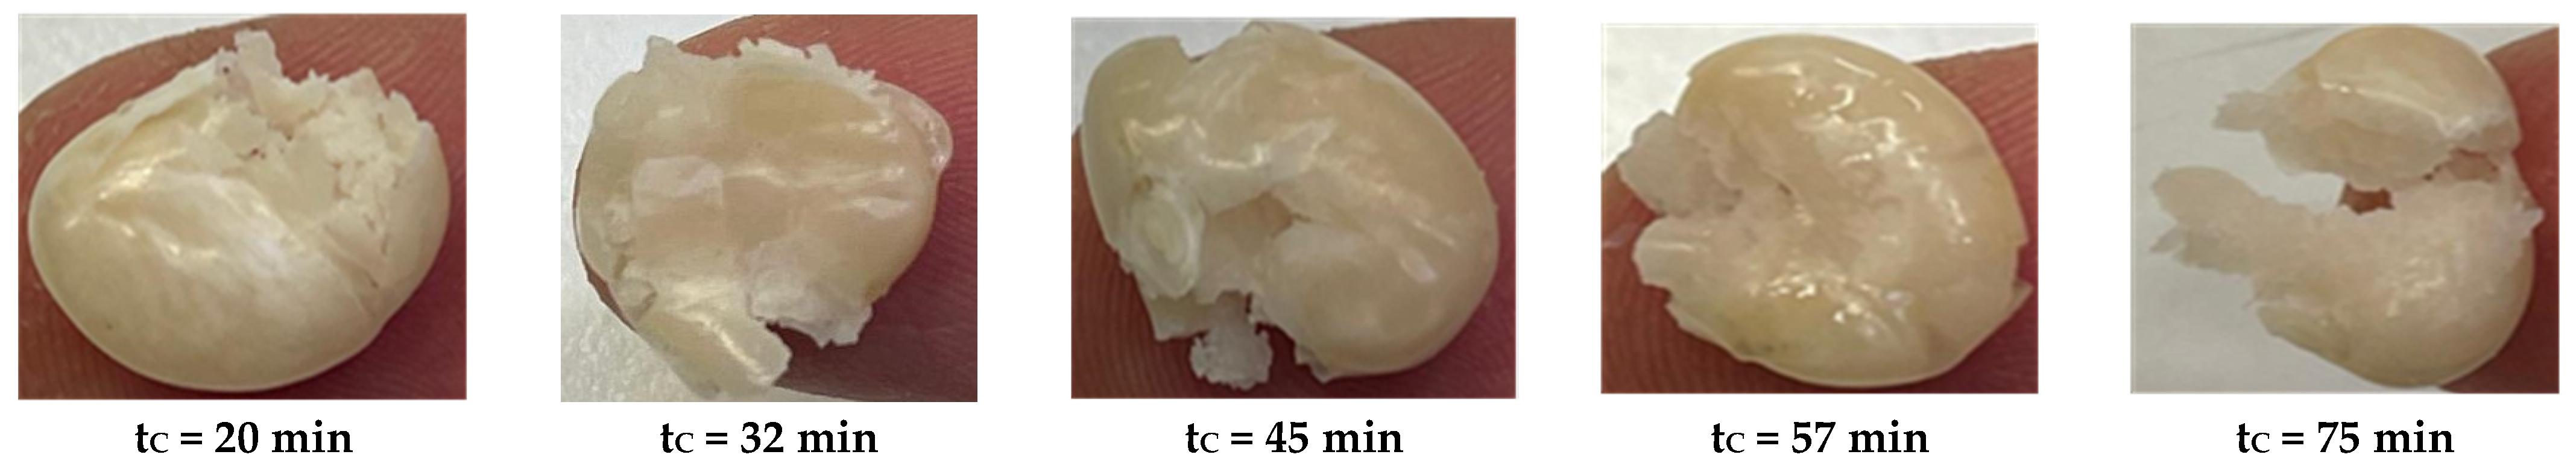
3.2. Bean Softening upon Cooking
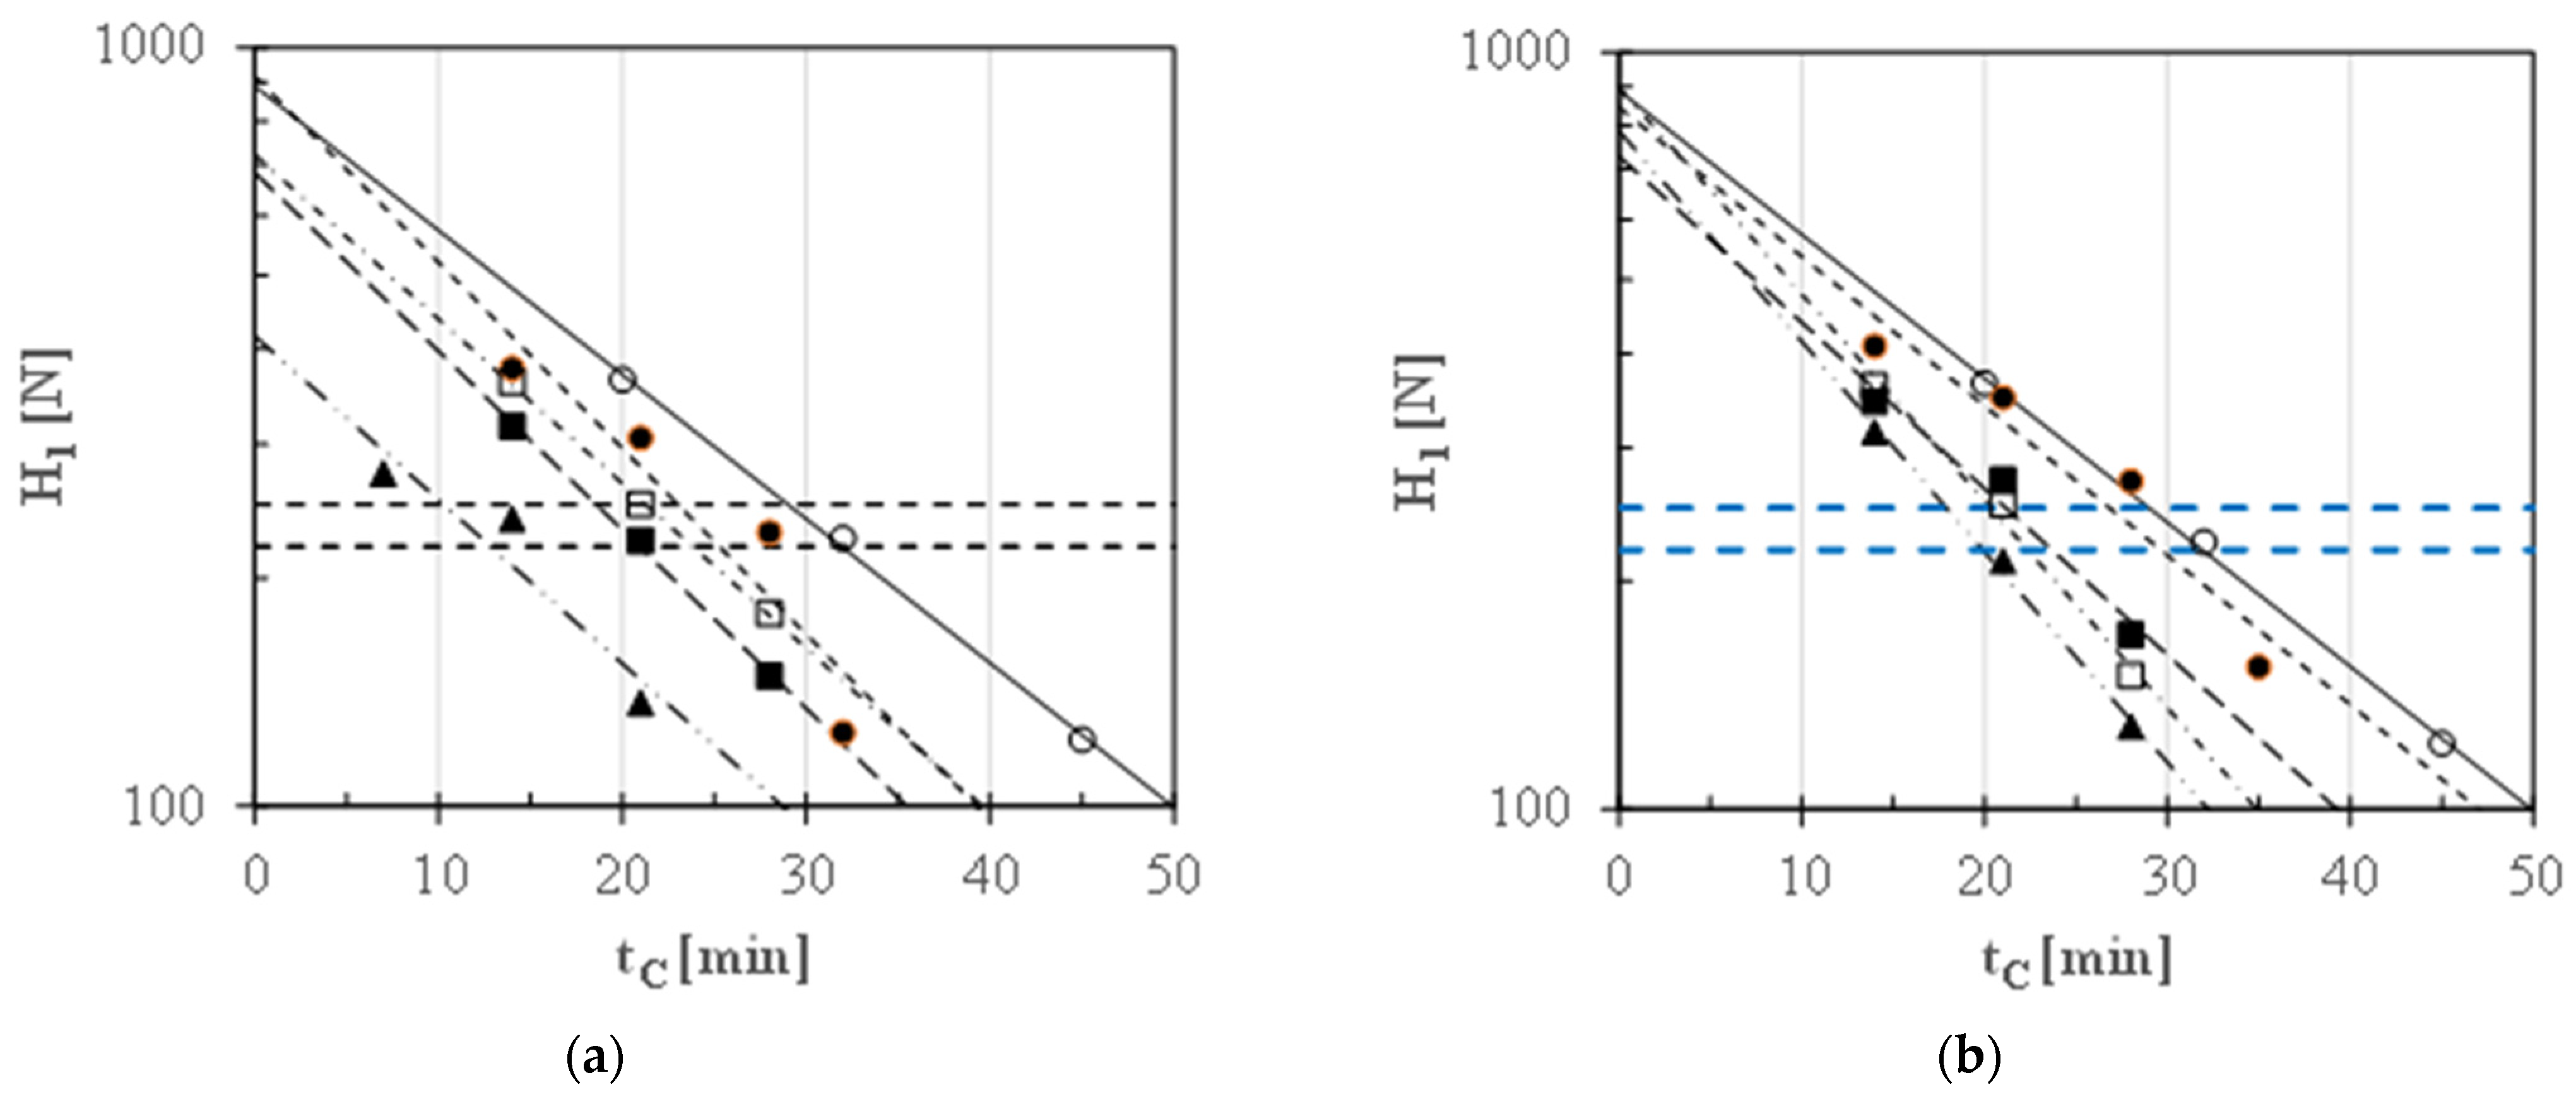
3.3. Effect of Monovalent Salts on Cooking Time
3.4. Bean Cooking Energy and Carbon Footprint Estimation
4. Conclusions
Supplementary Materials
Author Contributions
Funding
Institutional Review Board Statement
Informed Consent Statement
Data Availability Statement
Acknowledgments
Conflicts of Interest
Nomenclature
| AC1 | Force-vs.-time area during the first compression cycle [mJ] |
| AC2 | Force-vs.-time area during the second compression cycle [mJ] |
| AD1 | Force-vs.-time area during the first decompression cycle [mJ] |
| AD2 | Force-vs.-time area during the second decompression cycle [mJ] |
| CER | Cohesion energy resilience (=AC2/AC1) [dimensionless] |
| CFBC | Carbon footprint of bean cooking [kg CO2e/kg] |
| CFBC,EE | Contribution of the electric energy to CFBC [kg CO2e/kg] |
| CFBC,Si | Contribution of the i-th salt to CFBC [kg CO2e/kg] |
| CFBC,TW | Contribution of tap water to CFBC [kg CO2e/kg] |
| CFR | Cohesion force resilience (=H2/H1) [dimensionless] |
| Ci | Molar concentration of the i-th monovalent cation [mol/L] |
| cPdm | Specific heat of the dry matter [kJ kg−1 K−1] |
| cpHB | Specific heats of pre-hydrated beans [kJ kg−1 K−1] |
| cpW | Specific heats of cooking water [kJ kg−1 K−1] |
| cSi | Concentration of the i-th salt dissolved in the cooking water [g/L] |
| DSGPB | Decorticated and split Gradoli Purgatory beans |
| E500i | Sodium carbonate |
| E500ii | Sodium bicarbonate |
| E501i | Potassium carbonate |
| E501ii | Potassium bicarbonate |
| EFEE | Emission factor associated with the Italian production and distribution of low-voltage electrical energy [g CO2e/kWh] |
| EFSi | Emission factor associated with the production of the i-th salt used [g CO2e/kg] |
| EFTW | Emission factor associated with the use of tap water [g CO2e/m3] |
| ES | Electric energy supplied by the induction hob [kWh] |
| ESc | Estimated energy supplied by the induction stove using Equation (8) or Equation (9) [kWh] |
| eS,eff | Specific electrical energy absorbed from the Italian grid for bean cooking [kWh/kg] |
| Eth | Theoretical energy needed to heat the water-bean mixture [kWh] |
| F | Compression force [F] |
| GHG | Greenhouse gas |
| GPB | Gradoli Purgatory beans |
| H1 | Force peak on the first 25% compression cycle [N] |
| H10 | Initial peak forces on the first compression cycle [N] |
| H2 | Force peak on the second 25% compression cycle [N] |
| HC | Hydration capacity [g/seed] |
| HS | Hardshell |
| HTC | Hard-to-cook |
| K | Rate constant of seed softening [min−1] |
| mBD | Mass of dry beans to be cooked [kg] |
| MDSGPB | Malted, decorticated, and split Gradoli Purgatory beans |
| mHB | Mass of pre-hydrated beans [kg] |
| mPdm | Dry matter in beans [kg] |
| mS | Seed weight [g/seed] |
| mSi | Mass of the i-th salt added [kg] |
| mWC | Mass of cooking water [kg] |
| mWS | Mass of water used during bean steeping [kg] |
| OCT | Optimum cooking time [min] |
| p | Probability level [dimensionless] |
| PME | Pectin methyl esterase |
| qsHB | Energy required to raise the temperature of pre-soaked beans [kJ] |
| qsW | Energy required to raise the temperature of cooking water [kJ] |
| r2 | Coefficient of determination |
| RS | Mean radius of beans [cm] |
| SC | Swelling capacity [cm3/seed] |
| t | Compression time [s] |
| tC | Cooking time [min] |
| T0 | Initial temperature of cooking water and beans [°C] |
| Tb | Boiling temperature of water [°C] |
| TPA | Texture profile analysis. |
| VS | Seed volume [cm3/seed] |
| WPR | Cooking water-to-dry bean ratio [L/kg] |
| xSS | Dry matter content of raw beans [g/g] |
| Greek symbols | |
| ρS | Seed density [g/cm3] |
| εRi | Percentage reduction of the generic i-th CFBC compared to the reference CFBC value [%] |
| ηIG | Average electrical energy grid lost [%] |
References
- Expert Market Research. Global Pulses Market Report and Forecast 2024–2032. 2023. Available online: https://www.expertmarketresearch.com/reports/pulses-market (accessed on 25 July 2024).
- FAO. Bean Production—FAO [Dataset]. Food and Agriculture Organization of the United Nations, Production: Crops and Livestock Products [Original Data]. 2023. Available online: https://ourworldindata.org/grapher/bean-production (accessed on 3 August 2024).
- Rawal, V.; Navarro, D.K. The Global Economy of Pulses; FAO: Rome, Italy, 2019. [Google Scholar]
- de Almeida Costa, G.E.; Da Silva Queiroz-Monici, K.; Pissini Machado Reis, S.M.; De Oliveira, A.C. Chemical composition, dietary fibre and resistant starch contents of raw and cooked pea, common bean, chickpea and lentil legumes. Food Chem. 2006, 94, 327–330. [Google Scholar] [CrossRef]
- Gebrelibanos, M.; Tesfaye, D.; Raghavendra, Y.; Sintayeyu, B. Nutritional and health implications of legumes. Int. J. Pharm. Sci. Res. 2013, 4, 1269–1279. [Google Scholar]
- FDA (Food and Drug Administration). Phytohaemagglutinin (Kidney Bean Lectin). In Bad Bug Book, Foodborne Pathogenic Microorganisms and Natural Toxins, 2nd ed.; FDA: Silver Spring, MD, USA, 2012; pp. 254–256. Available online: https://www.fda.gov/media/83271/download (accessed on 3 August 2024).
- Wainaina, I.; Lugumira, R.; Wafula, E.; Kyomugasho, C.; Sila, D.; Hendrickx, D. Insight into pectin-cation-phytate theory of hardening in common bean varieties with different sensitivities to hard-to-cook. Food Res. Int. 2022, 151, 110862. [Google Scholar] [CrossRef]
- Chigwedere, C.M.; Olaoye, T.F.; Kyomugasho, C.; Kermani, Z.J.; Pallares Pallares, A.; Van Loey, A.M.; Grauwet, T.; Marc, E.; Hendrickx, M.E. Mechanistic insight into softening of Canadian wonder common beans (Phaseolus vulgaris) during cooking. Food Res. Int. 2018, 106, 522–531. [Google Scholar] [CrossRef]
- Mubaiwa, J.; Fogliano, V.; Chidewe, C.; Linnemann, A.R. Hard-to-cook phenomenon in bambara groundnut (Vigna subterranea (L.) Verdc.) processing: Options to improve its role in providing food security. Food Rev. Int. 2017, 33, 167–194. [Google Scholar] [CrossRef]
- Chen, D.; Bernaerts, T.; Stephane Debon, S.; Oduah, C.O.; Zhu, L.; Wallecan, J.; Hendrickx, M.; Kyomugasho, C. Novel insights into the role of the pectin-cation-phytate mechanism in ageing induced cooking texture changes of Red haricot beans through a texture-based classification and in situ cell wall associated mineral quantification. Food Res. Int. 2023, 163, 112216. [Google Scholar] [CrossRef] [PubMed]
- Chen, D.; Ding, A.; Zhu, L.; Grauwet, T.; Van Loey, A.; Hendrickx, M.; Kyomugasho, C. Phytate and mineral profile evolutions to explain the textural hardening of common beans (Phaseolus vulgaris L.) during postharvest storage and soaking: Insights obtained through a texture-based classification approach. Food Chem. 2023, 404, 134531. [Google Scholar] [CrossRef] [PubMed]
- Perera, D.; Devkota, L.; Garnier, G.; Panozzo, J.; Dhital, S. Hard-to-cook phenomenon in common legumes: Chemistry, mechanisms and utilization. Food Chem. 2023, 415, 135743. [Google Scholar] [CrossRef] [PubMed]
- Avila, B.P.; Santos dos Santos, M.; Nicoletti, A.M.; Alves, G.D.; Elias, M.C.; Monks, J.; Gularte, M. AImpact of different salts in soaking water on the cooking time, texture and physical parameters of cowpeas. Plant Foods Hum. Nutr. 2015, 70, 463–469. [Google Scholar] [CrossRef]
- Alpos, M.; Leong, S.Y.; Liesaputra, V.; Oey, I. Influence of pulsed electric fields (PEF) with calcium addition on the texture profile of cooked black beans (Phaseolus vulgaris) and their particle breakdown during in vivo oral processing. Innov. Food Sci. Emerg. Technol. 2022, 75, 102892. [Google Scholar] [CrossRef]
- Yousif, A.M.; Kato, J.; Deeth, H.C. Effect of storage on the biochemical structure and processing quality of Adzuki bean (Vigna angularis). Food Rev. Int. 2007, 23, 1–33. [Google Scholar] [CrossRef]
- Luo, Y.; Xie, W.; Luo, F. Effect of several germination treatments on phosphatases activities and degradation of phytate in faba bean (Vicia faba L.) and azuki bean (Vigna angularis L.). J. Food Sci. 2012, 77, C1023–C1029. [Google Scholar] [CrossRef] [PubMed]
- de León, L.F.; Elías, L.G.; Bressani, R. Effect of salt solutions on the cooking time, nutritional and sensory characteristics of common beans (Phaseolus vulgaris). Food Res. Int. 1992, 25, 131–136. [Google Scholar] [CrossRef]
- Das, G.; Sharma, A.; Sarkar, P.K. Conventional and emerging processing techniques for the post-harvest reduction of antinutrients in edible legumes. Appl. Food Res. 2022, 2, 100112. [Google Scholar] [CrossRef]
- Sharma, N.; Sahu, J.K.; Joshi, S.; Khubber, S.; Bansal, V.; Bhardwaj, A.; Bangar, S.P.; Bal, L. M Modulation of lentil antinutritional properties using non-thermal mediated processing techniques—A review. J. Food Compos. Anal. 2022, 109, 104498. [Google Scholar] [CrossRef]
- Haileslassie, H.A.; Henry, C.J.; Tyler, R.T. Impact of pre-treatment (soaking or germination) on nutrient and anti-nutrient contents, cooking time and acceptability of cooked red dry bean (Phaseolus vulgaris L.) and chickpea (Cicer arietinum L.) grown in Ethiopia. Int. J. Food Sci. Technol. 2019, 54, 2540–2552. [Google Scholar] [CrossRef]
- Cimini, A.; Poliziani, A.; Moresi, M. Effect of temperature on the hydration kinetics of chickpea (Cicer arietinum L.) and yellow soybean (Glycine max). Chem. Eng. Trans. 2021, 87, 31–36. [Google Scholar]
- Cimini, A.; Poliziani, A.; Morgante, L.; Moresi, M. Assessment of the malting process of Purgatory bean and Solco Dritto chickpea seeds. Foods 2023, 12, 3187. [Google Scholar] [CrossRef]
- Cimini, A.; Poliziani, A.; Morgante, L.; Moresi, M. Antinutrient removal in yellow lentils by malting. J. Sci. Food Agric. 2024, 104, 508–517. [Google Scholar] [CrossRef]
- Di Giovannantonio, C.; Catta, M.; Pica, G.; Casadei, G. Lazio Patrimonio Agroalimentare tra Biodiversità e Tradizione; ARSIAL: Rome, Italy, 2019. [Google Scholar]
- Slow Food Foundation. Purgatory Beans. Available online: https://www.fondazioneslowfood.com/en/ark-of-taste-slow-food/purgatory-beans/ (accessed on 3 August 2024).
- Bassett, A.; Hooper, S.; Cichy, K. Genetic variability of cooking time in dry beans (Phaseolus vulgaris L.) related to seed coat thickness and the cotyledon cell wall. Food Res. Int. 2021, 141, 109886. [Google Scholar] [CrossRef]
- Wood, J.A. Evaluation of cooking time in pulses: A review. Cereal Chem. 2017, 94, 32–48. [Google Scholar] [CrossRef]
- Wang, N.; Daun, J.K. Determination of cooking times of pulses using an automated Mattson cooker apparatus. J. Sci. Food Agric. 2005, 85, 1631–1635. [Google Scholar] [CrossRef]
- Wang, N.; Panozzo, J.F.; Wood, J.; Malcolmson, L.J.; Arganosa, G.C.; Baik, B.-K.; Driedger, D.; Han, J. AACCI approved methods Technical Committee report: Collaborative study on a method for determining firmness of cooked pulses (AACC International Method 56-36.01). Cereal Foods World 2012, 57, 230–234. [Google Scholar] [CrossRef]
- Cimini, A.; Poliziani, A.; Morgante, L.; Moresi, M. Cooking and nutritional characteristics of malted chickpeas. Chem. Eng. Trans. 2023, 102, 343–348. [Google Scholar] [CrossRef]
- AOAC. Crude Protein in Cereal Grains and Oilseeds. Generic Combustion Method. AOAC Method 992.23-1992; Association of Official Analytical Chemists: Gaithersburg, MD, USA, 1998. [Google Scholar]
- Kajumba, P.K.; Okello, D.; Nyeinga, K.; Nydal, O.J. Assessment of the energy needs for cooking local food in Uganda: A strategy for sizing thermal energy storage with cooker system. Energy Sustain. Dev. 2022, 67, 67–80. [Google Scholar] [CrossRef]
- Bourne, M.C. Food Texture and Viscosity: Concept and Measurement, 2nd ed.; Academic Press: San Diego, CA, USA, 2002; pp. 182–186. [Google Scholar]
- Kwofie, E.M.; Mba, O.I.; Ngadi, M. Classification, force deformation characteristics and cooking kinetics of common beans. Processes 2020, 8, 1227. [Google Scholar] [CrossRef]
- Kinyanjui, P.K.; Njoroge, D.M.; Makokha, A.O.; Christiaens, S.; Ndaka, D.S.; Hendrickx, M. Hydration properties and texture fingerprints of easy- and hard-to-cook bean varieties. Food Sci. Nutr. 2015, 3, 39–47. [Google Scholar] [CrossRef]
- UNAFPA (Unions de Associations de Fabricants de Pâtes Alimentaires). Product Environmental Footprint Category Rules (PEFCR) for Dry Pasta. Vers. 3. 2018. Available online: https://docslib.org/doc/6636089/product-environmental-footprint-category-rules-for-dry-pasta (accessed on 27 May 2024).
- BSI. Publicly Available Specification (PAS 2050) for the Assessment of the Life Cycle Greenhouse Gas Emission of Goods and Services; British Standards Institution: London, UK, 2011. [Google Scholar]
- Cimini, A.; Cibelli, M.; Moresi, M. Reducing the cooking water-to-dried pasta ratio and environmental impact of pasta cooking. J. Sci. Food Agric. 2019, 99, 1258–1266. [Google Scholar] [CrossRef]
- TERNA Driving Energy. Bilancio dell’energia Elettrica in Italia. In Dati Generali 2022; TERNA Driving Energy: Rome, Italy, 2022; p. 14. Available online: https://download.terna.it/terna/1%20-%20DATI%20GENERALI_8dbcf1727cec624.pdf (accessed on 17 May 2024).
- Kurtz, A.D.; Winston, A.E. Process for the Production of Potassium Bicarbonate. US Patent No. 4,919,910, 24 April 1990. Available online: https://patentimages.storage.googleapis.com/f8/c7/ff/6bae1a155f3349/US4919910.pdf (accessed on 3 August 2024).
- Basso Los, F.G.; Ferreira Zielinski, A.A.; Wojeicchowski, J.P.; Nogueira, A.; Mottin Demiate, I. Beans (Phaseolus vulgaris L.): Whole seeds with complex chemical composition. Curr. Opin. Food Sci. 2018, 19, 63–71. [Google Scholar]
- Cappa, C.; James, D.; Kelly, J.D.; Nga, P.K.W. Seed characteristics and physicochemical properties of powders of 25 edible dry bean varieties. Food Chem. 2018, 253, 305–313. [Google Scholar] [CrossRef]
- de Barros, M.; Prudencio, S.H. Physical and chemical characteristics of common bean varieties. Ciências Agrárias Londrina 2016, 37, 751–762. [Google Scholar] [CrossRef]
- Nciri, N.; El Mhamdi, F.; Ben Ismail, H.B.; Ben Mansour, A.; Fennira, F. Physical properties of three white bean varieties (Phaseolus vulgaris L.) grown in Tunisia. J. Appl. Sci. Agric. 2014, 9, 195–200. [Google Scholar]
- Ercan, R.; Atli, A.; Köksel, H.; Dağ, A. Cooking quality and composition of dry beans grown in Turkey. GIDA 1994, 19, 313–316. [Google Scholar]
- Pedrosa, M.M.; Guillamón, E.; Arribas, C. Autoclaved and extruded legumes as a source of bioactive phytochemicals: A review. Foods 2021, 10, 379. [Google Scholar] [CrossRef] [PubMed]
- Sparvoli, F.; Bollini, R.; Cominelli, E. Nutritional value. In Grain Legumes; Ron, A.M.D., Ed.; Springer: New Work, NY, USA, 2015; pp. 291–326. [Google Scholar]
- Tafiire, H.; Njoki Wainaina, I.; Lugumira, R.; An, N.T.H.; Ogwok, P.; Grauwet, T.; Hendrickx, M.E. A detailed study on the cooking kinetics of fresh and hard to cook common beans (Phaseolus vulgaris L.): A case study on bean accessions of different market classes. J. Food Eng. 2024, 381, 112186. [Google Scholar] [CrossRef]
- Kyomugasho, C.; Wainaina, I.; Grauwet, T.; Van Loey, A.; Hendrickx, M.E. Bean softening during hydrothermal processing is greatly limited by pectin solubilization rather than protein denaturation or starch gelatinization. Food Res. Int. 2023, 165, 112471. [Google Scholar] [CrossRef]


| Parameter | Value | Unit |
|---|---|---|
| cpW | 4.186 | kJ kg−1 K−1 |
| cpHB | 2.977 | kJ kg−1 K−1 |
| mW0 | 3 | kg |
| mBD | 750 | g |
| xss | 0.88 | g g−1 |
| T0 | 20 | °C |
| Tb | 98 | °C |
| ηIG | 6.1 | % |
| FEEE | 410 | g CO2e kWh−1 |
| FETW | 0.309 | g CO2e m−3 |
| FES1 (NaHCO3) | 1.24 | kg CO2e kg−1 |
| FES2 (KHCO3) | 2.36 | kg CO2e kg−1 |
| FES3 (Na2CO3) | 0.441 | kg CO2e kg−1 |
| FES4 (K2CO3) | 3.13 | kg CO2e kg−1 |
| Chemico-Physical Property | GPB | DSGPB | MDSGPB | Unit |
|---|---|---|---|---|
| Raw protein | 22.7 ± 1.7 a | nd | 23.4 ± 2.1 a | g/100 g dm |
| Total starch | 33.81 ± 1.66 a | nd | 34.96 ± 0.19 a | g/100 g dm |
| Resistant starch | 23.59 ± 0.34 a | nd | 22.01 ± 1.82 a | g/100 g dm |
| Phytic acid | 1.15 ± 0.12 a | nd | 0.78 ± 0.13 a | g/100 g dm |
| Raffinose | 5.31 ± 0.28 a | nd | 1.95 ± 0.20 b | g/100 g dm |
| Seed weight (mS) | 0.161 ± 0.006 a | 0.142 ± 0.008 b | 0.133 ± 0.002 b | g/seed |
| Seed volume (VS) | 0.137 ± 0.006 a | 0.120 ± 0.010 a,b | 0.103 ± 0.000 b | cm3/seed |
| Mean seed radius (RS) | 0.319 ± 0.005 a | 0.306 ± 0.009 a | 0.290 ± 0.000 b | cm/seed |
| Seed density (ρS) | 1.175 ± 0.024 a | 1.181 ± 0.030 a | 1.096 ± 0.030 b | g/cm3 |
| Hydration capacity (HC) | 0.158 ± 0.007 a | 0.126 ± 0.008 b | 0.136 ± 0.006 b | g/seed |
| Swelling capacity (SC) | 0.320 ± 0.0102 a | 0.253 ± 0.012 b | 0.263 ± 0.006 b | cm3/seed |
| Bean Type | Salt | csi | H10 | KF | r2 |
|---|---|---|---|---|---|
| [g/L] | [N] | [min−1] | |||
| GPBs pre-soaked in water for 16 h | - | 0 | exp (6.92 ± 0.05) a | 0.028 ± 0.001 c | 0.996 |
| Unsoaked, decorticated, and split GPBs | - | 0 | exp (6.99 ± 0.15) a | 0.064 ± 0.005 a | 0.995 |
| Unsoaked, decorticated, split and malted GPBs | - | 0 | exp (6.79 ± 0.07) a | 0.044 ± 0.002 b | 0.998 |
| NaHCO3 | 1 | exp (6.82 ± 0.38) a | 0.056 ± 0.015 a,b | 0.870 | |
| NaHCO3 | 2 | exp (6.58 ± 0.06) b | 0.054 ± 0.003 b | 0.998 | |
| Na2CO3 | 1 | exp (6.58 ± 0.04) b | 0.050 ± 0.002 b | 0.999 | |
| Na2CO3 | 2 | exp (6.03 ± 0.26) c | 0.050 ± 0.017 b | 0.892 | |
| KHCO3 | 1 | exp (6.74 ± 0.24) a,b | 0.045 ± 0.009 b | 0.920 | |
| KHCO3 | 2 | exp (6.59 ± 0.21) b | 0.051 ± 0.010 b | 0.965 | |
| K2CO3 | 1 | exp (6.80 ± 0.14) a | 0.063 ± 0.007 a | 0.989 | |
| K2CO3 | 2 | exp (6.67 ± 0.10) b | 0.064 ± 0.005 a | 0.995 |
| Sample | Salt | cSi | tC | eS,eff | WPR | mWS | mWC | mSi | CFBC,EE | CFBC,TW | CFBC,Si | CFBC | eRi |
|---|---|---|---|---|---|---|---|---|---|---|---|---|---|
| [g/L] | [min] | [kWh/kg] | [L/kg] | [kg] | [kg] | [g] | [kg CO2e/kg] | [%] | |||||
| GPB | - | 0 | 55 | 0.92 | 4 | 4 | 4 | 0 | 0.559 | 0.0025 | 0 | 0.561 | 0 |
| DSGPB | - | 0 | 25 | 0.69 | 4 | - | 4 | 0 | 0.419 | 0.0012 | 0 | 0.420 | −25 |
| MDSGPB | - | 0 | 31.9 | 0.75 | 4 | - | 4 | 0 | 0.451 | 0.0012 | 0 | 0.452 | −19 |
| NaHCO3 | 1 | 25.3 | 0.70 | 4 | - | 4 | 4 | 0.421 | 0.0012 | 0.005 | 0.427 | −24 | |
| NaHCO3 | 2 | 20.9 | 0.66 | 4 | - | 4 | 8 | 0.400 | 0.0012 | 0.010 | 0.411 | −27 | |
| Na2CO3 | 1 | 23.8 | 0.68 | 4 | - | 4 | 4 | 0.414 | 0.0012 | 0.002 | 0.417 | −26 | |
| Na2CO3 | 2 | 12.9 | 0.60 | 4 | - | 4 | 8 | 0.363 | 0.0012 | 0.004 | 0.368 | −34 | |
| KHCO3 | 1 | 29.6 | 0.73 | 4 | - | 4 | 4 | 0.441 | 0.0012 | 0.009 | 0.451 | −20 | |
| KHCO3 | 2 | 23.7 | 0.68 | 4 | - | 4 | 8 | 0.413 | 0.0012 | 0.019 | 0.433 | −23 | |
| K2CO3 | 1 | 22.4 | 0.67 | 4 | - | 4 | 4 | 0.407 | 0.0012 | 0.013 | 0.421 | −25 | |
| K2CO3 | 2 | 19.9 | 0.65 | 4 | - | 4 | 8 | 0.395 | 0.0012 | 0.025 | 0.422 | −25 | |
Disclaimer/Publisher’s Note: The statements, opinions and data contained in all publications are solely those of the individual author(s) and contributor(s) and not of MDPI and/or the editor(s). MDPI and/or the editor(s) disclaim responsibility for any injury to people or property resulting from any ideas, methods, instructions or products referred to in the content. |
© 2024 by the authors. Licensee MDPI, Basel, Switzerland. This article is an open access article distributed under the terms and conditions of the Creative Commons Attribution (CC BY) license (https://creativecommons.org/licenses/by/4.0/).
Share and Cite
Cimini, A.; Morgante, L.; Moresi, M. Analyzing Cooking Efficiency of Gradoli Purgatory Beans: Effects of Dehulling, Malting, and Monovalent Carbonates. Foods 2024, 13, 2505. https://doi.org/10.3390/foods13162505
Cimini A, Morgante L, Moresi M. Analyzing Cooking Efficiency of Gradoli Purgatory Beans: Effects of Dehulling, Malting, and Monovalent Carbonates. Foods. 2024; 13(16):2505. https://doi.org/10.3390/foods13162505
Chicago/Turabian StyleCimini, Alessio, Lorenzo Morgante, and Mauro Moresi. 2024. "Analyzing Cooking Efficiency of Gradoli Purgatory Beans: Effects of Dehulling, Malting, and Monovalent Carbonates" Foods 13, no. 16: 2505. https://doi.org/10.3390/foods13162505
APA StyleCimini, A., Morgante, L., & Moresi, M. (2024). Analyzing Cooking Efficiency of Gradoli Purgatory Beans: Effects of Dehulling, Malting, and Monovalent Carbonates. Foods, 13(16), 2505. https://doi.org/10.3390/foods13162505