
Research on Using K-Means Clustering to Explore High-Risk Products with Ethylene Oxide Residues and Their Manufacturers in Taiwan

Abstract
:1. Introduction
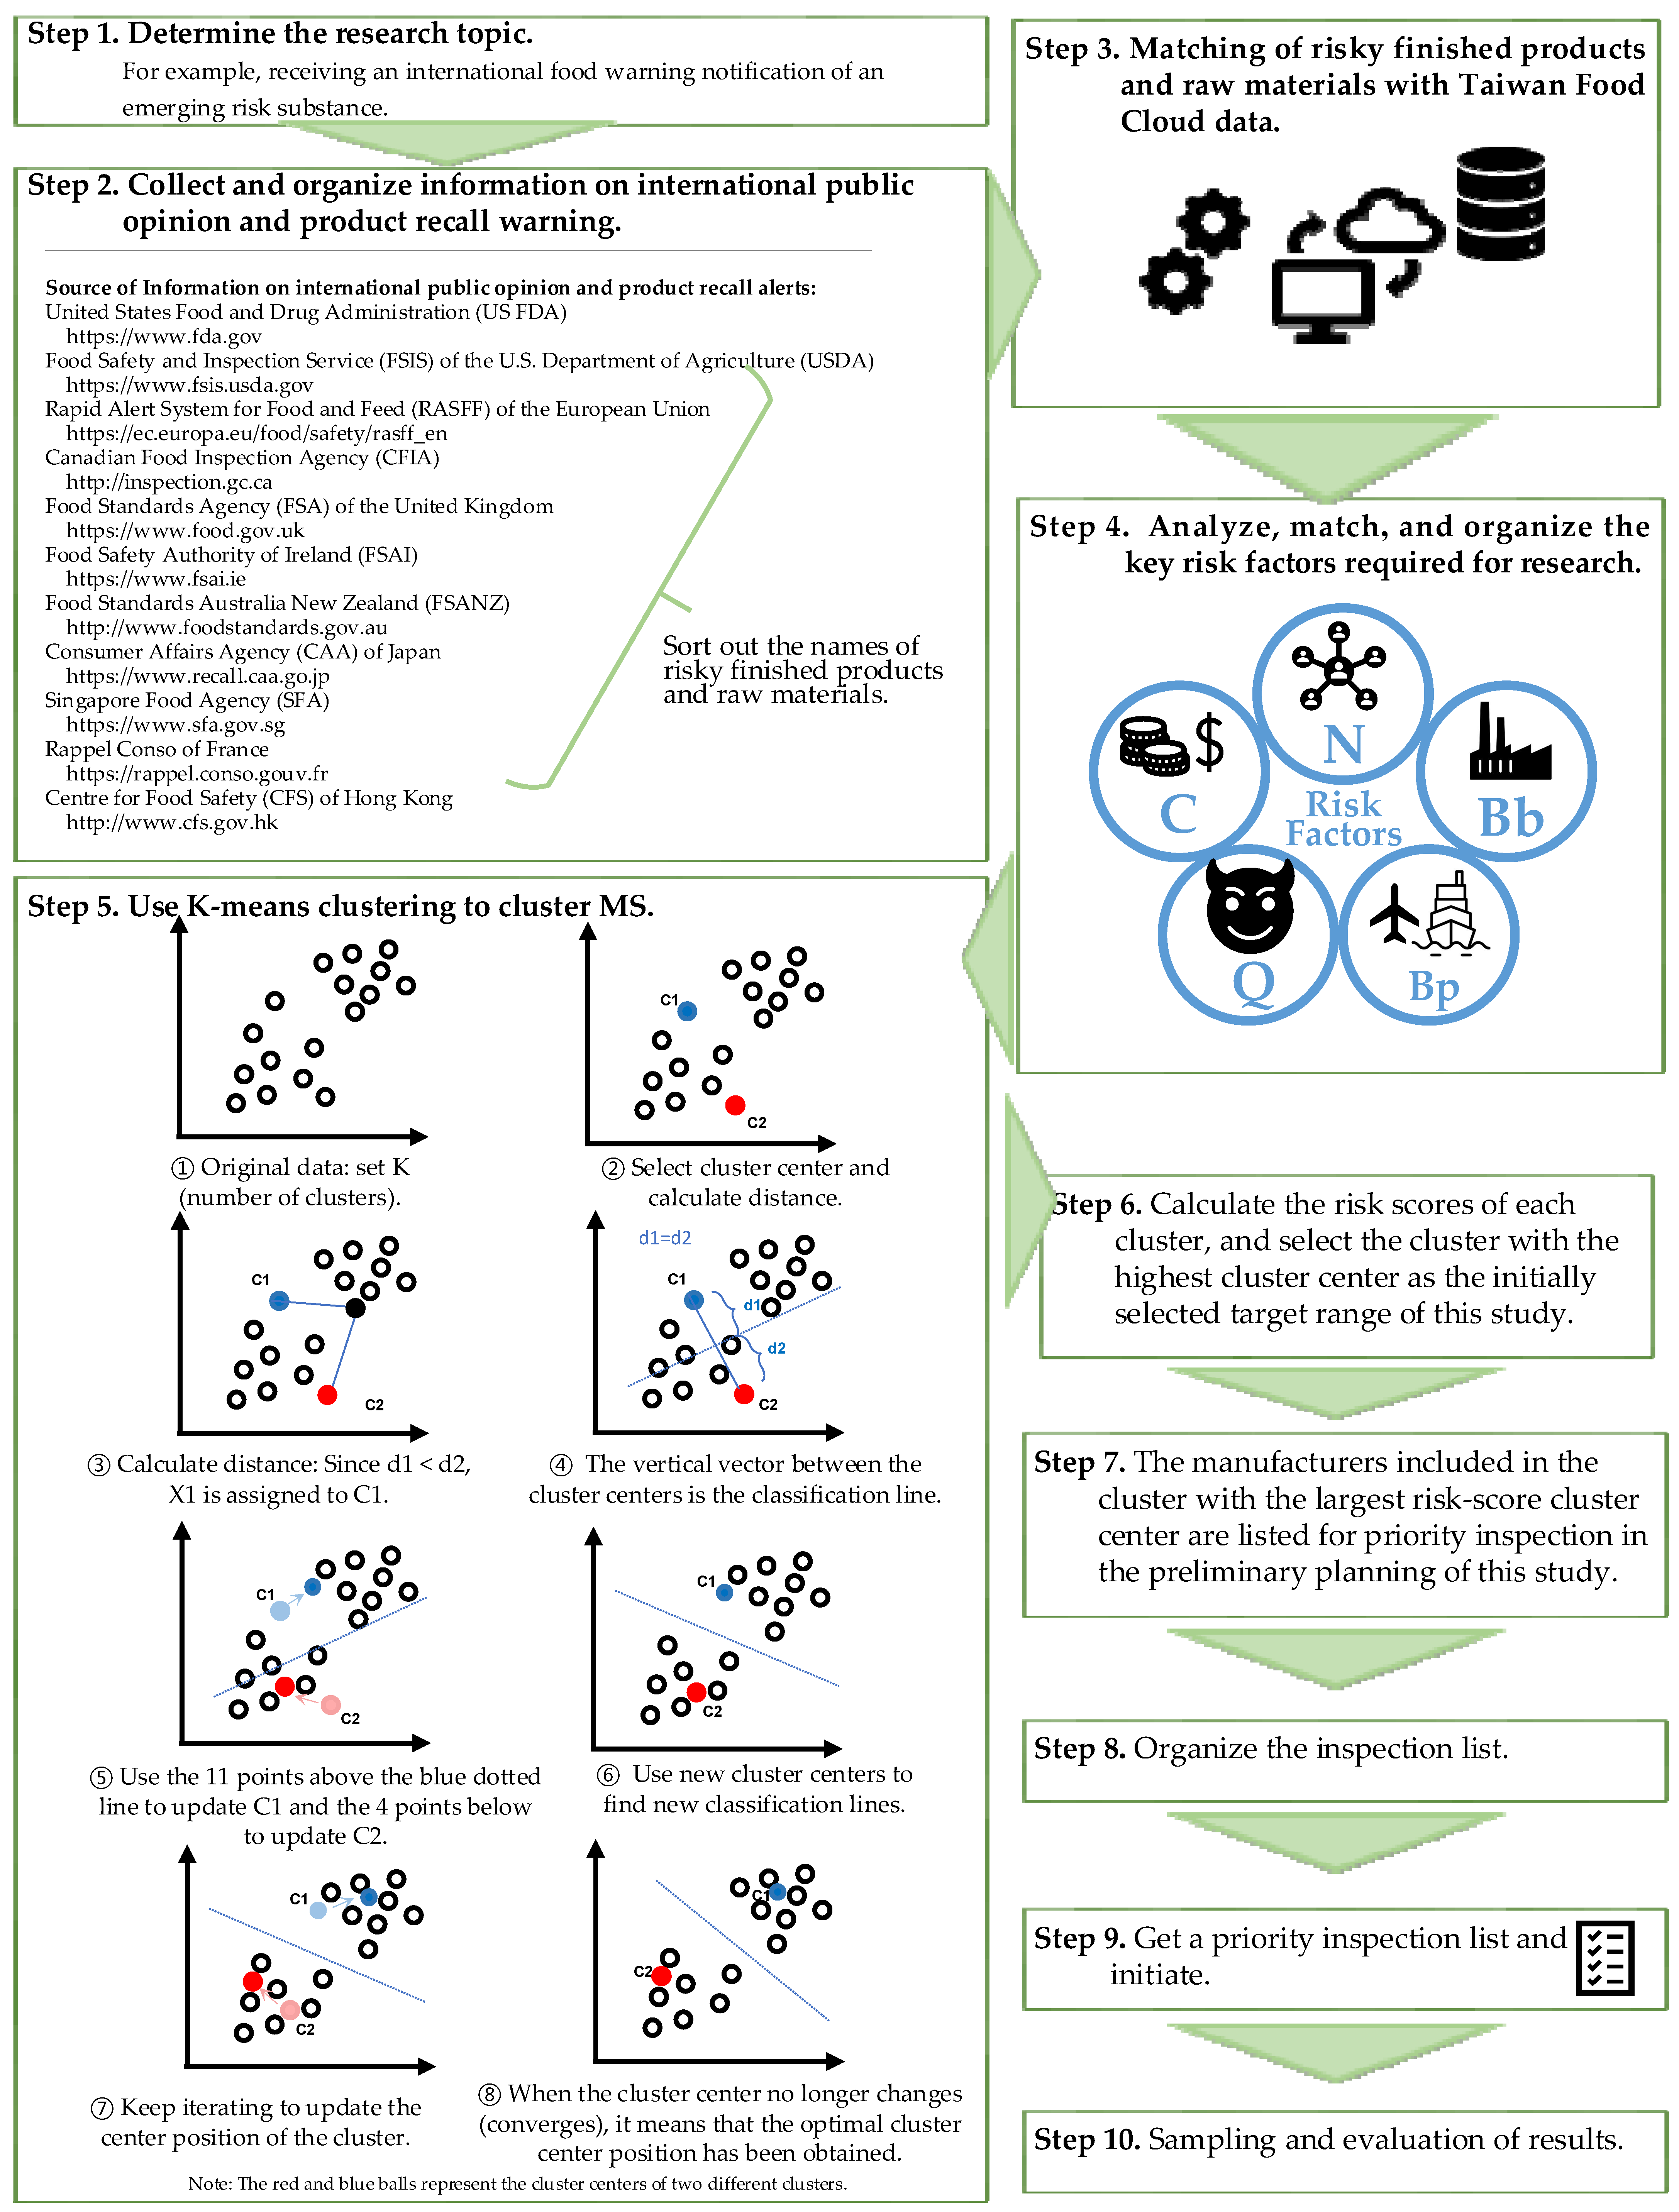
2. Materials and Methods
2.1. Choice of Analytical Method for Sampling
2.2. The Principle of K-Means Clustering
- Initially, K cluster centers are set randomly
- The distance between each sample and each cluster center is calculated, with (t) being the t-th operation. Then, each sample is assigned to the cluster with the shortest distance.
- CC is updated (nc data are in cluster c)
- Steps 2–3 are repeated until the CC does not change—that is,
2.3. Data Sources and Analytical Tools
2.4. Selection of Key Risk Factors
2.5. Research Methodology
- MS was used to match the RPFBS data in the food cloud database to obtain key risk factor 1—the Capital Amount (C) of MS. The reason this study used the C-factor is related to the manufacturer’s production volume, product circulation scope, and market share. These products are easily accessible to consumers and, therefore, closely related to food safety.
- MS was used to match the RPFBS data in the food cloud database to obtain the key risk factor 2—the number of occupations (N) of MS. There are five categories of N factor: import industry, manufacturing industry, logistics industry, catering industry, and sales industry. More occupations mean that products can reach consumers through more extensive circulation channels or scopes. It is closely related to food safety.
- MS was used to match the IFIS data in the food cloud database to obtain the key risk factor 3—“list of suppliers whose unqualified finished products or raw materials with EtO residues were detected during border inspection (referred to as Bb)”.
- Calculate the number of finished products and raw materials that may have EtO residues to determine key risk factor 4—“quantity of finished products or raw materials that may involve EtO risk (referred to as Q)”.
- MS was used to match the PMDS data in the food cloud database to obtain key risk factor 5—“Manufacturers whose finished products or raw materials with residues have been detected in Taiwan’s market (the factor is referred to as Bp)”.
3. Results
3.1. High-Risk Manufacturers Obtained after Clustering
3.2. The Risk-Ranked List of Manufacturers Obtained by Euclidean Distance
3.3. Verification of the Results
4. Discussion
4.1. Retaining the Border Anti-Blocking Policy
4.2. Use of K-Means Clustering to Select High-Risk Samples Can Reduce the Cost of Traditional Sampling
4.3. Inspection May Be Planned for the Uninspected Manufacturers of Cluster 4
4.4. Other Algorithms May Be Used in the Future to Evaluate and Compare the Different Methods
4.5. Research Limitations
5. Conclusions
- The use of international food safety alerts to strengthen border control can effectively ensure domestic food safety.
- The use of K-means clustering to construct a risk analysis model that would verify the results of purposive sampling to ensure the safety of the product after it is launched could serve as a reference for food control agencies when planning similar projects.
Author Contributions
Funding
Institutional Review Board Statement
Informed Consent Statement
Data Availability Statement
Acknowledgments
Conflicts of Interest
Appendix A

| Name of Category | Sample Name | Country of Origin | Number of Samples | Is EtO Detected? (Number of Unqualified Samples) |
|---|---|---|---|---|
| Baked goods | Potato chips, square puff pastry | Taiwan | 2 | No (0) |
| Cocoa | Black cocoa mass | Taiwan | 1 | No (0) |
| Coffee beans | Coffee beans | Taiwan | 2 | No (0) |
| Edible oils and fats | Sesame oil, fragrant pig oil, blended oil, white sesame oil, black sesame oil, sesame oil, peanut oil, shortening, camellia oil | Taiwan, Thailand, South Korea | 58 | No (0) |
| Flour and its products | Corn starch, Camel brand purple camel all-purpose flour, Danish pineapple croissant, white bread | China, Taiwan | 4 | No (0) |
| Food additives | Guar gum, locust bean gum, H-Sodium carboxymethyl cellulose, H-Stevia leaf 094, Xanthan gum | Pakistan, Spain, China, Taiwan, France | 9 | No (0) |
| Fruits | Kyoho grapes | Taiwan | 7 | No (0) |
| Ice cream and related products | Ice cream, smoothies, popsicles | Taiwan, Japan, France, Australia, South Korea, Latvia, United States | 81 | No (0) |
| Instant noodles (noodles, oil packets, or seasoning powder packets) | Beef noodle soup, dried noodles, nabe yaki egg noodles, bak kut teh flavor instant noodles, chicken instant vermicelli, spicy stinky tofu noodles, instant chow mein, laksa, rice noodles, mung bean thread, soba noodles | Taiwan, Vietnam, Malaysia, Japan, South Korea, Singapore, Indonesia, Thailand, China | 163 | Yes (2) |
| Milk and its products | Italian provolone cheese slices, pimento cheese, cheese powder, grated mozzarella cheese, mixed cheese, yogurt, diluted active fermented milk, skim milk powder | United States, Malaysia, Taiwan, New Zealand | 14 | Yes (2) |
| Nut | Unsalted cashews | Vietnam | 1 | No (0) |
| Sauces | Tomato sauce and vegetarian tomato sauce | Taiwan | 4 | No (0) |
| Sesame and its products | Black sesame, sesame powder, white sesame, black sesame paste and sauce, red sesame | Sri Lanka, Myanmar, India, Taiwan, Thailand, Paraguay, Togo, Bolivia | 48 | Yes (1) |
| Spices and products | Black peppercorns, turmeric powder, chili powder, white pepper powder, black pepper powder, dried chili peppers, curry powder, green curry sauce, chili sauce, medium-spicy instant curry cubes, star anise, herb roast chicken powder, rosemary powder, steak spices, chicken seasoning, mixed spice seasoning powder, pepper and salt powder, red pepper powder, spicy soup powder, vanilla flavored seasoning powder (collagen), vanilla powder, New Orleans flavored seasoning | South Africa, India, South Korea, Indonesia, China, Vietnam, Taiwan, Thailand, Japan, Malaysia, Morocco, United States, Spain | 61 | Yes (4) |
| Whole grains | Mung beans, red beans, soybeans, quinoa, millet, white rice, barley, oatmeal, black beans, peanuts | Taiwan, China, Argentina, Thailand, Australia, Peru | 34 | No (0) |
| Total | 489 | Yes (9) |
| Abbreviated Name | Full Name |
|---|---|
| CC | Cluster Center |
| CFIA | Canadian Food Inspection Agency |
| ED | Euclidean Distance |
| EL V2 | Second-generation ensemble learning prediction model |
| EtO | Ethylene Oxide |
| FDA | Food and Drug Administration |
| FSA | Food Standards Agency |
| FSANZ | Food Standards Australia New Zealand |
| FSIS | Food Safety and Inspection Service |
| FTMS | Food Traceability Management System |
| HCG | Highest Cluster Center |
| IARC | International Agency for Research on Cancer |
| IFIS | Import Food Information System |
| IMS | Inspection Management System |
| OSHA | Occupational Safety and Health Administration |
| PMDS | Product Management Decision System |
| RASFF | Rapid Alert System for Food and Feed |
| RFPRM | Risky Finished Products or Raw Materials with EtO |
| RPFBS | Registration Platform of Food Businesses System |
| SFA | Singapore Food Agency |
| SSE | Sum of squared errors |
| TFC | Taiwan Food Cloud |
References
- European Union Directorate-General for Health and Food Safety. Ethylene Oxide Incident/Food Additive. Available online: https://food.ec.europa.eu/safety/acn/acn-incidents/ethylene-oxide-incident-food-additive_en (accessed on 22 January 2024).
- Japan Food Chemical Research Foundation. The Japanese Positive List System for Agricultural Chemical Residues in Foods. 2006. Available online: https://www.ffcr.or.jp/en/zanryu/the-japanese-positive/the-japanese-positive-list-system-for-agricultural-chemical-residues-in-foods-enforcement-on-may-29-.html#:~:text=The%20maximum%EE%80%80%20residue (accessed on 10 May 2024).
- Ministry of Food and Drug Safety. Pesticides and Veterinary Drugs Information. 2015. Available online: http://www.foodsafetykorea.go.kr/residue/prd/mrls/list.do?currentPageNo=4&searchCode=&searchFoodCode=&menuKey=1&subMenuKey=161&subChildMenuKey=&searchConsonantFlag=en&searchConsonantFlag2=en&searchValue2=E&searchFlag=prd&searchClassLCode=&searchClassMCode=&searchClassScode=&searchValue=E (accessed on 10 May 2024).
- Government of Canada. Maximum Residue Limits Search. 2020. Available online: https://pest-control.canada.ca/pesticide-registry/en/mrl-search.html (accessed on 10 May 2024).
- Ministry of Health and Welfare. Standards for Specification, Scope, Application and Limitation of Food Additives. 2023. Available online: http://consumer.fda.gov.tw/Law/FoodAdditivesList.aspx?nodeID=521&rand=342050149 (accessed on 10 May 2024).
- Healy, K.; Ducheyne, P.; Hutmacher, D.W.; Grainger, D.W.; Kirkpatrick, C.J. Comprehensive Biomaterials II, 2nd ed.; Elsevier: Amsterdam, The Netherlands, 2017. [Google Scholar]
- International Agency for Research on Cancer. Ethylene Oxide. Chem. Agents Relat. Occup. 2012, 100F, 379–400. [Google Scholar]
- NTP (National Toxicology Program), 2021; Report on Carcinogens, Fifteenth Edition. Research Triangle Park, NC: U.S. Department of Health and Human Services, Public Health Service. Available online: https://ntp.niehs.nih.gov/go/roc15 (accessed on 15 June 2024).
- U.S. Department of Labor Occupational Safety and Health Administration. 2002; Ethylene Oxide Fact Sheet. Available online: https://www.osha.gov/sites/default/files/publications/ethylene-oxide-factsheet.pdf (accessed on 10 May 2023).
- Food and Drug Administration, Ministry of Health and Welfare of Taiwan. Surveillance of Ethylene Oxide Residues in Imported and Post-Market Food Products. Annu. Rep. Food Drug Res. 2023, 14, 90–96. Available online: http://www.fda.gov.tw/TC/PublishResearch.aspx?pn=2 (accessed on 20 May 2023).
- Taiwan Food and Drug Administration Annual Report. 2023, 2, 33–35. Available online: http://www.fda.gov.tw/upload/ebook/AnnuaReport/2023/2023_E/index.html (accessed on 10 May 2023).
- Powell, M.R. Optimal food safety sampling under a budget constraint. Risk Anal. 2014, 34, 93–100. [Google Scholar] [CrossRef] [PubMed]
- Wang, Z.; Van Der Fels-Klerx, H.J.; Lansink, A.G.J.M.O. Optimization of sampling for monitoring chemicals in the food supply chain using a risk-based approach: The case of aflatoxins and dioxins in the dutch dairy chain. Risk Anal. 2020, 40, 2539–2560. [Google Scholar] [CrossRef] [PubMed]
- Zahra, S.; Ghazanfar, M.A.; Khalid, A.; Azam, M.A.; Naeem, U.; Prugel-Bennett, A. Novel centroid selection approaches for KMeans-clustering based recommender systems. Inf. Sci. 2015, 320, 156–189. [Google Scholar] [CrossRef]
- Harish, A.S.; Malathy, C. Customer segment prediction on retail transactional data using K-means and Markov model. Intell. Autom. Soft Comput. 2023, 36, 589–600. [Google Scholar] [CrossRef]
- Sarkar, P.; Roy, B.; Gupta, M.; De, S. Melanoma cell detection by using kmeans clustering segmentation and abnormal cell detection technique. In Artificial Intelligence on Medical Data. Lecture Notes in Computational Vision and Biomechanics; Gupta, M., Ghatak, S., Gupta, A., Mukherjee, A.L., Eds.; Springer: Singapore, 2023; Volume 37, pp. 193–202. [Google Scholar] [CrossRef]
- Wickramasinghe, A.; Muthukumarana, S.; Loewen, D.; Schaubroeck, M. Temperature clusters in commercial buildings using k-means and time series clustering. Energy Inform. 2022, 5, 1. [Google Scholar] [CrossRef] [PubMed]
- Mohsen, A.; Kovács, F.; Mezősi, G.; Kiss, T. Sediment transport dynamism in the confluence area of two rivers transporting mainly suspended sediment based on sentinel-2 satellite images. Water 2021, 13, 3132. [Google Scholar] [CrossRef]
- Miolla, R.; Palmisano, G.O.; Roma, R.; Caponio, F.; Difonzo, G.; De Boni, A. Functional foods acceptability: A consumers’ survey on bread enriched with oenological by-products. Foods 2023, 12, 2014. [Google Scholar] [CrossRef] [PubMed]
- Liu, Y.; Zhang, Q.; Dong, W.; Li, Z.; Liu, T.; Wei, W.; Zuo, M. Autoformer-based model for predicting and assessing wheat quality changes of pesticide residues during storage. Foods 2023, 12, 1833. [Google Scholar] [CrossRef]
- Ferreira-Paiva, L.; Locatel Suela, A.G.; Alfaro-Espinoza, E.R.; Cardona-Casas, N.A.; Valente, D.S.M.; Neves, R.V.A. A k-means-based-approach to analyze the emissions of GHG in the municipalities of MATOPIBA region, Brazil. IEEE Lat. Am. Trans. 2022, 20, 2339–2345. [Google Scholar] [CrossRef]
- Han, J.; Kamber, M. Data Mining: Concepts and Techniques; Morgan Kaufmann: San Francisco, CA, USA, 2001. [Google Scholar]
- Blazejczyk, K.; Epstein, Y.; Jendritzky, G.; Staiger, H.; Tinz, B. Comparison of UTCI to selected thermal indices. Int. J. Biometeorol. 2012, 56, 515–535. [Google Scholar] [CrossRef] [PubMed]
- Karimi, L.; Joshi, J. An Unsupervised Learning Based Approach for Mining Attribute Based Access Control Policies. In Proceedings of the 2018 IEEE International Conference on Big Data, Seattle, WA, USA, 10–13 December 2018; pp. 1427–1436. [Google Scholar] [CrossRef]
- Thorndike, R.L. Who belongs in the family? Psychometrika 1953, 18, 267–276. [Google Scholar] [CrossRef]
- Bholowalia, P.; Kumar, A. EBK-Means: A clustering technique based on elbow method and K-means in WSN. Int. J. Comput. Appl. 2014, 105, 17–24. [Google Scholar] [CrossRef]
- Shi, C.; Wei, B.; Wei, S.; Wang, W.; Liu, H.; Liu, J. A quantitative discriminant method of elbow point for the optimal number of clusters in clustering algorithm. Eurasip. J. Wirel. Commun. Netw. 2021, 31. [Google Scholar] [CrossRef]
- Food Safety Information Network. Available online: https://www.ey.gov.tw/ofs/A236031D34F78DCF (accessed on 22 July 2022).
- Shibing Zhou, S.; Xu, Z.; Liu, F. Method for determining the optimal number of clusters based on agglomerative hierarchical clustering. IEEE Trans. Neural Netw. Learn. Syst. 2017, 28, 3007–3017. [Google Scholar] [CrossRef] [PubMed]
- Díaz, J.J.V.; Pozo, R.F.; González, A.B.R.; Wilby, M.R.; Ávila, C.S. Hierarchical agglomerative clustering of bicycle sharing stations based on ultra-light edge computing. Sensors 2020, 20, 3550. [Google Scholar] [CrossRef] [PubMed]
- Kawa, N.; Cucchi, K.; Rubin, Y.; Attinger, S.; Heße, F. Defining hydrogeological site similarity with hierarchical agglomerative clustering. Ground Water 2023, 61, 563–573. [Google Scholar] [CrossRef] [PubMed]
- Valenti, M.; Ferrigno, G.; Martina, D.; Yu, W.; Zheng, G.; Shandiz, M.A.; Anglin, C.; Momi, E.D. Gaussian mixture models based 2D-3D registration of bone shapes for orthopedic surgery planning. Med. Biol. Eng. Comput. 2016, 54, 1727–1740. [Google Scholar] [CrossRef] [PubMed]
- McNicholas, P.D.; Murphy, T.B. Model-based clustering of microarray expression data via latent Gaussian mixture models. Bioinformatics 2010, 26, 26–2705. [Google Scholar] [CrossRef] [PubMed]

| No. | Name of Category | Sample Name | Origin | EtO Value (mg/kg) |
|---|---|---|---|---|
| 1 | Sesame raw materials | Black sesame (Premium product) | India | 1.340 |
| 2 | Spicy seasoning | Ban Cabe Chili Powder—extra spicy level 30 | India | 14.610 |
| 3 | McCormick Garlic Mixed Spice Seasoning Powder | USA | 0.100 | |
| 4 | BonCabe Seasoned Chili Powder—medium spicy level 10 | Indonesia | 39.340 | |
| 5 | Xianguo brand Indian curry powder | Nine countries * | 16.497 | |
| 6 | Cottage cheese | Formaggio Fresh Mozzarella | USA | 1.407 |
| 7 | Sonoma Sincerely Brigitte Variety Cheese | USA | 0.200 | |
| 8 | Instant noodles (noodles, oil packets, or powder packets) | Penang Ah Lai White Curry Noodle—noodle/sauce packets | Malaysia | 0.065/0.084 |
| 9 | Indomie Instant Noodles Rasa Ayam Special (Special Chicken Flavor)—seasoning powder packet | Indonesia | 0.187 |
| Data Source | Supplementary Note |
|---|---|
| Registration Platform of Food Business System (RPFBS) | According to Article 8 of the Taiwan Food Safety and Sanitation Management Act, food businesses whose category and scale have been announced need to register with RPFBS to operate. The system records the basic information of food companies in different industries, such as the product category and name with the largest turnover, business category, etc. |
| Food Traceability Management System (FTMS) | According to Article 9 of the Taiwan Food Safety and Hygiene Management Law, food businesses whose categories and scales have been announced must electronically declare and establish the source and flow of raw materials, semi-finished products, and finished products. Once a food safety incident occurs, the food industry and health authorities can quickly deal with the problematic products. This study used the raw materials and finished products declared by FTMS to connect risky raw materials and the finished products that may be related to international public opinion to obtain a list of operators that may have EtO risks. |
| Inspection Management System (IMS) | The database of this system integrates product test data from central health authorities and local government health bureaus. |
| Product Management Decision System (PMDS) | The database of this system is the integrated data established by the central health authority and the local government health bureau after the inspection and testing of food in the post-market stage. The content of the information includes the name of the product, the sampling site, the country of origin, and the inspection and test results. |
| Import Food Information System (IFIS) | TFDA established this system for the inspection of imported food in 2011. The database content of the system includes imported food inspection information, such as product name, country of origin, net weight, inspection method, and test results. |
| Serial Number | Finished Products or Raw Materials with EtO Residues | Submitted Number of Notifications | Total Number of Notifications | |
|---|---|---|---|---|
| 1 | Sesame and its products | Sesame | 461 | 470 |
| 2 | Sesame paste | 5 | ||
| 3 | Sesame oil | 4 | ||
| 4 | Locust bean gum | 57 | 57 | |
| 5 | Xanthan gum | 21 | 21 | |
| 6 | Guar gum | 12 | 12 | |
| 7 | Baked goods or ingredients | Bread | 13 | 21 |
| 8 | Pastry | 3 | ||
| 9 | Biscuit | 2 | ||
| 10 | Baking powder | 1 | ||
| 11 | Other baked cooking and steaming foods | 2 | ||
| 12 | Ice cream | 21 | 21 | |
| 13 | Instant noodles | 31 | 31 | |
| 14 | Vanilla | 20 | 20 | |
| 15 | Ginger (powder) | 13 | 13 | |
| 16 | Turmeric | 13 | 13 | |
| 17 | Curry products | Curry powder | 5 | 10 |
| 18 | Curry | 4 | ||
| 19 | Curry paste | 1 | ||
| 20 | Chili | 9 | 9 | |
| 21 | Black pepper | 9 | 9 | |
| 22 | Psyllium | 7 | 7 | |
| 23 | Cinnamon | 5 | 5 | |
| 24 | Fenugreek | 4 | 4 | |
| 25 | Dairy and its products | Milk powder | 2 | 5 |
| 26 | Cheese | 1 | ||
| 27 | Fermented milk | 1 | ||
| 28 | Cream | 1 | ||
| 29 | Noodle products and their raw materials | Noodle | 2 | 4 |
| 30 | Flour | 2 | ||
| 31 | Capsule | 4 | 4 | |
| 32 | Calcium carbonate | 7 | 7 | |
| 33 | Sodium carboxymethyl cellulose | 2 | 2 | |
| 34 | Barbecue products | Barbecue powder | 1 | 3 |
| 35 | Barbecue sauce | 2 | ||
| 36 | Ketchup | 2 | 2 | |
| 37 | Ashwagandha | 4 | 4 | |
| 38 | Okra | 4 | 4 | |
| 39 | Amaranth | 3 | 3 | |
| 40 | Onion | 3 | 3 | |
| 41 | Dehydrated vegetables | 5 | 5 | |
| 42 | Moringa | 5 | 5 | |
| 43 | Chia seeds | 2 | 2 | |
| 44 | Chickpeas | 2 | 2 | |
| 45 | Barley grass | 2 | 2 | |
| 46 | Kidney bean | 2 | 2 | |
| 47 | Shallot | 2 | 2 | |
| 48 | Gotu Kola | 2 | 2 | |
| 49 | Curry leaves | 2 | 2 | |
| 50 | Bacopa monnieri | 2 | 2 | |
| 51 | Coriander seeds (Caraway seeds) | 2 | 2 | |
| 52 | Carob powder (Chocolate substitute) | 2 | 2 | |
| 53 | Coconut products | Coconut milk | 1 | 2 |
| 54 | Coconut juice | 1 | ||
| 55–90 | Carotene, Chocolate, Coffee beans, Buckwheat, Oat, Rosemary, Stevia leaves, Barley grass powder, Basil, Cardamom, Celery, Clove, Coleus forskohlii, Cranberry, Cumin seeds, Flaxseed, Ginseng, Gluten, Green beans, Hawthorn, Indian fennel, Lemon, Lemon Leaf, Lentils, Meat, Meatballs, Melatonin, Mustard seed, Nutmeg, Quinoa, Spirulina Powder, Sunflower seeds, Tangerine, Tea, Vitamin B12, Wheatgrass powder | One case of each item | ||
| Fraction | Risk Factors from Manufacturers | Risk Factors from Finished Food Products or Raw Materials | |||
|---|---|---|---|---|---|
| C | N | Bp | Q | Bb | |
| 10 | More than 100 million | 5 | 10 | 69–11695 | 10 |
| 8 | 30 million to 100 million | 4 | 20–68 | ||
| 6 | 200,000 to 30 million | 3 | 7–19 | ||
| 4 | 1–200,000 | 2 | 3–6 | ||
| 2 | 0 or null | 1 | 1–2 | ||
| 1 | 1 | 1 | |||
| 0 | - | - | - | ||
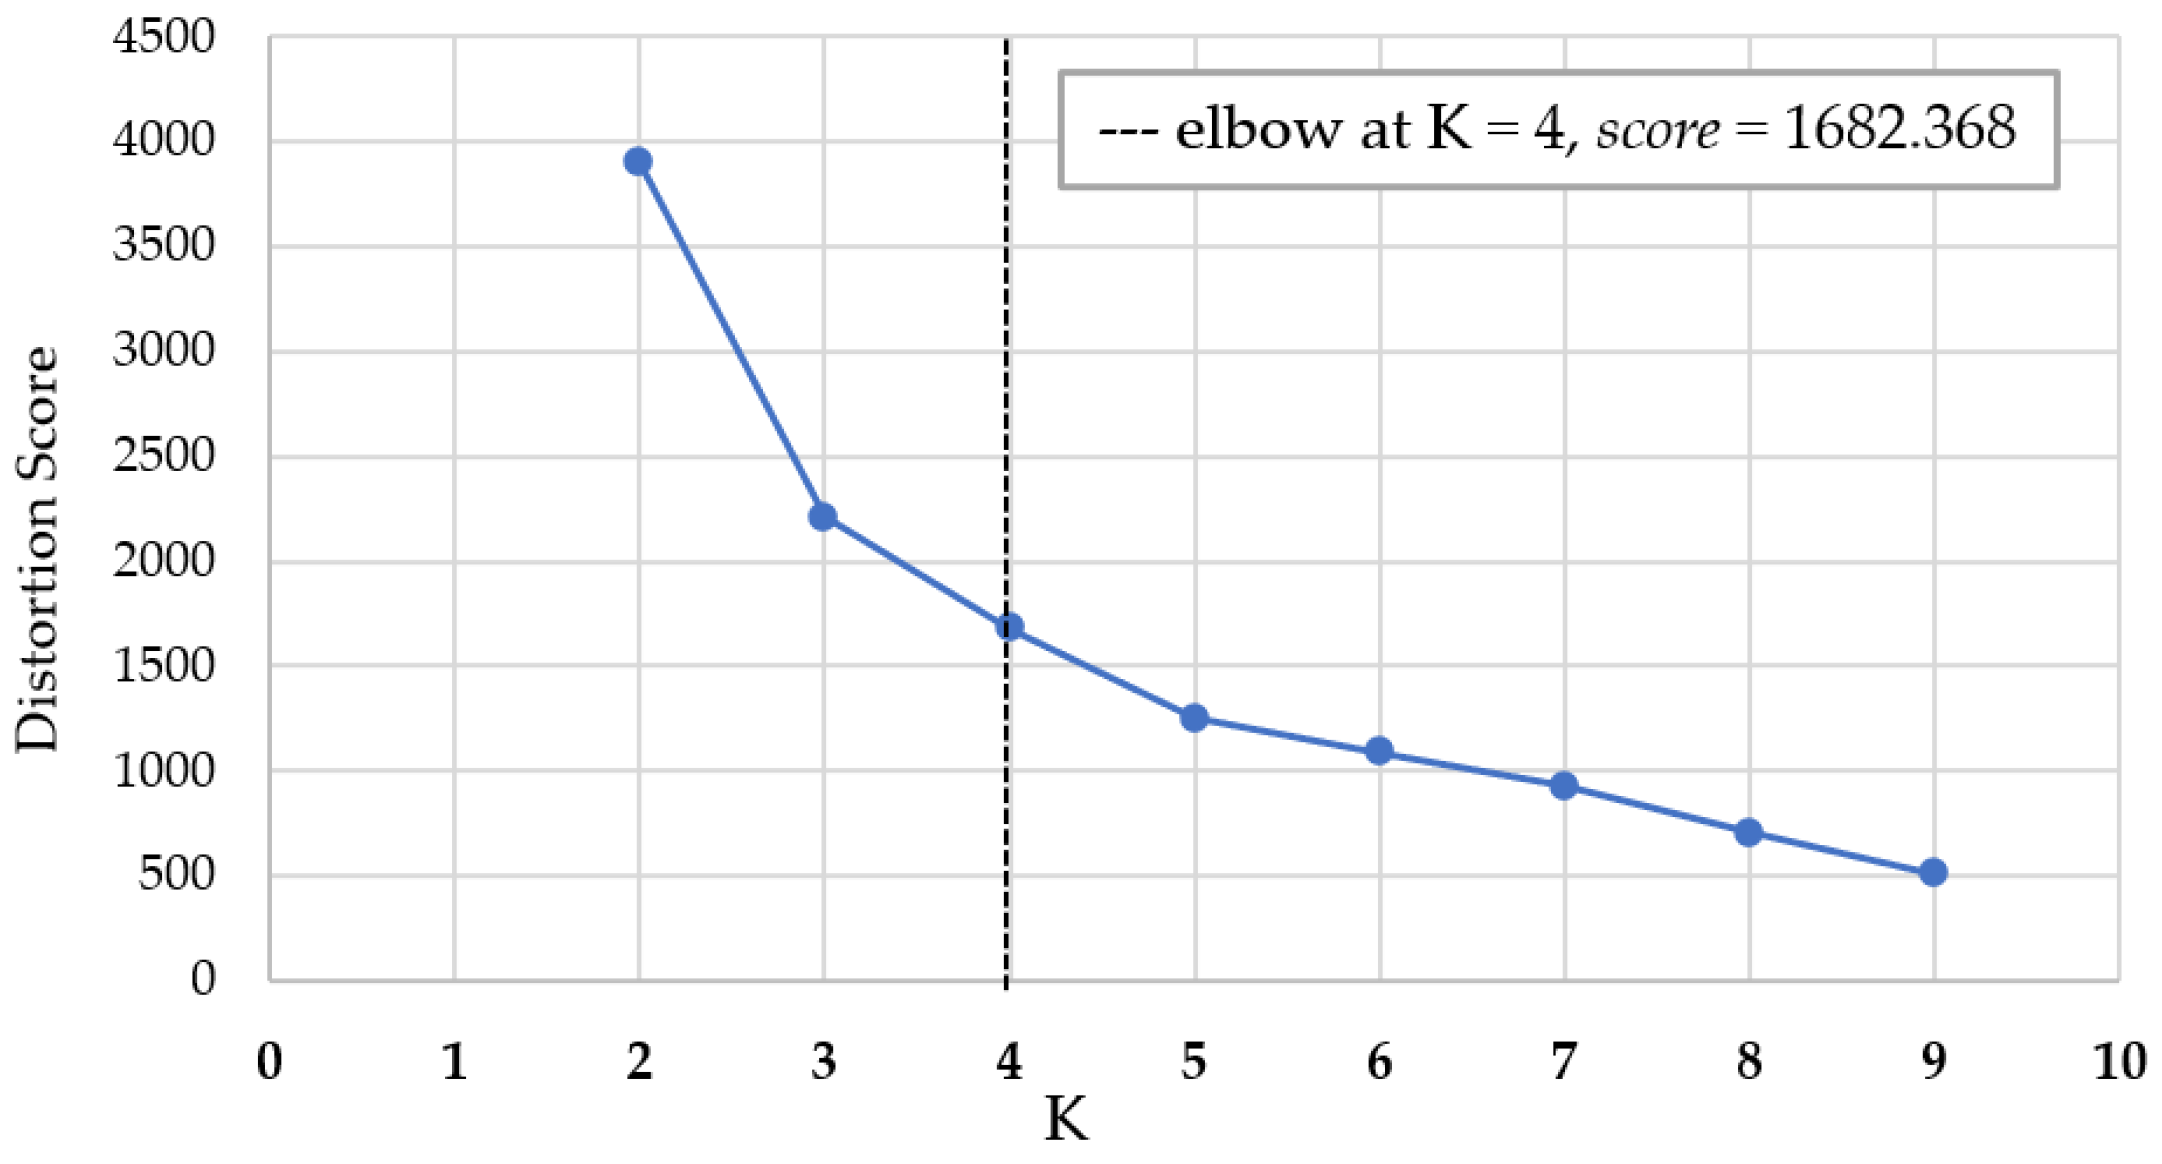
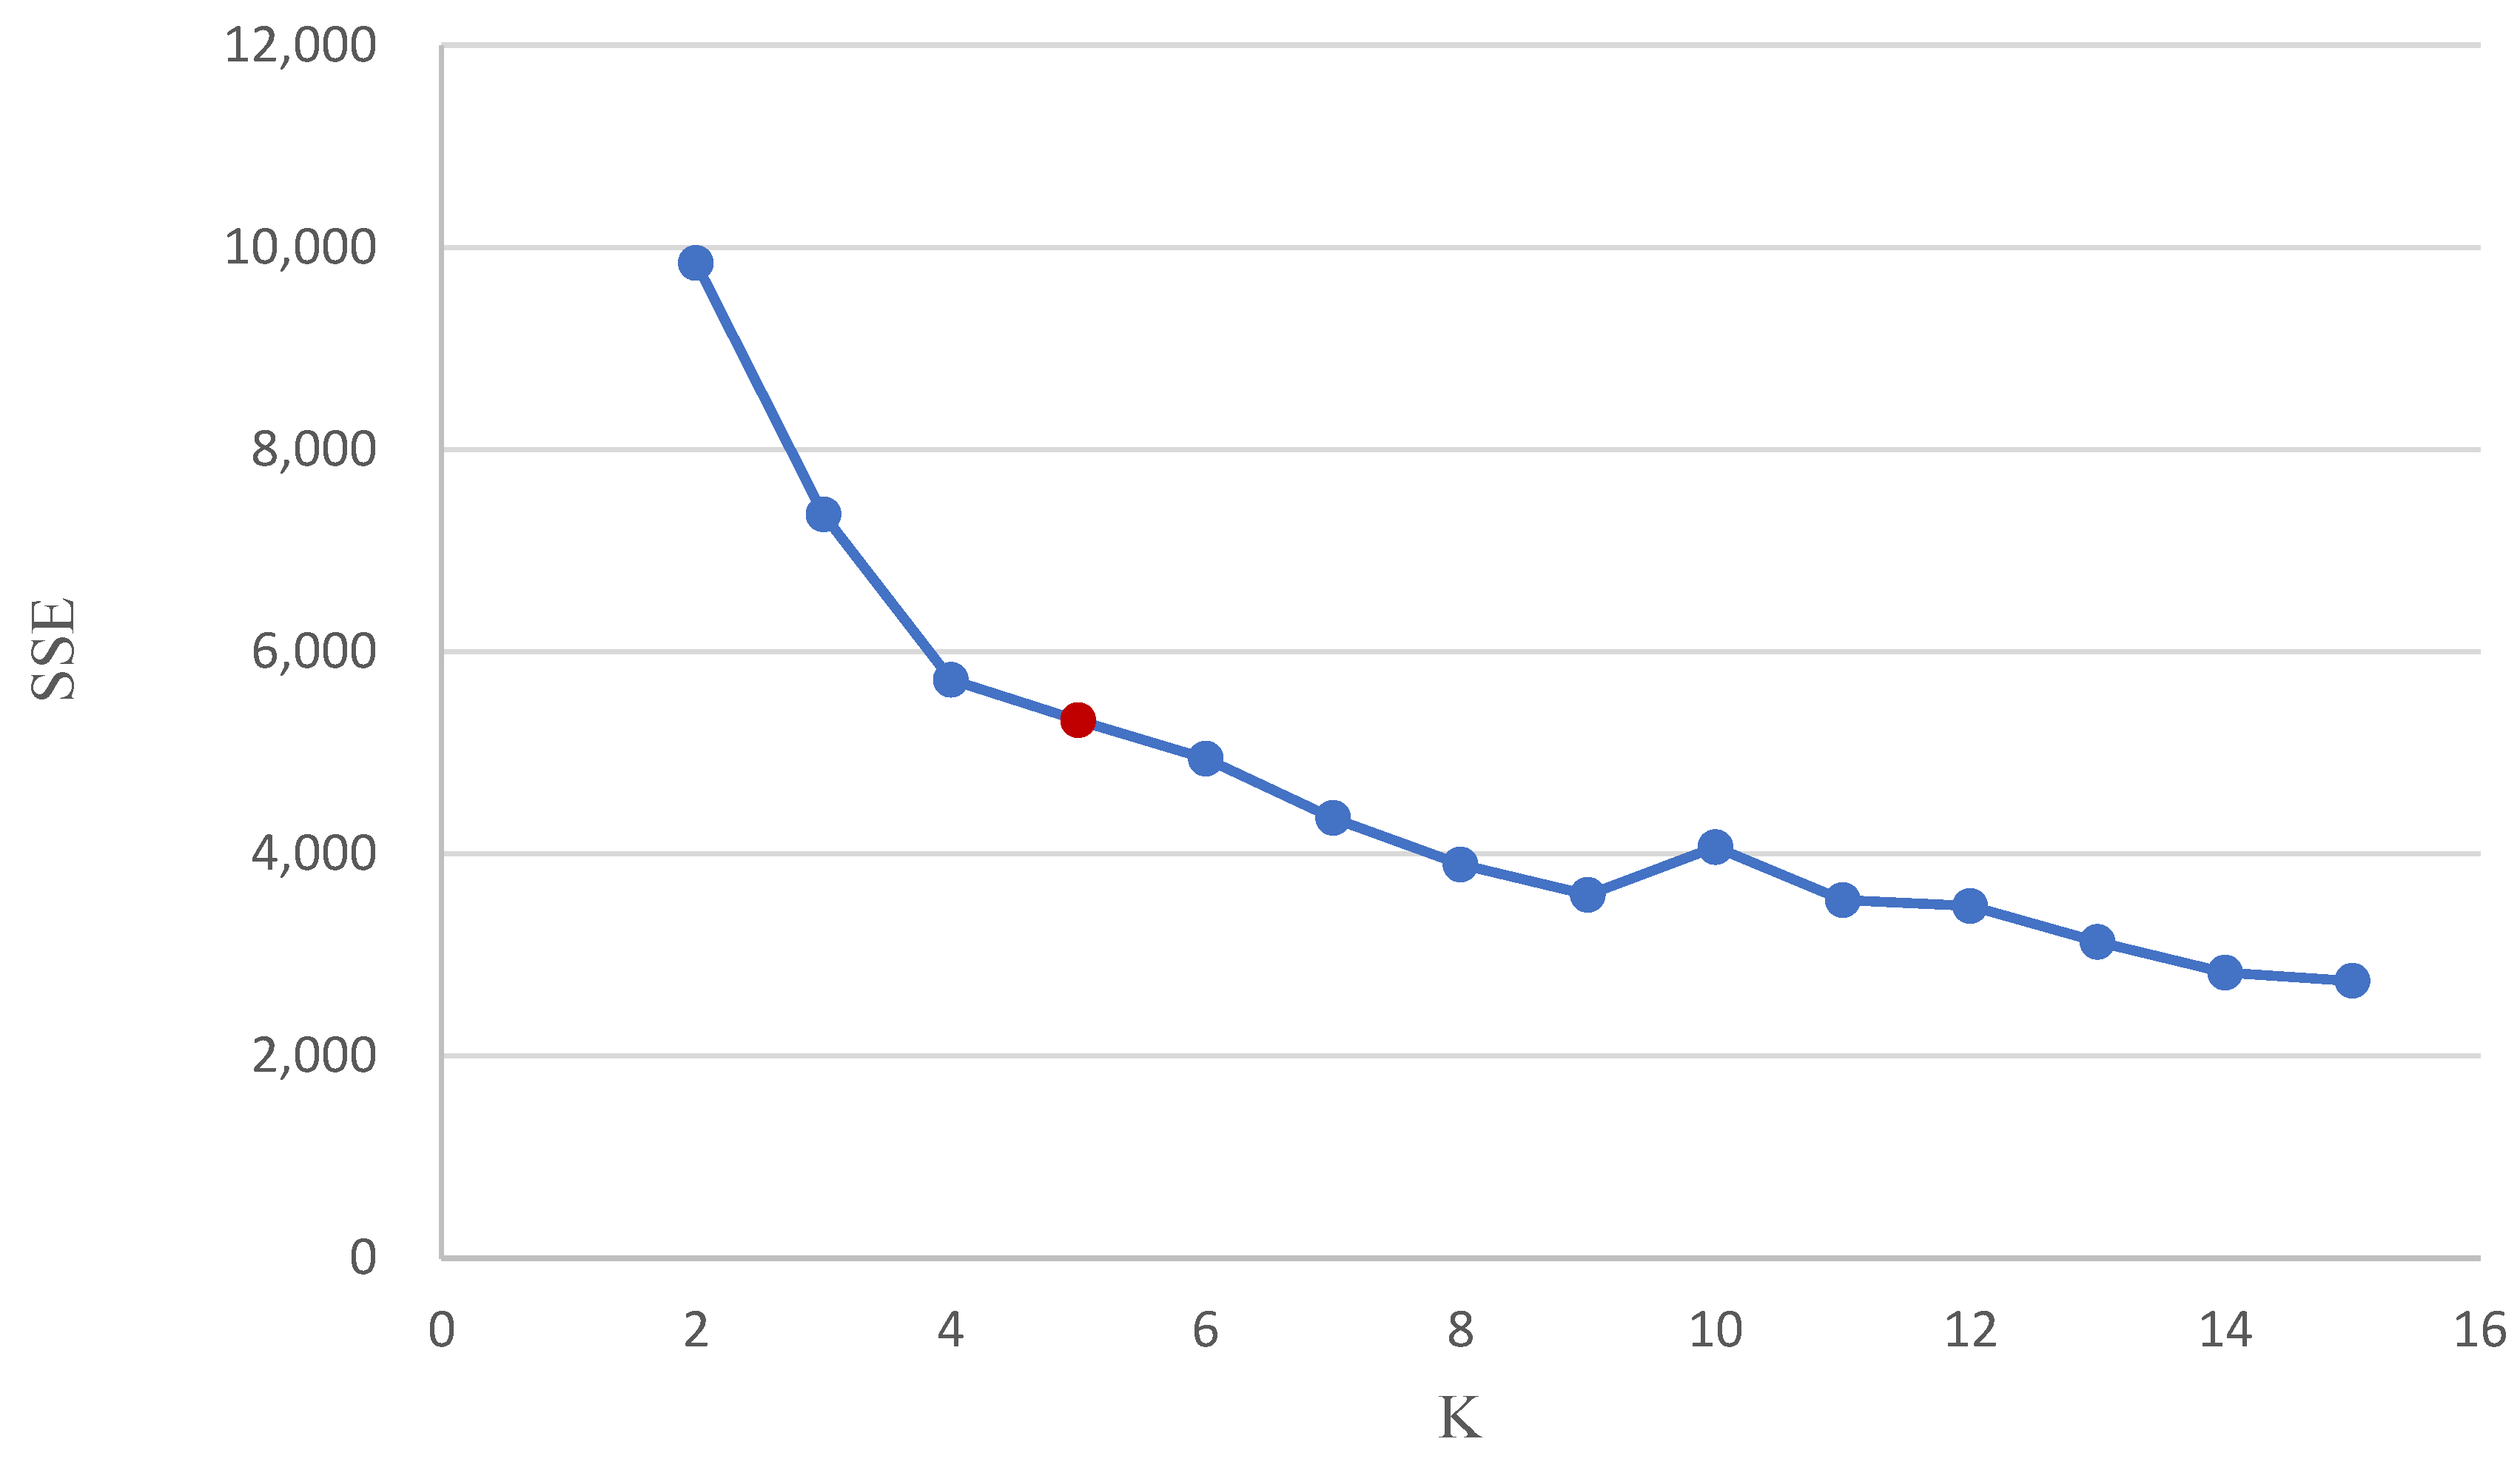
| K | Distance Score | K | Distance Score | K | Distance Score |
|---|---|---|---|---|---|
| 6 | 4939.79 | 11 | 3541.50 | ||
| 2 | 9842.59 | 7 | 4352.80 | 12 | 3483.60 |
| 3 | 7355.31 | 8 | 3892.47 | 13 | 3128.03 |
| 4 | 5719.75 | 9 | 3592.26 | 14 | 2823.35 |
| 5 | 5319.43 | 10 | 4064.35 | 15 | 2743.12 |
| Iterative Calculations | Cluster Center Changes | ||||
|---|---|---|---|---|---|
| 1 | 2 | 3 | 4 | 5 | |
| 1 | 3.113 | 4.411 | 3.023 | 3.577 | 2.701 |
| 2 | 0.585 | 0.770 | 0.228 | 0.333 | 0.157 |
| 3 | 0.154 | 0.156 | 0.013 | 0.000 | 0.000 |
| 4 | 0.000 | 0.000 | 0.000 | 0.000 | 0.000 |
| Cluster | 1 | 2 | 3 | 4 | 5 |
|---|---|---|---|---|---|
| 1 | 4.589 | 4.168 | 8.162 | 6.232 | |
| 2 | 4.589 | 4.926 | 4.643 | 2.965 | |
| 3 | 4.168 | 4.926 | 5.664 | 4.518 | |
| 4 | 8.162 | 4.643 | 5.664 | 2.731 | |
| 5 | 6.232 | 2.965 | 4.518 | 2.731 |
| Variable | Cluster | Error | F | Significance | ||
|---|---|---|---|---|---|---|
| Mean Square | Degrees of Freedom | Mean Square | Degrees of Freedom | |||
| C | 974.442 | 4 | 0.726 | 1356 | 1341.361 | 0.000 |
| N | 259.753 | 4 | 1.451 | 1356 | 178.962 | 0.000 |
| Bb | 13.816 | 4 | 0.210 | 1356 | 65.849 | 0.000 |
| Q | 2382.174 | 4 | 1.535 | 1356 | 1551.686 | 0.000 |
| Bp | 0.000 | 4 | 0.000 | 1356 | . | . |
| Variable | Cluster | ||||
|---|---|---|---|---|---|
| 1 | 2 | 3 | 4 | 5 | |
| C | 6 | 6 | 9 | 9 | 9 |
| N | 4 | 4 | 6 | 6 | 4 |
| Bb | 0 | 1 | 0 | 1 | 1 |
| Q | 3 | 7 | 4 | 10 | 8 |
| Bp | 0 | 0 | 0 | 0 | 0 |
| Risk score for the cluster | 13 | 18 | 19 | 26 | 22 |
| Number of manufacturers in each cluster | 438 | 342 | 177 | 212 | 192 |
| Serial Number | Name of Category | Sample Name | Product Name | Country of Origin | Is EtO Detected? | Government Uniform Invoice Number * |
|---|---|---|---|---|---|---|
| 1 | Baked goods or ingredients | Cookie | Oyster omelet potato chips | Taiwan | No | 56670000 |
| 2 | Flour and its products | Super Bread Flour No. 1 | Taiwan | No | 22522000 | |
| 3 | Egg square cookies | Taiwan | No | 66600000 | ||
| 4 | White bread | Taiwan | No | 27610000 | ||
| 5 | Danish pineapple croissant | Taiwan | No | 73250000 | ||
| 6 | Camel Brand Purple Camel Heart Flour | Taiwan | No | 28427000 | ||
| 7 | Cocoa | Chocolate | Dark Cocoa Mass | Taiwan | No | 27359000 |
| 8 | Chocolate golden candy | Malaysia | No | 84150000 | ||
| 9 | Coffee beans | Coffee beans | Fandi Roasted Special Coffee Bean Manor Italian Coffee Bean, Northern Italian Style | Taiwan | No | 86017000 |
| 10 | Mandheling and Brazilian coffee | Taiwan | No | 86570000 | ||
| 11 | Food Additives | Carotene | β-carotene 1% CWS/M | Australia, New Zealand | No | 16930000 |
| 12 | β-carotene 1% powder | China | No | 5013000 | ||
| 13 | Sodium carboxymethyl cellulose | H-Sodium carboxymethyl cellulose | China | No | 86017000 | |
| 14 | Sodium carboxymethyl cellulose | Taiwan | No | 80130000 | ||
| 15 | Xanthan gum | Xanthan gum | Taiwan | No | 3028000 | |
| 16 | Xanthan gum 80SF | China | No | 3341000 | ||
| 17 | Xanthan gum RD | China | No | 24547000 | ||
| 18 | Milk and its products | Butter | Salted butter | New Zealand | No | 31264000 |
| 19 | New Zealand salted butter | New Zealand | No | 15319000 | ||
| 20 | Cheese | Cheese powder | Taiwan | No | 23520000 | |
| 21 | High-melt cheese (processed cheddar) | Taiwan | No | 80610000 | ||
| 22 | Cream | Unicorn Cream (No Salt Added) | Australia, New Zealand | No | 70443000 | |
| 23 | Fermented milk | Diluted fermented milk (less sugar and fibers) | Taiwan | No | 12680000 | |
| 24 | Original yogurt | Taiwan | No | 73250000 | ||
| 25 | Milk powder | Skimmed milk powder | Australia | No | 73250000 | |
| 26 | Whole milk powder | New Zealand | No | 16930000 | ||
| 27 | Salad sauce | Lemon yogurt salad sauce | New Zealand | No | 22880000 | |
| 28 | Other plant products | Rosemary (dried powder) | Rosemary leaves | Taiwan | No | 86384000 |
| 29 | Rosemary powder | Taiwan | No | 53260000 | ||
| 30 | Stevia leaves | H-Stevia Leaf 094 | Taiwan | No | 86017000 | |
| 31 | Vanilla and its products | Vanilla chicken baking powder | Taiwan | No | 73000000 | |
| 32 | Vanilla powder | Taiwan | No | 89410000 | ||
| 33 | Vanilla flavoring powder (collagen) | Taiwan | No | 23520000 | ||
| 34 | Healthy food (plant juices and extracts) | Healthy food with ginger and turmeric extract | Sentosa Curcumin and Zn Male Complex Tablets | Taiwan | No | 12197000 |
| 35 | Grape King Yi Turmeric Ex Flagship Capsules | Taiwan | No | 11880000 | ||
| 36 | Sauces | Barbecue sauce | Bill Head Barbecue Sauce (Sha Cha) | Taiwan | No | 80550000 |
| 37 | Ketchup | Ketchup | Taiwan | No | 23930000 | |
| 38 | Ketchup | Taiwan | No | 3028000 | ||
| 39 | Veggie Ketchup | Taiwan | No | 3028000 | ||
| 40 | Tomato paste | China | No | 24547000 | ||
| 41 | Sesame | Sesame and its products | Natural and unsweetened Extra Thick Black Sesame Paste | Taiwan | No | 81133000 |
| 42 | Spices | Chili (dry powder products) | Spicy Soup Powder | Taiwan | No | 24293000 |
| 43 | 100% Pure White Pepper | Malaysia and Indonesia | No | 31264000 | ||
| 44 | Chili powder | New Zealand | No | 70470000 | ||
| 45 | Curry ingredients | Seasoned Curry powder | Taiwan | No | 86384000 | |
| 46 | Curry Products | Issuta Medium Spicy Instant Curry | Taiwan | No | 86384000 | |
| 47 | Pepper | Extra hot pepper | Taiwan | No | 97301000 | |
| 48 | Pure White Pepper AF | Taiwan | No | 23930000 | ||
| 49 | Whole grains | Buckwheat | Golden Buckwheat Tea Bags | Taiwan | No | 86017000 |
| 50 | Oat | Mayushan High-Fiber Large Oatmeal | Taiwan | No | 81133000 | |
| 51 | Oats | New Zealand | No | 59660000 | ||
| 52 | Oats with red yeast rice and buckwheat | Taiwan | No | 22100000 |
| Name of the Category (Start Time of Inspection) | Number of Inspection Batches | Number of Unqualified Batches | Unqualified Rate (%) |
|---|---|---|---|
| Sesame (31 August 2021) | 131 | 0 | 0 |
| Guar gum (18 October 2021) | 13 | 0 | 0 |
| Locust bean gum (18 October 2021) | 17 | 1 | 5.9 |
| Flour Instant noodles (with and without meat; 1 March 2022) Other noodles (other pasta and couscous; 1 November 2022) | 1640 | 44 | 2.7 |
| Empty capsule Empty capsules and medicinal capsules containing medicines (15 March 2022) | 25 | 0 | 0 |
| Ice cream and related products Ice cream (15 March 2022) Other edible ice (1 December 2022) | 358 | 2 | 0 |
| Spices Pepper, capsicum, all spices, and herbs (1 November 2022) Fennel, coriander seeds, turmeric, cinnamon, cardamom, and cloves (2 March 2023) Bay leaves (31 October 2023) | 315 | 24 | 7.6 |
| Curry Products (10 February 2023) Curry powder, curry cubes, and curry paste | 62 | 1 | 1.6 |
| Rice (1 April 2023) Brown rice, glutinous rice, and white rice | 80 | 0 | 0 |
| Cereals (1 April 2023) Wheat, rye, barley, maize, buckwheat, millet, and quinoa | 111 | 0 | 0 |
| Nuts (1 April 2023) Brazil nuts, cashews, almonds, hazelnuts, walnuts, chestnuts, pistachios, macadamias, ginkgo nuts, and pine nuts | 75 | 0 | 0 |
| Dried beans (1 April 2023) Peas, chickpeas, mung beans, black beans, red beans, kidney beans, lentils, and broad beans | 46 | 0 | 0 |
| Seeds (1 April 2023) Peanuts, pumpkins, sunflower seeds, and melon seeds | 25 | 0 | 0 |
| Coffee beans (1 April 2023) Roasted and unroasted | 95 | 0 | 0 |
| Dairy products (1 April 2023) Condensed milk, butter, cream, cheese, anhydrous butter, fresh milk, long-life milk, flavored milk, and yogurt | 340 | 2 | 0.6 |
| Wheat gluten powder (1 April 2023) | 4 | - | - |
| Xanthan gum (1 April 2023) | 3 | 0 | 0 |
| Chocolate products (1 August 2023) Cocoa beans, cocoa paste, cocoa butter, cocoa powder, and other chocolate preparations | 122 | 0 | 0 |
| Tomato sauce products (1 August 2023) Tomato ketchup and other tomato sauces | 27 | 0 | 0 |
| Sweetener (1 August 2023) | 2 | 0 | 0 |
| Other paste and flavors (21 August 2023) | 653 | 6 | 0.9 |
| Jam (27 September 2023) | 2 | 0 | 0 |
| Mustard oil (4 December 2023) | 1 | 0 | 0 |
| Total | 4146 | 80 | 1.9 |
Disclaimer/Publisher’s Note: The statements, opinions and data contained in all publications are solely those of the individual author(s) and contributor(s) and not of MDPI and/or the editor(s). MDPI and/or the editor(s) disclaim responsibility for any injury to people or property resulting from any ideas, methods, instructions or products referred to in the content. |
© 2024 by the authors. Licensee MDPI, Basel, Switzerland. This article is an open access article distributed under the terms and conditions of the Creative Commons Attribution (CC BY) license (https://creativecommons.org/licenses/by/4.0/).
Share and Cite
Wu, L.-Y.; Liu, F.-M.; Lin, W.-C.; Qiu, J.-T.; Lin, H.-Y.; Lin, K.-F. Research on Using K-Means Clustering to Explore High-Risk Products with Ethylene Oxide Residues and Their Manufacturers in Taiwan. Foods 2024, 13, 2510. https://doi.org/10.3390/foods13162510
Wu L-Y, Liu F-M, Lin W-C, Qiu J-T, Lin H-Y, Lin K-F. Research on Using K-Means Clustering to Explore High-Risk Products with Ethylene Oxide Residues and Their Manufacturers in Taiwan. Foods. 2024; 13(16):2510. https://doi.org/10.3390/foods13162510
Chicago/Turabian StyleWu, Li-Ya, Fang-Ming Liu, Wen-Chou Lin, Jing-Ting Qiu, Hsu-Yang Lin, and King-Fu Lin. 2024. "Research on Using K-Means Clustering to Explore High-Risk Products with Ethylene Oxide Residues and Their Manufacturers in Taiwan" Foods 13, no. 16: 2510. https://doi.org/10.3390/foods13162510