Abstract
This study investigated the changes in the aroma of jasmine tea during storage. Solid-phase micro-extraction (SPME)–gas chromatography (GC)-mass spectrometry (MS) and stir bar sorptive extraction (SBSE)-GC-MS were combined to detect all volatile compounds. GC-olfactometry (GC-O), odor activity value (OAV), and p-value were employed to analyze and identify the key aroma compounds in six jasmine tea samples stored for different durations. Nine key aroma compounds were discovered, namely (Z)-3-hexen-1-yl acetate, methyl anthranilate, methyl salicylate, trans-β-ionone, linalool, geraniol, (Z)-4-heptenal, benzoic acid methyl ester, and benzoic acid ethyl ester. The importance of these compounds was confirmed through the aroma addition experiment. Correlation analysis showed that (Z)-4-heptenal might be the main reason for the increase in the stale aroma of jasmine tea. Through sensory evaluation and specific experimental analysis, it can be concluded that jasmine tea had the best aroma after 3 years of storage, and too long a storage time may cause the overall aroma of the tea to weaken and produce an undesirable odor. The findings can provide a reference for the change in aroma during the storage of jasmine tea and provide the best storage time (3 years) in terms of jasmine tea aroma.
1. Introduction
Jasmine tea is made by mixing fresh jasmine with tea [1]. It is popular due to its long-lasting aroma and smooth taste, and it is used as a medicinal herb to calm nerves [2] and relieve depression [3]. The total production of jasmine tea reached 114.1 kt in 2022, the gross product was reported to be 14 billion yuan, and its total sales volume accounted for 5.53% of China’s tea market [4]. The jasmine tea industry is ushering in broad market prospects because of its unique floral aroma and health effects. Consumers’ preferences for natural and healthy beverages and the rise of tea culture will provide a strong impetus for the further development of jasmine tea.
The storage of tea will influence the aroma composition and thus affect the tea’s quality. The traditional view is that there is a significant positive correlation between the aroma and quality of jasmine tea; therefore, aroma has become an important evaluation index. Over 70 aroma compounds have been identified in jasmine tea, and the content of aroma compounds accounts for the highest proportion of all teas [5]. Among them, volatile compounds such as methyl anthranilate, (E)-2-hexenyl hexanoate, linalool 4-caprolactone, and 4-hydroxy-2, 5-dimethyl -3(2H)-furanone are powerful odorants in jasmine tea [2]. Various studies have identified that the primary volatile compounds present in jasmine tea include (Z)-3-hexen-1-yl acetate, linalool, benzyl benzoate, α-farnesene, methyl salicylate, methanol benzene, (Z)-3-hexen-1-yl benzoate, methyl anthranilate, and indole. These compounds predominantly exist in jasmine as bonded glycosides and are released via endogenous mechanisms. Furthermore, it has been noted that the aroma of jasmine is liberated through enzymatic processes, with β-evening primrose and β-glucosidase being crucial contributors to this phenomenon [1]. Currently, research on jasmine tea has mainly focused on enhancing processing methods and extraction techniques [6], analyzing volatile compounds [3], and the effect of jasmine on aroma [7]. However, changes in the aroma of jasmine tea during storage have not been reported. Regarding the effects of storage on other tea types, fresh dark tea may have the disadvantage of an excessively smoky aroma [8], but some flavor compounds produced by microbial metabolism during storage may improve the aroma properties of tea [9]. Furthermore, freshly processed white tea has a grassy, tender corn aroma and a slightly thin aroma [10], but white tea has a strong, sweet aroma and a medicinal herb aroma after storage [11]. Taken together, the aroma and overall quality of tea can change considerably during storage. Therefore, it is crucial to understand the impact of storage duration on the aroma of jasmine tea for the preservation of jasmine tea and the provision of consumer choice.
The objective of this study was to investigate the variations in the aroma of jasmine tea with varying storage times. Traditional extraction methods for tea aroma include headspace solid phase micro-extraction (HS-SPME), solvent-assisted flavor evaporation (SAFE), stir bar sorptive extraction (SBSE), solid-phase extraction (SPE), simultaneous distillation extraction (SDE) and supercritical fluid extraction (SFE). Among all methods, HS-SPME demonstrates effective analysis of some small-molecule alcohols and terpenes at high concentrations [12], and SBSE has a good absorption effect on macro-molecular esters and nitrogen heterocycles [13]. Therefore, in order to extract as many volatile compounds as possible from tea infusion, we combined HS-SPME and SBSE to extract. Screening of key aroma compounds in jasmine tea was achieved through the integration of odor activity value (OAV), p-value, and gas chromatography-olfactometry (GC-O) technology. By analyzing the alterations of key aroma compounds, we could discover the changes in aroma components during the storage of jasmine tea. This can help develop the best storage strategy to maintain the aroma quality of jasmine tea.
2. Materials and Methods
2.1. Samples
Samples were produced by Fujian Min Rong Tea Co. Ltd., packaged completely and with specific labels, and stored in a ventilated, dry, and light-proof warehouse at a temperature of about 20 °C and humidity of about 50%. The jasmine tea sample was made by mixing silver needle white tea and jasmine flowers to absorb the aroma (throughout the production process, the weight ratio of jasmine and white tea used was 1:1), picking out the jasmine flowers after the absorption was completed, then added new jasmine and repeated these steps, after carrying out the above process three times, the jasmine tea was dried with a water content of 8.0–8.5%, and finally packed for storage. All the raw materials of the samples were from the same origin, picked in the same season, and prepared by the same processing technology. All tea samples were obtained in April 2023 and produced in 2022, 2021, 2020, 2019, 2018, and 2011. The samples were collected and placed in a laboratory freezer at −20 °C.
2.2. Chemicals and Materials
SPME fibers and a micro-extraction fiber head; PDMS twister for SBSE; gas chromatograph with a mass detector and an olfactory detection port (Agilent 7890B); an HP-5MS capillary column; a blue polytetrafluoroethylene (PTFE)/white silica gel spacer; 20-mL spiral vials; 250-mL conical flasks (Synthware Glass Instrument Co., Ltd., Beijing, China); an AB104-N electronic balance (Jinghong Experimental Equipment Co., Ltd., Shanghai, China); and a DF-101S constant-temperature magnetic stirring water bath (Yuhua Instrument Co., Ltd., Gongyi, China).
The materials used were sodium chloride (Sinopharm Chemical Reagent Co., Ltd., Shanghai, China), C6-C25 n-alkane mixed samples (Dr. Ehrenstorfer GmbH, Augsburg Germany), ethyl caprate (≥99.9%), anhydrous ethanol (Shanghai Hutian Laboratory Equipment Co., Ltd., Shanghai, China), geraniol, linalool, methyl anthranilate, linalool oxide, (Z)-3-hexen-1-yl acetate, methyl salicylate, trans-β-ionone, (Z)-4-heptenal, benzoic acid methyl ester, and benzoic acid ethyl ester (the concentrations of these standard compounds were >98%).
2.3. Extraction and Analysis of Volatile Compounds
2.3.1. Extraction of Volatiles by HS-SPME
In a conical flask, 3 g of dried tea was added, and then 150 mL of boiling water was steeped for 5 min. Then, the tea infusion underwent filtration into a new conical flask, followed by cooling to ambient temperature. Subsequently, 10 mL of the tea infusion, 30 µL of internal standard solution (10 µL/mL aqueous ethyl caprate), and 3 g of NaCl were sequentially added to a 20-mL spiral HS bottle. After shaking well, the spiral HS bottle was placed in a 40 °C magnetic water bath stirrer and stirred for 15 min. Finally, the extracted fiber was pushed into the spiral HS bottle using an extraction needle and allowed to adsorb for 30 min [14].
2.3.2. Extraction of Volatiles by SBSE
The experimental steps are described in Section 2.3.1. SBSE extraction differs in that it involves the use of a rotor (PDMS twister) to absorb volatile compounds with an extraction duration of 90 min [15].
2.3.3. Gas Chromatograph-Mass Spectrometry (GC-MS) Separation and Identification of Volatile Compounds
A gas chromatograph (Agilent 7890B) with a mass detector in combination with an HP-5MS capillary column can be used to separate and identify a wide range of volatile compounds. After extraction, the SPME fiber was inserted into the inlet for thermal desorption for 5 min at 250 °C and then pulled out. The PDMS twister was inserted into a thermal desorption unit (TDU, Gerstel, Mülheim an der Ruhr, Germany). The TDU desorption program involved maintaining the temperature at 30 °C for 1 min, followed by an increase to 240 °C (maintained for 5 min) at a rate of 100 °C/min. The cooled injection system 4 (CIS 4) was initially kept at −100 °C using 99.999% liquid N2, and then raised to 280 °C (maintained for 3 min) at a rate of 12 °C/s from −100 °C (maintained for 1 min) after desorption. The GC oven temperature was programmed as follows: for HS-SPME, the column chamber was heated to 40 °C and kept for 3 min, and subsequently gradually raised to 160 °C at a rate of 4 °C/min. Then increased to 250 °C at a speed of 12 °C/min. The temperature remained constant for 5 min, and the oven heating procedure of SBSE was the same as that of HS-SPME. A mass-selective detector was used in the positive-ion mode, with a mass scan conducted in the range of 30–350 m/z and a scannable energy of 70 eV. The actual retention index (RI) was calculated based on the time of detection of the compounds and the retention time of the n-alkanes mixture (C6–C25), and then compared to the RI* in the NIST 2020 library, the difference within ±20 was considered to be a volatile compound. The concentration of volatile compounds was relatively quantified by comparing the peak area of the compound with the peak area of the added ethyl caprate (Table S1).
2.3.4. Analysis of Key Aroma Compounds by GC-O and Aroma Intensity (AI)
The GC-O uses the Agilent 7890B GC with an olfactory detection port and mass detector. The analysis column’s gas outlet was divided into two identical sections, with half of the gas flowing to the MS detector (250 °C) and the other half flowing to the olfactory detection port (230 °C). The carrier gas, which was 99.999% pure helium, flowed at a linear velocity of 40 cm/s. The HS-SPME and SBSE methods and their heating procedures were consistent with those described in Section 2.3.1, Section 2.3.2 and Section 2.3.3. The sniffing team consisted of three laboratory personnel with specialized sensory training who were not allowed to sniff continuously. They recorded the aroma characteristics through an olfactory detection port and rated the intensity of the odor from 0 to 4 (0–1, very weak; 1–2, weak; 2–3, strong; 3–4, very strong). The sniffing results recorded by the three sniffers were summarized, and if they recorded different aroma characteristics, sniffing was repeated [16].
2.4. Quantitative of Key Aroma Compounds and Calculation of OAV
In order to screen key aroma compounds, we employed a standard addition method combined with selected ions for quantification. Briefly, a 1000 μg/mL stock solution of reference compounds was prepared, and a certain concentration of reference compounds was added to the tea infusion. HS-SPME and GC-MS were operated under identical conditions, as outlined in Section 2.3. Calibration curves were created using six target concentrations that varied from 0.01 to 100 μg/L. Quantitative ion integration was performed using the collected reference odorants. In the calibration curves, the original peak area of the sample was subtracted from the peak area of the target reference odorant as the ordinate of the calibration curve, and the concentration of the added reference odorant was the horizontal coordinate. Information on the calibration curves is presented in Table S3.
The ratio of a single volatile compound’s concentration in a sample to its odor threshold was known as the OAV. This parameter’s calculation algorithms refer to earlier research and can be used as a gauge of the compound’s odor potency [17].
2.5. Quantitative Descriptive Analysis (QDA) and Aroma Addition Experiment
QDA was employed to analyze the characteristics and intensity of the aroma of the tea infusion samples [18]. Tea sniffers (6 men and 6 women, 20–30 years old) with considerable experience in sensory evaluation sniffed the jasmine tea infusion and indicated six aroma terms that fit the characteristics of jasmine tea, including stale, coconut-like, fruity, floral, fresh, or sweet. The six samples were evaluated blindly without the tea sniffing team knowing the details of the samples. The tea sniffing team employed a 5-point scoring system (0–1, very weak; 1–2, weak; 2–3, medium; 3–4, strong; 4–5, very strong) to reflect the strength of the aroma [19].
An aroma addition experiment was conducted to investigate the influence of the screened key aroma compounds on the tea infusion. Compounds with AI > 2, p < 0.05, and OAV > 1 were selected as key aroma compounds, and the highest concentrations of these key aroma compounds in six samples were used as standard concentrations and the difference between each key aroma compound and its standard concentration in each sample was calculated. According to the calculated concentration difference, compounds with corresponding concentrations were added to the six tea infusions so that the concentration of each key aroma compound in the six tea infusions was the same, which means that these key aroma compounds all reached the standard concentration. Finally, QDA experiments were performed on these tea infusions to further determine whether the selected key aroma compounds were correct [20].
The tea infusion samples were prepared according to the GB/T 23776-2018 standard [21]. First, we accurately weighed 3 g of tea samples and brewed them with 150 mL of boiling water for 5 min [7], then filtered and placed them into sniffing bottles. Finally, the sniffing bottle was transferred to a constant temperature water bath at 50 °C, waiting for sniffing.
2.6. Statistical Analysis
Multivariate statistical analyses were performed utilizing SIMCA-P (version 14.1, Umetrics, Umea, Sweeden), and significant differences in volatile compounds were calculated using SPSS (version 26; IBM, Armonk, NY, USA), p < 0.05 was considered to represent statistical significance. Graphs were plotted using Origin software. All data were visualized using Origin 2023b, Cytoscape v3.7.2 (OriginLab Corp., Northampton, MA, USA), and TBtools-II v2.012. The experiments were repeated thrice, and the average result is shown with the ± standard deviation.
3. Results and Discussion
3.1. Traditional Sensory Evaluation of Jasmine Tea Stored for Various Durations
Sensory evaluation has always been considered the most intuitive way to judge the quality of tea [22]. It uses vision, smell, taste, touch, and other sensory organs to identify the taste of tea, aroma, shape, and color to determine tea quality. The results of the aroma sensory evaluation are displayed in Table 1. By sniffing, it could be clearly felt that the 2011 sample had a stale aroma, and the 2020 sample had a better aroma than the other samples; the fruity and floral aroma was better, and it lasted longer.

Table 1.
Sensory experiments analyzed the aroma types of six jasmine tea samples.
3.2. Quantitative Analysis of Total Volatile Compounds in Jasmine Tea
A total of 127 volatile compounds were detected by HS-SPME and SBSE combined with GC-MS: 52 esters, 24 alcohols, 14 terpenes, 13 aldehydes, 11 ketones, three phenols, two nitrogen heterocycles, two oxygen heterocycles, and six other compounds (Table S1). Figure 1B shows that 101 of 127 volatile compounds were present in all samples of jasmine tea. Five of these compounds could only be detected in the 2011 sample: pentanal, 2-ethyl-furan, butanoic acid methyl ester, 3-methyl-1-butanol, and benzeneacetaldehyde. Figure 1A shows that esters had the highest proportion of these aromatic compounds, followed by alcohols and aldehydes, as reported in previous studies [1,7]. The total concentration of these three types of compounds accounted for 91.72–98.06% of the overall volatile compound concentration (Table S1). The concentrations of most of the volatile compounds exhibited an initial rise followed by a subsequent decline as the storage period extended. For example, the ester concentration was 2346.467 μg/L in the 2022 sample, increased to 2897.34 μg/L in the 2020 sample, and decreased to 973.469 μg/L in the 2011 sample. In contrast, the concentration of aldehydes increases with an increase in storage time, being 64.853 μg/L in the 2011 sample but only 16.614 μg/L in the 2022 sample, but most aldehydes may bring a fatty aroma to jasmine tea [23]. Notably, the concentration of total volatile compounds was the highest in the 2020 sample, being 4050.985 μg/L, and the floral, fruity, and fresh characteristics of the jasmine tea were the strongest in this sample. The 2011 sample with the longest storage time had the lowest aroma compound concentration, namely 1599.412 μg/L, and this concentration was significantly lower than that of the other five samples.
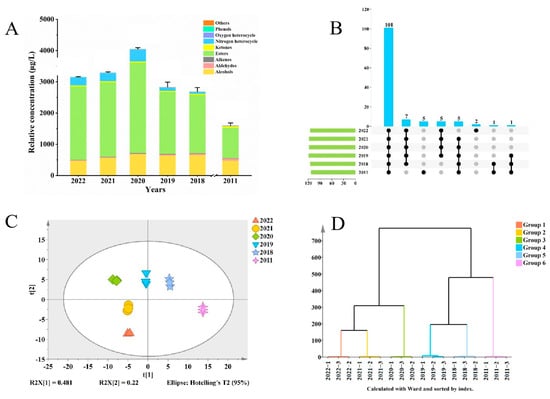
Figure 1.
Variations in the volatile components of jasmine tea throughout storage. (A) Relative concentrations of overall and several classes of volatile compounds. (B) Volatiles shared and not shared among the six samples. (C) Principal component analysis (PCA). (D) Hierarchical clustering analysis (HCA).
To investigate the changes in the characteristics of the volatile compounds of the jasmine tea samples during storage, concentration data for the 127 volatile compounds were subjected to Principal component analysis (PCA) and Hierarchical clustering analysis (HCA) as shown in Figure 1C and D [24]. The PCA results showed differences between samples stored for different times. Especially the sample stored in 2011 showed significant separation from the other samples, which might be due to the significant changes in the volatile compounds caused by the long storage time. In addition, there was good data variance for the first two principal components, which explained 48.1% and 22% of the population variation, respectively. As shown in Figure 1D, the samples were able to be clearly classified into four categories: 2022 and 2021 formed one category; 2019 and 2018 formed another; and 2020 and 2011 represented two separate categories. From this, we speculate that jasmine tea samples will reach a turning point in 2020, when the volatile compounds show significant changes, leading to a change in the aroma of jasmine tea.
3.3. Changes in the Concentration of Volatile Compounds during Storage
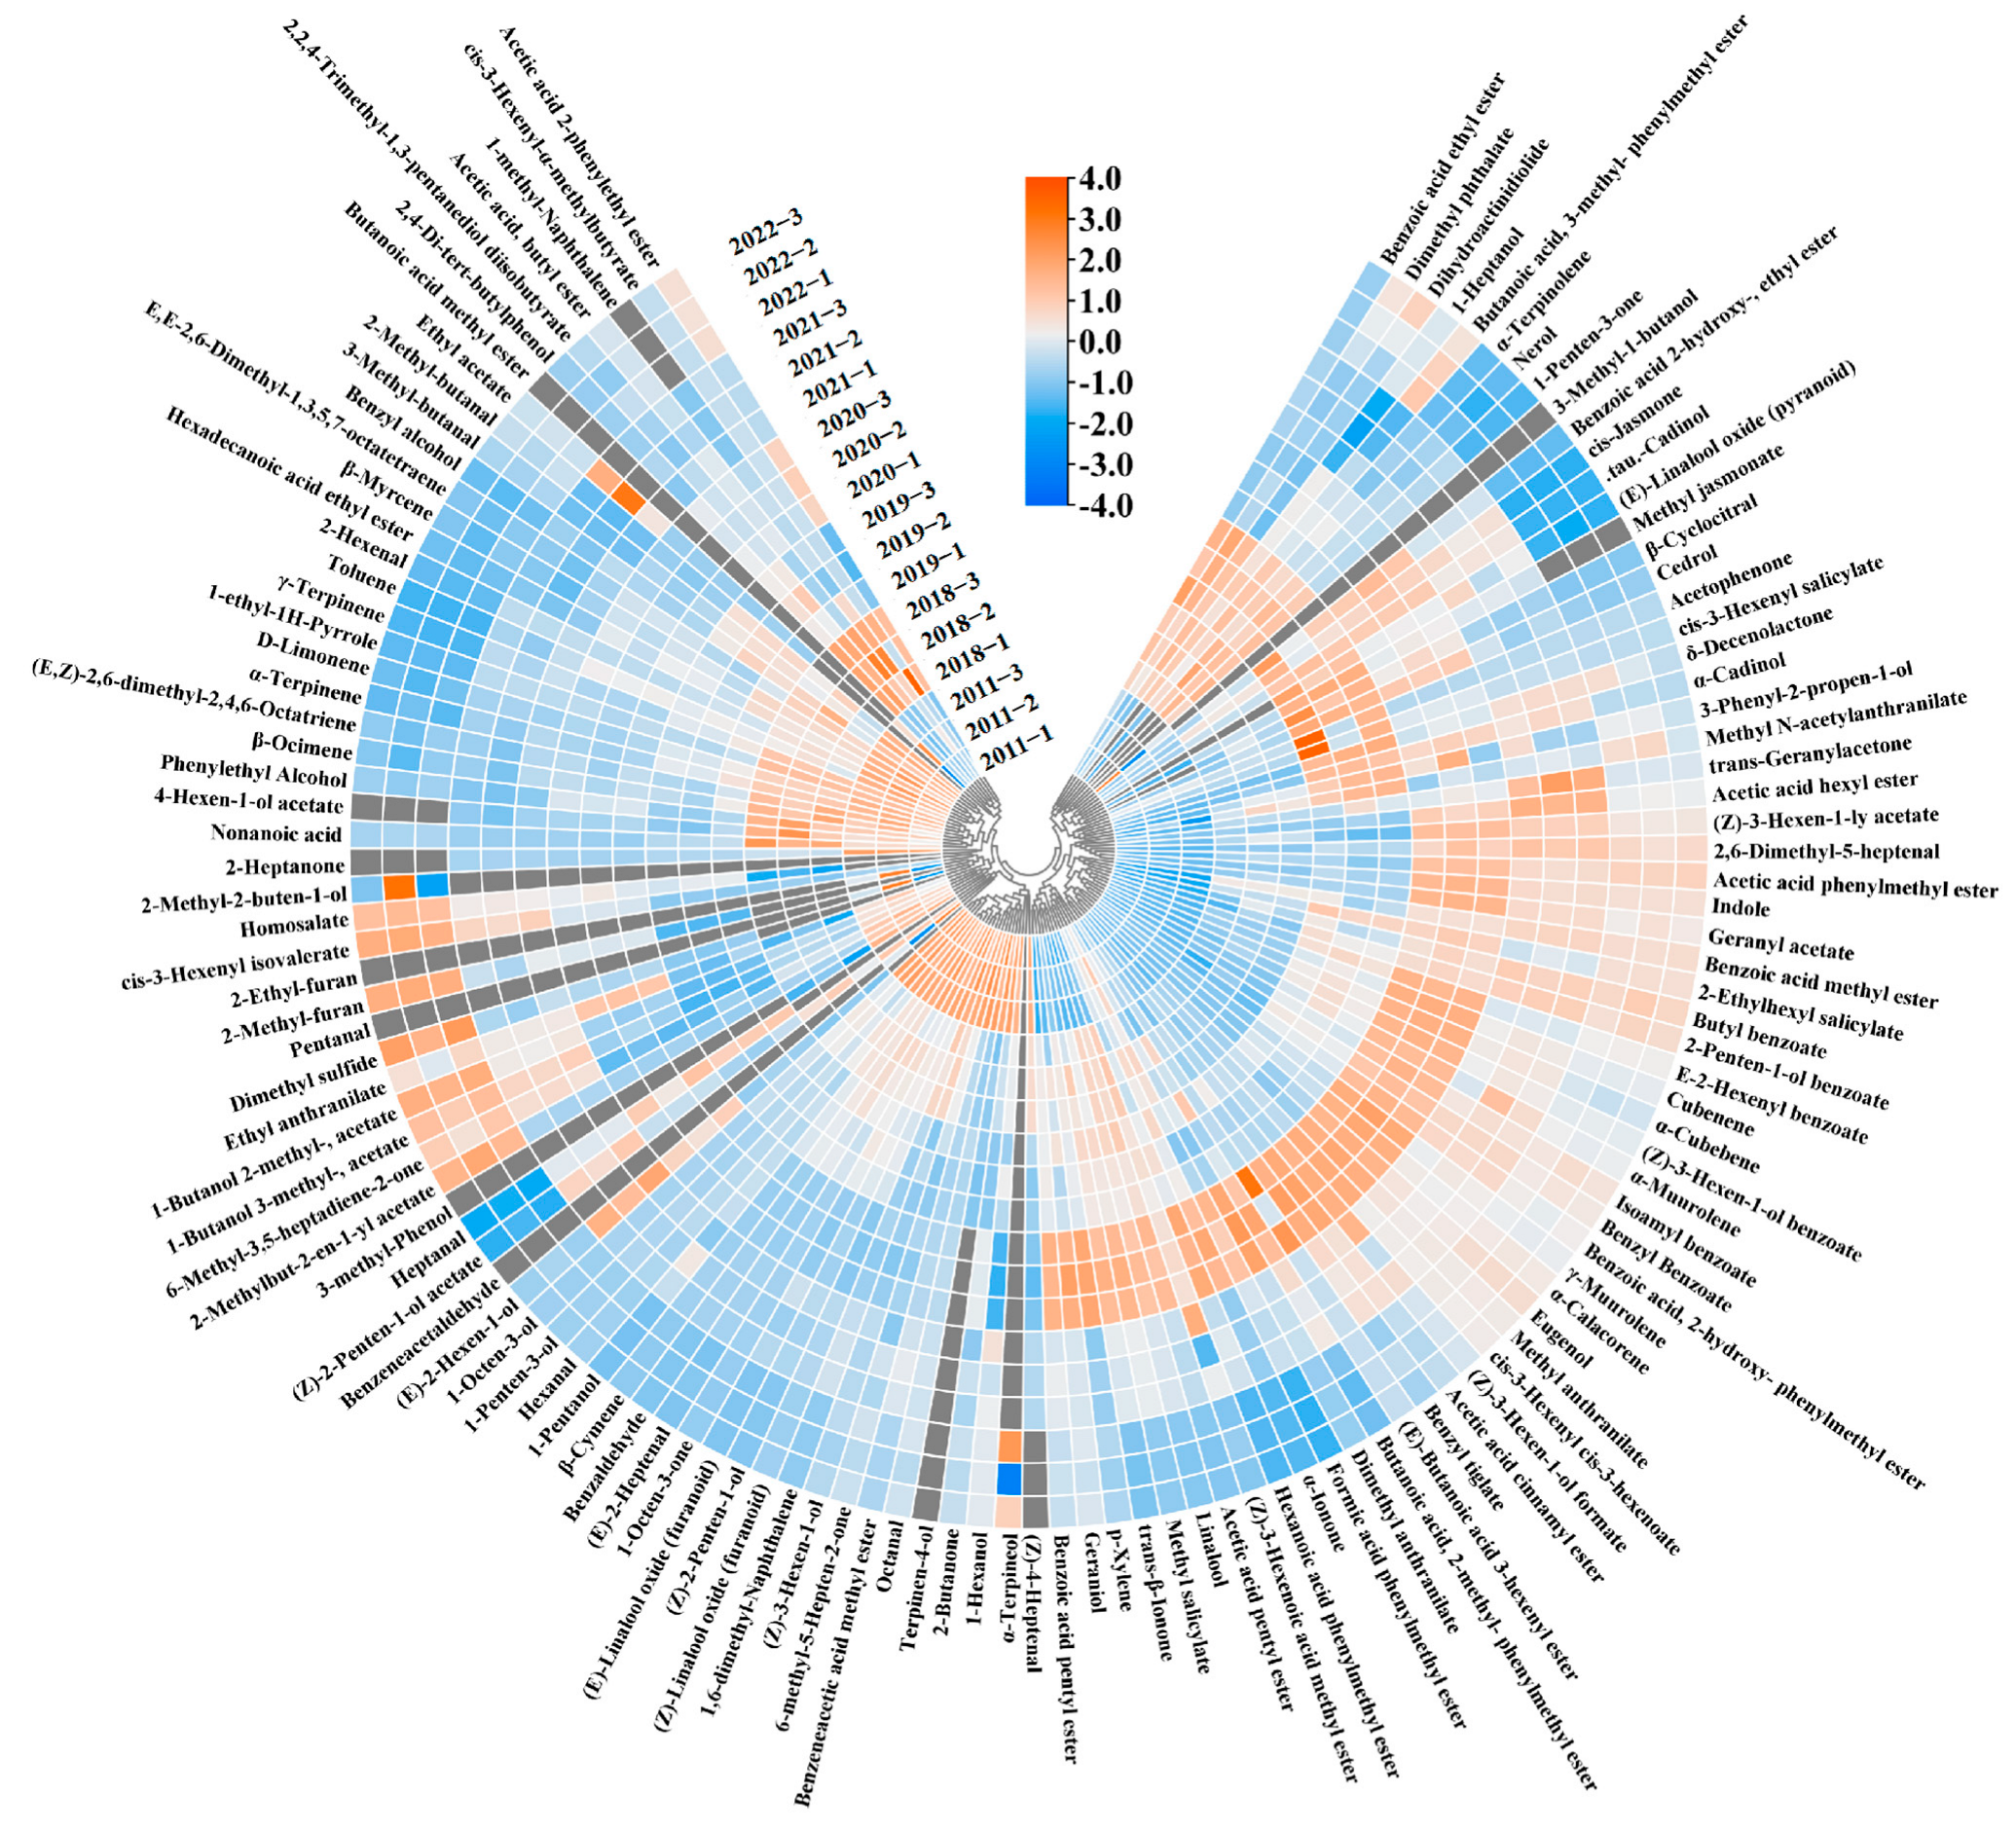
Quantitative findings from earlier experiments have indicated a noticeable shift in the concentration of numerous volatile compounds over the course of storage. To visualize the concentration variations of the volatile compounds in the jasmine tea samples stored for different durations, we conducted a heat map analysis. The data presented in Figure 2 illustrate that the levels of the most volatile compounds in jasmine tea rose at the beginning of the storage period, followed by a gradual decline in the later stages of storage; this change is consistent with previous research [25]. Moreover, changes in the levels of volatile compounds could be broadly classified into three categories. These changing patterns in the concentrations of volatile compounds during storage also occurred in the previous storage of Pu-erh tea [25] and large-leaf black tea [26]. In the first category, the concentration increased and then decreased with storage time; in the second category, it increased with storage time; and in the third category, it decreased with storage time. About 50% of the 127 volatile compounds belonged to the first category, and the primary aromas of the overall volatile compounds were floral and fruity, most of which were highest in the 2020 sample. Notably, the ester concentration, which is beneficial to the aroma of jasmine tea, first increased from 2346.467 μg/L in the 2022 sample to 2897.34 μg/L in the 2020 sample and then decreased to 973.469 μg/L in the 2011 sample. In addition, esters with fruity aroma (e.g., acetic acid pentyl ester, benzoic acid ethyl ester, and benzoic acid methyl ester), lactones with sweet aroma (e.g., δ-decenolactone and dihydroactinidiolide), ketones with floral aroma (e.g., trans-β-ionone), and anthranilates with grape aroma (e.g., methyl anthranilate), which is unique to jasmine tea [5], the change in these compounds was consistent with the above-mentioned ester total concentration, and the concentrations were the highest in the 2020 sample. The second category of volatile compounds mainly includes aldehydes with almond and malt aromas (e.g., benzaldehyde, 2-methylbutyraldehyde, and 3-methylbutyraldehyde) and alkenes with citrus aroma (e.g., D-limonene, β-ocimene, and β-myrcene). The third category is mainly composed of small molecules and esters with grass aroma (e.g., cis 3-hexenyl isovalerate), which indicates that the grass aroma of jasmine tea gradually decreases with storage.
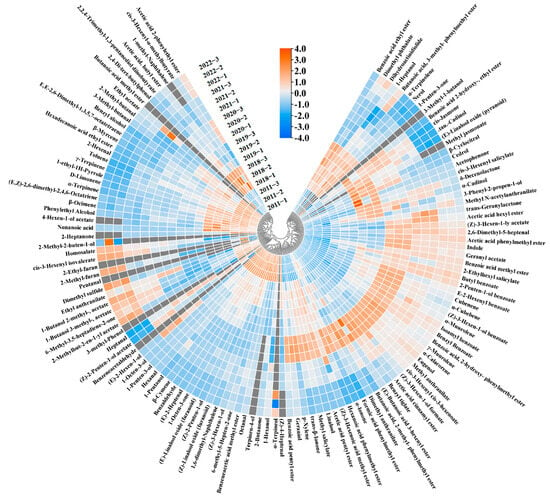
Figure 2.
Heat map of all volatiles in six jasmine tea samples. Gray represents volatiles that were not detected by gas chromatograph-mass spectrometry (GC-MS) in the samples.
3.4. GC–O Screening of Key Aroma Compounds
In order to assess the influence of diverse volatile compounds present in jasmine tea on its overall aroma, we separated all volatile compounds using GC-O. Subsequently, we identified aroma-active compounds that could potentially enhance the aroma of jasmine tea by conducting a sniffing evaluation. Three individuals with professional aroma training smelled the volatile compounds, which were separated from six jasmine tea samples, and they identified 37 aroma compounds with aroma activity (Table 2), including 14 esters, nine alcohols, six aldehydes, three alkenes, three ketones, one nitrogen heterocycle, and one benzene compound. Most of the 37 aroma compounds discovered in the olfactory detection had floral or fruity aroma.
Table 2.
Gas chromatography-olfactometry (GC-O) analysis of all aroma compounds detected in the six samples through smell, and the aroma intensities (AI) and p-values of various compounds.
Of the 37 compounds detected through GC-O, most esters had floral and fruity aromas. Except for methyl salicylate, which has a mint aroma. Most of the alcohols also had a fruity and floral aroma. These findings correspond with the typical aroma characteristics of jasmine tea. After the preliminary screening, 11 aroma compounds with AI > 2 were found in the six samples, including linalool, methyl salicylate, methyl anthranilate, benzoic acid methyl ester, (Z)-3-hexen-1-yl acetate, geraniol, trans-β-ionone, (E)-linalool oxide (furanoid), benzoic acid ethyl ester, (E)-linalool oxide (pyranoid), and(Z)-4-heptenal. The 11 compounds identified were provisionally regarded as the key aroma compounds involved in the storage progress of jasmine tea.
3.5. Identification of Key Aroma Compounds in Jasmine Tea
Variations in the levels of key aroma compounds varied significantly among the six samples with varying storage duration (p < 0.05; Table 2), and the AI and p-values could be used together to screen the key aroma compounds [18]. Because the AI in GC-O is subjective, it is difficult to establish a standard. Therefore, we also examined the OAV (absolute concentration/threshold) of the 11 key aroma compounds. The OAV is a measure of the extent to which a compound contributes to the overall aroma of a sample. The internal standard method was utilized to determine the absolute concentrations of the 11 key aroma compounds across a concentration range of 0.01–100 μg/L. Data were obtained by adding different concentrations of standards to the tea infusion and then analyzing the infusion using GC-MS. Standard curves were utilized to determine the concentration of the 11 primary aroma compounds in the tea infusion (Table S3), followed by the computation of the respective OAV values. Compounds are typically deemed detectable by smell only if their OAV > 1 [27]. Based on the OAV, nine key aroma compounds were screened (Table 3), including (Z)-4-heptenal, (Z)-3-hexen-1-yl acetate, benzoic acid methyl ester, methyl salicylate, methyl anthranilate, trans-β-ionone, linalool, benzoic acid ethyl ester, and geraniol. The majority of key aroma compounds exhibit floral and fruity aromas; among them, linalool, trans-β-ionone, geraniol, and methyl anthranilate are generally considered the main contributors to floral and fruity aromas in tea [1,18]. With the exception of (Z)-4-heptenal, which had a stale and fish oil aroma, methyl salicylate had a mint aroma. The concentrations of eight key aroma compounds first increased and then decreased, among which six key aroma compounds exhibited the highest OAV for the 2020 sample, including methyl salicylate (OAV = 11.6), methyl anthranilate (OAV = 111.2), (Z)-3-hexen-1-yl acetate (OAV = 17.3), trans-β-ionone (OAV = 521.7), linalool (OAV = 464.9), and geraniol (OAV = 7.2). All six compounds exhibited floral and fruity aromas. The highest OAV of benzoic acid methyl ester (OAV = 8.2) was obtained for the 2021 sample, and the highest OAV of benzoic acid ethyl ester (OAV = 3.3) was obtained for the 2019 sample. Whereas the OAV for (Z)-4-heptenal was the highest in the 2011 sample (OAV = 418.3). The correlation analysis findings indicated a strong positive correlation between (Z)-4-heptenal and the duration of storage (Table S2). Therefore, (Z)-4-heptenal of a fish oil aroma might be the main compound leading to jasmine tea having a stale aroma. In summary, the concentration of key aroma compounds first increased and then decreased during storage, and floral and fruity aromas dominated in the 2020 sample, while the stale aroma dominated in the 2011 samples. This finding was consistent with the sensory evaluation of the aroma quality of different samples.
Table 3.
The odor activity value (OAV) of key aroma compounds in the six samples.
3.6. Quantitative Descriptive Analysis
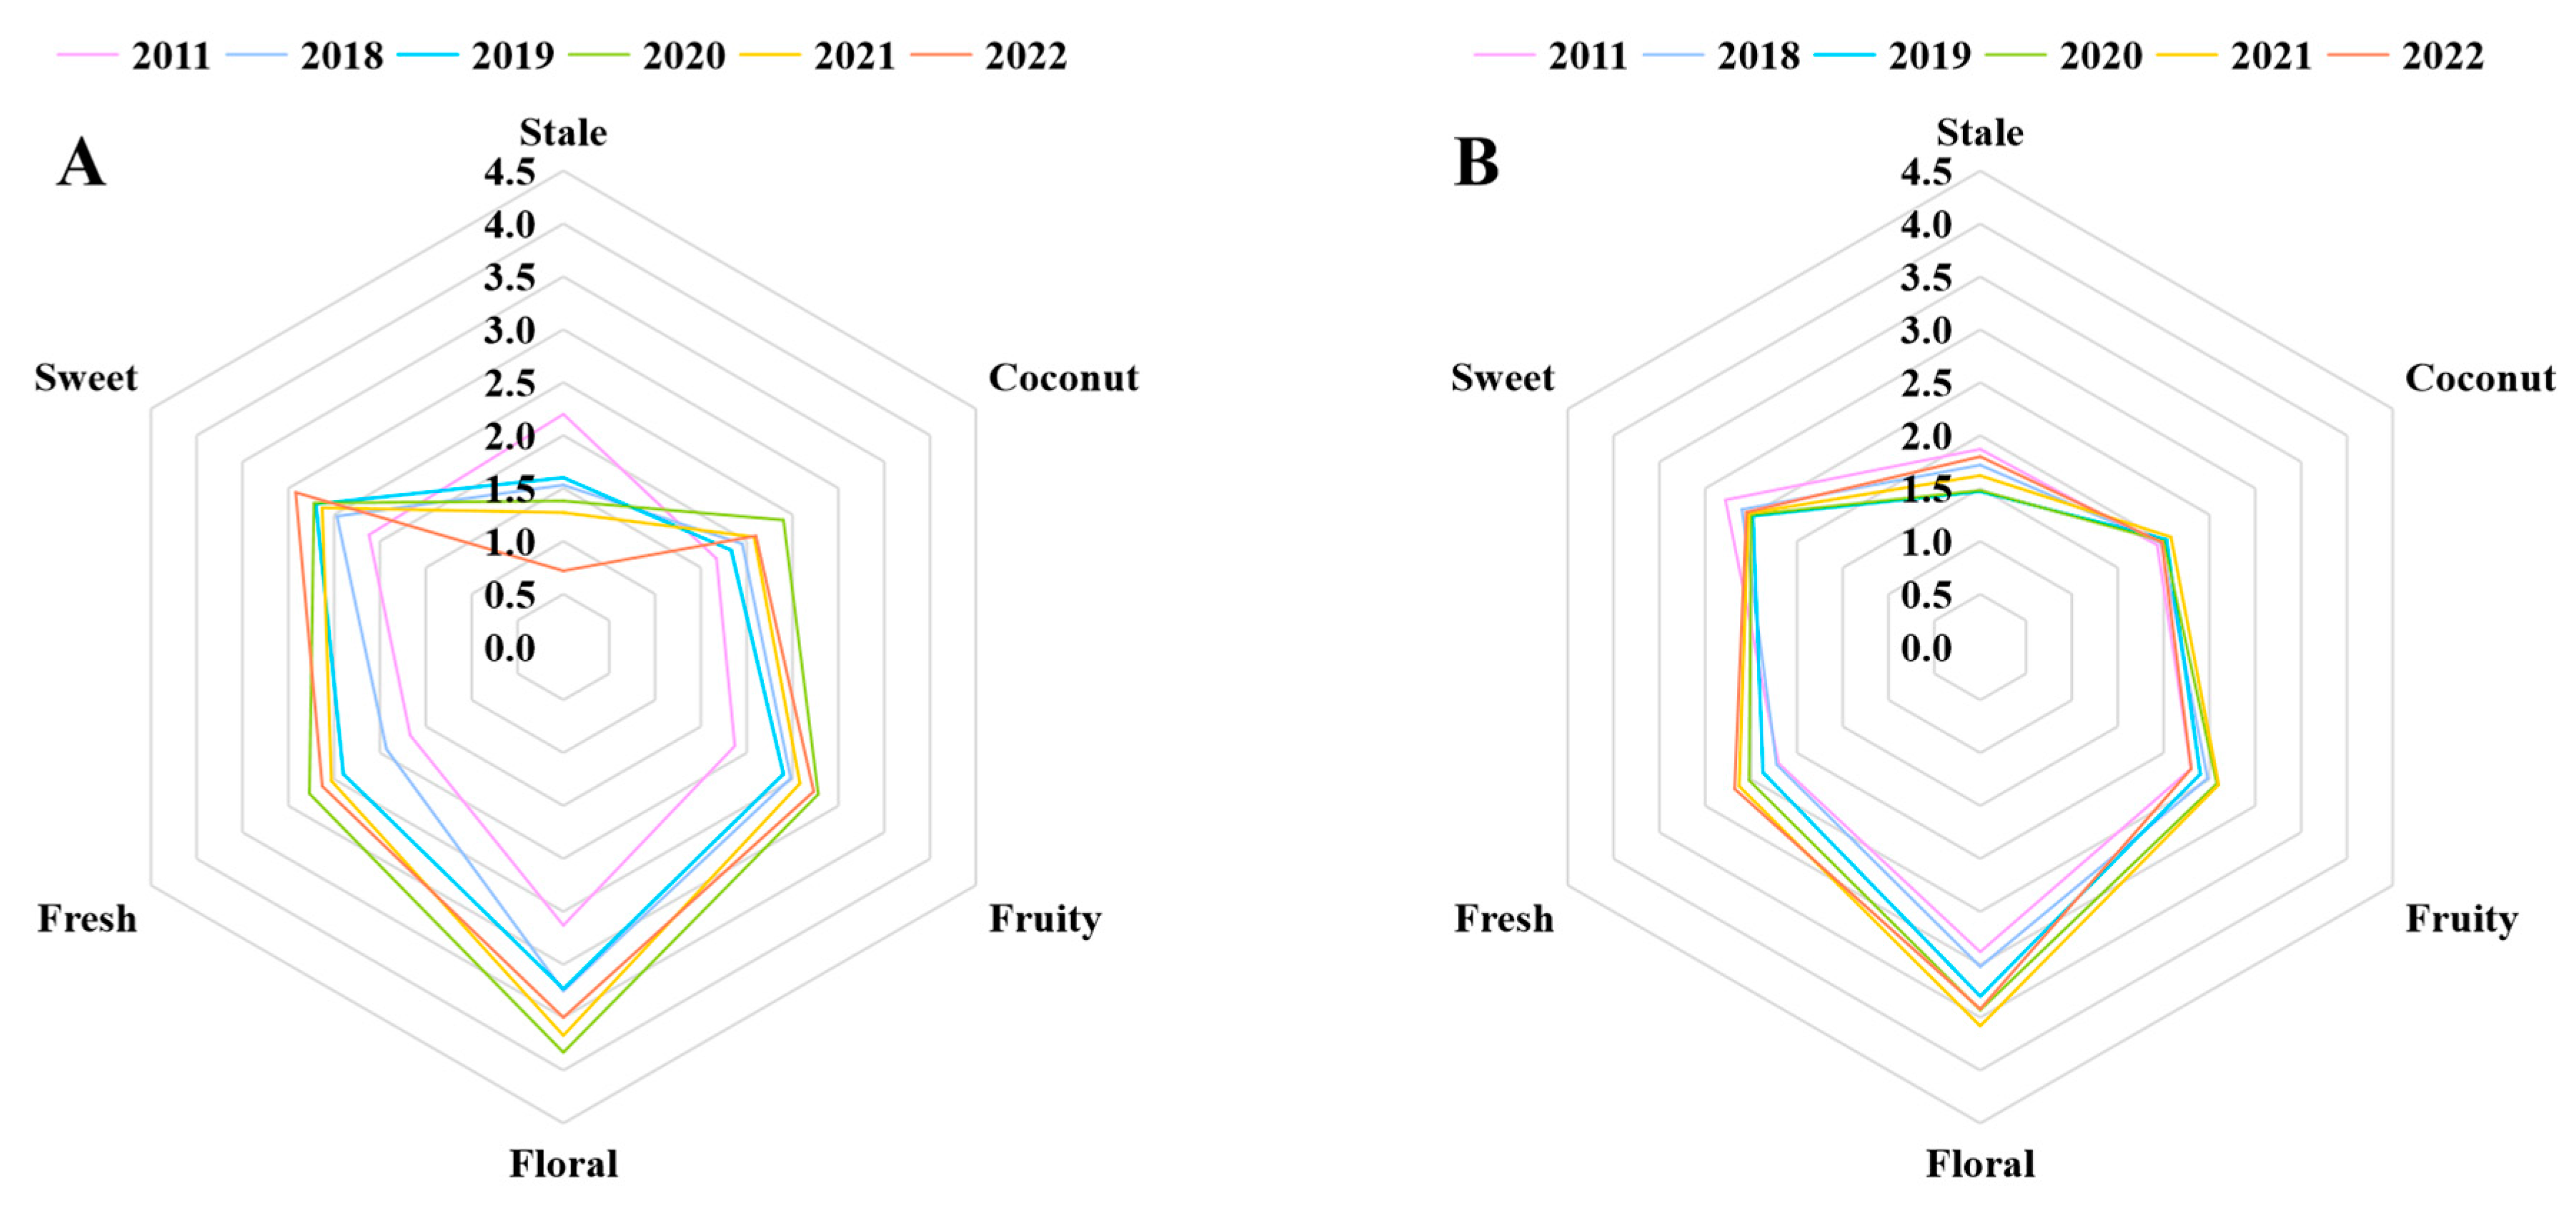
To more clearly determine the differences between the six jasmine tea samples with different storage durations, we conducted a QDA experiment for aroma. The evaluation team provided scores for each jasmine tea infusion for the six aroma terms: stale, coconut, fruity, floral, fresh, and sweet [28]. The radar chart shows the fluctuation in the intensity of the fruity, floral, coconut, and fresh aromas during storage, which first increased and then decreased, and the highest intensity of the four aromas was in 2020. Whereas the intensities of the sweet and stale aromas decreased and increased, respectively, during storage (Figure 3A). Hence, it can be found that the change of six aromas and the concentration of corresponding aroma compounds was consistent.
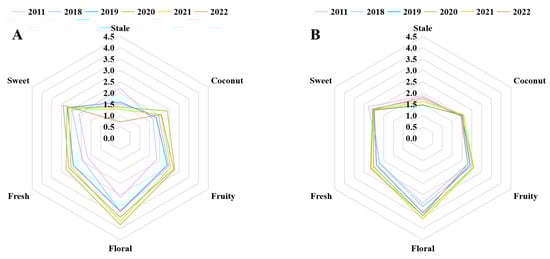
Figure 3.
(A) Quantitative descriptive analysis (QDA) radar map of six sample infusions. (B) QDA radar map of six sample infusions after adding nine key aroma compound standard solutions.
To confirm whether the key aroma compounds jointly screened through GC-O, p-value, and OAV analysis significantly affected the aroma of jasmine tea, we conducted an aroma addition experiment [29]. After incorporating the key aroma compounds into the tea infusion at the appropriate concentrations, the evaluation team conducted an experiment using QDA [30]. Figure 3B indicates that the differences in the six aromas among the six samples were significantly reduced after adding the aroma compounds, which confirmed that the nine screened compounds were the key aroma compounds of jasmine tea [31]. Among the nine compounds, (Z)-4-heptenal was the only compound that was unfavorable to the aroma of jasmine tea and exhibited an increasing trend with storage time. Additionally, stale aroma was the only aroma that increased with storage duration. Therefore, this result further supports our speculation that (Z)-4-heptenal may be the primary reason for the gradual increase in the stale aroma of jasmine tea during storage. This finding is consistent with previous studies that indicated excessive storage could lead to elevated aldehyde levels, ultimately compromising the quality of the product’s aroma [23].
3.7. Metabolism of Key Aroma Compounds
Variations in the levels of key aroma compounds throughout storage can have a substantial impact on the overall aroma of jasmine tea. Linalool, geraniol, and methyl salicylate are all volatile monoterpenes, which originate from the breakdown of glycosides through hydrolysis during tea production and are important components affecting the aroma of jasmine tea [32]. Terpenoids are metabolically transformed from two C5 precursors, namely dimethylallyl diphosphate (DMAPP) and isopentenyl diphosphate (IPP). These two fundamental precursors are synthesized by the methylerythritol phosphate (MEP) pathway and mevalonate acid (MVA) pathway. The MEP pathway is involved in the production of monoterpenes, hemiterpenes, diterpenes, and volatile carotenoid derivatives, while the MVA pathway is responsible for the biosynthesis of sesquiterpenes, atypical terpenes, and geranyl terpenes. In some cases, carotenoid pigments may undergo cleavage by dioxygenase enzymes, resulting in the formation of volatile compounds like α and β ionones. The increase in trans-β-ionone levels at the beginning of storage may be due to the long-term autooxidation of carotenoids. Moreover, previous work has shown that the type and concentration of volatile autoxidation products of carotenoids increase when tea is stored at 20 °C [32,33,34]. Although methyl anthranilate, benzoic acid methyl ester, and methyl salicylate are highly similar in structure, their metabolic pathways involve completely different enzyme mechanisms, including multiple hydrolysis catalytic reactions [35]. (Z)-4-heptenal is the product of fatty acid oxidation. During tea storage, the oxidation of fatty acids is easily affected by the storage environment, especially the water content. Water content that is too high or too low can accelerate the oxidative degradation of fatty acids. Therefore, changes in the concentration of (Z)-4-heptenal over time during storage may be linked to variations in the moisture content of tea [36]. Taken together, the changes in the aroma of jasmine tea during storage may be attributed to natural oxidation, enzyme catalysis, and fluctuations in the storage environment.
4. Conclusions
In this study, we extracted 127 volatile components from six types of jasmine tea samples by HS-SPME and SBSE combined with GC-MS. Nine key aroma compounds were screened: (Z)-4-heptenal, (Z)-3-hexen-1-yl acetate, benzoic acid methyl ester, methyl salicylate, methyl anthranilate, trans-β-ionone, linalool, benzoic acid ethyl ester, and geraniol. Except for (Z)-4-heptenal, all other eight compounds contributed to the floral and fruity aromas of jasmine tea. The concentration of (Z)-4-heptenal with fish oil aroma showed an upward trend during storage, which may be the key reason for the increase in the stale aroma of jasmine tea during storage. It can be concluded that jasmine tea in 2020 (stored for 3 years) had the best aroma, and too long a storage time may cause the overall aroma of the tea to weaken and produce an undesirable odor. Our research results provide a new approach to improving the storage quality of jasmine tea by studying the important metabolic pathways affecting key aroma compounds.
Supplementary Materials
The following supporting information can be downloaded at: https://www.mdpi.com/article/10.3390/foods13162524/s1, Table S1: All detected volatiles in jasmine tea storage. Table S2: Correlation analysis between the concentration of 9 key aroma compounds and year of storage. Table S3: Standard curves of the concentrations of 9 key aroma compounds. Table S4: Reference odourants addition to the six tea infusions.
Author Contributions
Conceptualization, Z.Q., W.H., Q.L. and J.N. Data curation, Z.Q. and W.H. Formal analysis, Z.Q. and W.H. Methodology, Z.Q. and W.H. Project administration, Z.Q. and W.H. Validation, Z.Q. and W.H. Writing—original draft, Z.Q. and W.H.; Writing—review and editing, Z.Q., W.H. and J.N. All authors have read and agreed to the published version of the manuscript.
Funding
This research was funded by the National Key Research and Development Program of China (2021YFD1601102) to Jingming Ning. Jingming Ning works in the State Key Laboratory of Tea Plant Biology and Utilization of Anhui Agricultural University.
Institutional Review Board Statement
This study was approved by the Institutional Review Board (or Ethics Committee) of Anhui Agricultural University for studies involving humans.
Informed Consent Statement
All sensory panelists were informed of the procedure, and their consent for participation was obtained before the start of the sensory test.
Data Availability Statement
The original contributions presented in the study are included in the article/Supplementary Material, further inquiries can be directed to the corresponding author.
Conflicts of Interest
The authors declare no conflicts of interest that could have influenced the work reported in this paper.
References
- Zhang, Y.B.; Xiong, Y.F.; An, H.M.; Li, J.; Li, Q.; Huang, J.A.; Liu, Z.H. Analysis of Volatile Components of Jasmine and Jasmine Tea during Scenting Process. Molecules 2022, 27, 479. [Google Scholar] [CrossRef]
- Inoue, N.; Kuroda, K.; Sugimoto, A.; Kakuda, T.; Fushiki, T. Autonomic nervous responses according to preference for the odor of jasmine tea. Biosci. Biotech. Bioch. 2003, 67, 1206–1214. [Google Scholar] [CrossRef]
- Zhang, Y.B.; Huang, J.A.; Xiong, Y.F.; Zhang, X.N.; Lin, Y.; Liu, Z.H. Jasmine Tea Attenuates Chronic Unpredictable Mild Stress-Induced Depressive-like Behavior in Rats via the Gut-Brain Axis. Nutrients 2022, 14, 99. [Google Scholar] [CrossRef]
- Mei, Y.; Zhang, S.; Li, J.H. Assessment of the Economic Situation of China’s Jasmine Tea Industry in 2022. J. Tea Bus. 2024, 46, 51–55. [Google Scholar]
- Zhao, Y.L.; Li, S.Y.; Du, X.; Xu, W.; Bian, J.L.; Chen, S.X.; He, C.L.; Xu, J.Y.; Ye, S.R.; Feng, D.J.; et al. Insights into momentous aroma dominating the characteristic flavor of jasmine tea. Food Sci. Nutr. 2023, 11, 7841–7854. [Google Scholar] [CrossRef]
- Shen, J.X.; Rana, M.M.; Liu, G.F.; Ling, T.J.; Gruber, M.Y.; Wei, S. Differential Contribution of Jasmine Floral Volatiles to the Aroma of Scented Green Tea. J. Food Qual. 2017, 1, 5849501. [Google Scholar] [CrossRef]
- An, H.M.; Liu, J.S.; Chen, Y.; Huang, Y.W.; Chen, J.H.; Liu, Z.H.; Li, S.; Huang, J.A. Characterization of key volatile compounds in jasmine tea infusion with different amount of flowers. Food Chem. X 2023, 19, 100750. [Google Scholar] [CrossRef]
- Shen, S.S.; Wu, H.T.; Li, T.H.; Sun, H.R.; Wang, Y.J.; Ning, J.M. Formation of aroma characteristics driven by volatile components during long-term storage of An tea. Food Chem. 2023, 411, 135487. [Google Scholar] [CrossRef]
- Cheng, L.Z.; Wang, Y.F.; Zhang, J.R.; Zhu, J.X.; Liu, P.H.; Xu, L.R.; Wei, K.; Zhou, H.; Peng, L.L.; Zhang, J.; et al. Dynamic changes of metabolic profile and taste quality during the long-term aging of Qingzhuan Tea: The impact of storage age. Food Chem. 2021, 359, 129953. [Google Scholar] [CrossRef]
- Chen, Q.C.; Zhu, Y.; Yan, H.; Chen, M.; Xie, D.C.; Wang, M.Q.; Ni, D.J.; Lin, Z. Identification of Aroma Composition and Key Odorants Contributing to Aroma Characteristics of White Teas. Molecules 2020, 25, 6050. [Google Scholar] [CrossRef]
- Wang, Z.H.; Wang, Z.H.; Dai, H.M.; Wu, S.L.; Song, B.; Lin, F.M.; Huang, Y.; Lin, X.C.; Sun, W.J. Identification of characteristic aroma and bacteria related to aroma evolution during long-term storage of compressed white tea. Front. Nutr. 2022, 9, 1092048. [Google Scholar] [CrossRef] [PubMed]
- Wang, L.; Gao, M.; Liu, Z.; Chen, S.; Xu, Y. Three Extraction Methods in Combination with GC×GC-TOFMS for the Detailed Investigation of Volatiles in Chinese Herbaceous Aroma-Type Baijiu. Molecules 2020, 25, 4429. [Google Scholar] [CrossRef] [PubMed]
- High, R.; Bremer, P.; Kebede, B.; Eyres, G.T. Comparison of Four Extraction Techniques for the Evaluation of Volatile Compounds in Spray-Dried New Zealand Sheep Milk. Molecules 2019, 24, 1917. [Google Scholar] [CrossRef] [PubMed]
- Wu, H.; Chen, Y.; Feng, W.; Shen, S.; Wei, Y.; Jia, H.; Wang, Y.; Deng, W.; Ning, J. Effects of Three Different Withering Treatments on the Aroma of White Tea. Foods 2022, 11, 2502. [Google Scholar] [CrossRef] [PubMed]
- Wang, M.Q.; Ma, W.J.; Shi, J.; Zhu, Y.; Lin, Z.; Lv, H.P. Characterization of the key aroma compounds in Longjing tea using stir bar sorptive extraction (SBSE) combined with gas chromatography-mass spectrometry (GC-MS), gas chromatography-olfactometry (GC-O), odor activity value (OAV), and aroma recombination. Food Res. Int. 2020, 130, 108908. [Google Scholar] [CrossRef] [PubMed]
- Lv, H.P.; Zhong, Q.-S.; Lin, Z.; Wang, L.; Tan, J.-F.; Guo, L. Aroma characterisation of Pu-erh tea using headspace-solid phase microextraction combined with GC/MS and GC–olfactometry. Food Chem. 2012, 130, 1074–1081. [Google Scholar] [CrossRef]
- Zhu, J.C.; Niu, Y.W.; Xiao, Z.B. Characterization of the key aroma compounds in Laoshan green teas by application of odour activity value (OAV), gas chromatography-mass spectrometry-olfactometry (GC-MS-O) and comprehensive two-dimensional gas chromatography mass spectrometry (GC × GC-qMS). Food Chem. 2021, 339, 128136. [Google Scholar] [CrossRef] [PubMed]
- Zhu, J.; Chen, F.; Wang, L.; Niu, Y.; Yu, D.; Shu, C.; Chen, H.; Wang, H.; Xiao, Z. Comparison of Aroma-Active Volatiles in Oolong Tea Infusions Using GC–Olfactometry, GC–FPD, and GC–MS. J. Agric. Food Chem. 2015, 63, 7499–7510. [Google Scholar] [CrossRef] [PubMed]
- Hou, Z.W.; Wang, Y.J.; Xu, S.S.; Wei, Y.M.; Bao, G.H.; Dai, Q.Y.; Deng, W.W.; Ning, J.M. Effects of dynamic and static withering technology on volatile and nonvolatile components of Keemun black tea using GC-MS and HPLC combined with chemometrics. Lwt-Food Sci. Technol. 2020, 130, 109547. [Google Scholar] [CrossRef]
- Tian, H.X.; Xu, X.L.; Sun, X.F.; Chen, C.; Yu, H.Y. Evaluation of the perceptual interaction among key aroma compounds in milk fan by gas chromatography−olfactometry, odor threshold, and sensory analyses. J. Dairy Sci. 2020, 103, 5863–5873. [Google Scholar] [CrossRef]
- GB/T 23376-2018; Methodology of Sensory Evaluation of Tea. National Standards of the People’s Republic of China: Beijing, China, 2018. (In Chinese)
- Wang, C.; Zhang, C.; Kong, Y.; Peng, X.; Li, C.; Liu, S.; Du, L.; Xiao, D.; Xu, Y. A comparative study of volatile components in Dianhong teas from fresh leaves of four tea cultivars by using chromatography-mass spectrometry, multivariate data analysis, and descriptive sensory analysis. Food Res. Int. 2017, 100, 267–275. [Google Scholar] [CrossRef]
- Cui, J.; Wu, B.; Wang, J.; Jing, T.; Jin, J.; Zhao, M.; Hu, Y.; Wu, Y.; Yu, F.; Zhang, N.; et al. Effect of storage time on aroma profiles of wuyi rock tea. LWT 2024, 203, 116367. [Google Scholar] [CrossRef]
- Granato, D.; Santos, J.S.; Escher, G.B.; Ferreira, B.L.; Maggio, R.M. Use of principal component analysis (PCA) and hierarchical cluster analysis (HCA) for multivariate association between bioactive compounds and functional properties in foods: A critical perspective. Trends Food Sci. Tech. 2018, 72, 83–90. [Google Scholar] [CrossRef]
- Guo, J.; Yu, Z.H.; Liu, M.Y.; Guan, M.D.; Shi, A.Y.; Hu, Y.D.; Li, S.Y.; Yi, L.Z.; Ren, D.B. Analysis of Volatile Profile and Aromatic Characteristics of Raw Pu-erh Tea during Storage Based on GC-MS and Odor Activity Value. Foods 2023, 12, 3568. [Google Scholar] [CrossRef]
- Zhang, S.; Sun, L.; Wen, S.; Chen, R.; Sun, S.; Lai, X.; Li, Q.; Zhang, Z.; Lai, Z.; Li, Z.; et al. Analysis of aroma quality changes of large-leaf black tea in different storage years based on HS-SPME and GC–MS. Food Chem. X 2023, 20, 100991. [Google Scholar] [CrossRef] [PubMed]
- Gil, M.; Cabellos, J.M.; Arroyo, T.; Prodanov, M. Characterization of the volatile fraction of young wines from the Denomination of Origin “Vinos de Madrid” (Spain). Anal. Chim. Acta 2006, 563, 145–153. [Google Scholar] [CrossRef]
- Li, H.H.; Luo, L.Y.; Ma, M.J.; Zeng, L. Characterization of Volatile Compounds and Sensory Analysis of Jasmine Scented Black Tea Produced by Different Scenting Processes. J. Food Sci. 2018, 83, 2718–2732. [Google Scholar] [CrossRef]
- Sun, J.; Li, Q.; Luo, S.; Zhang, J.; Huang, M.; Chen, F.; Zheng, F.; Sun, X.; Li, H. Characterization of key aroma compounds in Meilanchun sesame flavor style baijiu by application of aroma extract dilution analysis, quantitative measurements, aroma recombination, and omission/addition experiments. RSC Adv. 2018, 8, 23757–23767. [Google Scholar] [CrossRef]
- Zhou, J.T.; He, C.; Qin, M.X.; Luo, Q.Q.; Jiang, X.F.; Zhu, J.Y.; Qiu, L.; Yu, Z.; Zhang, D.; Chen, Y.Q.; et al. Characterizing and Decoding the Effects of Different Fermentation Levels on Key Aroma Substances of Congou Black Tea by Sensomics. J. Agric. Food Chem. 2023, 71, 14706–14719. [Google Scholar] [CrossRef]
- Huang, W.J.; Fang, S.M.; Wang, J.; Zhuo, C.; Luo, Y.H.; Yu, Y.L.; Li, L.Q.; Wang, Y.J.; Deng, W.W.; Ning, J.M. Sensomics analysis of the effect of the withering method on the aroma components of Keemun black tea. Food Chem. 2022, 395, 133549. [Google Scholar] [CrossRef]
- Tao, M.; Xiao, Z.P.; Huang, A.; Chen, J.Y.; Yin, T.J.; Liu, Z.Q. Effect of 1–20 years storage on volatiles and aroma of Keemun congou black tea by solvent extraction-solid phase extraction-gas chromatography-mass spectrometry. LWT 2021, 136, 110278. [Google Scholar]
- Dudareva, N.; Klempien, A.; Muhlemann, J.K.; Kaplan, I. Biosynthesis, function and metabolic engineering of plant volatile organic compounds. New Phytol. 2013, 198, 16–32. [Google Scholar] [CrossRef] [PubMed]
- Paparella, A.; Shaltiel-Harpaza, L.; Ibdah, M. β-Ionone: Its Occurrence and Biological Function and Metabolic Engineering. Plants 2021, 10, 754. [Google Scholar] [CrossRef] [PubMed]
- Murfitt, L.M.; Kolosova, N.; Mann, C.J.; Dudareva, N. Purification and characterization of -adenosyl-L-methionine: Benzoic acid carboxyl methyltransferase, the enzyme responsible for biosynthesis of the volatile ester methyl benzoate in flowers of Antirrhinum majus. Arch. Biochem. Biophys. 2000, 382, 145–151. [Google Scholar] [CrossRef]
- Gao, J.J.; Chen, D.; Peng, J.K.; Wang, Z.; Wu, W.L.; Lin, Z.; Dai, W.D. Research Advances on the Chemical Compositions and Technology of Tea Storage. China Tea 2021, 43, 1–10. [Google Scholar]

Disclaimer/Publisher’s Note: The statements, opinions and data contained in all publications are solely those of the individual author(s) and contributor(s) and not of MDPI and/or the editor(s). MDPI and/or the editor(s) disclaim responsibility for any injury to people or property resulting from any ideas, methods, instructions or products referred to in the content. |
© 2024 by the authors. Licensee MDPI, Basel, Switzerland. This article is an open access article distributed under the terms and conditions of the Creative Commons Attribution (CC BY) license (https://creativecommons.org/licenses/by/4.0/).