Assessment of ‘Golden Delicious’ Apples Using an Electronic Nose and Machine Learning to Determine Ripening Stages
Abstract
1. Introduction
- Use of an electronic nose provides a non-destructive and user-friendly approach to achieve better accuracy of quality control in supermarkets.
- Detection of seasonal variations in VOCs can improve the determination of ripening stages between less and more mature apples.
- Using data from multiple experiments performed over a longer period provides robustness of findings to be more applicable to real-world scenarios.
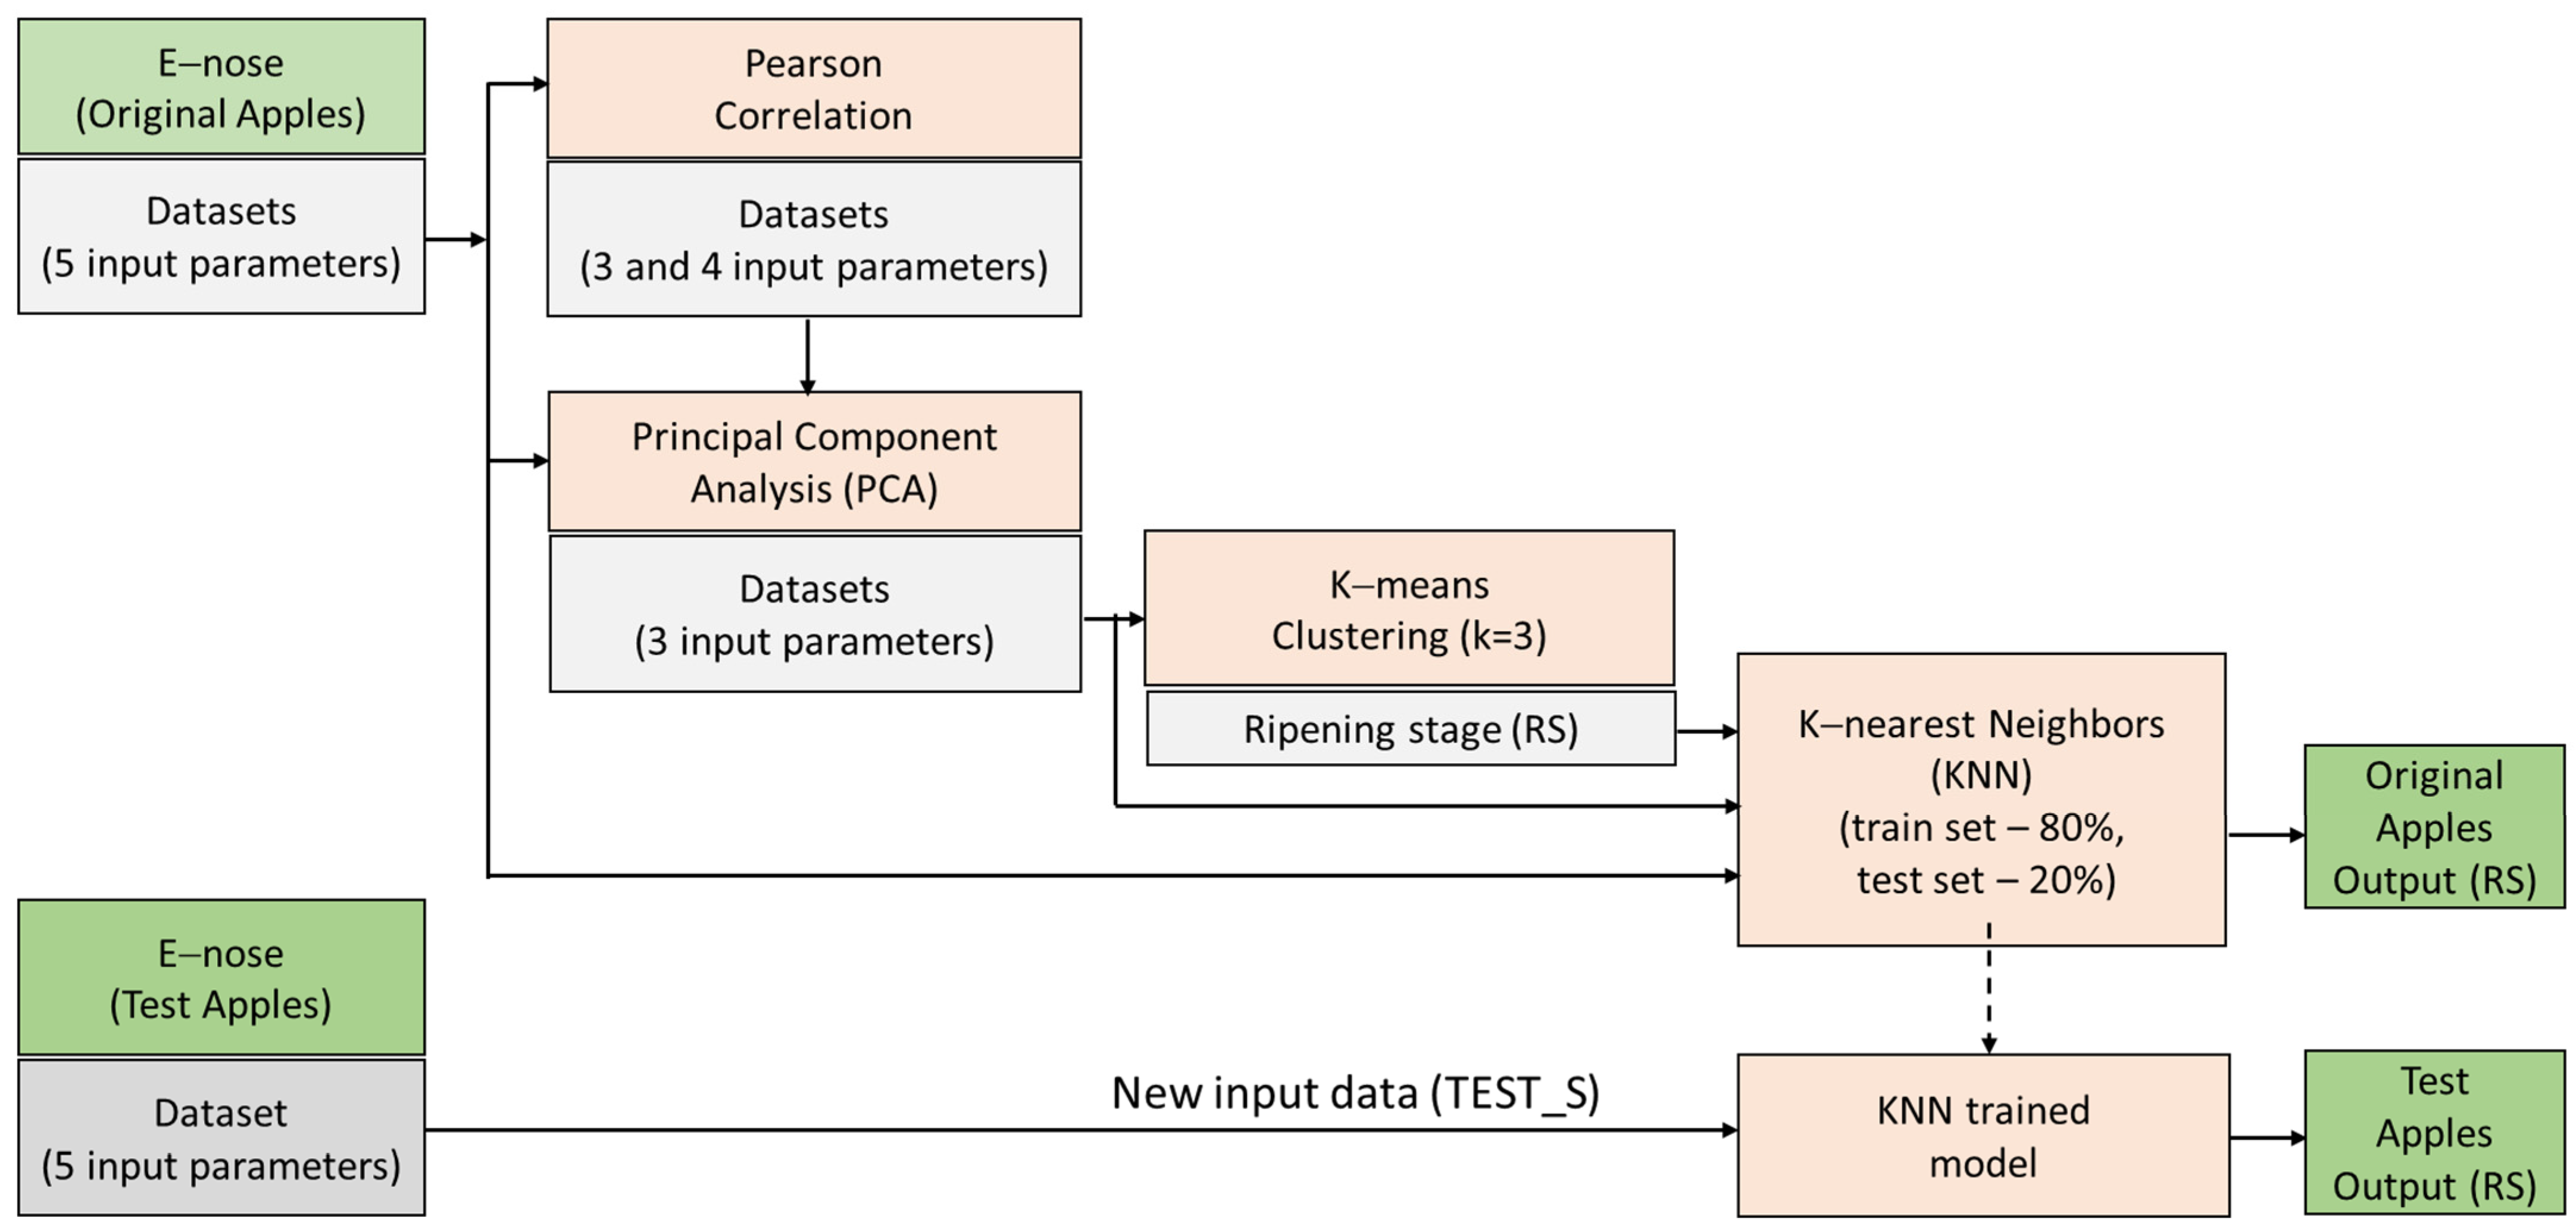
- A multimethod approach improves classification accuracy using PCA and K-means clustering to identify three ripening stages used for the evaluation of the KNN model.
2. Related Studies
3. Materials and Methods
3.1. Electronic Nose
3.2. Experimental Setup
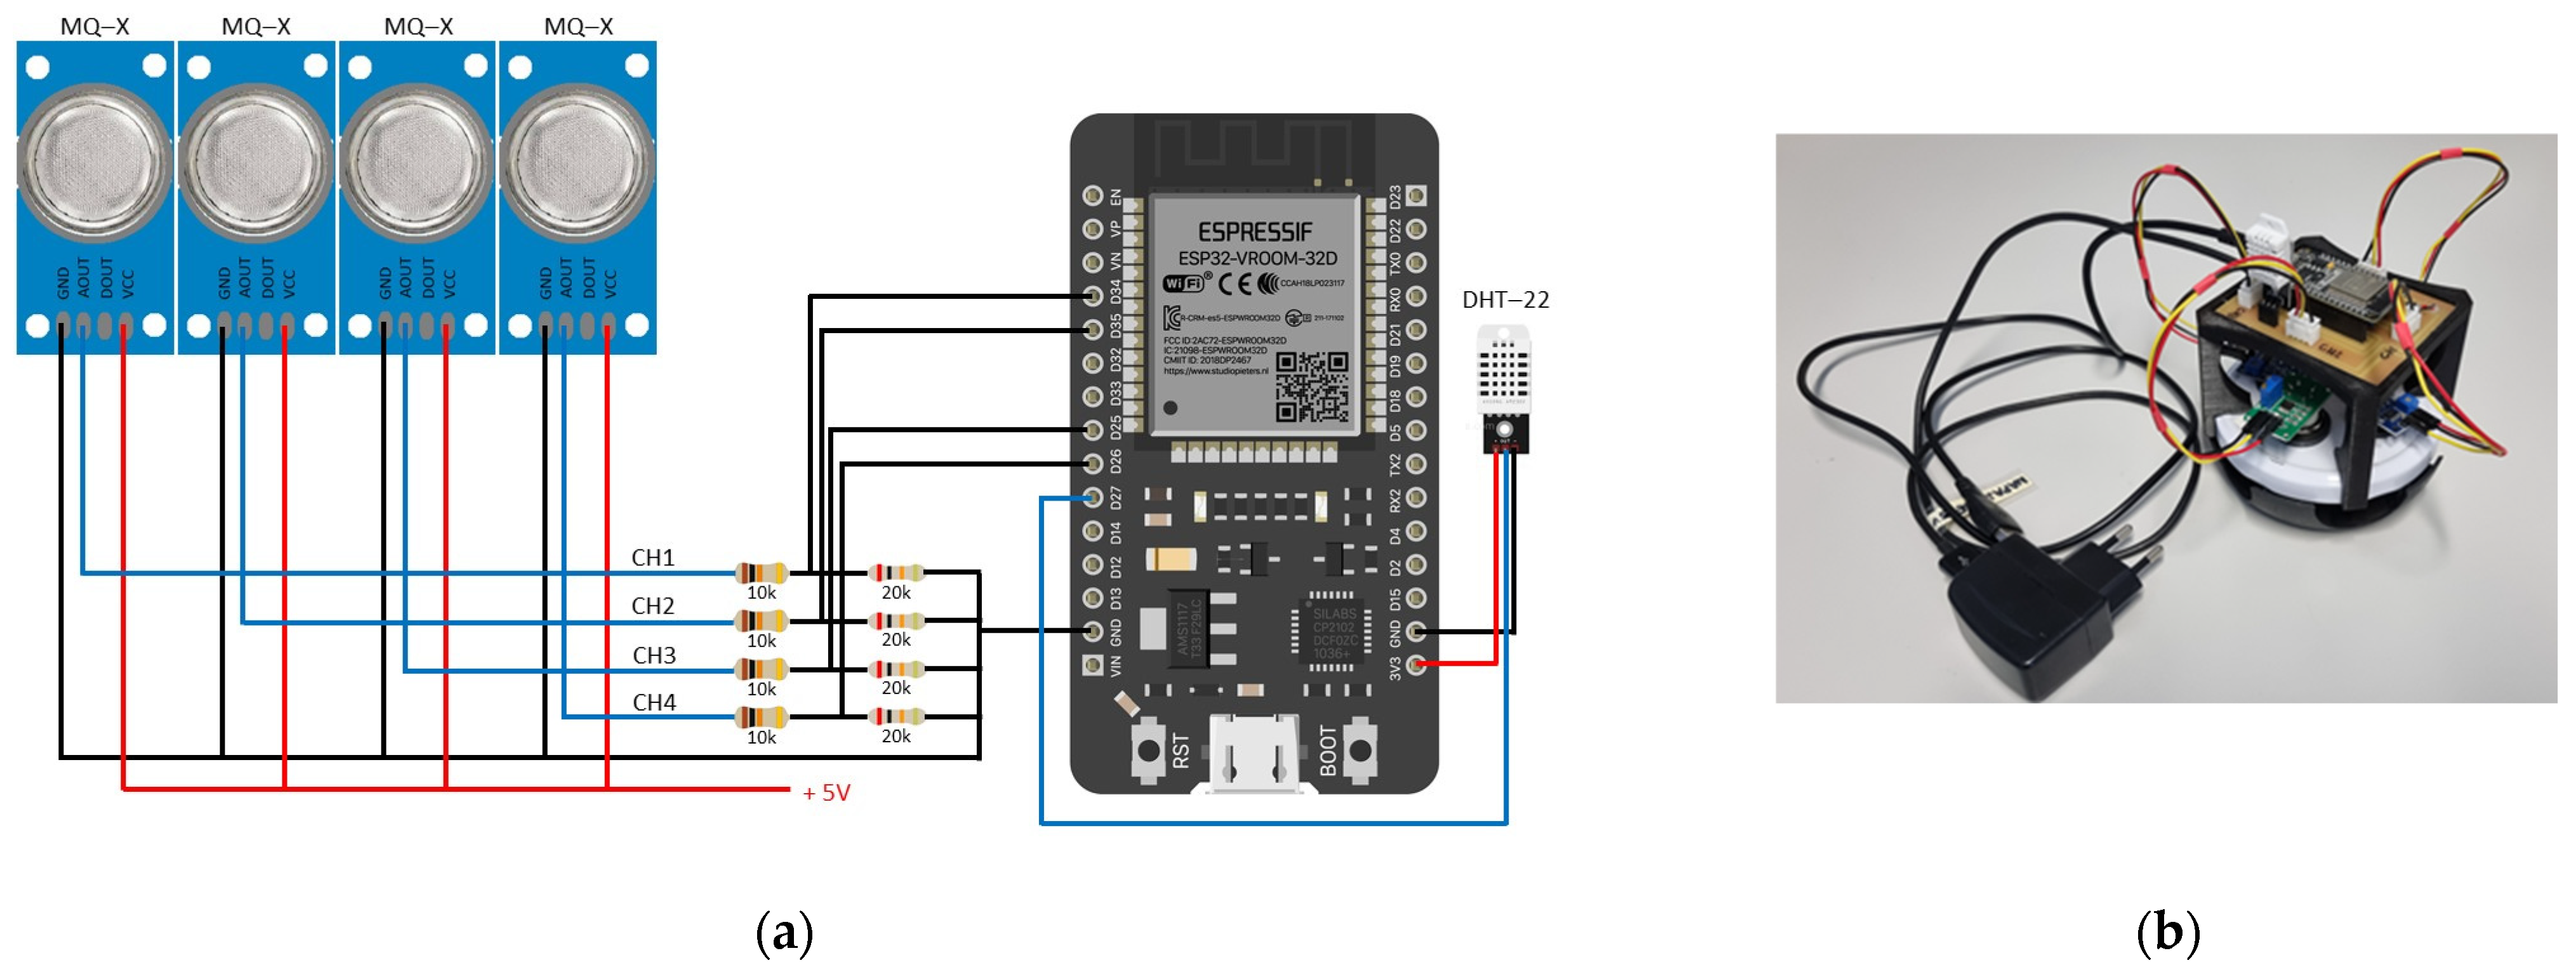
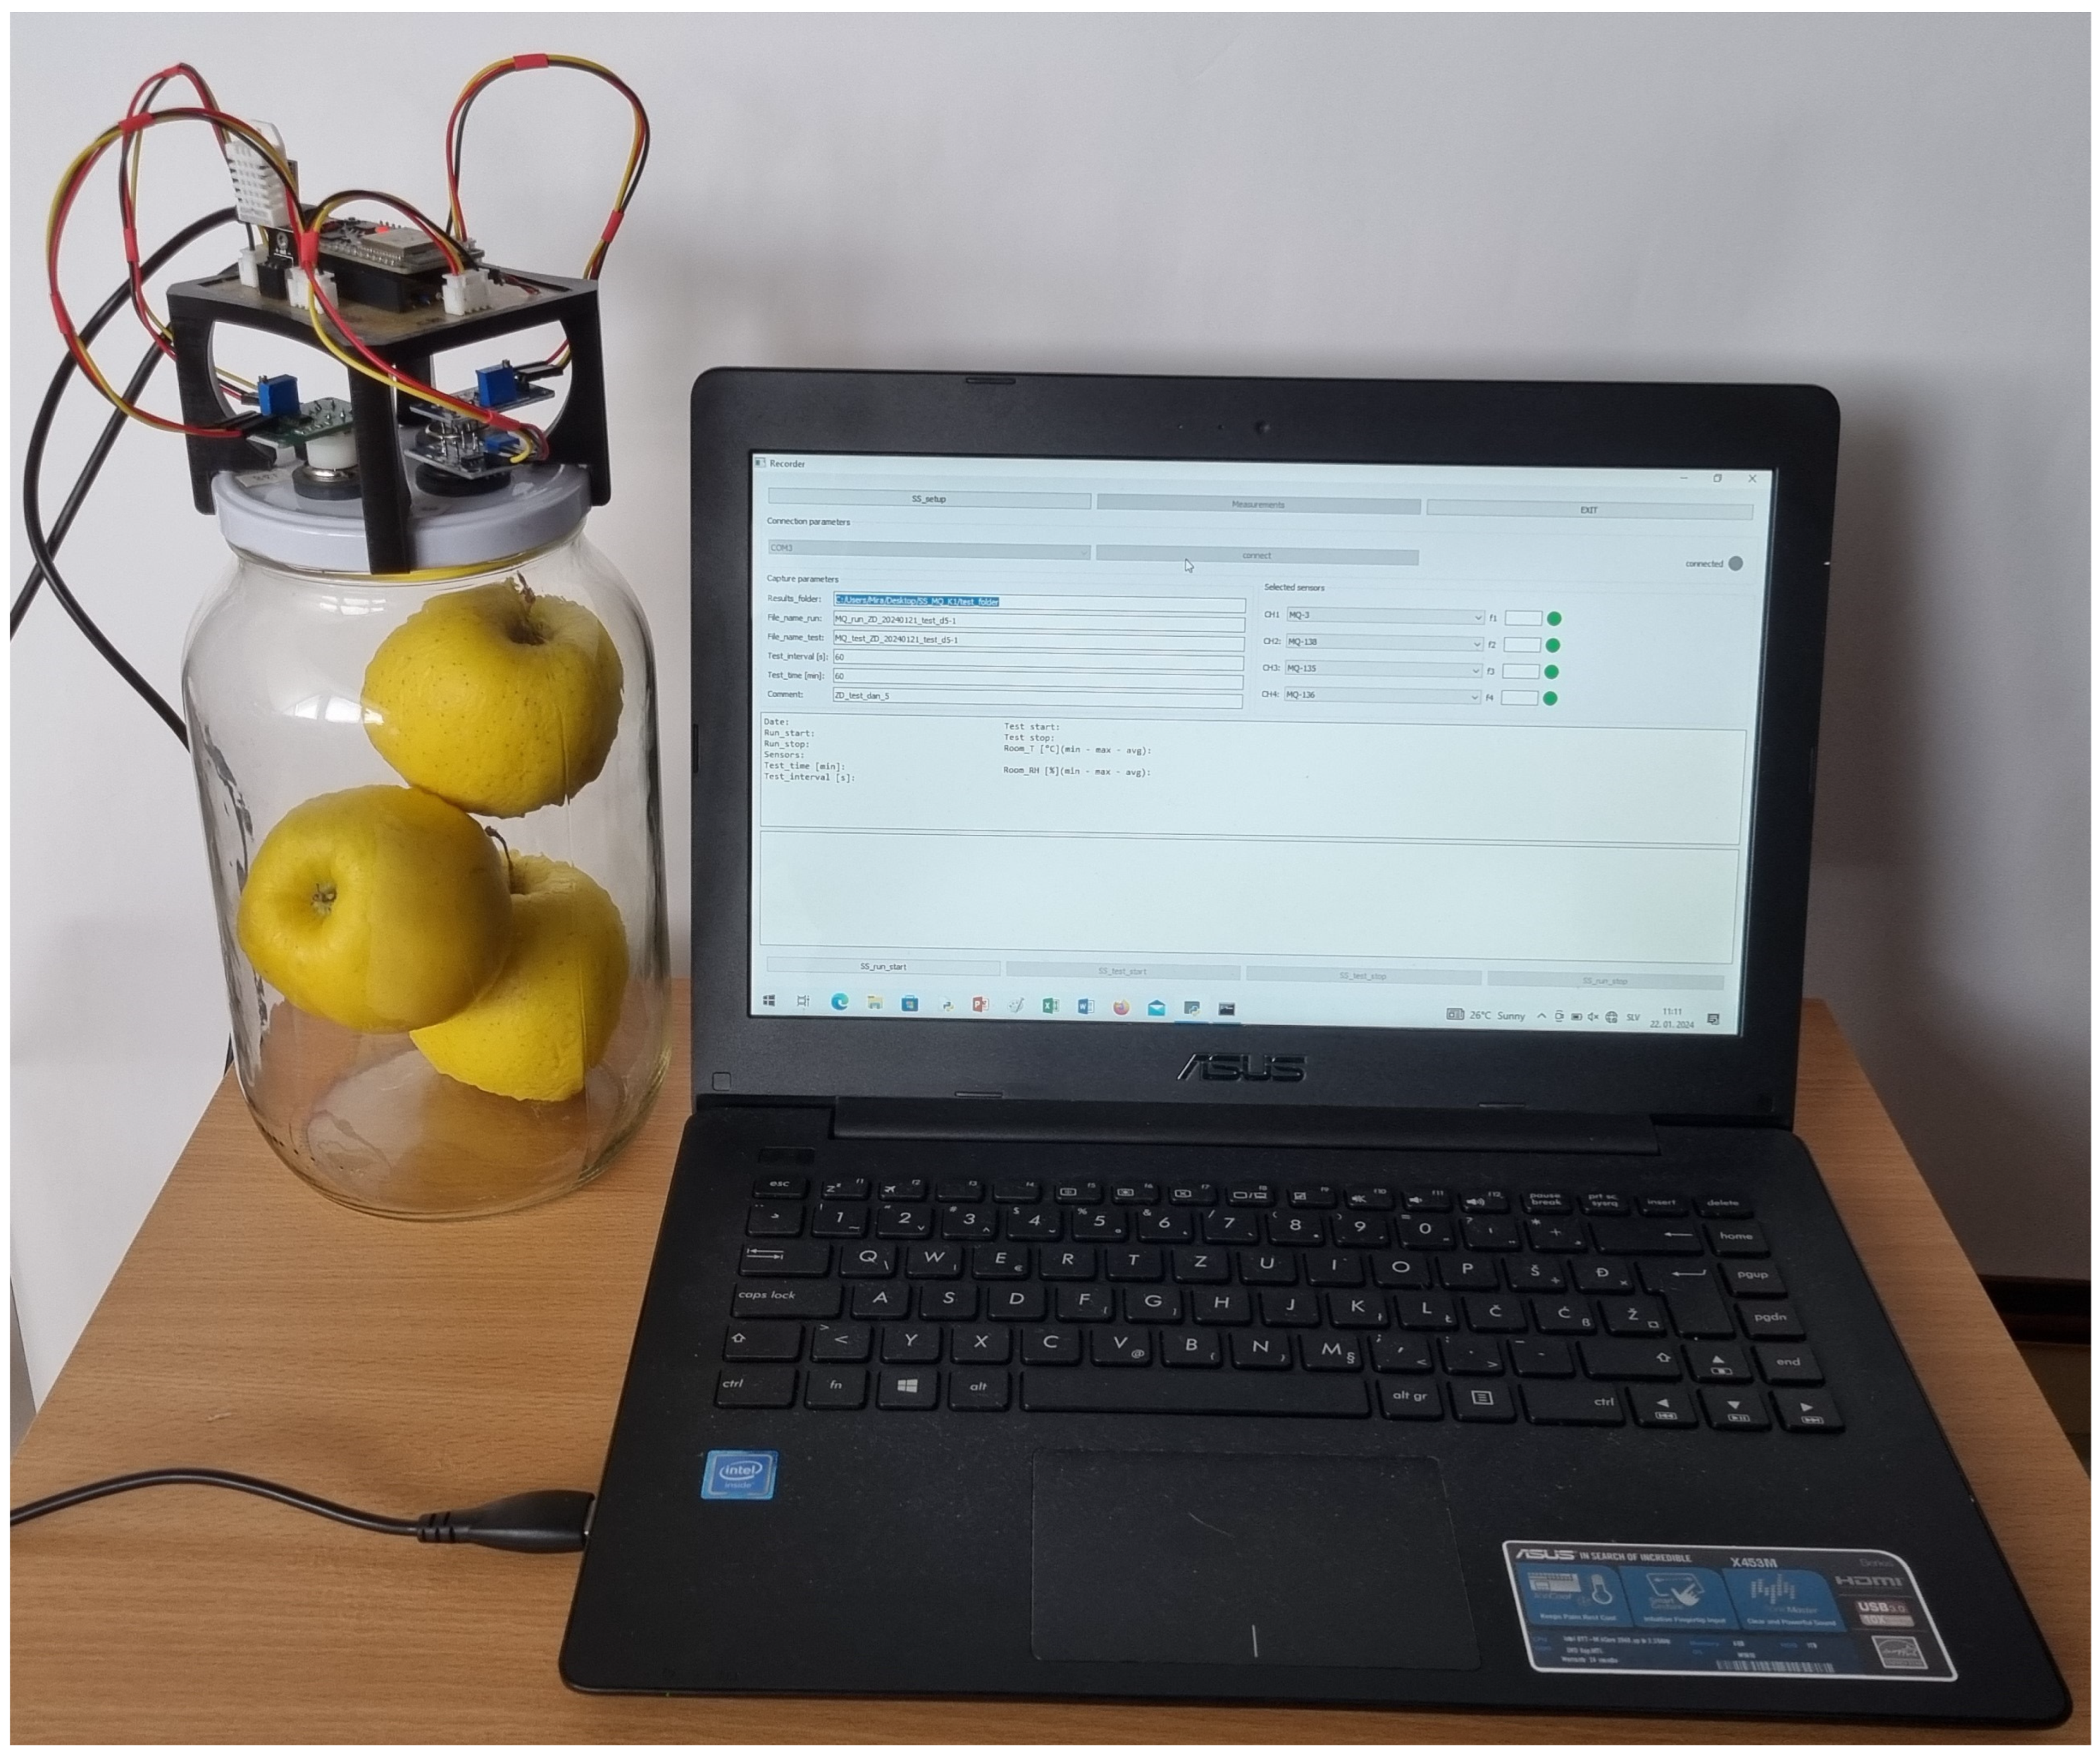
- The electronic nose is connected to the power supply to allow sensors to stabilize and to the computer to run the initialization program. Run and test parameters are defined, including: (i) file names for storing measurements, (ii) selection of sensors (MQ3, MQ135, MQ136, and MQ138), and (iii) the measurement time (60 min). The start of the run phase is confirmed in the program.
- Three apples are placed into the jar, which is then sealed with sensors on the cover. The start of the test phase is confirmed in the program.
- The end of the test phase is confirmed. Data, defined as digital values calculated based on voltage response from the analog output of sensors, is stored in a .csv file.
- The jar is opened, and the apples are removed to be used in the next analysis.
- The end of the run phase is confirmed, and the electronic nose is prepared for the next test.
3.3. Data Collection
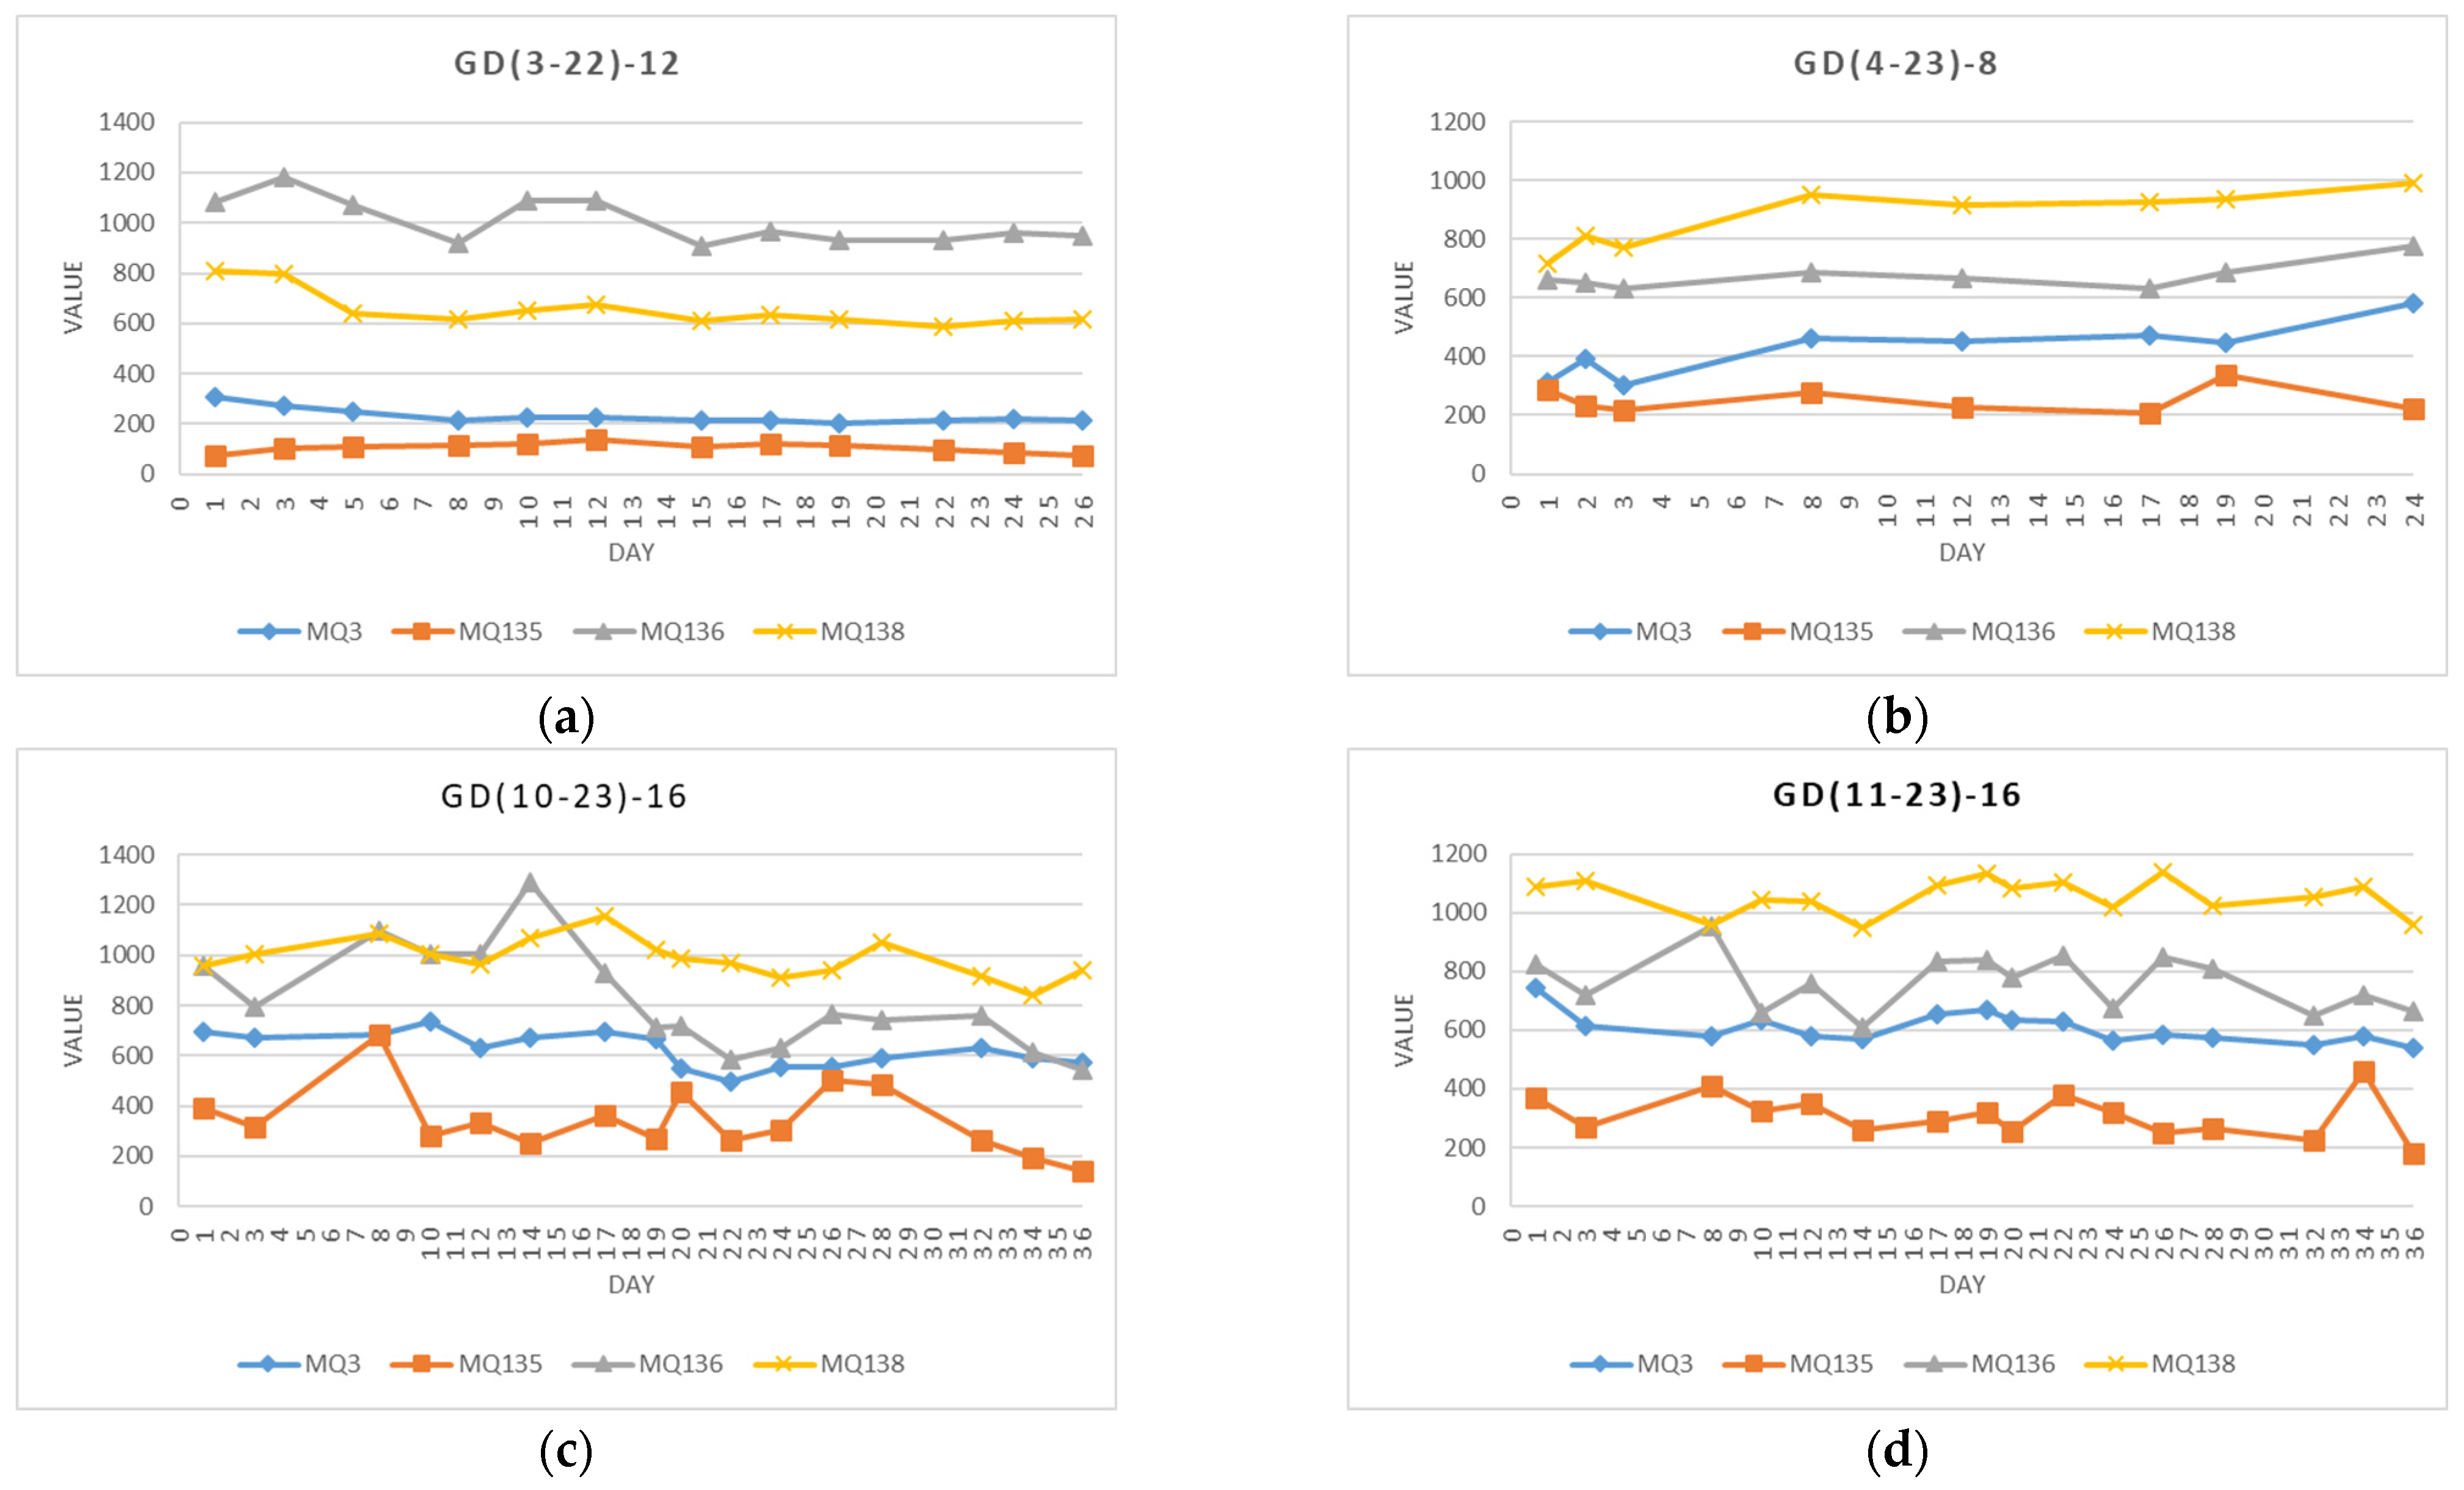
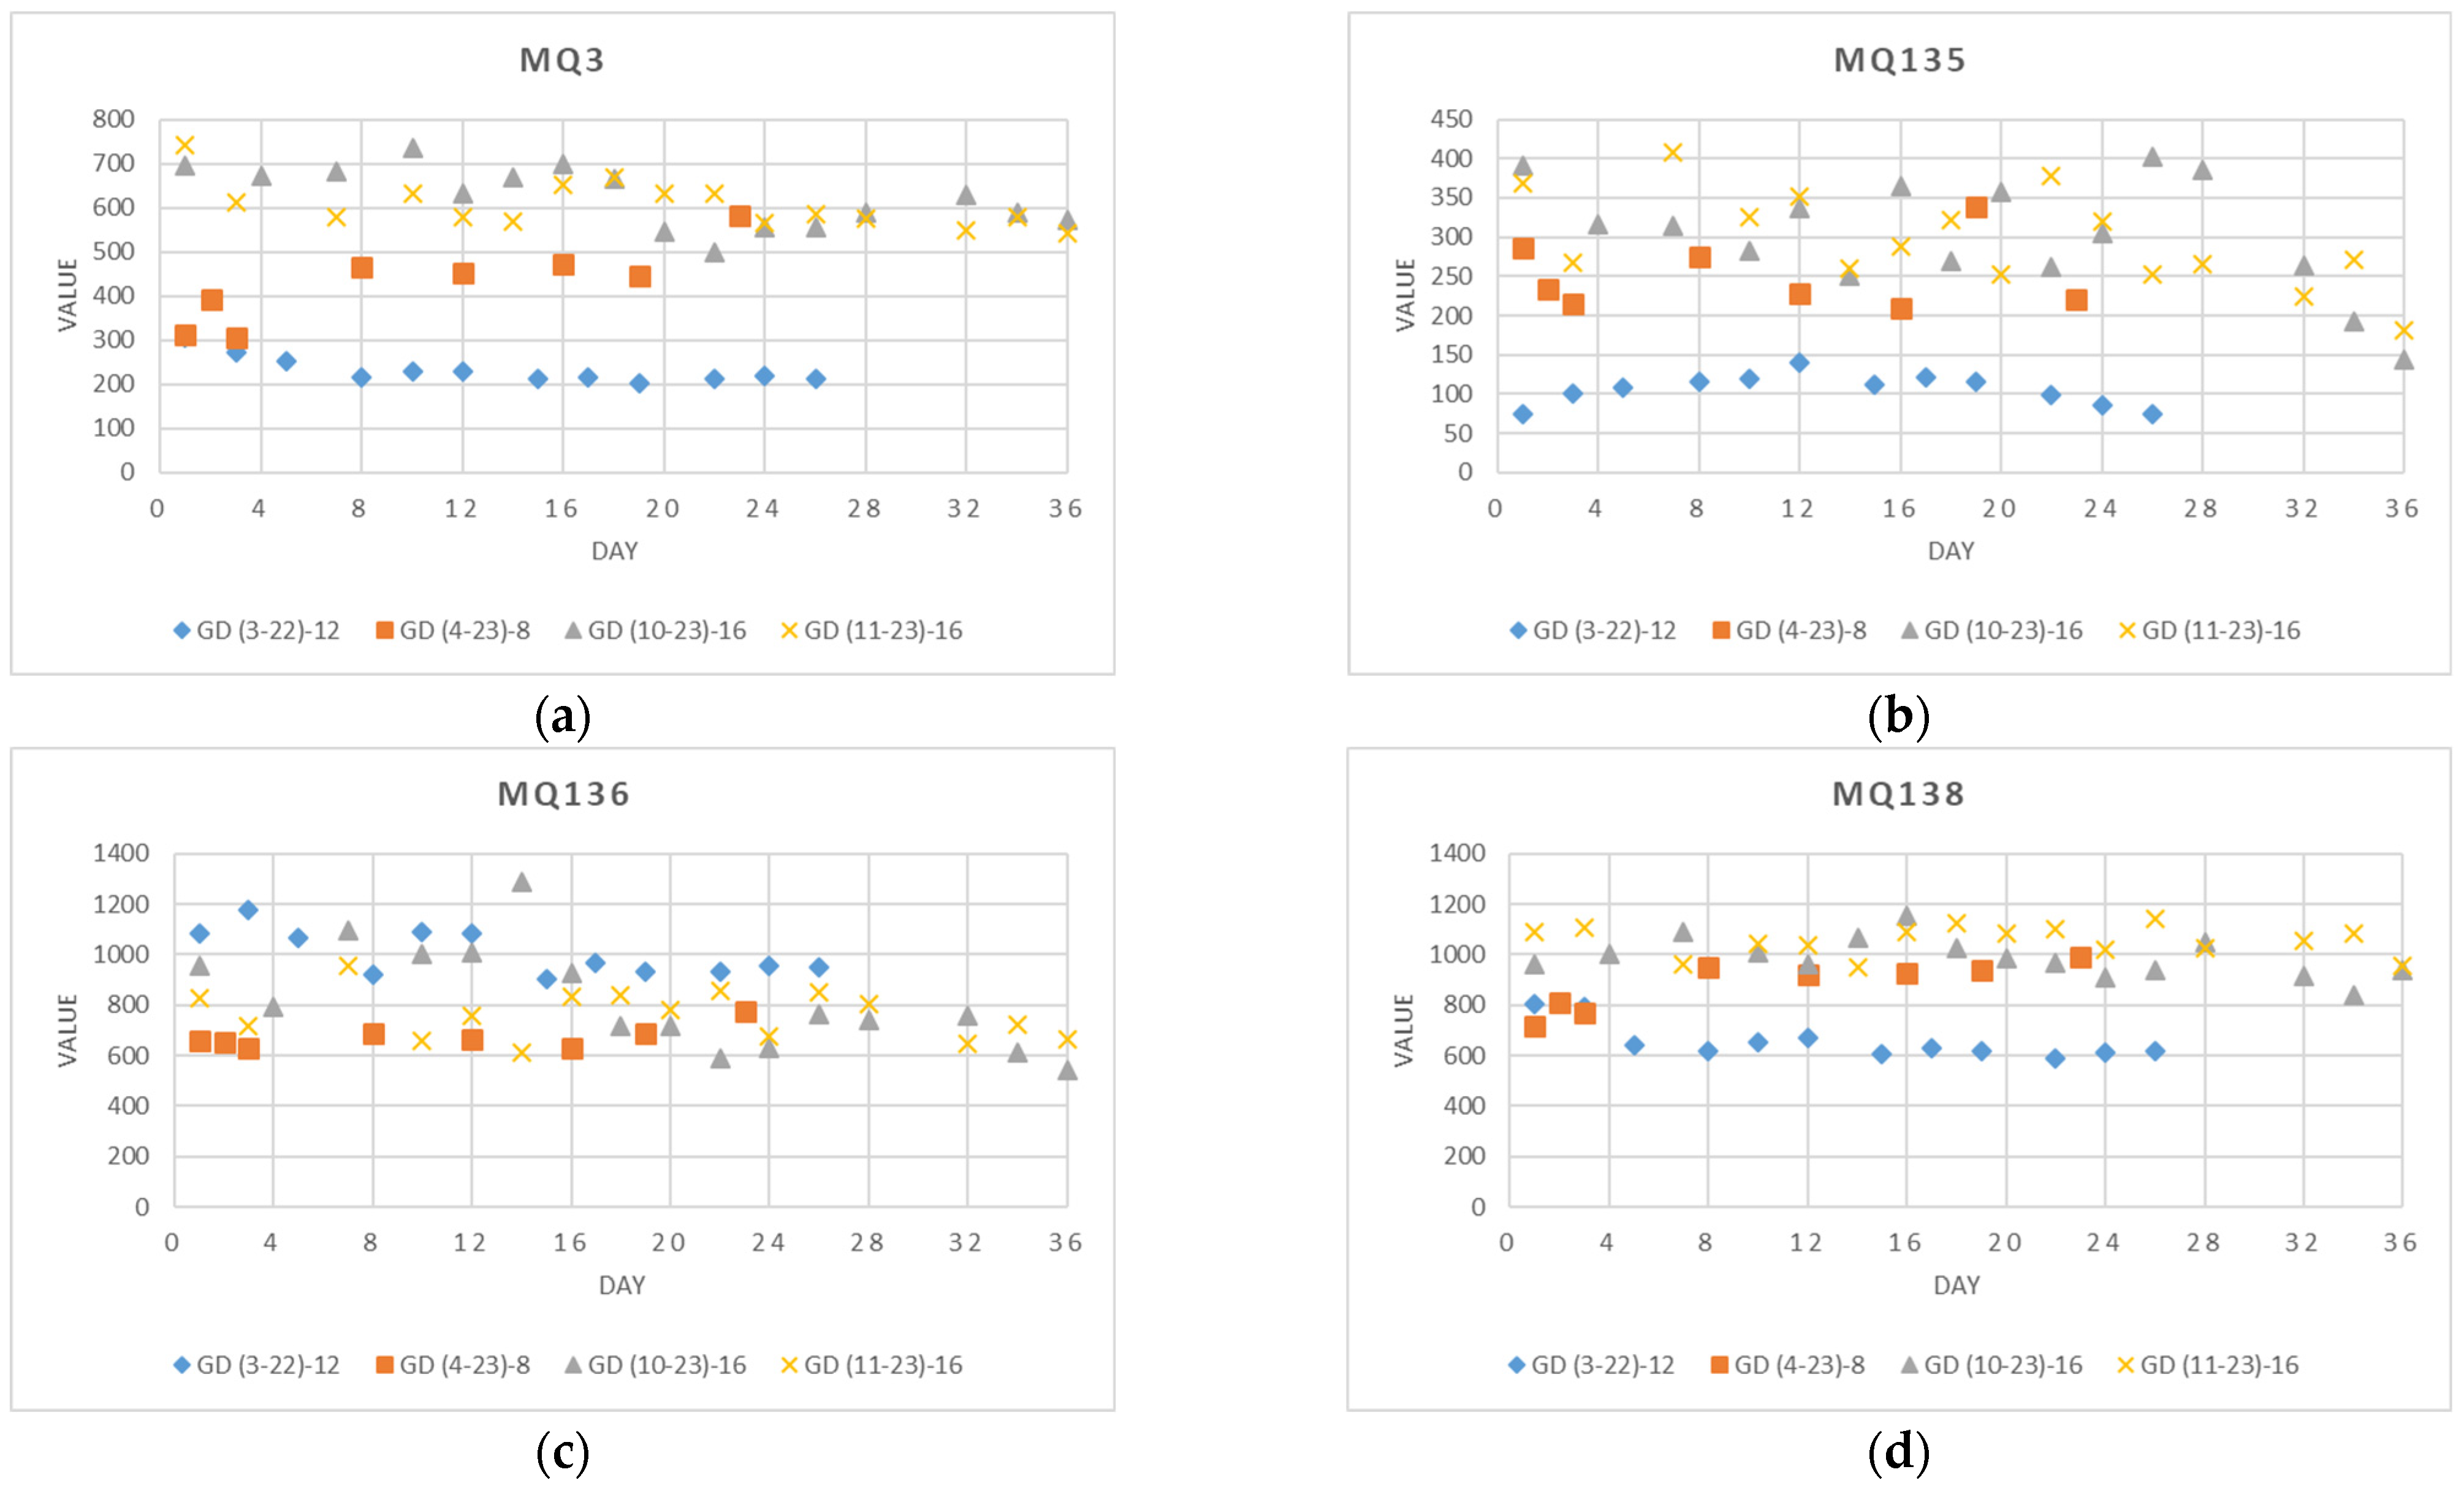
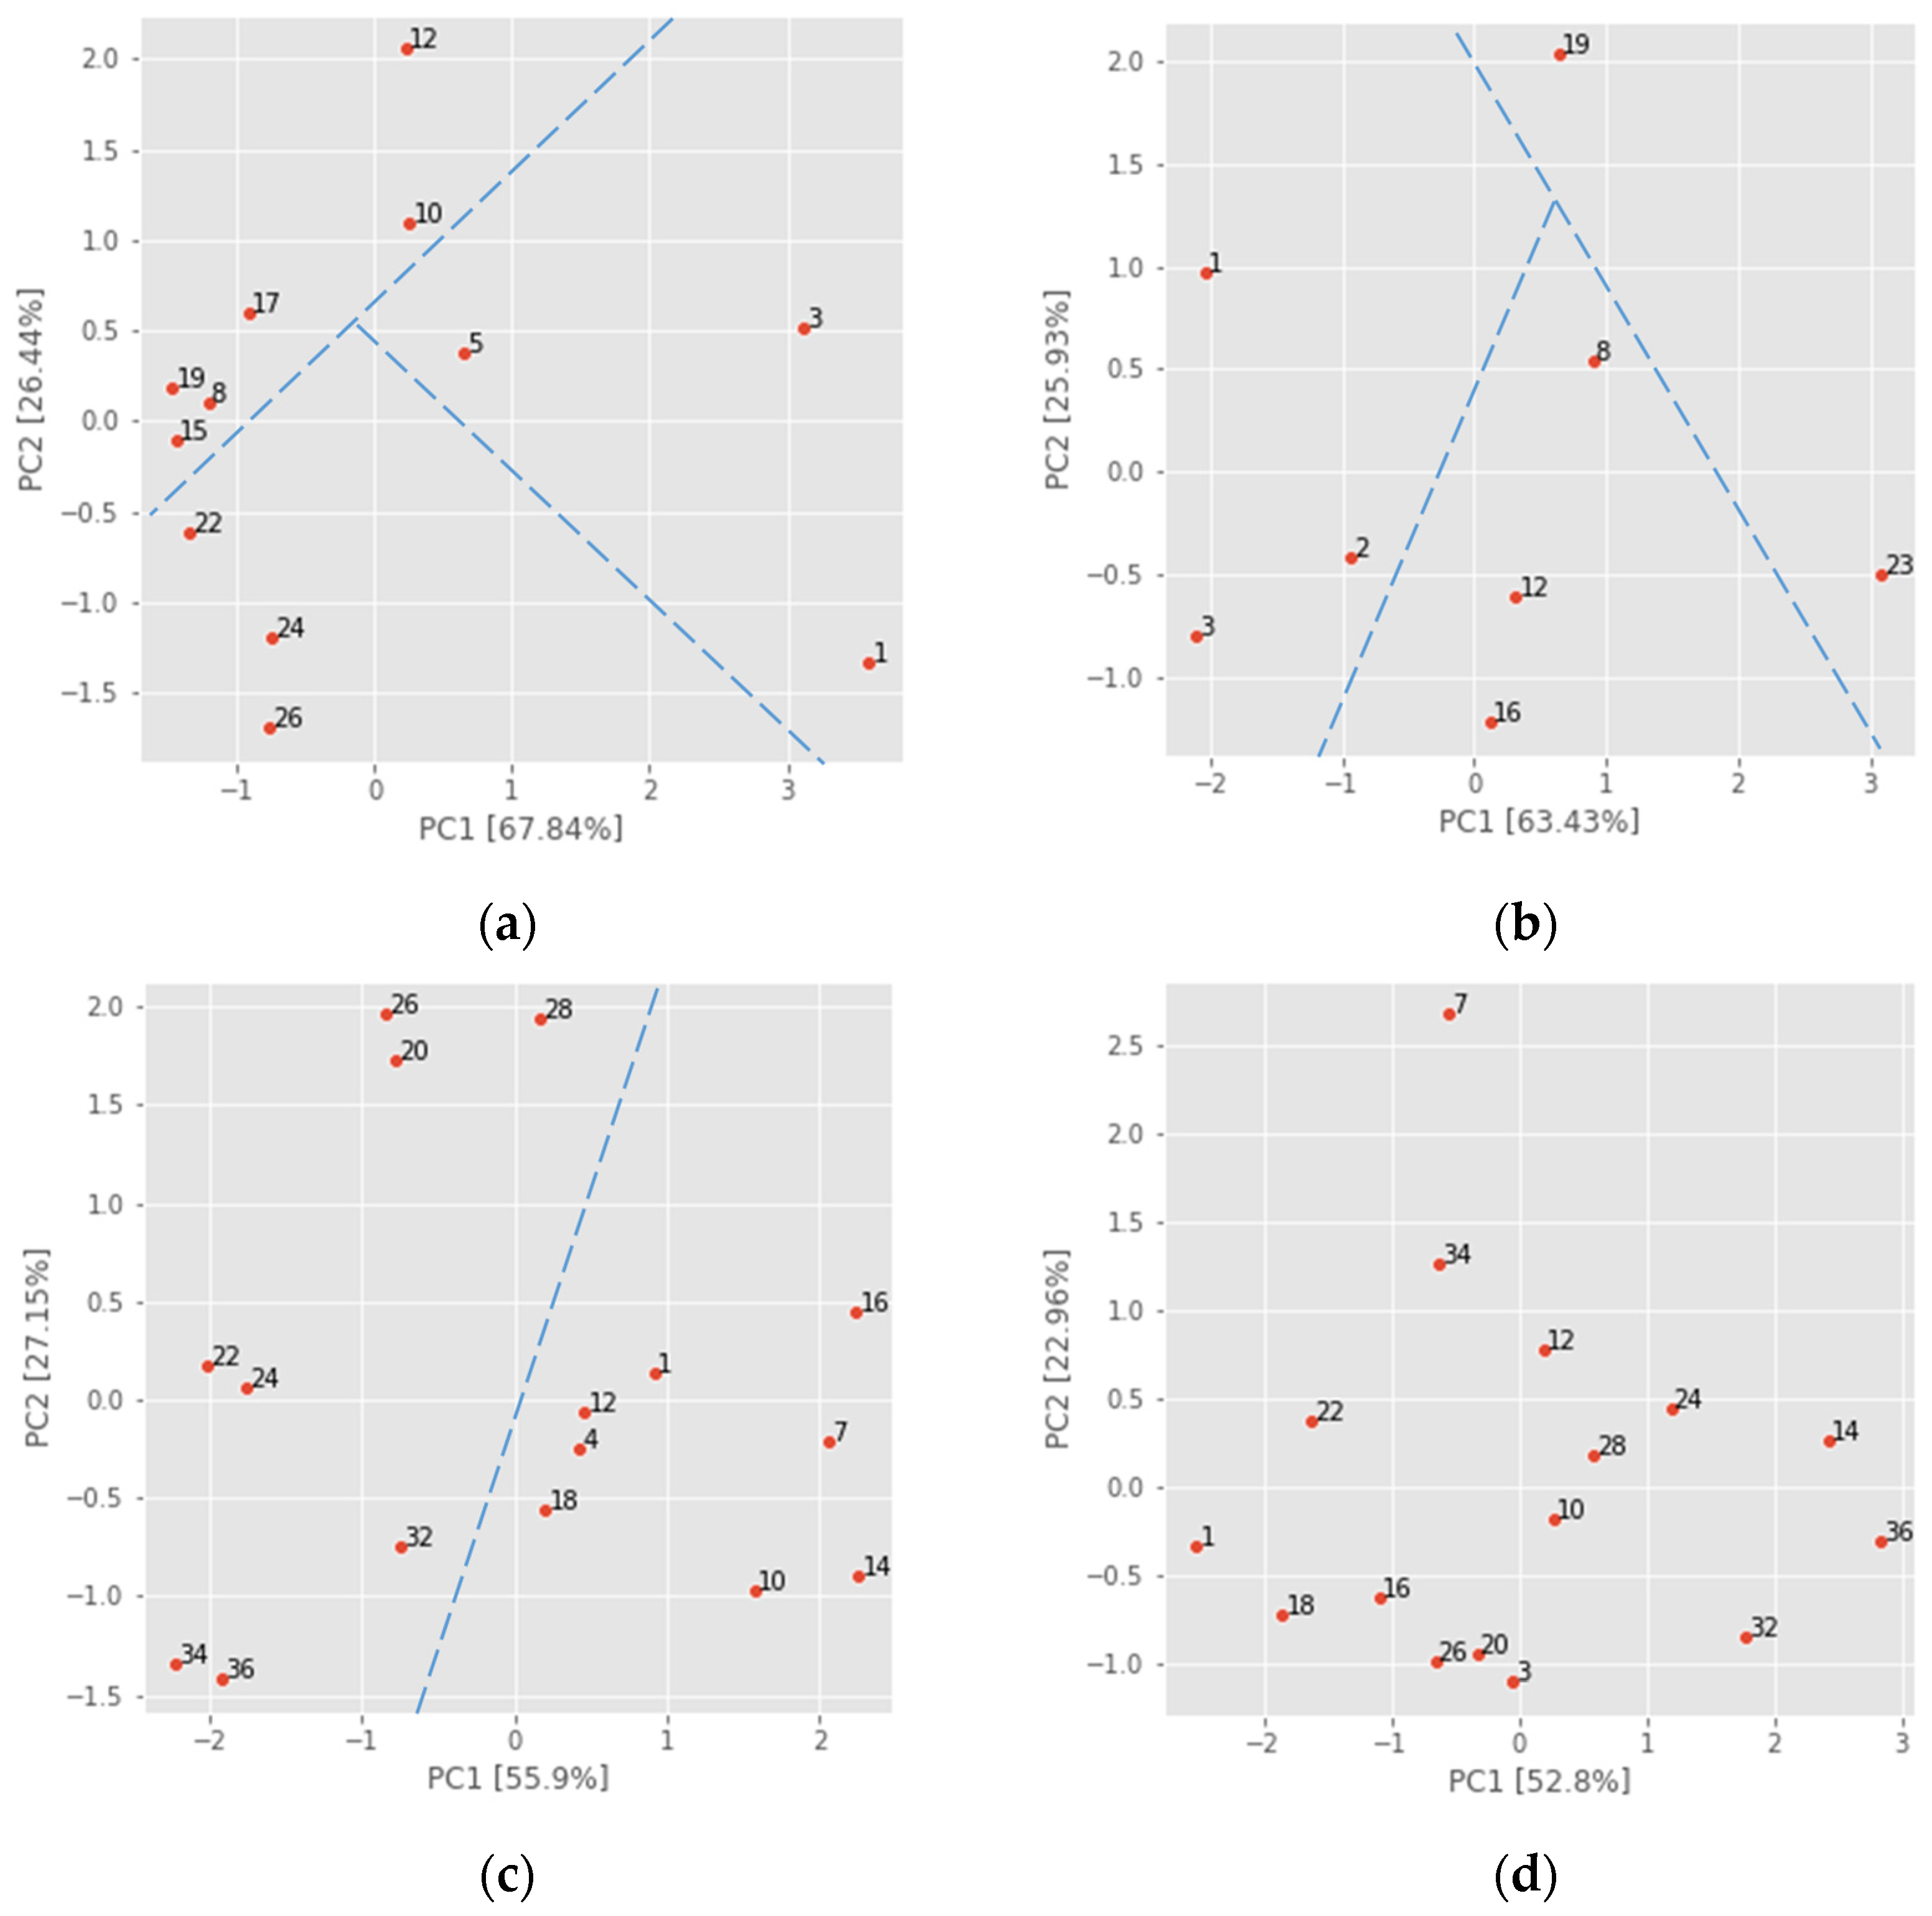
- GD(3–22)–12: Apples received direct from the cold store (T = 4 °C) from the Slovenian producers, weighing 554 g. Twelve (12) measurements were collected over 26 days (14 March 2022–8 April 2022) in intervals of two or three days (1, 3, 5, 8, 10, 12, 15, 17, 19, 22, 24, and 26). The apples were stored at an ambient temperature of T = 23 °C ± 2 °C and relative humidity RH = 31% ± 10%.
- GD(4–23)–8: Apples purchased at the supermarket (originating from Slovenia), weighing 589 g. Eight (8) measurements were collected over 23 days (3 April 2023–25 April 2023) in uneven intervals from one to four days (1, 2, 3, 8, 12, 17, 19, and 24). The apples were stored at an ambient temperature of T = 20 °C ± 2 °C and relative humidity RH = 45% ± 4%.
- GD(10–23)–16: Apples purchased at the supermarket (originating from Slovenia), weighing 570 g. Sixteen (16) measurements were collected over 36 days (4 October 2023–9 November 2023) in intervals of two, three, and four days (1, 3, 8, 10, 12, 14, 17, 19, 20, 22, 24, 26, 28, 32, 34, and 36). The apples were stored at an ambient temperature of T = 21 °C ± 2 °C and relative humidity RH = 62% ± 6%.
- GD(11–23)–16: Apples purchased at the supermarket (originating from Slovenia), weighing 591 g. Sixteen (16) measurements were collected over 36 days (7 November 2022–12 December 2022) in intervals of two, three, and four days (1, 3, 8, 10, 12, 14, 17, 19, 20, 22, 24, 26, 28, 32, 34, and 36). The apples were stored at an ambient temperature of T = 19 °C ± 1 °C and relative humidity RH = 55% ± 5%.
3.4. Methods and Analysis Approach
- Accuracy (Acc) refers to closeness, as it provides the proportion of correctly classified samples to the total number of samples.
- Precision (Prec) focuses on the confidence measured by the ratio of correctly classified samples compared to the total number of samples predicted to belong to that class.
- Recall (Rec) presents a sensitivity defined as the ratio of correctly classified samples in proportion to the total number of samples in that class.
- The F1 score is a harmonic mean of precision and recall.
4. Results and Discussion
4.1. Sensor Measurements
4.1.1. Data from Individual Experiments
4.1.2. Data from an Individual Sensor
4.1.3. Test Data
4.2. Multivariate Analysis
4.2.1. Pearson Correlation
4.2.2. Principal Component Analysis
4.3. K-Means Clustering
4.4. KNN Classification
4.4.1. Evaluation of KNN Training
4.4.2. Evaluation of a New Dataset (TEST_S)
4.4.3. Optimization of Number of Sensors
5. Conclusions
Author Contributions
Funding
Institutional Review Board Statement
Informed Consent Statement
Data Availability Statement
Acknowledgments
Conflicts of Interest
References
- Qu, R.; Chen, J.; Li, W.; Jin, S.; Jones, G.D.; Frewer, L.J. Consumers’ Preferences for Apple Production Attributes: Results of a Choice Experiment. Foods 2023, 12, 1917. [Google Scholar] [CrossRef]
- Rizzo, M.; Marcuzzo, M.; Zangari, A.; Gasparetto, A.; Albarelli, A. Fruit Ripeness Classification: A Survey. Artif. Intell. Agric. 2023, 7, 44–57. [Google Scholar] [CrossRef]
- Mohd Ali, M.; Hashim, N.; Abd Aziz, S.; Lasekan, O. Principles and Recent Advances in Electronic Nose for Quality Inspection of Agricultural and Food Products. Trends Food Sci. Technol. 2020, 99, 1–10. [Google Scholar] [CrossRef]
- Leemans, V.; Magein, H.; Destain, M.-F. The Quality of “Golden Delicious” Apples by Colour Computer Vision. IFAC Proc. Vol. 1997, 30, 175–179. [Google Scholar] [CrossRef]
- Tan, T.; Bangerth, F. Regulation of Ethylene, ACC, MACC Production, and ACC-Oxidase Activity at Various Stages of Maturity of Apple Fruit and the Effect of Exogenous Ethylene Treatment. Gartenbauwissenschaft 2000, 65, 121–128. [Google Scholar]
- Harb, J.; Streif, J.; Bangerth, K.F. Aroma Volatiles of Apples as Influenced by Ripening and Storage Procedures. Acta Hortic. 2008, 796, 93–103. [Google Scholar] [CrossRef]
- Bangerth, F.; Song, J.; Streif, J. Physiological Impacts of Fruit Ripening and Storage Conditions on Aroma Volatile Formation in Apple and Strawberry Fruit: A Review. HortSci. A Publ. Am. Soc. Hortic. Sci. 2012, 47, 4–10. [Google Scholar] [CrossRef]
- Salas, N.A.; González-Aguilar, G.A.; Jacobo-Cuéllar, J.L.; Espino, M.; Sepúlveda, D.; Guerrero, V.; Olivas, G.I.; Salas, N.A.; González-Aguilar, G.A.; Jacobo-Cuéllar, J.L.; et al. Volatile Compounds in Golden Delicious Apple Fruit (Malus dzomestica) during Cold Storage. Rev. Fitotec. Mex. 2016, 39, 159–173. [Google Scholar]
- Kassebi, S.; Korzenszky, P. The Influence of Storage Temperature on the Weight of Golden Delicious Apples. Hung. Agric. Eng. Period. Comm. Agric. Biosyst. Eng. Hung. Acad. Sci. Hung. Univ. Agric. Life Sci. Inst. Technol. 2022, 41, 5–10. [Google Scholar] [CrossRef]
- Costa, D.d.V.T.A.d.; andrade Pina, V.A. Postharvest Quality Parameters Evolution in ‘Golden Delicious’, ‘Gala’ and ‘Starking’ Apple. KnE Eng. 2020, 5, 51–62. [Google Scholar] [CrossRef]
- Kassebi, S.; Farkas, C.; Székely, L.; Géczy, A.; Korzenszky, P. Late Shelf Life Saturation of Golden Delicious Apple Parameters: TSS, Weight, and Colorimetry. Appl. Sci. 2023, 13, 159. [Google Scholar] [CrossRef]
- Molina-Corral, F.J.; Espino-Díaz, M.; Jacobo, J.L.; Mattinson, S.D.; Fellman, J.K.; Sepúlveda, D.R.; González-Aguilar, G.A.; Salas-Salazar, N.A.; Olivas, G.I. Quality Attributes during Maturation of ‘Golden Delicious’ and ‘Red Delicious’ Apples Grown in Two Geographical Regions with Different Environmental Conditions. Not. Bot. Horti Agrobot. Cluj-Napoca 2021, 49, 12241. [Google Scholar] [CrossRef]
- Lozano, L.; Iglesias, I.; Puy, J.; Echeverria, G. Performance of an Expert Sensory Panel and Instrumental Measures for Assessing Eating Fruit Quality Attributes in a Pear Breeding Programme. Foods 2023, 12, 1426. [Google Scholar] [CrossRef]
- Moallem, P.; Serajoddin, A.; Pourghassem, H. Computer Vision-Based Apple Grading for Golden Delicious Apples Based on Surface Features. Inf. Process. Agric. 2017, 4, 33–40. [Google Scholar] [CrossRef]
- Cocetta, G.; Beghi, R.; Mignani, I.; Spinardi, A. Nondestructive Apple Ripening Stage Determination Using the Delta Absorbance Meter at Harvest and after Storage. HortTechnology 2017, 27, 54–64. [Google Scholar] [CrossRef]
- Cárdenas-Pérez, S.; Chanona-Pérez, J.; Méndez-Méndez, J.V.; Calderón-Domínguez, G.; López-Santiago, R.; Perea-Flores, M.J.; Arzate-Vázquez, I. Evaluation of the Ripening Stages of Apple (Golden delicious) by Means of Computer Vision System. Biosyst. Eng. 2017, 159, 46–58. [Google Scholar] [CrossRef]
- Rodriguez, M.; Pastor, F.; Ugarte, W. Classification of Fruit Ripeness Grades Using a Convolutional Neural Network and Data Augmentation. In Proceedings of the 2021 28th Conference of Open Innovations Association (FRUCT), Moscow, Russia, 27–29 January 2021; pp. 374–380. [Google Scholar] [CrossRef]
- Bratu, A.-M.; Popa, C.; Bojan, M.; Logofatu, P.C.; Petrus, M. Non-Destructive Methods for Fruit Quality Evaluation. Sci. Rep. 2021, 11, 7782. [Google Scholar] [CrossRef]
- Addanki, M.; Patra, P.; Kandra, P. Recent Advances and Applications of Artificial Intelligence and Related Technologies in the Food Industry. Appl. Food Res. 2022, 2, 100126. [Google Scholar] [CrossRef]
- Ahmad, F.; Zaidi, S.; Arshad, M. Postharvest Quality Assessment of Apple during Storage at Ambient Temperature. Heliyon 2021, 7, e07714. [Google Scholar] [CrossRef]
- Azadnia, R.; Fouladi, S.; Jahanbakhshi, A. Intelligent Detection and Waste Control of Hawthorn Fruit Based on Ripening Level Using Machine Vision System and Deep Learning Techniques. Results Eng. 2023, 17, 100891. [Google Scholar] [CrossRef]
- Gao, Y.; Jiao, L.; Jiao, F.; Dong, D. Non-Intrusive Prediction of Fruit Spoilage and Storage Time via Detecting Volatiles in Sealed Packaging Using Laser Spectroscopy. LWT 2022, 155, 112930. [Google Scholar] [CrossRef]
- Benedetti, S.; Spinardi, A.; Mignani, I.; Buratti, S. Non-Destructive Evaluation of Sweet Cherry (Prunus avium L.) Ripening Using an Electronic Nose. Ital. J. Food Sci. 2010, 22, 299–306. Available online: https://www.researchgate.net/publication/281601166_Non-destructive_evaluation_of_sweet_cherry_Prunus_avium_L_ripening_using_an_electronic_nose (accessed on 16 January 2024).
- Xi, P.; Zhu, D.; Shen, Y.; Ren, X.; Zhang, Y. Construction of Shelf-Life Prediction Model for Golden Delicious Apple Based on Electronic Nose. J. Phys. Conf. Ser. 2021, 1952, 042009. [Google Scholar] [CrossRef]
- Scott, S.; James, D.; Ali, Z. Data Analysis for Electronic Nose Systems. Microchim. Acta 2006, 156, 183–207. [Google Scholar] [CrossRef]
- Wilson, A.; Baietto, M. Applications and Advances in Electronic-Nose Technologies. Sensors 2009, 9, 5099. [Google Scholar] [CrossRef]
- Tan, J.; Xu, J. Applications of Electronic Nose (e-Nose) and Electronic Tongue (e-Tongue) in Food Quality-Related Properties Determination: A Review. Artif. Intell. Agric. 2020, 4, 104–115. [Google Scholar] [CrossRef]
- Sanaeifar, A.; Mohtasebi, S.; Ghasemi-Varnamkhasti, M.; Ahmadi, H.; Lozano, J. Development and Application of a New Low Cost Electronic Nose for the Ripeness Monitoring of Banana Using Computational Techniques (PCA, LDA, SIMCA, and SVM). Czech J. Food Sci. 2014, 32, 538–548. [Google Scholar] [CrossRef]
- Ding, Q.; Zhao, D.; Liu, J.; Yang, Z. Detection of Fruits in Warehouse Using Electronic Nose. MATEC Web Conf. 2018, 232, 04035. [Google Scholar] [CrossRef][Green Version]
- Lim, J.; Linsangan, N.; Cruz, F.R.; Chung, W.-Y. Temperature Compensated Electronic Nose for Fruit Ripeness Determination Using Component Correction Principal Component Analysis. Int. J. Comput. Commun. Eng. 2016, 5, 331–340. [Google Scholar] [CrossRef]
- Baietto, M.; Wilson, A.D. Electronic-Nose Applications for Fruit Identification, Ripeness and Quality Grading. Sensors 2015, 15, 899–931. [Google Scholar] [CrossRef]
- Praveena, S.M. Evaluation of fruit ripeness using electronic nose. Int. J. Adv. Inf. Sci. Technol. (IJAIST) 2017, 6, 1–5. [Google Scholar]
- Tyagi, P.; Semwal, R.; Sharma, A.; Tiwary, U.S.; Varadwaj, P. E-Nose: A Low-Cost Fruit Ripeness Monitoring System. J. Agric. Eng. 2023, 54, 31–41. [Google Scholar] [CrossRef]
- Infante, R.; Rubio, P.; Meneses, C.; Contador, L. Ripe Nectarines Segregated through Sensory Quality Evaluation and Electronic Nose Assessment. Fruits 2011, 66, 109–119. [Google Scholar] [CrossRef]
- Rivai, M.; Budiman, F.; Purwanto, D.; Adil Al Baid, M.S.; Tukadi; Aulia, D. Discrimination of Durian Ripeness Level Using Gas Sensors and Neural Network. Procedia Comput. Sci. 2022, 197, 677–684. [Google Scholar] [CrossRef]
- Rus, M. Elektronski Nos za Spremljanje Kakovosti Živil. Bachelor’s Thesis, Univerza v Ljubljani, Fakulteta za Računalništvo in Informatiko, Ljubljana, Slovenia, 2020. [Google Scholar]
- ESP32-DevKitC V4 Getting Started Guide—ESP32—ESP-IDF Programming Guide Latest Documentation. Available online: https://docs.espressif.com/projects/esp-idf/en/latest/esp32/hw-reference/esp32/get-started-devkitc.html (accessed on 7 July 2024).
- Industries, A. DHT22 Temperature-Humidity Sensor + Extras. Available online: https://www.adafruit.com/product/385 (accessed on 16 January 2024).
- MQ-3 Datasheet | GAS SENSOR. Available online: https://datasheetspdf.com/datasheet/MQ-3.html (accessed on 16 January 2024).
- MQ135 Datasheet | Gas Sensor. Available online: https://datasheetspdf.com/datasheet/MQ135.html (accessed on 16 January 2024).
- MQ-136 Datasheet, GAS SENSOR. Available online: https://datasheetspdf.com/pdf/904646/HANWEIELECTRONICS/MQ-136/1 (accessed on 16 January 2024).
- MQ-138 Datasheet | GAS SENSOR. Available online: https://datasheetspdf.com/datasheet/MQ-138.html (accessed on 16 January 2024).
- Mishra, S.; Sarkar, U.; Taraphder, S.; Datta, S.; Swain, D.; Saikhom, R.; Panda, S.; Laishram, M. Principal Component Analysis. Int. J. Livest. Res. 2017, 2, 433–459. [Google Scholar] [CrossRef]
- Morissette, L.; Chartier, S. The K-Means Clustering Technique: General Considerations and Implementation in Mathematica. Tutor. Quant. Methods Psychol. 2013, 9, 15–24. [Google Scholar] [CrossRef]
- What Is the K-Nearest Neighbors Algorithm? | IBM. Available online: https://www.ibm.com/topics/knn (accessed on 29 July 2024).
- Accuracy, Precision, Recall & F1 Score Interpretation of Performance Measures | Download Free PDF | Accuracy and Precision | Statistics. Available online: https://www.scribd.com/document/557372014/Accuracy-Precision-Recall-F1-Score-Interpretation-of-Performance-Measures (accessed on 29 July 2024).
- Huč, A.; Vidrih, R.; Trebar, M. Determination of Pears Ripening Stages Based on Electrochemical Ethylene Sensor. IEEE Sens. J. 2020, 20, 13976–13983. [Google Scholar] [CrossRef]
- Qiao, J.; Su, G.; Liu, C.; Zou, Y.; Chang, Z.; Yu, H.; Wang, L.; Guo, R. Study on the Application of Electronic Nose Technology in the Detection for the Artificial Ripening of Crab Apples. Horticulturae 2022, 8, 386. [Google Scholar] [CrossRef]
- Chen, L.-Y.; Wu, C.-C.; Chou, T.-I.; Chiu, S.-W.; Tang, K.-T. Development of a Dual MOS Electronic Nose/Camera System for Improving Fruit Ripeness Classification. Sensors 2018, 18, 3256. [Google Scholar] [CrossRef]
- Zou, X.; Wang, C.; Luo, M.; Ren, Q.; Liu, Y.; Zhang, S.; Bai, Y.; Meng, J.; Zhang, W.; Su, S.W. Design of Electronic Nose Detection System for Apple Quality Grading Based on Computational Fluid Dynamics Simulation and K-Nearest Neighbor Support Vector Machine. Sensors 2022, 22, 2997. [Google Scholar] [CrossRef]
| Name | Target Odors | Sensitivity Ranges (ppm) |
|---|---|---|
| MQ3 | Alcohol (ethanol, methanol) | 0.05–10 |
| MQ135 | NH3, benzene, hydrogen | 10–10,000 |
| MQ136 | Hydrogen sulfide, sulfur | 1–200 |
| MQ138 | Toluene, acetone, ethanol, hydrogen | 5–500 |
| New Dataset | Original Datasets | N |
|---|---|---|
| GD(22–23)–spring | GD(3–22)–12, GD(4–23)–8 | 20 |
| GD(22–23)–autumn | GD(10–23)–16, GD(11–23)–16 | 32 |
| GD(22–23)–market | GD(4–23)–8, GD(10–23)–16, GD(11–23)–16 | 40 |
| GD(22–23)–all | GD(3–22)–12, GD(4–23)–8, GD(10–23)–, GD(11–23)–16 | 52 |
| GD(22–23)–24d | GD(3–22)–12(11 *), GD(4–23)–8, GD(10–23)–16(11 *), GD(11–23)–16(11 *) | 41 |
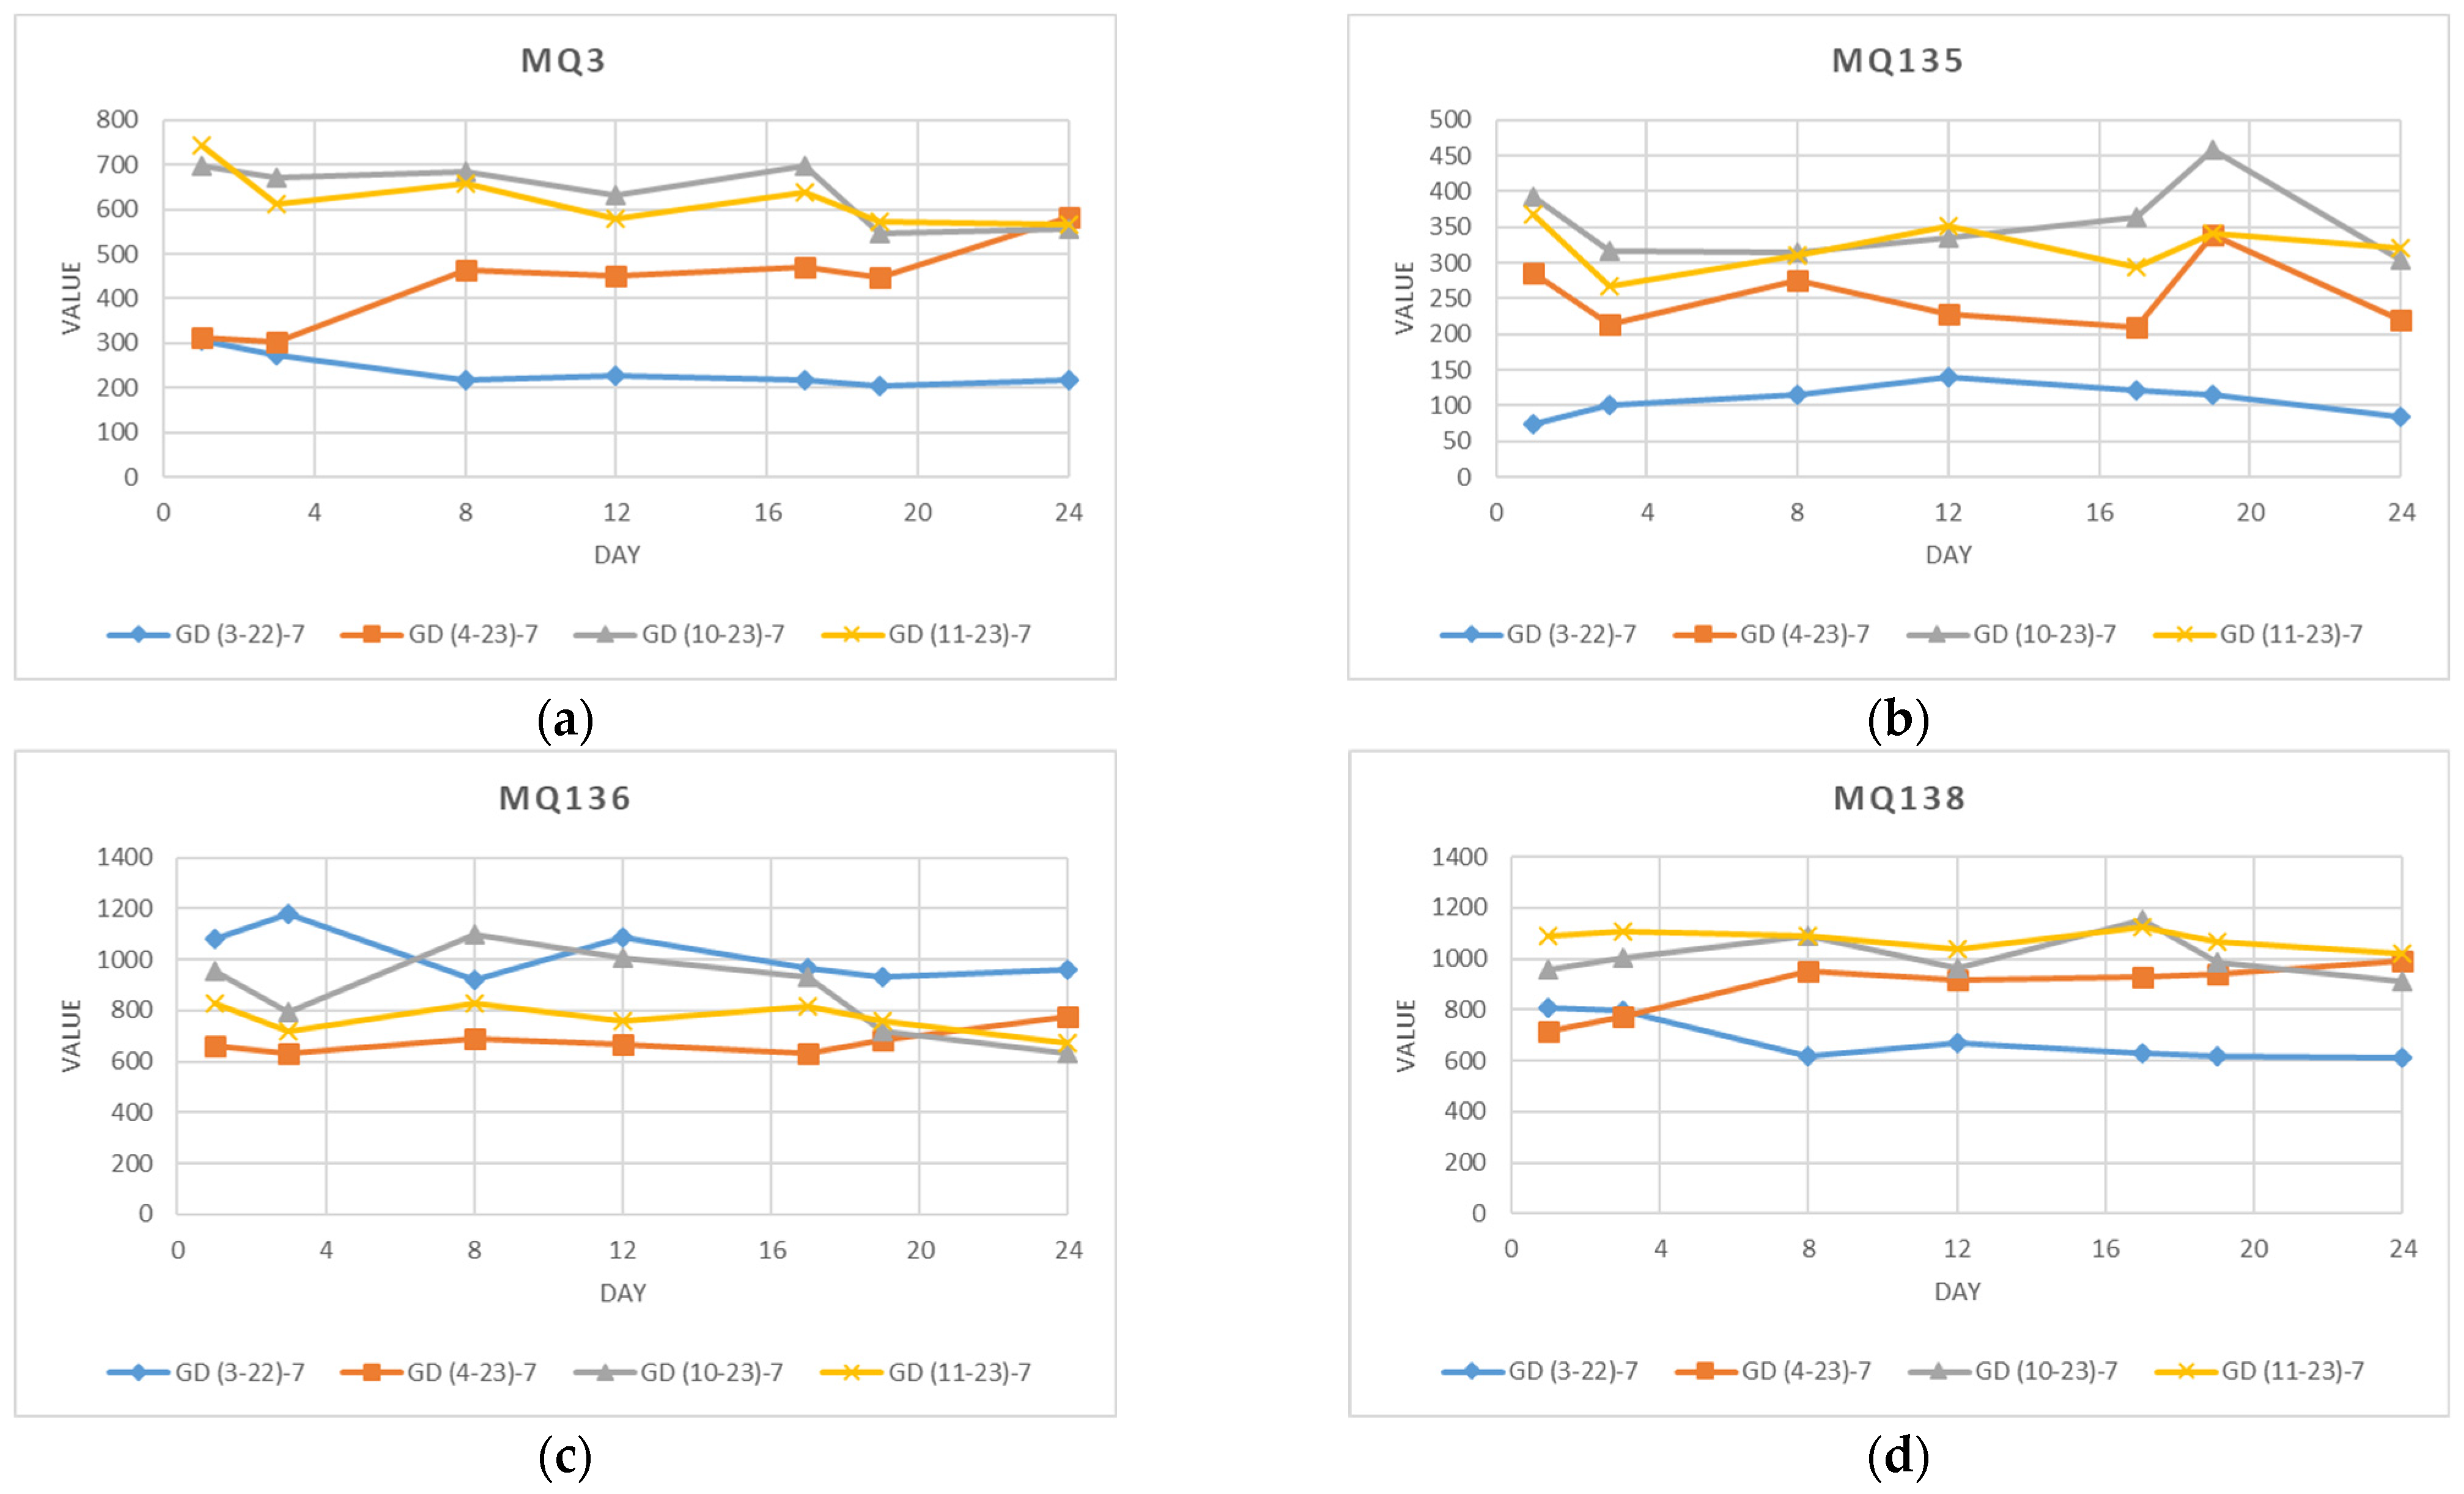
| GD(22–23)–24d–7m | GD(3–22)–7, GD(4–23)–7, GD(10–23)–7, GD(11–23)–7 | 28 |
| Experiments | Purchase | Instance 1 | Instance 2 | Instance 3 |
|---|---|---|---|---|
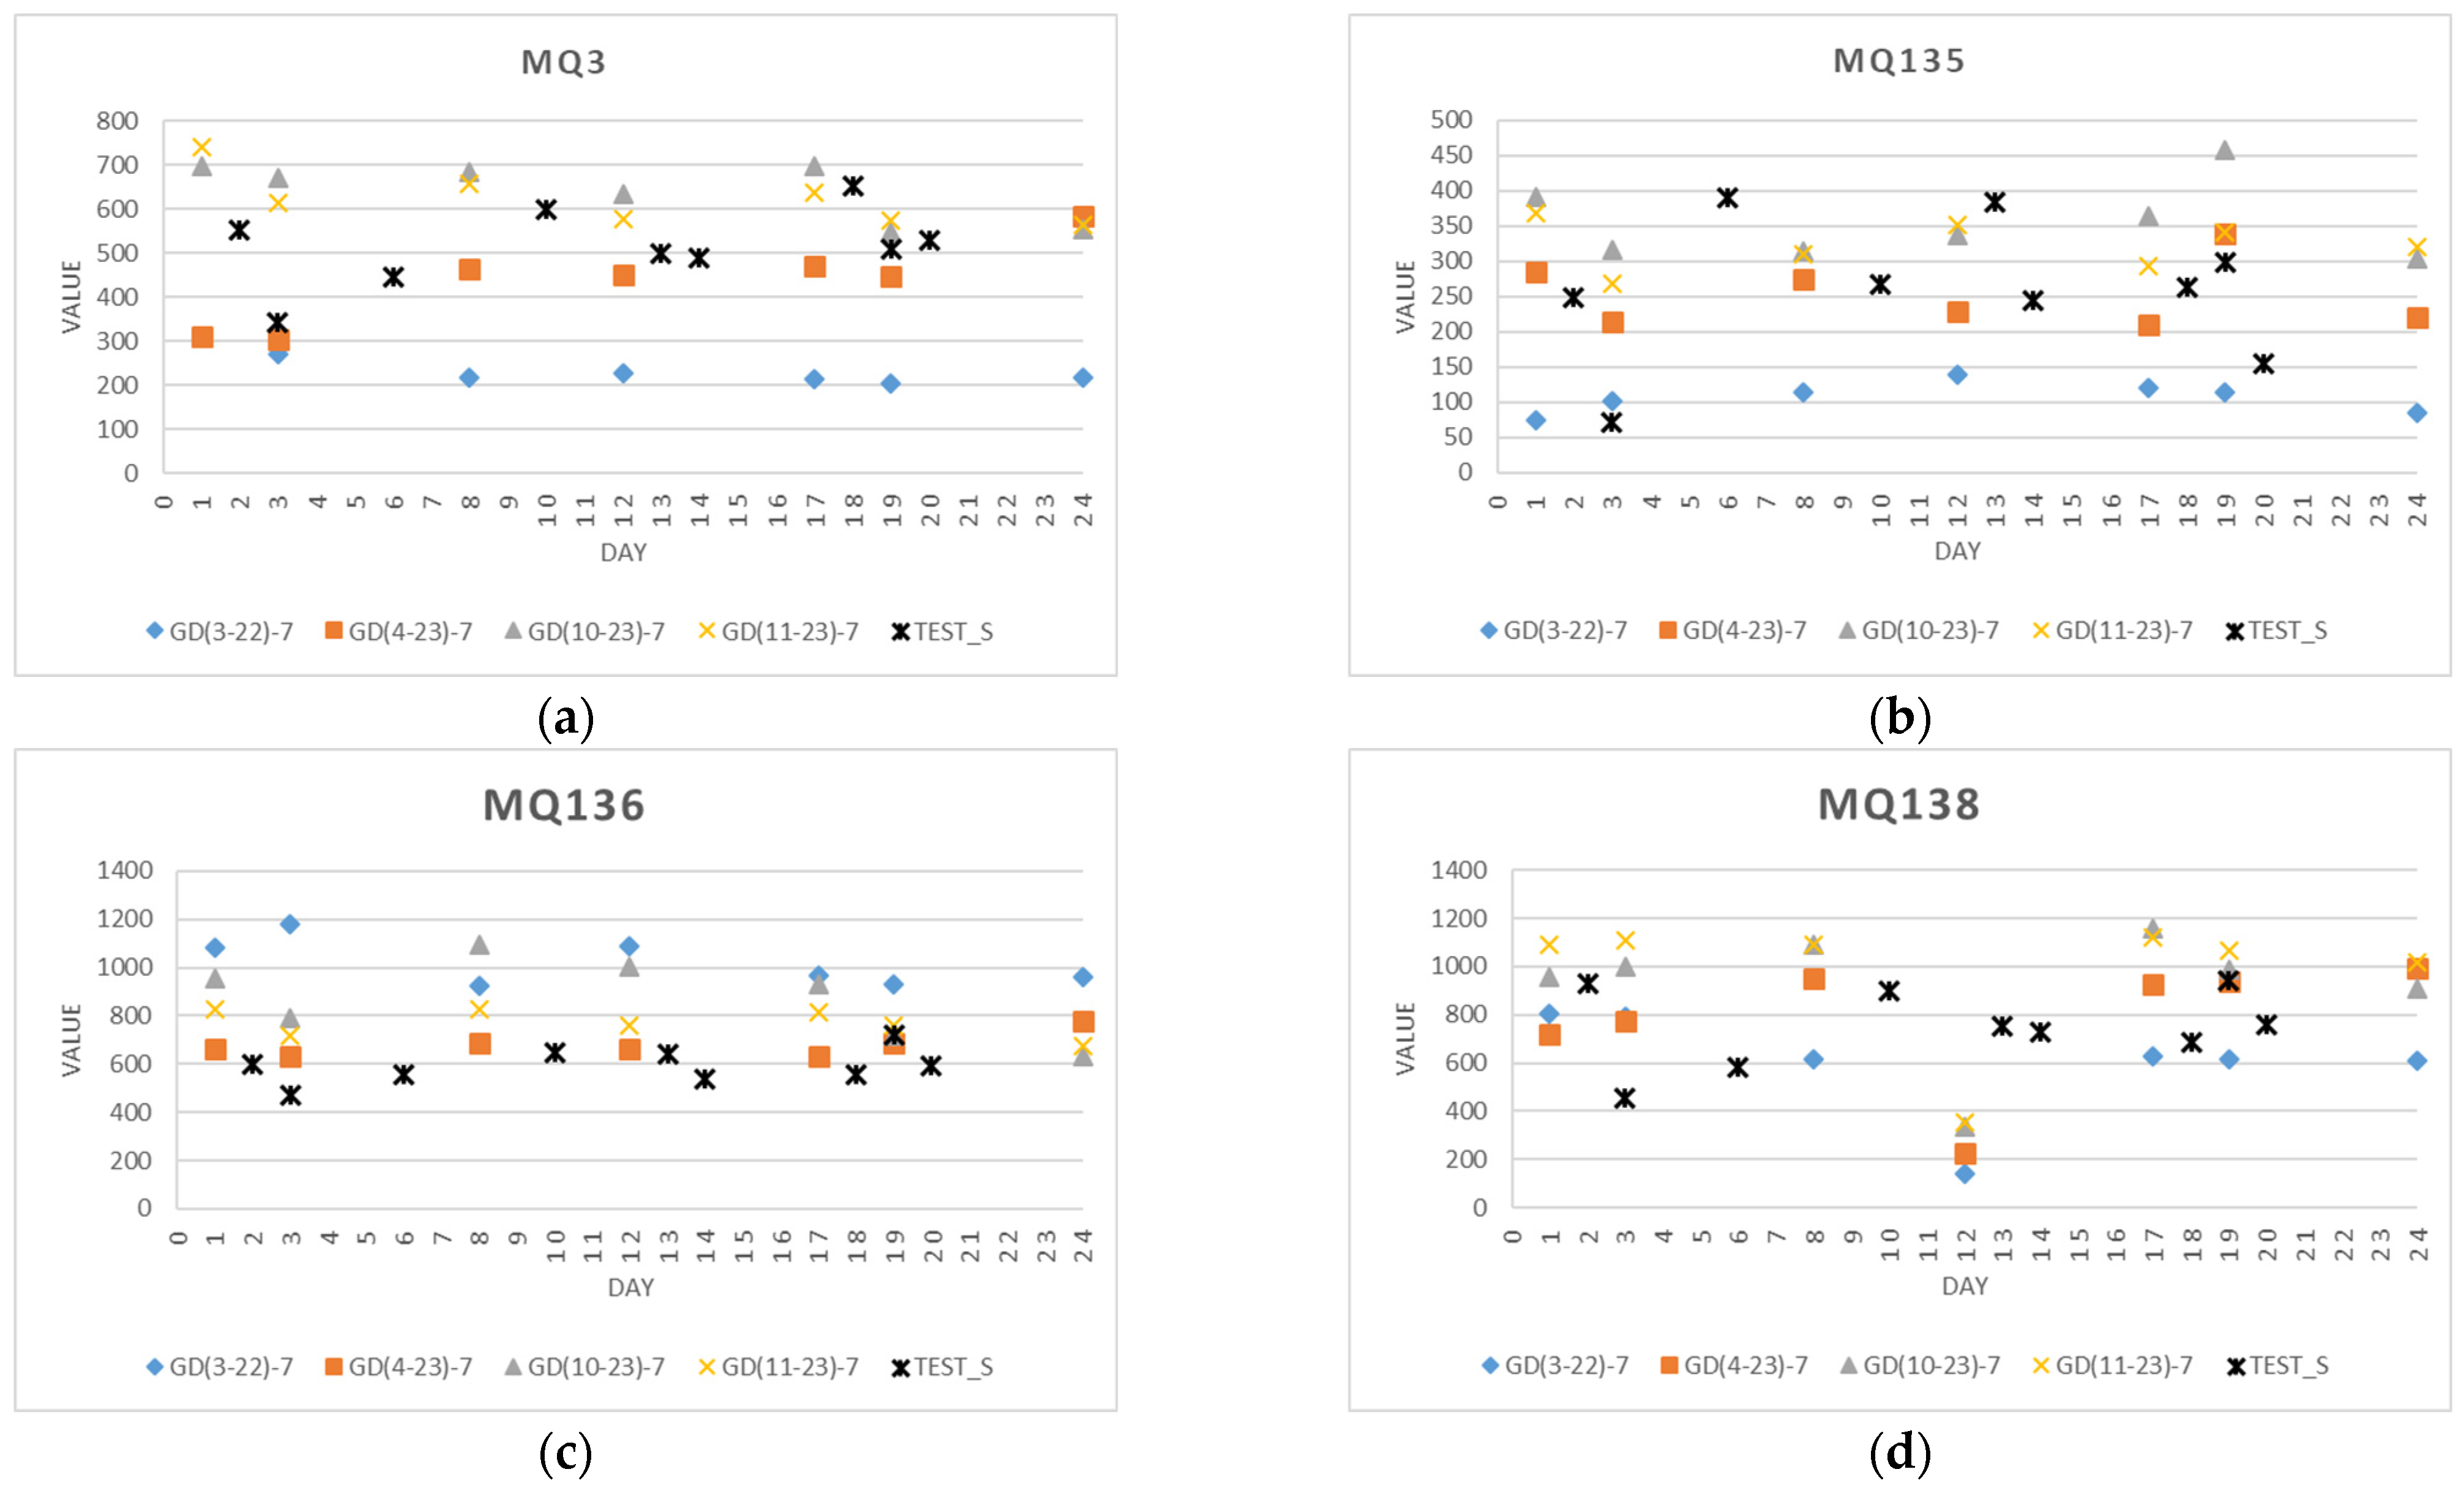
| Test 1 | March 2023 | (3–3)–3rd day | ||
| Test 2 | December 2023 | (6–12)–6th day | (13–12)–13th day | (19–12)–19th day |
| Test 3 | February 2024 | (18–2)–18th day | (20–2)–20th day | |
| Test 4 | March 2024 | (2–3)–2nd day | (10–3)–10th day | (14–3)–14th day |
| Experiment | Sensor | MQ3 | MQ135 | MQ136 | MQ138 |
|---|---|---|---|---|---|
| MQ3 | 1 | ||||
| GD(3–22)–12/ | MQ135 | −0.36/−0.61 | 1 | ||
| GD(3–22)–7 | MQ136 | 0.75/0.75 | 0.07/−0.13 | 1 | |
| MQ138 | 0.92/0.96 | −0.24/−0.46 | 0.80/0.87 | 1 | |
| MQ3 | 1 | ||||
| GD(4–23)–8/ | MQ135 | −0.12/−0.15 | 1 | ||
| GD(4–23)–7 | MQ136 | 0.75/0.74 | 0.12/0.09 | 1 | |
| MQ138 | 0.94/0.94 | −0.00/−0.05 | 0.60/0.58 | 1 | |
| MQ3 | 1 | ||||
| GD(10–23)–16/ | MQ135 | −0.08/−0.26 | 1 | ||
| GD(10–23)–7 | MQ136 | 0.71/0.75 | 0.13/−0.25 | 1 | |
| MQ138 | 0.51/0.59 | 0.28/−0.00 | 0.58/0.52 | 1 | |
| MQ3 | 1 | ||||
| GD(11–23)–16/ | MQ135 | 0.16/0.24 | 1 | ||
| GD(11–23)–7 | MQ136 | 0.42/0.74 | 0.27/0.25 | 1 | |
| MQ138 | 0.51/0.59 | 0.28/−0.00 | 0.58/0.52 | 1 | |
| MQ3 | 1 | ||||
| GD(22–23)–all/ | MQ135 | 0.72/0.83 | 1 | ||
| GD(22–23)–24d–7m | MQ136 | −0.25/−0.22 | −0.29/−0.42 | 1 | |
| MQ138 | 0.92/0.94 | 0.72/0.77 | −0.28/−0.27 | 1 |
| Experiment | MQ3–MQ135 | MQ3–MQ136 | MQ3–MQ138 | MQ135–MQ136 | MQ135–MQ138 | MQ136–MQ138 |
|---|---|---|---|---|---|---|
| GD(3–22)–12 | 0.243 | 0.005 | 1.8 × 10⁻⁵ | 0.832 | 0.447 | 0.002 |
| GD(4–23)–8 | 0.783 | 0.031 | 5 × 10⁻⁴ | 0.777 | 0.998 | 0.114 |
| GD(10–23)–16 | 0.754 | 0.002 | 0.042 | 0.629 | 0.301 | 0.018 |
| GD(11–23)–16 | 0.255 | 0.111 | 0.025 | 0.110 | 0.566 | 0.181 |
| GD(22–23)–all | 1.2 × 10⁻⁹ | 0.071 | 8.5 × 10⁻²³ | 0.034 | 1.3 × 10⁻⁹ | 0.045 |
| GD(22–23)–24d-7m | 4.2 × 10⁻⁸ | 0.252 | 1.5 × 10⁻¹³ | 0.024 | 1.4 × 10⁻⁶ | 0.156 |
| Sensor | Dataset | GD(3–22)–7 | GD(4–23)–7 | GD(10–23)–7 | GD(11–23)–7 |
|---|---|---|---|---|---|
| GD(3–22)–7 | 1 | ||||
| MQ3 | GD(4–23)–7 | −0.81 | 1 | ||
| GD(10–23)–7 | 0.53 | −0.57 | 1 | ||
| GD(11–23)–7 | 0.71 | −0.59 | 0.76 | 1 | |
| GD(3–22)–7 | 1 | ||||
| MQ135 | GD(4–23)–7 | −0.11 | 1 | ||
| GD(10–23)–7 | 0.02 | 0.77 | 1 | ||
| GD(11–23)–7 | −0.11 | 0.54 | 0.48 | 1 | |
| GD(3–22)–7 | 1 | ||||
| MQ136 | GD(4–23)–7 | −0.51 | 1 | ||
| GD(10–23)–7 | 0.05 | −0.49 | 1 | ||
| GD(11–23)–7 | −0.19 | −0.54 | 0.82 | 1 | |
| GD(3–22)–7 | 1 | ||||
| MQ138 | GD(4–23)–7 | −0.98 | 1 | ||
| GD(10–23)–7 | −0.25 | 0.14 | 1 | ||
| GD(11–23)–7 | 0.38 | −0.49 | 0.76 | 1 |
| Parameters | GD(3–22)–12 | GD(4–23)–8 | GD(10–23)–16 | GD(11–23)–16 | ||||
|---|---|---|---|---|---|---|---|---|
| PC1 | PC2 | PC1 | PC2 | PC1 | PC2 | PC1 | PC2 | |
| MQ3 | 0.58 | −0.10 | 0.61 | −0.12 | 0.56 | −0.35 | −0.56 | −0.30 |
| MQ135 | −0.18 | 0.91 | −0.01 | 0.97 | 0.15 | 0.91 | −0.41 | 0.74 |
| MQ136 | 0.52 | 0.39 | 0.53 | 0.19 | 0.59 | −0.09 | −0.52 | 0.29 |
| MQ138 | 0.58 | 0.04 | 0.58 | −0.03 | 0.55 | 0.21 | −0.50 | −0.56 |
| Parameters | GD(22–23)–All | GD(22–23)–Spring | GD(22–23)–Autumn | GD(11–23)–Market | ||||
|---|---|---|---|---|---|---|---|---|
| PC1 | PC2 | PC1 | PC2 | PC1 | PC2 | PC1 | PC2 | |
| MQ3 | −0.57 | 0.20 | 0.52 | 0.41 | 0.58 | −0.32 | −0.57 | −0.27 |
| MQ135 | −0.53 | 0.08 | 0.51 | −0.35 | 0.24 | 0.94 | −0.33 | 0.93 |
| MQ136 | 0.27 | 0.96 | −0.46 | 0.65 | 0.59 | −0.09 | −0.50 | −0.08 |
| MQ138 | −0.57 | 0.17 | 0.50 | 0.53 | 0.49 | 0.03 | −0.55 | −0.19 |
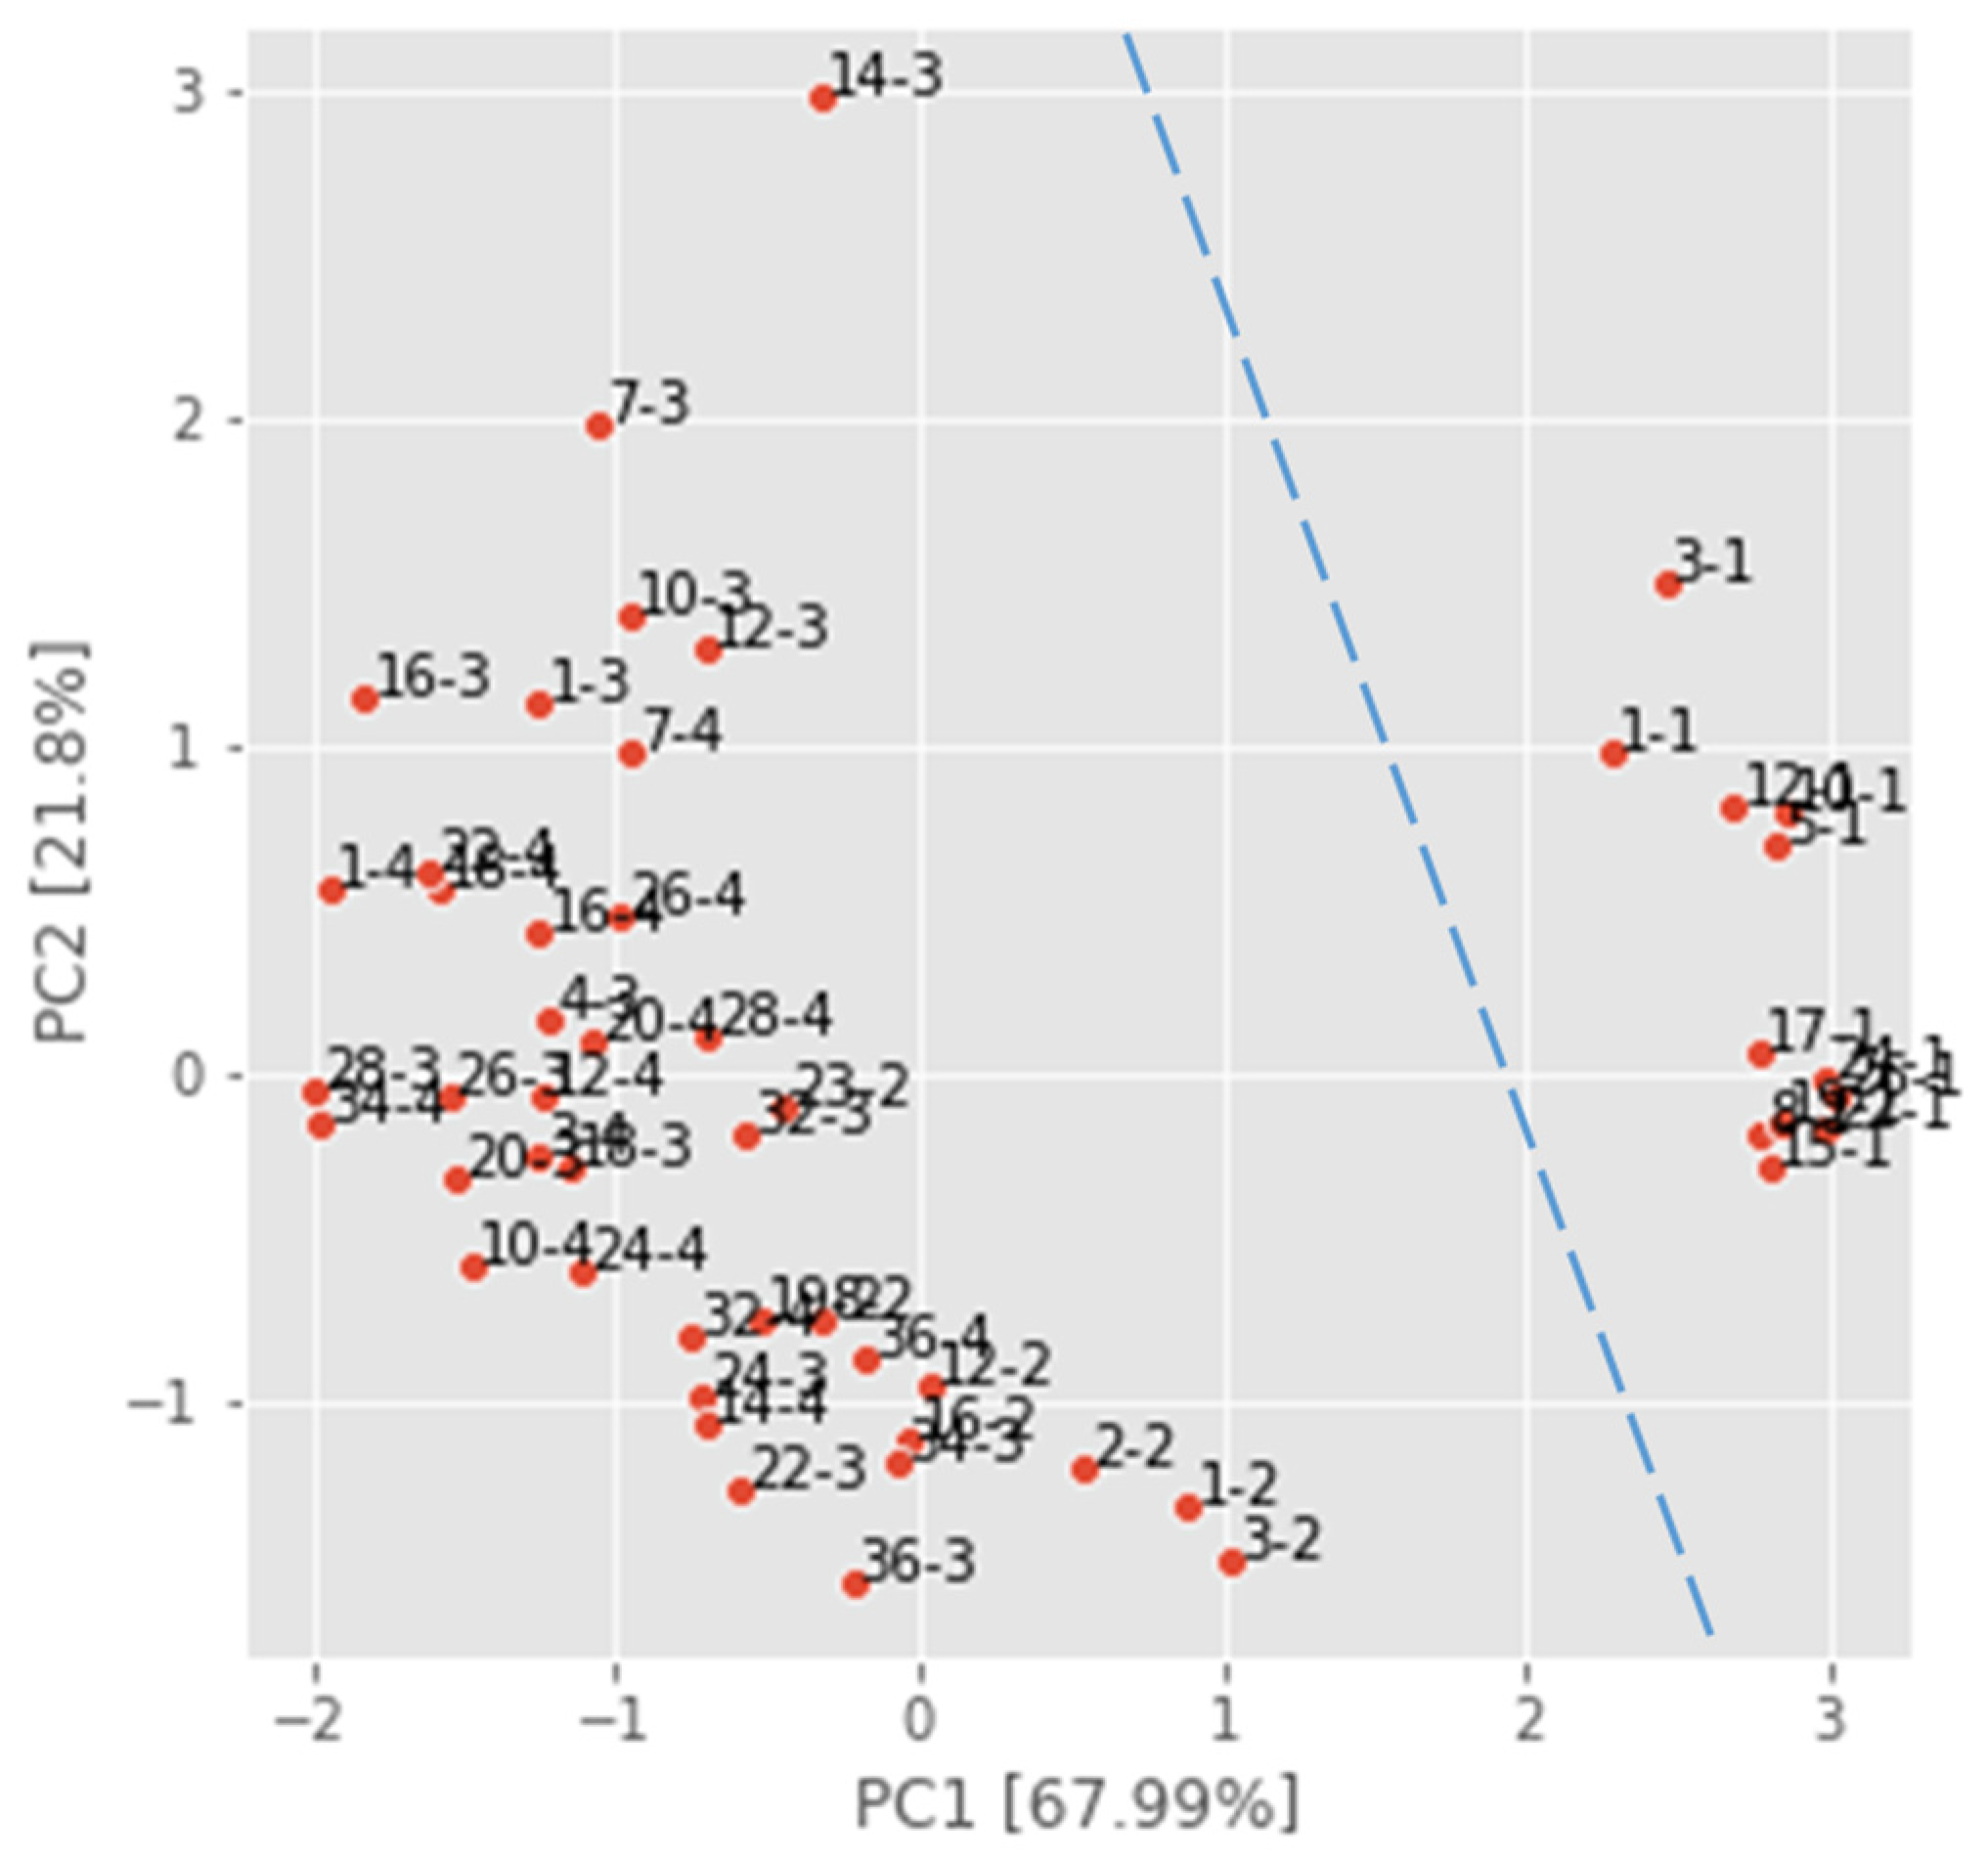
| PCA Dataset | G1(d) | G2(d) | G3(d) | LR = G1(d) | R = G2(d) | OR = G3(d) |
|---|---|---|---|---|---|---|
| GD(3–22)–12_P | 1–5 | 8–18 | 19–26 | 1–7 | 8–18 | 19–26 |
| GD(4–23)–8_P | 1–3 | 8–12 | 16–23 | 1–7 | 8–15 | 16–23 |
| GD(10–23)–16_P | 1–12 | 14–24 | 26–36 | 1–13 | 14–25 | 26–36 |
| GD(11–23)–16_P | 1–12 | 14–24 | 26–36 | 1–13 | 14–25 | 26–36 |
| GD(22–23)–spring_P | 1–5 | 8–16 | 17–26 | 1–7 | 8–16 | 17–26 |
| GD(22–23)–autumn_P | 1–12 | 14–24 | 26–36 | 1–13 | 14–25 | 26–36 |
| GD(22–23)–market_P | 1–10 | 12–24 | 26–36 | 1–11 | 12–25 | 26–36 |
| GD(22–23)–all_P | 1–10 | 12–22 | 24–36 | 1–11 | 12–23 | 24–36 |
| GD(22–23)–24d_P | 1–8 | 10–17 | 18–26 | 1–9 | 10–17 | 18–26 |
| GD(22–23)–24d–7m_P | 1–3 | 8–17 | 19–24 | 1–7 | 8–18 | 19–24 |
| Dataset (5 Input Parameters) | K | Acc (%) (Train/Test) | Prec (Train/Test) | Rec (Train/Test) | F1 Score (Train/Test) |
|---|---|---|---|---|---|
| GD(3–22)–12 | 4 | 91.67/55.56 | 093/0.63 | 0.92/0.56 | 0.91/0.56 |
| GD(4–23)–8 | 2 | 87.50/66.67 | 0.91/0.72 | 0.88/0.67 | 0.86/0.66 |
| GD(10–23)–16 | 2 | 75.00/44.44 | 0.83/0.44 | 0.75/0.44 | 0.71/0.44 |
| GD(11–23)–16 | 2 | 93.75/55.56 | 0.95/0.56 | 0.94/0.56 | 0.94/0.55 |
| GD(22–23)–spring | 4 | 85.00/55.56 | 0.86/0.69 | 0.85/0.56 | 0.85/0.56 |
| GD(22–23)–autumn | 2 | 87.50/66.67 | 0.90/0.70 | 0.88/0.67 | 0.87/0.67 |
| GD(22–23)–market | 2 | 85.00/77.78 | 0.88/0.78 | 0.85/0.78 | 0.84/0.78 |
| GD(22–23)–all | 4 | 82.59/100.00 | 0.84/1.00 | 0.83/1.00 | 0.82/1.00 |
| GD(22–23)–24d | 4 | 90.91/88.89 | 0.92/0.92 | 0.91/0.89 | 0.91/0.89 |
| GD(22–23)–24d–7m | 3 | 100.00/88.89 | 1.00/0.92 | 1.00/0.89 | 1.00/0.89 |
| Dataset (3 Input Parameters) | K | Acc (%) (Train/Test) | Prec (Train/Test) | Rec (Train/Test) | F1 Score (Train/Test) |
|---|---|---|---|---|---|
| GD(3–22)–12_P | 2 | 83.33/77.78 | 0.89/0.81 | 0.83/0.78 | 0.83/0.77 |
| GD(4–23)–8_P | 2 | 87.50/55.56 | 0.91/0.53 | 0.88/0.56 | 0.86/0.53 |
| GD(10–23)–16_P | 3 | 81.25/77.78 | 0.86/0.87 | 0.81/0.78 | 0.79/0.78 |
| GD(11–23)–16_P | 2 | 87.50/66.67 | 0.91/0.67 | 0.88/0.67 | 0.87/0.66 |
| GD(22–23)–spring_P | 2 | 90.00/88.89 | 0.92/0.92 | 0.90/0.89 | 0.90/0.89 |
| GD(22–23)–autumn_P | 2 | 87.50/77.78 | 0.90/0.78 | 0.88/0.78 | 0.87/0.78 |
| GD(22–23)–market_P | 3 | 92.50/88.89 | 0.93/0.92 | 0.92/0.89 | 0.93/0.89 |
| GD(22–23)–all_P | 3 | 90.38/100.00 | 0.91/1.00 | 0.90/1.00 | 0.90/1.00 |
| GD(22–23)–24d_P | 2 | 95.45/88.89 | 0.96/0.92 | 0.95/0.89 | 0.95/0.89 |
| GD(22–23)–24d–7m_P | 3 | 100.00/88.99 | 1.00/0.92 | 1.00/0.89 | 1.00/0.89 |
| Dataset | K | LR | R | OR | N/(err %) |
|---|---|---|---|---|---|
| GD(3–22)–12_P | 2 | R(6–12) | OR(10–3) | 0 | 2/(22.22) |
| GD(4–23)–8 | 2 | R(2–3) | OR(13–12) OR(14–3) | 0 | 3/(33.33) |
| GD(10–23)–16_P | 3 | R(3–3) | 0 | R(19–12) | 2/(22.22) |
| GD(11–23)–16_P | 2 | 0 | OR(13–12) OR(14–3) | R(19–12) | 3/(33.33) |
| GD(22–23)–spring_P | 2 | 0 | 0 | R(18–2) | 1/(11.11) |
| GD(22–23)–autumn_P | 2 | R(3–3) | LR(13–12) | 0 | 2/(22.11) |
| GD(22–23)–market_P | 3 | 0 | 0 | R(18–2) | 1/(11.11) |
| GD(22–23)–all | 4 | 0 | 0 | 0 | 0/(00.00) |
| GD(22–23)–all_P | 3 | 0 | 0 | 0 | 0/(00.00) |
| GD(22–23)–24d | 4 | 0 | LR(13–12) | 0 | 1/(11.11) |
| GD(22–23)–24d_P | 2 | 0 | OR(13–12) | 0 | 1/(11.11) |
| GD(22–23)–24d–7m | 3 | 0 | OR(14–3) | 0 | 1/(11.11) |
| GD(22–23)–24d–7m_P | 3 | R(3–3) | 0 | 0 | 1/(11.11) |
| Datasets | MQ (3–136) K/Acc (%) | MQ (3–138) K/Acc (%) | MQ (136–138) K/Acc (%) | MQ (3–136–138) K/Acc (%) | MQ (3–135–136–138) K/Acc (%) |
|---|---|---|---|---|---|
| GD(3–22)–12 | 2/66.67 | 2/66.67 | 2/66.67 | 2/55.56 | 4/55.56 |
| GD(4–23)–8 | 2/88.89 | 2/77.78 | 3/88.89 | 2/77.78 | 2/66.67 |
| GD(10–23)–16 | 3/66.67 | 2, 3, 4/55.56 | 3, 4/55.56 | 2/55.56 | 2/44.44 |
| GD(11–23)–16 | 4/77.78 | 4/88.89 | 2/100.00 | 4/88.89 | 2/55.56 |
| GD(22–23)–spring | 2, 4/88.89 | 2, 4/77.78 | 4/77.78 | 2, 4/77.78 | 4/55.56 |
| GD(22–23)–autumn | 2, 4/66.67 | 2, 4/66.67 | 2/77.78 | 2, 3, 4/66.67 | 2/66.67 |
| GD(22–23)–market | 2, 4/88.89 | 4/100.00 | 2/88.89 | 3, 4/88.99 | 2/77.78 |
| GD(22–23)–all | 3/88.89 | 4/100.00 | 2, 3/77.78 | 3, 4/100.00 | 4/100.00 |
| GD(22–23)–24d | 3/100.00 | 2/77.78 | 2, 3/88.89 | 3, 4/88.89 | 4/88.89 |
| GD(22–23)–24d–7m | 2, 3, 4/100.00 | 2, 3, 4/100.00 | 2, 3/66.67 | 3/100.00 | 3/88.89 |
| Datasets | MQ (3–136) K/Acc (%) | MQ (3–138) K/Acc (%) | MQ (136–138) K/Acc (%) | MQ (3–136–138) K/Acc (%) | MQ (3–135–136–138) K/Acc (%) |
|---|---|---|---|---|---|
| GD(3–22)–12_P | 2, 3, 4/44.44 | 2, 3, 4/44.44 | 2/55.56 | 2/55.56 | 2/77.78 |
| GD(4–23)–8_P | 2/88.89 | 3, 4/55.56 | 3/100.00 | 2, 3, 4/88.89 | 2/55.56 |
| GD(10–23)–16_P | 2, 3, 4/77.78 | 3/77.78 | 2, 3/66.67 | 2, 4/77.78 | 3/77.78 |
| GD(11–23)–16_P | 2, 3, 4/77.78 | 4/77.78 | 3, 4/88.89 | 3/77.78 | 2/66.67 |
| GD(22–23)–spring_P | 2/77.78 | 2, 3/88.89 | 2, 4/77.78 | 2/88.89 | 2/88.89 |
| GD(22–23)–autumn_P | 2, 3, 4/66.67 | 3, 4/66.67 | 2, 4/88.89 | 2, 4/77.78 | 2/77.78 |
| GD(22–23)–market_P | 2, 3, 4/77.78 | 2/100.00 | 2/88.89 | 2, 4/88.89 | 3/88.89 |
| GD(22–23)–all_P | 3, 4/100.00 | 3/88.89 | 2, 3, 4/88.89 | 3, 4/100.00 | 3/100.00 |
| GD(22–23)–24d_P | 3/100.00 | 3/100.00 | 2, 3, 4/88.89 | 4/88.89 | 2/88.89 |
| GD(22–23)–24d–7m_P | 2, 3, 4/77.78 | 2, 3, 4/77.78 | 3/88.89 | 2, 3/77.78 | 3/88.99 |
Disclaimer/Publisher’s Note: The statements, opinions and data contained in all publications are solely those of the individual author(s) and contributor(s) and not of MDPI and/or the editor(s). MDPI and/or the editor(s) disclaim responsibility for any injury to people or property resulting from any ideas, methods, instructions or products referred to in the content. |
© 2024 by the authors. Licensee MDPI, Basel, Switzerland. This article is an open access article distributed under the terms and conditions of the Creative Commons Attribution (CC BY) license (https://creativecommons.org/licenses/by/4.0/).
Share and Cite
Trebar, M.; Žalik, A.; Vidrih, R. Assessment of ‘Golden Delicious’ Apples Using an Electronic Nose and Machine Learning to Determine Ripening Stages. Foods 2024, 13, 2530. https://doi.org/10.3390/foods13162530
Trebar M, Žalik A, Vidrih R. Assessment of ‘Golden Delicious’ Apples Using an Electronic Nose and Machine Learning to Determine Ripening Stages. Foods. 2024; 13(16):2530. https://doi.org/10.3390/foods13162530
Chicago/Turabian StyleTrebar, Mira, Anamarie Žalik, and Rajko Vidrih. 2024. "Assessment of ‘Golden Delicious’ Apples Using an Electronic Nose and Machine Learning to Determine Ripening Stages" Foods 13, no. 16: 2530. https://doi.org/10.3390/foods13162530
APA StyleTrebar, M., Žalik, A., & Vidrih, R. (2024). Assessment of ‘Golden Delicious’ Apples Using an Electronic Nose and Machine Learning to Determine Ripening Stages. Foods, 13(16), 2530. https://doi.org/10.3390/foods13162530


