Article

Evaluating Biocompounds in Discarded Beetroot (Beta vulgaris) Leaves and Stems for Sustainable Food Processing Solutions

1
Nutrition and Dietetics, Faculty of Medicine and Health Science, Universidad Central de Chile, Coquimbo 1710164, Chile
2
Food Science Lab, Faculty of Medicine and Health Science, Universidad Central de Chile, Santiago 8330546, Chile
*
Author to whom correspondence should be addressed.
Foods 2024, 13(16), 2603; https://doi.org/10.3390/foods13162603
Submission received: 31 July 2024 / Revised: 13 August 2024 / Accepted: 16 August 2024 / Published: 20 August 2024
(This article belongs to the Section Nutraceuticals, Functional Foods, and Novel Foods)

Abstract

:
The current trend focuses on reducing food waste, with scientific studies exploring the nutritional value of discarded food components to identify potential health benefits. Beetroot (Beta vulgaris L.) is highly consumed, but its stems and leaves are often discarded. This work aims to characterize the chemical properties and bioactive compounds in beet stems and leaves and assess their applicability in food products. The stems and leaves were subjected to different drying temperatures (50 to 70 °C) to determine the optimal temperature for preserving their bioactive compounds. They are then nutritionally and physiochemically characterized and incorporated into a food matrix. The optimal drying temperature was 60 °C. The leaves and stems contain approximately 30 and 15 g/100 g of protein, 30 and 32 g/100 g of dietary fiber, 4 and 0.45 g/100 g of lipids, and 24 and 25 g/100 g of ash, respectively. Both provide approximately 50% of the amino acid requirements established by the WHO/FAO/UNU and are rich in iron and potassium. The stems presented 53% more betalainic compounds (0.58 mg/g) and a higher nitrate content (359 mg/kg) than did the leaves, which presented a higher polyphenol content. The incorporation of flour from beet stems and leaves into food products is economical, reduces food waste, and enhances nutrition and health.

1. Introduction

In 2015, world leaders adopted a set of global measures to eradicate poverty, protect the planet, and ensure prosperity for all as part of a strategy for sustainable development [1]. In this context, Goal 12, responsible production and consumption, relies on the appropriate use of the environment and resources in a sustainable manner. In this sense, a global issue is the waste produced by the food industry, mainly in the processing of fruits and vegetables. The United Nations estimated that global food loss is approximately 1.6 billion tons per year, resulting in waste [2]. According to this report, it is estimated that the percentage of food losses and waste produced by fruits and vegetables ranks first, followed by oilseeds and pulses at approximately 20% and 10% in Europe and North and Latin America, respectively, whereas in Asia and Africa it reaches values of less than 15% and 10%, respectively. Food waste not only wastes resources such as water, land, and energy, leading to environmental pollution, but also results in significant losses during production and processing, with up to 45% of raw materials wasted. However, these food industry by-products are valuable sources of bioactive compounds and natural pigments that can be repurposed to create functional foods. Food waste and by-products utilization can be divided into three categories: reuse, recycling and upcycling/valorice, and the latter converts the food waste and by-products into higher-value products. In this context, the greatest amount of food waste is produced by the fruit and vegetable processing industry [3].
Beetroot (B. vulgaris L.) belongs to the Chenopodiaceae family, with more than 1400 species [4]. This plant has three main organs: the root, neck, and leaves. The root is conical in shape and rarely protrudes from the ground. Inside this root, a series of alternating light and dark concentric rings are distinguished. The lighter ones stand out for having softer tissue but are rich in sugar, whereas the darker ones consist of fibrous tissues formed by bundles of vessels that extend to the juice of the root leaves [5]. Beetroot and its bioactive compounds, including nitrates and betalains, have attracted significant interest due to their reported health benefits for both human health and the food industry [6,7,8].
After a series of reactions in the body, nitrates transform into nitric oxide (NO), which acts as a vasodilator in the arteries, thereby improving blood flow and inhibiting platelet aggregation. Some benefits of this component are attributed to its ability to control hypertension, and it is used as part of pharmacological treatment [9]. In sports nutrition, this compound has been studied in detail, reporting natural ergogenic properties that improve performance in athletes. Betalains, which are responsible for producing beetroot color, are compounds derived from tyrosine synthesized from the nitrogen core structure of betalamic acid [10]. In the “Betalain profile, content and antioxidant capacity of red beetroot dependent on genotype and root part” study, the authors reported that 30 different betalains are produced in beetroot tissues, constituting 18 betacyanins and 12 betaxanthins, with each type having specific characteristics and correlating with the antioxidant activity of beetroot [11]. The structural components of betalains (a phenolic amine and a cyclic amine) are good electron donors, so betalains are considered to have antioxidant properties [8]. Other benefits attributed to betalains for human health are their anticancer properties, even if they are patented in the United States as components of cancer drugs [7]. These properties are based on the cytotoxicity of betalains and their associated plant extracts containing them to cancer cell lines. These compounds also have anti-lipidemic effects. In a study where volunteers consumed 250 g of edible pulp, total cholesterol and LDL cholesterol levels were reduced [8,12].
In the food industry, betalains are used as colorants, meeting the current consumer requirements for natural food. Red beetroot betanin is a common red dye and is the only compound approved for use by the European Union and the United States. Its main advantage is that it is not only a colorant but also an antioxidant, which implies that it has no basic contraindications for human health [8]. Other studies have shown that beetroot has antimicrobial activity, inhibiting the action and multiplication of some bacteria, such as Salmonella typhimurium. This activity seems to affect the structure, permeability, and other functions of the microorganisms’ cell membranes, leading to cell death [13]
Beetroots are mainly used for human consumption because of their recognized nutritional and health benefits, and their demand has increased in recent years. Originally, beetroots were grown for the consumption of their leaves, but over the years, the main edible product has become the bulb, and the leaves and stems are discarded as waste and remain unexploited. From a nutritional point of view, several studies have highlighted their rich and varied nutritional composition, and many authors emphasize not only the bulb but also the particular nutritional content of the leaves and stems [14]. For proteins, a protein content of 1.61% was reported in beetroot bulbs and 22.8% was reported in the leaves.
Beetroot leaves and stems are usually considered compost, animal feed, or food waste [15]. In recent years, a significant number of research studies have demonstrated that waste or by-products from this type of industry are promising sources of high-value compounds with antioxidant and/or antimicrobial properties, making them potential raw materials for component extraction [16].
Various studies have highlighted that the leaves of this vegetable are an excellent source of bioactive compounds, such as polyphenols and pigments (betalains), which confer a high antioxidant capacity to the material [17].
In 2014, Biondo conducted a nutritional characterization of beetroot leaves at different developmental stages, highlighting their antioxidant activity and the potential benefits of using them as food for human nutrition [18]. In view of the above, this work aims to characterize the chemical properties and bioactive compounds present in beet stems and leaves and assess their applicability in food products.

2. Materials and Methods

2.1. Materials

The beetroot leaves and stems were obtained from Dos Marías Farm, an agricultural company located in the Coquimbo Region, Chile. The plants were collected after approximately 60 days after cultivation and with an Ecuadorian diameter of approximately 5–10 cm diameter at the beetroot bulb consumption maturity stage. They were carefully selected, fresh, of green color, avoiding dry or yellow leaves, with undamaged leaves and/or stems, whole, and without any signs of mechanical or microbiological deterioration. After the leaves and stems were collected, both were washed with tap water, and the excess water was removed and subsequently stored at 4 °C until further analysis.

2.2. Methods

2.2.1. Sample Preparation and Drying Process

Prior to the drying process, the leaves and stems were disinfected with 40 ppm sodium hypochlorite for 10 min, then were rinsed, and the excess water was removed before being cut into small pieces. For meal generation, beetroot by-products were dried in an oven Biobase Model BOV-V70F, Biobase, Shandong, China at temperatures ranging from 50 to 70 °C until they reached an approximate moisture content ranging from 7 to 10% based on previous work by Asadi and Khan [19]. The dried samples were subsequently milled in a micropulverizer RETSCH model ZM-200 (RETSCH, Haan, Germany) at 10,000 rpm. The milling conditions were selected on the basis of the particle size of the flour, which should be similar to that of conventional flour, and then the flour was sieved.
During the drying process, the sampling mass at time t (Mt) was recorded at 30 min intervals. The moisture ratio (MR) corresponds to the relationship between the mass of the sample at different times and the moisture at each time. MR was calculated via Equation (1):
M R = M t M e M 0 M e
where Mt is the moisture content at time = t, Me is the equilibrium moisture content, and M0 is the initial moisture content [20].

2.2.2. Proximate Chemical Characterization and Water Activity

The proximate composition was determined in triplicate via the American Association of Cereal Chemists AACC method, and the results are reported as g/100 g on a dry basis [21]. The moisture content was determined in an oven Biobase Model BOV-V70F, Biobase, Shandong, China at 105 °C until a constant weight was reached; the protein content was estimated by using the Kjeldahl technique (nitrogen conversion factor of 6.25); the lipid fraction was extracted with hexane under reflux conditions by the Soxhlet technique in Soxtec 2050, FOSS, Labexchange, Swabian Alb, Germany; the ash content was obtained by incineration in a muffle furnace at 600 °C according to the official Methods 08-03 [22]; and the total (TDF), soluble (SDF), and insoluble (IDF) dietary fiber contents were determined by the total dietary fiber assay procedure of AOAC Method 991.43, which is based on an enzymatic and gravimetric method [23]. The water activity (aw) was analyzed by a dew point water activity meter (AquaLab 4 TE, Pullma, Washington, DC, USA, at 25 ± 0.5 °C).

2.2.3. Amino Acid Profile

For the determination of the amino acid profile, the PICO-TAG method by Waters Associates was utilized [24]. This technique involves amino acid derivatization prior to column separation using phenyl isothiocyanate (PITC). This procedure consists of 3 steps: (i) sample hydrolysis with 6 N hydrochloric acid containing 0.1% phenol at 110 °C for 20 h to produce free amino acids, (ii) precolumn derivatization of the samples with PITC, and (iii) analysis by reverse-phase high-performance liquid chromatography (HPLC). Chromatographic separation of the hydrolysates was performed using a reverse-phase Pico-Tag column (3.9 × 300 mm) with a C18 column at 400 °C and a UV detector at 254 nm.
The mobile phase consisted of 2 eluents, an aqueous buffer (A) and 60% acetonitrile in water (B). The aminoacid derivatives were separated by gradient of eluent A and eluent B at 1 mL/min. The separation gradient ranged from 10% B to 51% B over 10 min. Amino acid identification in the samples was achieved by comparing the retention times with those of standards.

2.2.4. Fatty Acid Profile

For the identification of the fatty acid profile, a methodology based on GC-FID according to AOCS/CE-1J07; AOAC 969.33 was used. Five grams of dried sample was weighed, and 20 mL of hexane was added. The mixture was agitated for 2 h and left to settle for 24 h. Afterward, the solution was filtered and transferred to a rotary evaporator for an additional 24 h. Three drops of the obtained material were taken, and 3 mL of heptane was added. The mixture was vortexed for 30 s, followed by the addition of 200 µL of alcoholic KOH (methanol). The mixture was vortexed for 30 s and left to settle for 30 s until 2 phases were clearly observed. It was then injected at 1 mL/min into an Agilent Technologies 689 N Network gas chromatograph at a gradient temperature from 120 °C to 230 °C equipped with an autosampler and a flame ionization detector (FID). The system was equipped with a 60 long SP-2330 silica capillary column. Fatty acid identification was carried out by comparing the retention times with patterns of methyl esters of fatty acids.

2.2.5. Mineral Composition and Phytic Acid Determination

Minerals were measured with a flame atomic absorption spectrometer at the Analysis of Soils, Plants and Water Service at Institute of Agricultural Sciences, Madrid (Spain).
The samples were previously digested by means of HNO3 and H2O2 attack by irradiation at 800 W (15 min at 180 °C) in a microwave-accelerated reaction system (MARS, Charlotte, NC, USA). Phytic acid (myo-inositol 1,2,3,4,5,6-hexakisphosphate, InsP6) was measured as phosphorus released by the action of phytase and alkaline phosphatase by a spectrophotometric method with a commercial kit (K-Phyt 07/11 Megazyme, Bray, Ireland). The samples were analyzed in triplicate.

2.2.6. Functional Properties and Color

The functional properties were measured in triplicate. The solubility of each sample was determined by using a solution of 1% w/w at 30, 60, 70, and 80 °C according to the methodology of Vera, Laguna [25]; the water absorption capacity (WAbC) was determined by the difference in weight according to the AACC method 88-04 [26]; the water adsorption capacity (WAdC) was determined by using the method described by Segura-Campos, Ciau-Solis [27], where the samples were exposed to 98% relative humidity provided by the potassium sulfate solution and saturated until a constant weight was reached; and the water and oil holding capacities (WHC/OHC) were determined by difference in weight once the samples reached their complete hydration, according to the method described by Timilsena, Adhikari [28]. The color of the stem and leaf meals were determined by using a CN-200 colorimeter, which has a CIE 10° standard observer and CIE D65 illuminant. The results are expressed in CIELab coordinates: L* (lightness), a* (red to green), and b* (yellow to blue). The color difference values (ΔE) were calculated according to Equation (2).
E = ( L ) 2 + ( a ) 2   + ( b ) 2
where ΔL, Δa, and Δb are the differences between the L* values, a*, and b*, respectively.

2.2.7. Extraction of Bioactive Compounds

For the determination of betalainic pigments, total polyphenols and antioxidant capacity, the method proposed by Ravichandran, Saw [29] was used. Fifty milligrams of dried beetroot leaves or stems were added to 1 mL of an extractant solution of water/methanol/formic acid (84.95/15/0.05) and heated at 60 °C. The mixture was shaken on a vortex for 30 s and then in an ultrasonic bath for 30 s and finally centrifuged for 15 min. The obtained supernatant was extracted, and the process was repeated 4 more times on the residue. The obtained extracts were centrifuged once more and brought to a final volume of 5.0 mL before use.

2.2.8. Determination of Betalains, Total Phenolics, and Antioxidant Capacity

The betalain content was determined by using a UV–VIS spectrophotometer (Shimadzu, model UV-1900) according to the methodology proposed by Ravichandran, Saw [29]. The contents of the betacyanins and betaxanthins in the extracts were determined by measuring the absorbance at two wavelengths, 538 and 480 nm, respectively. To determine the concentration of betalains, Equation (3) was used:
B = ( A × D F × M W × 1000 ) ε × L
where A is the absorbance of the sample, DF is the dilution factor, L is the length of the optical path of the cuvette, MW is the molar mass of the compound, and ε is the molar extinction coefficient. The molar mass and extinction coefficient used were 550 g/mol and 60,000 L/mol cm in water for betacyanins and 308 g/mol and 48,000 L/mol cm in water for betaxanthins. The measurements were performed in triplicate, and the results are expressed in mg/g dry basis (d.b.)
The extracts obtained in Section 2.2.7 were subjected to total polyphenol content (TPC) analysis. The TPC was measured by using the Folin–Ciocalteu method [30] and the absorbance was measured with a UV–VIS spectrophotometer Shimadzu, model UV-1900, Shimadzu, Kioto, Japon at a wavelength of 725 nm. A standard gallic acid calibration curve was used for quantification. The results are expressed in mg of gallic acid equivalents per 100 g of dry basis.
The extracts obtained in 1.2.5 were analyzed by a DPPH (2,2–diphenyl–1–picryl–hydrazyl) assay to determine the antioxidant capacity. The analysis was performed according to the method developed by Brand-Williams, Cuvelier [31]. In cryotubes, 100 µL of extract was mixed with 2.9 mL of DPPH (80 mg/L in 80% methanol) and left in the dark for 30 min. The absorbance at 517 nm was subsequently determined with a UV–VIS spectrophotometer Shimadzu, model UV-1900, Shimadzu, Kioto, Japon. It was quantified using a Trolox calibration curve, and the values are expressed as Trolox equivalent (µmol ET/100 g dry basis).

2.2.9. Determination of Nitrate

For nitrate determination, a liquid chromatography system based on the AOAC 935.48 method was used. An HPLC C18 column was used for separation. The samples were homogenized beforehand. One gram of sample was weighed for each sample. The mixture was subsequently placed in a flask in a boiling water bath for 20 min, agitated at 80 °C, and left to cool before it was finally diluted in 100 mL of deionized water. The mixture was subsequently filtered through a 0.45 µm syringe filter. All the samples were analyzed immediately after 1 h of sample preparation. They were then passed through the mobile phase through the HPLC column. The flow rate was 0.8 mL/min, and the detection wavelength was 213 nm. The peaks of the samples were identified by comparison with the nitrate standard.

2.2.10. Food Product Development and Organoleptic Analysis

For mineral determination and snack preparation, a drying temperature of 60 °C was selected, considering other studies conducted on beetroot discards at this temperature [18,19]. This temperature is suitable for assessing the behavior of the minerals under study under conditions representative of certain processes or conditions in product development and its potential influence on the organoleptic characteristics it could impart to the product.
After drying, the flour was ground and sifted to achieve a particle size similar to that of regular wheat flour. A tortilla chip-type snack was made from corn flour and beetroot stem and leaf flour in different proportions. One batch was prepared as a control, in which only corn flour was used, while the other batches included waste flour. Table 1 presents the quantities used for each tortilla chip.
The sensory evaluation of the tortilla chips was initially conducted through sensory tests using initially a panel of 41 semi-trained individuals (4 males and 37 females) ranging from 20 to 26 years old. The members of this panel were students from the Nutrition and Dietetics Program in the Coquimbo Region. Prior to starting, they were informed about potential food allergies and signed an informed consent form to participate in the research. Threshold tests were conducted to determine the sensitivity to the four basic tastes (sweet, salty, sour, and bitter), as well as tests for odor identification and evaluation of acidity and sweetness intensity. The training was carried out for two weeks. The panelists who achieved an approval rate exceeding 50% of recognition of basic tastes and odor were selected to participate in the sensory panel according to the semi-trained definition by Lawless and Heymann [32].
The sensory evaluation of the tortilla chips was performed using a 5-point hedonic scale, where the tortilla chips were rated from 1 to 5 according to their level of preference. Organoleptic evaluation was performed for one day to ensure standardized conditions. The panelists were asked to evaluate various samples on the basis of different sensory attributes, including their color, flavor, texture, and general acceptability.

2.2.11. Statistical Analysis

The analyses were performed in triplicate and the results were expressed as mean value ± standard deviation. One-way ANOVA was used to compare means values, and significant differences (p < 0.05) were calculated with Tukey’s post hoc test. All tests were performed using the software Statgraphics Centurion XVI.

3. Results

3.1. Drying Characteristics

The drying curves are presented in Figure 1. To analyze the time/moisture relationship, the “moisture ratio” (MR), which is related to the necessary drying time to reduce moisture, was used. This allowed us to measure the efficiency of the drying process and determine how much time is needed to remove moisture from beetroot discards [33]. The results indicate that drying time decreases as the temperature increases, both for leaves and stems. Elevated temperatures typically accelerate evaporation and moisture removal processes as expected [33]. The difference in drying time between the leaves and stems can be attributed to the structural characteristics and nutritional composition of each sample. In general, a higher density is related to slower heat transfer and reduced moisture evaporation. In this study, leaves are thinner and thus have more exposed surfaces than denser stems do, which contain more structural tissue or compact structures [34]. These differences in density affect the drying kinetics. In addition, leaves dried at 60 °C require a drying time of 240 min to reach equilibrium compared with the 180 min required for leaves dried at 70 °C. In the case of stems, this time trend was repeated, requiring 450 min for drying at 50 °C and 360 min for drying at 70 °C. Currently, drying processes that have a lower impact on energy consumption to reach equilibrium are being sought, considering the importance of seeking processes that are more sustainable in the use of resources [35].

3.2. Proximate Chemical Composition and Water Activity

For several years, unconventional food plants (UFPs) have been investigated as emerging candidates for the development of new food matrices with better nutritional compositions [36]. In this context, the stems and leaves of B. vulgaris L. are excellent nontraditional alternative sources of nutrients.
The results for the proximate composition of meals from beet stems and leaves dried at 50, 60, and 70 °C expressed on a dry basis are presented in Table 2. In terms of moisture content and water activity, the samples dried at a temperature of 50 °C presented a moisture content of 3.44% and 8.49% for the leaves and stems, respectively. This difference can be explained by the structure of the leaves, which are thinner and have more readily available free water, and by the differences in nutritional composition [34].
In general, all the samples had high protein and ash contents. Notably, the protein content of the leaves was greater than the stems, reaching values greater than 30 g/100 g and ~15 g/100 g, respectively. These results were higher than those by Tamayo Tenorio, Schreuders [37] who reported values for leaves between 19.4 and 22.8 g/100 g on a dry basis and higher than those reported by Akyüz and Ersus [38] for leaves on a dry basis (24.02 ± 0.18 g/100 g). These results were lower than those previously reported by Abdo, El-Sohaimy [39], who detected 27.22 g/100 g d.b. of proteins in stems and 60.65 g/100 g d.b. of proteins in leaves. Moreover, the results of the present investigation are also greater than those reported by Kiskini, Vissers [40] for beet leaves at different developmental stages. These differences can be attributed to the different varieties used for each study, as well as the growth conditions and the environmental and agronomic characteristics, but not on the plant age, which is in agreement with the findings reported by Kiskini, Vissers [40]. The values obtained in this study exceed those of many plant products; for example, according to the USDA database, quinoa, amaranth, and chia seeds have approximately 16, 15, and 18 g/100 g protein, respectively [41]. Compared with other leaves and roots, in a recent study by Waseem, Akhtar [42], dehydrated spinach produced 19.2 g/100 g of protein, whereas beetroot powder produces 13.5 g/100 g of protein [43]. In both stems and leaves, temperature did not significantly influence the protein content.
On the other hand, ash represents the food’s mineral content; in this case, both stems and leaves have a high mineral content, ranging between 24.88 and 25.47 g/100 g and between 14.20 and 15.24 g/100 g, respectively. This high mineral content has been previously reported by Fernandez, Jagus [17], who studied beet greens; by Abdo, El-Sohaimy [39], who analyzed beetroot leaves and stems; and by Asadi and Khan [19], who investigated dried beetroot leaf powder. On the other hand, significantly greater amounts of total dietary fiber were found in leaves and stems, with no significant differences among the temperatures (Table 2). Similar results were reported by Asadi and Khan [19] for dried beetroot powder. In addition, this high amount of dietary fiber has also been reported [17]. The consumption of a substantial amount of dietary fiber lowers the risk of developing several conditions, including coronary heart disease, stroke, hypertension, diabetes, obesity, and certain gastrointestinal disorders [44].
Finally, all samples, both leaves and stems, reached equilibrium and showed values of water activity less than 0.5. It has been reported that environments with low water activity in foods, generated by food preservation processes such as drying, lead to the inactivation of microorganisms, thereby increasing shelf life. These desirable effects are achieved at levels below 0.6 [45].

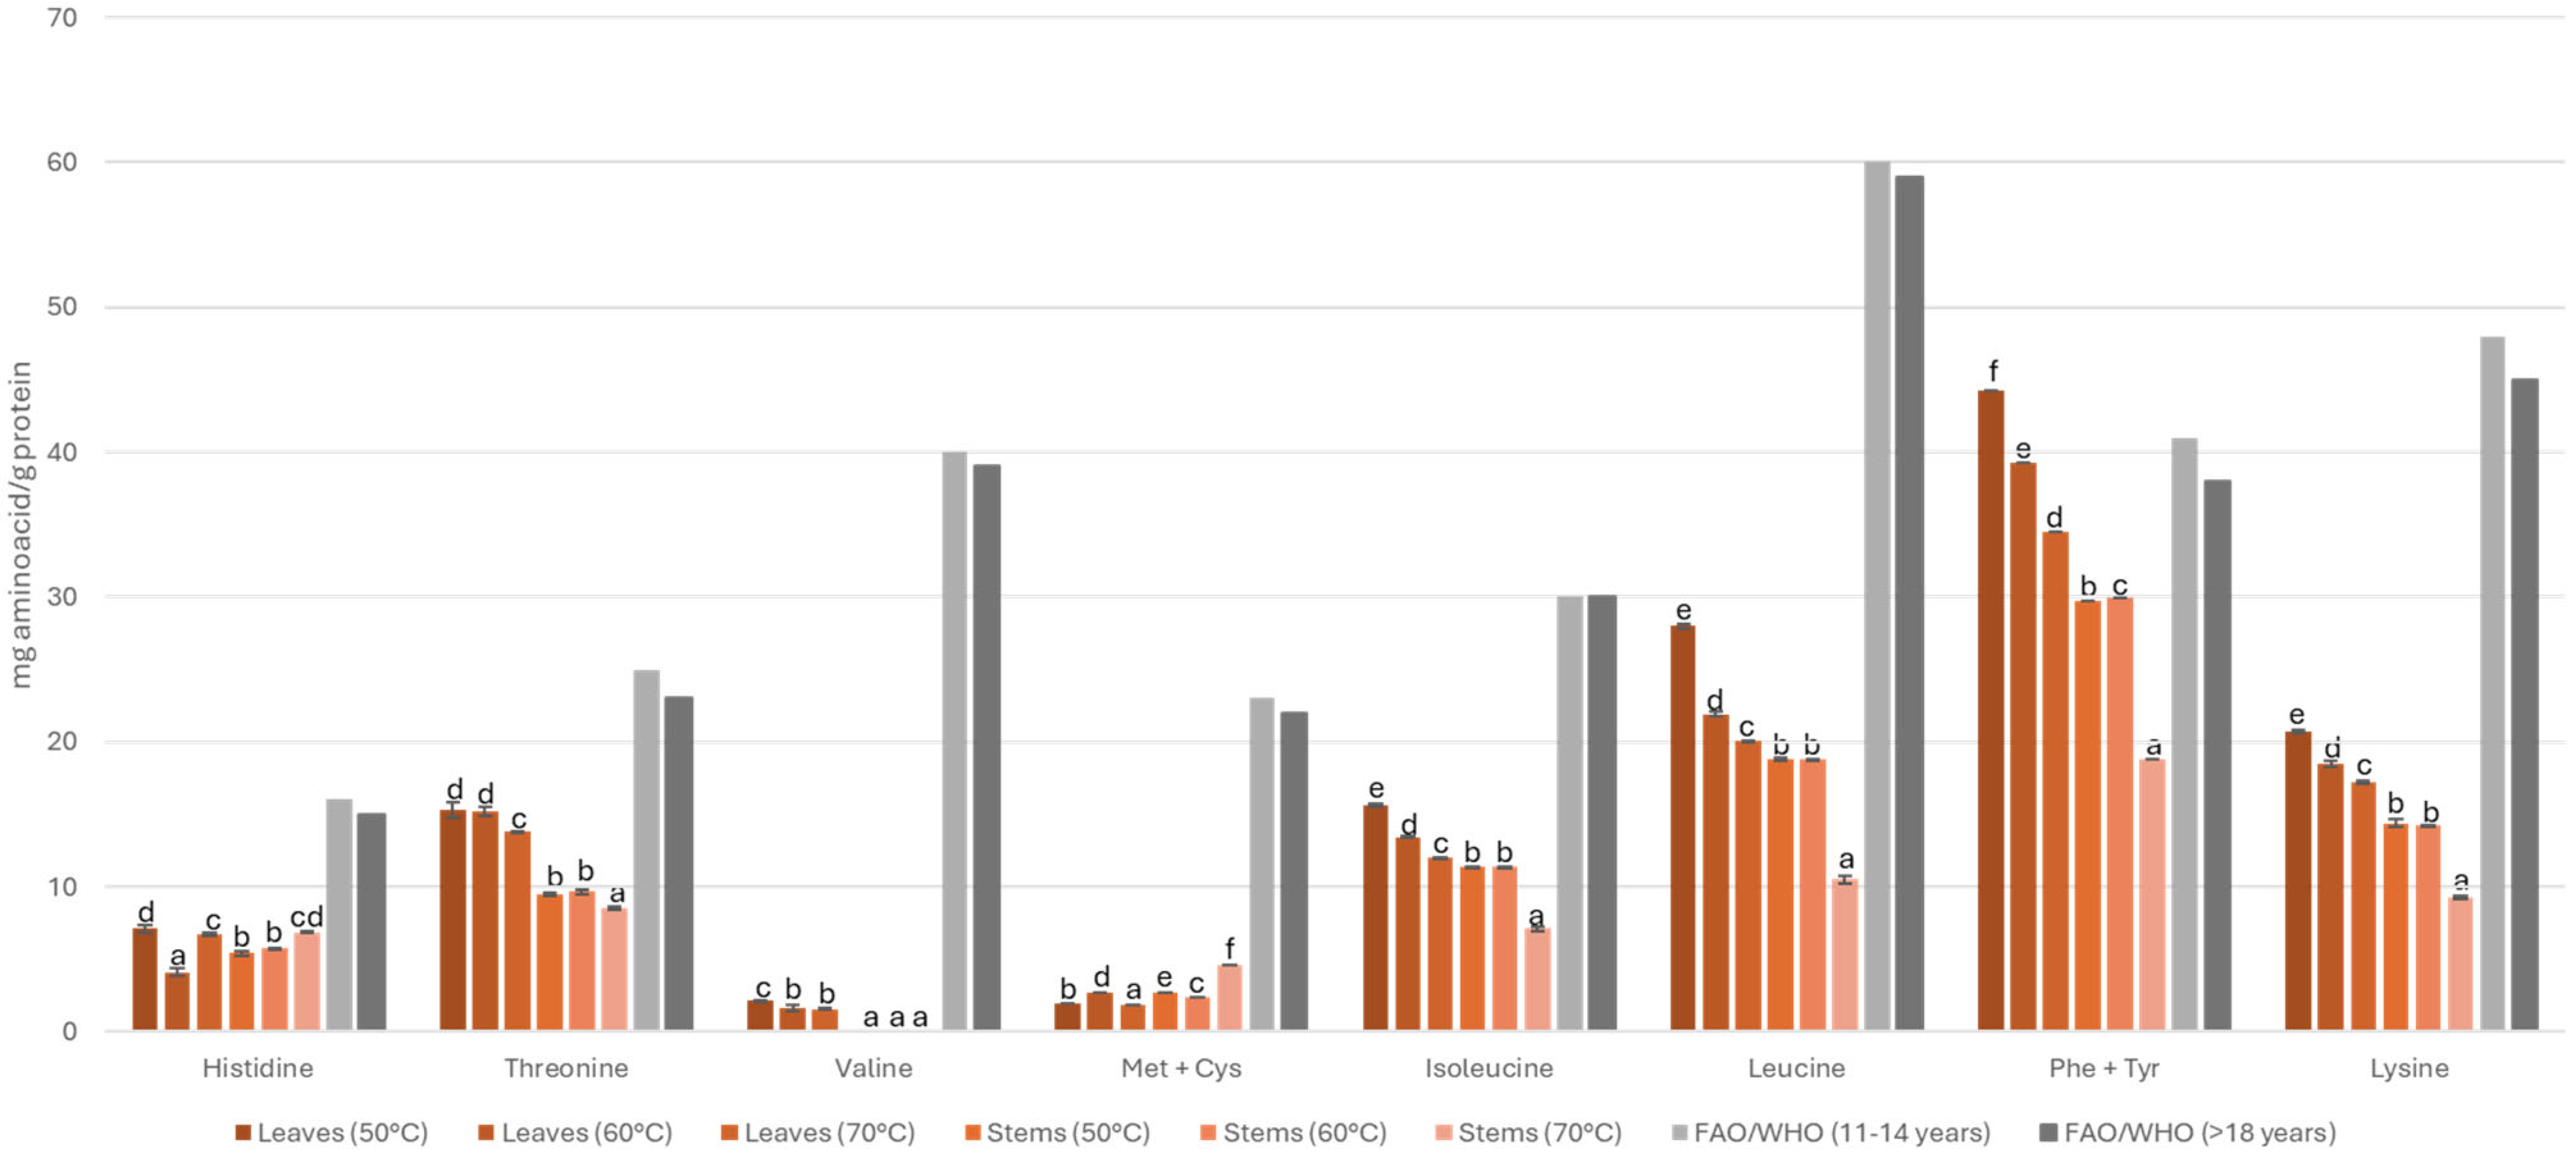
3.3. Amino Acid Profile

The significant protein levels contained in stems and mainly in leaves make them appealing from a nutritional perspective (Table 2). The health benefits provided by plant-based proteins rely on their biological value, which is determined by the presence of essential amino acids. In this context, Table 3 presents the amino acid compositions of leaves and stems from beetroot, both essential and non-essential, that were dried at different temperatures.
According to the results, temperature affects the amino acid composition, i.e., as the temperature increases from 50 to 70 °C, the amount of each amino acid decreases, which is clearly observed for essential amino acids (EAAs).
Figure 2 shows the composition of amino acids based on the standard reference patterns of the FAO/WHO/UNU (Food and Agriculture Organization/World Health Organization/United Nations University) [46]. The amino acid content between stems and leaves varies considerably, while the leaves have all the essential amino acids, the stems are deficient in valine.
In terms of specific amino acids, for histidine, both the leaves and stems dried at any of the temperatures used in the study provided approximately 50% of the requirements. In terms of threonine, leaves provided about 67% and stems about 42% of the requirements, while leaves dried at 50 °C provide 52% of isoleucine and 54% of leucine. In addition, leaves dried at any temperature can provide the 46% of lysine established by the WHO/FAO/UNU.
Finally, leaves dried at 50 °C exceeded the FAO/WHO reference values of phenylalanine plus tyrosine. The amino acid profile of the leaves makes them attractive from a nutritional point of view.

3.4. Fatty Acid Profile

Fatty acids play a crucial role in a variety of biological functions, as they are essential components of cell membranes and participate in the regulation of inflammatory processes, as well as in maintaining cellular integrity, directly impacting health statuses [47]. In the specific context of beetroot by-products, the fatty acids profile is presented in Table 4, detailing the total content of saturated fatty acids (SFAs), monounsaturated fatty acids (MUFAs), and polyunsaturated fatty acids (PUFAs). The amount of fatty acids was greater in the leaves than in the stems. These differences in fatty acids present in the leaves compared with the stems could be attributed to the presence of lipids contained in the chloroplasts as previously reported by Biondo, Boeing [18]. Plants can remodel their membranes and synthesize a greater amount of fatty acids for the assembly of glycerolipids in the membranes of chloroplasts and the endoplasmic reticulum as previously described by Cook, Lupette [48]. In the case of leaves, significant differences were detected among the three temperatures evaluated, with their content decreasing with increasing temperature. Among the fatty acids present in the leaves, palmitic acid stands out for its significant ability to prevent cardiovascular diseases [49]. Omega-3 fatty acids also stand out in the leaves and are among the main fatty acids present in the leaves. This finding is relevant in the search for plant-based foods that provide omega fatty acids, especially in the context of vegan diets [50]. The LA/ALA ratio increased with increasing drying temperature both in the leaves and in the stems. This ratio is crucial for assessing the nutritional quality of food, suggesting that drying at lower temperatures could preserve a more balanced fatty acid profile [51].

3.5. Determination of Mineral Composition and Phytic Acid

The mineral composition and phytic acid content are shown in Table 5. According to the USDA Food Database, the minerals found mostly in these by-products are calcium, potassium, and magnesium, which makes them excellent sources of minerals [41].
For the mineral content analysis, a temperature of 60 °C was used because it was the temperature selected to evaluate the potential impact on snack preparation. The analysis revealed a high content of potassium and magnesium in stems and a high content of calcium and potassium in leaves, which is consistent with reports in beetroot (B. vulgaris) compositions by Abdo, El-Sohaimy [39]. Considering that these minerals help control blood pressure with consistent consumption, these findings suggest that the discards could be a beneficial source for preventing high blood pressure [52]. Additionally, the nitrate content known for its vasodilatory properties and potent hypotensive effects further supports its potential application [53]. Interestingly, the potassium concentration in the stems was double that in the leaves. In addition, a significant amount of iron is present in the leaves and in stems. According to Khare, Samudre [54], iron is one of the most important minerals that contributes to the treatment of anemia. In this context, the results revealed 43.8 mg/100 g in the leaves and 15.95 mg/100 g in the stems, which exceeds the recommended dietary allowance (DRI) of iron of approximately 7–11 mg/day [55,56]. However, studies have highlighted the amount of this mineral in beetroot discards.
Table 5. Mineral composition.
Minerals UnitsStems Leaves
Ca mg/100 g 325.00±21.21 a1445.00±7.07 b
Mg mg/100 g 590.00±28.28 a1310.00±28.28 b
Macroelements P mg/100 g 315.00±7.07 a300.00±14.14 a
K mg/100 g 6155.00±120.21 b3040.00±0.00 a
Cu mg/100 g 0.45±0.07 a1.15±0.07 b
Mn mg/100 g 5.65±0.64 a33.85±3.61 b
Microelements Zn mg/100 g 1.85±0.07 a2.75±0.07 b
Fe mg/100 g 15.95±0.92 a43.80±1.13 b
Flour (g) * 15101510
CaDRIs 1000mg/day331633251457231445
MgDRIs 350/300mg/day169/197843/9831689/1967374/4371871/21833743/4367
Contribution to DRIs (%) *PDRIs 550mg/day5728657355273545
CuDRIs 1.6/1.3mg/day28/35141/173281/34672/88359/442719/885
MnDRIs 2.3/1.8mg/day246/3141228/15692457/31391472/18817359/940314717
ZnDRIs 11/8mg/day17/239.2518.52.7513.7518806
FeDRIs 11/7mg/day145/228725/11391450/2279398/6261991/31293982/6257
Ratio Ins P6/Ca < 0.24 21.50 6.68
Ins P6/Fe < 1 0.0006 0.0003
Ins P6/Zn < 15 0.006 0.006
Values followed by the same letter in the same row are not significantly different (p < 0.05). InsP6—Myo-inositol phosphate. DRIs—dietary reference intakes: recommended dietary allowances and adequate intake elements (male/female). Life stage group: >18 years; [53].* Contribution based on snack formulation in 2.2.10. (1, 5, and 10 g/100 g model food).
Phytic acid (inositol hexaphosphate) is a molecule that contains phosphate and is used by plants to allow the independent growth of seeds through its use as a source of nutrients [57]. On the other hand, phytic acid also has the capacity to affect the solubility of divalent ions such as zinc and Fe because of its double-charged phosphate groups [58].
Due to the high amount of minerals present in leaves and stems, phytic acid was used to estimate mineral availability. The World Health Organization presented several criteria for zinc and acid phytic proportions, with a phytate–zinc < 5 ratio, indicating a negative impact on the absorption of zinc [59]. In the case of iron, the suggested acid phytate–iron ratio is <1 and the pytate–calcium ratio is <0.24 according to Hurrell [60]. The inhibition of iron or zinc absorption is related to the level of phytate in a food [59]. The mechanism of this inhibition has been reported by Marolt, Gričar [61] and is explained as the formation of metal insoluble complexes with phytic acid, which depends mainly on the molar ratio, protonation state related to the pH level and side reactions. The acid phytic–zinc ratios of both the leaves and stems were lower than 0.006, suggesting that the phytic acid content should not interfere with zinc absorption. On the other hand, the acid phytic–iron ratios of both the leaves and stems were 0.0003 and 0.0006, respectively, which suggest that there was no interference in iron absorption. In addition to iron and zinc, the acid phytic–calcium ratios of both the leaves and stems were 6.8 × 10⁻⁶ and 2.2 × 10⁻⁵, respectively, which indicates that the phytic acid does not interfere with calcium absorption.
In terms of the dietary reference intakes (DRIs), mineral absorption inhibitors are absent. Table 5 shows the contribution to the DRIs of dried leaves and stems at 60 °C expressed in % and calculated on the basis of an intake of 1; 5, and 10 g/day (on the basis of the formulation in Section 2.2.10). In this context, when 1 g/day of leaves is considered, the DRIs for calcium and magnesium exceed 100% of the requirements; while for stems, only magnesium exceeds the requirement. On the other hand, considering 5 or 10 g/day, all the DRIs for all minerals exceed 100% of the requirement.

3.6. Functional Properties and Color

The functional properties are presented in Table 6. The water adsorption capacity (WAdC) reflects how much of the water in the environment can be retained on the surface of a sample. According to the results, the drying temperature had no influence on the WAdC in either the leaves or the stems, but the WAdC in the stems was almost double that in the leaves. On the other hand, stems showed greater water absorption capacity (WAbC) than did leaves, and the WAbC was greater at 50 °C for both leaves and stems. In terms of water holding capacity (WHC), the WHC of the stems was greater than that of the leaves, which could be attributed to the greater amount of dietary fiber found in the stems. On the other hand, while the WHC of the leaves did not significantly differ among the temperatures, on the stems, the WHC decreased with increasing temperature. The oil holding capacity did not differ between the stems and leaves, and the temperature did not influence the capacity. Different WHC and OHC values, 2.00 and 3.56 g of water or oil/g sample of WHC and OHC, respectively, were reported by Mitrevski, Pantelić [62] for beetroot powder. Some functional properties of beetroot leaf powder dried at 60 ± 2 °C for 7 h were analyzed by Asadi and Khan [19], and the results revealed a lower WAbC and OHC than those reported in the present study.
In general, the solubility pattern is different between leaves and stems, with higher solubility observed in stems. The solubility ranged from 33 to 42% for leaves and 45 to 49% for stems. The stem solubility increased slightly with increasing temperature, whereas the leaf solubility decreased with increasing temperature. Solubility has a strong effect on the functionality and relative stability of the ordered and disordered structures of polysaccharides in solution, determining whether they will be completely or partially dissolved or whether they can be solubilized [63].
The colors of the leaves and stems dried at the three different temperatures are shown in Table 7. The color of both the leaves and stems changed with increasing thermal treatment. In the case of the leaves, the samples became darker and more yellow at higher temperatures. These changes in color could be attributed to the Maillard reaction or caramelization of sugars, whereas the green color observed in stems could indicate changes in chlorophyll concentration [64]. On the other hand, stems wither and become greener at higher temperatures. The color of beetroot leaves was also reported by Asadi and Khan [19], who reported differences in L*, a*, and b* but with similar trends. These differences could be attributed to different factors, such as the maturity stage of the plant parts and the environmental and agronomic conditions.

3.7. Determination of the Phenolic Content, Total Phenolic Content, and Antioxidant Capacity

Betalains are nitrogenous compounds responsible for the coloration of beets. There are two types: betacyanins, which are responsible for red and violet colors, and betaxanthins, which are responsible for yellow colors [65]. However, their main beneficial characteristics are related to phenolic compounds, providing them with antioxidant properties [66].
In this study, the stabilities of total betalains, betacyanins, and betaxanthins dried at different temperatures were evaluated. Figure 3 shows that the samples that retained the greatest amount of these compounds were those dried at 50 °C, both in the stems and leaves. For total betalains, there were significant differences among the three temperatures in the case of the stems. For the leaves, the differences were focused on the samples dried at 50 °C, with no significant differences between the other two temperatures. This decrease is repeated for both betacyanins and betaxanthins.
In terms of total betalainic compounds in the stems and leaves, the results revealed greater amounts in the stems, with 53% more betalainic compounds than in the leaves. This trend is consistent with those reported by Ben Haj Koubaier, Snoussi [67], who studied the betalain content, phenolic composition, and antioxidant activity of different parts of beetroot. The color change is related to the degradation of betalains, as reported by de França, Cruz-Tirado [68]. In our study, betalainic compounds also degraded at relatively high temperatures, explaining the labile characteristics of these compounds. These data coincide with those reported by Shankar Bunkar, Anand [69], where betalainic compounds decreased with increasing temperature with convective drying.
The results of total polyphenol content (TPC) of beet leaves and stems are detailed in Table 8. There is an appreciable content of polyphenolic compounds, with leaves consistently showing higher TPC than stems. Specifically, both the leaves and stems of plants dried at 50 °C exhibited greater TPC than did those of plants dried at 60 °C or 70 °C. This trend indicates a gradual decrease in the TPC as the drying temperature increases. However, no significant differences are observed between the results obtained at the different drying temperatures. These results are consistent with those reported by Ben Haj Koubaier, Snoussi [67], who noted variability in polyphenol content among different beet parts in terms of antioxidant activity. Both the leaves and stems tended to exhibit decreasing antioxidant activity as the drying temperature increased. This can be explained by the effect of temperature on polyphenolic compounds, which are affected by increasing temperature and are directly related to the total betalain and total polyphenol contents, which are responsible for this antioxidant activity.

3.8. Analysis of Nitrates

Nitrates are compounds primarily found in leafy greens, roots, and tubers and to a lesser extent in fruits and legumes [1]. Numerous studies have focused on the benefits of nitrates, with their vasodilatory properties being a major contributor to health and nutrition. One of the foods that has been studied in relation to the benefits of nitrates in the human diet is beetroot, although to date, the quantity of nitrates present in its stems and leaves has not been investigated. This study aimed to quantify this compound in these by-products, highlighting the greater concentration of nitrates in the stems than in the leaves. The nitrate data are presented in Table 8. The drying temperature of 50 °C resulted in the greatest amount of nitrates, with a total of 359 mg/kg in the stems. In the case of the leaves, the drying temperature of 50 °C also yielded the highest nitrate concentration, with a total of 159 mg/kg, which was significantly different from that of the other drying temperatures. In a study conducted by Benjamim, Sousa [1], different vegetables were classified into three categories based on their nitrate content: high, medium, and low. The beet stems were considered medium nitrate-contributing vegetables, with nitrate levels ranging from 168 to 518 mg/kg. On the other hand, leaves are categorized as low nitrate-contributing vegetables, with values ranging from 25 to 203 mg/kg. Notably, the drying temperature of 70 °C resulted in the lowest content (100 mg/kg), whereas the 50 °C drying temperature resulted in the highest value of 159 mg/kg. The recommendations for nitrate consumption vary depending on various studies and factors, such as the type of exercise performed. According to the research by Benjamim, Sousa [1], which was based on experimental studies involving individuals’ recommendations for the use of nitrates as ergogenic aids, ranges from >300 mg when chronic consumption is suggested to 800 mg when acute effects are active after exercise [70]. In the case of beetroot by-products, stems dried at 50 °C and 60 °C fully meet these recommendations for chronic use as ergogenic aids.

3.9. Organoleptic Analysis

The sensory attributes of the beetroot by-products snacks are presented in Table 9. Compared with those of the control sample, the texture attributes of the samples made with only corn flour were not significantly different.
The color attribute measured by the panel of semi-trained individuals exhibited the most significant differences, as expected, which were in agreement with the color results obtained in Table 6, where b* of the leaves had the highest value. The flavor of snacks made with 10% beetroot waste flour was better evaluated than the control snacks. The overall acceptability of the snacks was not significantly different between the control group and the 10% beetroot waste flour group. The snacks made with 20% beetroot waste flour had lower acceptability both overall and for each of their attributes, although none of the snacks scored below three. This decrease in overall acceptability may be due to the properties of betalains, which could influence a more bitter taste, which is consistent with the findings of Kojic [71] in the development of snacks enriched with betalains. This bitterness can also be attributed to the presence of saponins and phenolic compounds in plant-based foods, which are responsible for attributes such as acidity, astringency, and bitterness [72].

4. Conclusions

The results of this study underscore the potential of beetroot stems and leaves as valuable nutritional resources. By optimizing the drying process, we can preserve key bioactive compounds, making these often-discarded parts suitable for fortifying various food products. The significant protein, dietary fiber, and mineral content, alongside their substantial amino acid contributions, position beetroot stems and leaves as excellent candidates for enhancing human nutrition. Furthermore, their rich betalain and polyphenol profiles add functional benefits. The incorporation of these components into food matrices not only addresses food waste reduction but also promotes health and nutrition, offering a sustainable and economical solution. Further investigations should explore the sensory qualities and consumer acceptance of different food products containing beetroot stem and leaf flour, as well as their long-term health impacts. Additionally, studying the scalability of incorporating these by-products into various food industries could enhance their practical application and contribute to broader sustainability goals.

Author Contributions

Conceptualization, C.M. and L.A.M.; methodology, C.M., L.A.M., H.C.-B. and N.R.; validation, C.M. and L.A.M.; formal analysis, C.M., L.A.M., H.C.-B. and N.R.; investigation, C.M., L.A.M., H.C.-B. and N.R.; resources, C.M., L.A.M. and N.R.; data curation, C.M., L.A.M., H.C.-B. and N.R.; writing—original draft preparation, C.M., L.A.M. and H.C.-B.; writing—review and editing, C.M. and L.A.M.; supervision, C.M. and L.A.M.; project administration, C.M. and L.A.M.; funding acquisition, C.M. All authors have read and agreed to the published version of the manuscript.

Funding

This research was funded by I + D Project grant number CIP-2021002 from Universidad Central de Chile.

Institutional Review Board Statement

Not applicable.

Informed Consent Statement

Not applicable.

Data Availability Statement

The original contributions presented in the study are included in the article, further inquiries can be directed to the corresponding author.

Acknowledgments

This research was funded by I + D Project grant number CIP-2021002 from Universidad Central de Chile.

Conflicts of Interest

The authors declare that there are no conflicts of interest.

References

  1. Benjamim, C.J.R.; Alves, Y.; Alves, A.; Mota de Moraes, Y.; Sakagute, S.; da Silva, G.; Santos, L.; da Silva, L.; Scoqui, C.; Arosti, M.; et al. Nitrate-rich beet juice intake on cardiovascular performance in response to exercise in postmenopausal women with arterial hypertension: Study protocol for a randomized controlled trial. Trials 2023, 24, 94. [Google Scholar] [CrossRef] [PubMed]
  2. FAO. Global Food Losses and Food Waste—Extent, Causes and Prevention; FAO: Rome, Italy, 2011. [Google Scholar]
  3. Zainal Arifin, M.; Adzahan, N.M.; Abedin, N.Z.; Lasik-Kurdyś, M. Utilization of Food Waste and By-Products in the Fabrication of Active and Intelligent Packaging for Seafood and Meat Products. Foods 2023, 12, 456. [Google Scholar] [CrossRef]
  4. Paciulli, M.; Medina-Meza, I.G.; Chiavaro, E.; Barbosa-Cánovas, G.V. Impact of thermal and high pressure processing on quality parameters of beetroot (Beta vulgaris L.). LWT—Food Sci. Technol. 2016, 68, 98–104. [Google Scholar] [CrossRef]
  5. Ghazy, N.A.; El-Hafez, O.A.A.; El-Bakery, A.M.; El-Geddawy, D.I.H. Impact of silver nanoparticles and two biological treatments to control soft rot disease in sugar beet (Beta vulgaris L). Egypt. J. Biol. Pest Control 2021, 31, 3. [Google Scholar] [CrossRef]
  6. dos S. Baião, D.; da Silva, D.V.; Paschoalin, V.M. Beetroot, a Remarkable Vegetable: Its Nitrate and Phytochemical Contents Can be Adjusted in Novel Formulations to Benefit Health and Support Cardiovascular Disease Therapies. Antioxidants 2020, 9, 960. [Google Scholar] [CrossRef] [PubMed]
  7. Fu, Y.; Shi, J.; Xie, S.-Y.; Zhang, T.-Y.; Soladoye, O.P.; Aluko, R.E. Red Beetroot Betalains: Perspectives on Extraction, Processing, and Potential Health Benefits. J. Agric. Food Chem. 2020, 68, 11595–11611. [Google Scholar] [CrossRef] [PubMed]
  8. Sadowska-Bartosz, I.; Bartosz, G. Biological Properties and Applications of Betalains. Molecules 2021, 26, 2520. [Google Scholar] [CrossRef] [PubMed]
  9. Jackson, J.; Patterson, A.J.; Macdonald-Wicks, L.; McEvoy, M. The role of inorganic nitrate and nitrite in CVD. Nutr. Res. Rev. 2017, 30, 247–264. [Google Scholar] [CrossRef] [PubMed]
  10. Yang, W.; Kaimainen, M.; Järvenpää, E.; Sandell, M.; Huopalahti, R.; Yang, B.; Laaksonen, O. Red beet (Beta vulgaris) betalains and grape (Vitis vinifera) anthocyanins as colorants in white currant juice – Effect of storage on degradation kinetics, color stability and sensory properties. Food Chem. 2021, 348, 128995. [Google Scholar] [CrossRef] [PubMed]
  11. Sawicki, T.; Bączek, N.; Wiczkowski, W. Betalain profile, content and antioxidant capacity of red beetroot dependent on the genotype and root part. J. Funct. Foods 2016, 27, 249–261. [Google Scholar] [CrossRef]
  12. Wroblewska, M.; Juskiewicz, J.; Wiczkowski, W. Physiological properties of beetroot crisps applied in standard and dyslipidaemic diets of rats. Lipids Health Dis. 2011, 10, 178. [Google Scholar] [CrossRef]
  13. Čanadanović-Brunet, J.M.; Savatović, S.S.; Ćetković, G.S.; Vulić, J.J.; Djilas, S.M.; Markov, S.L.; Cvetković, D.D. Antioxidant and Antimicrobial Activities of Beet Root Pomace Extracts. Czech. J. Food Sci. 2011, 29, 575–585. [Google Scholar]
  14. Akan, S.; Gunes, N.T.; Erkan, M. Red beetroot: Health benefits, production techniques, and quality maintaining for food industry. J. Food Process. Preserv. 2021, 45, 10. [Google Scholar] [CrossRef]
  15. Battistella Lasta, H.F.; Lentz, L.; Rodrigues, L.G.G.; Mezzomo, N.; Vitali, L.; Ferreira, S.R.S. Pressurized liquid extraction applied for the recovery of phenolic compounds from beetroot waste. Biocatal. Agric. Biotechnol. 2019, 21, 101353. [Google Scholar] [CrossRef]
  16. Bengardino, M.B.; Fernandez, M.V.; Nutter, J.; Jagus, R.J.; Agüero, M.V. Recovery of bioactive compounds from beet leaves through simultaneous extraction: Modelling and process optimization. Food Bioprod. Process. 2019, 118, 227–236. [Google Scholar] [CrossRef]
  17. Fernandez, M.V.; Jagus, R.J.; Agüero, M.V. Evaluation and characterization of nutritional, microbiological and sensory properties of beet greens. Acta Sci. Nutr. Health 2017, 3, 37–45. [Google Scholar]
  18. Biondo, P.B.F.; Boeing, J.S.; Barizão, É.O.; Souza, N.E.D.; Matsushita, M.; Oliveira, C.C.D.; Boroski, M.; Visentainer, J.V. Evaluation of beetroot (Beta vulgaris L.) leaves during its developmental stages: A chemical composition study. Food Sci. Technol. 2014, 34. [Google Scholar] [CrossRef]
  19. Asadi, S.Z.; Khan, M.A. The Effect of Beetroot (Beta vulgaris L.) Leaves Powder on Nutritional, Textural, Sensorial and Antioxidant Properties of Cookies. J. Culin. Sci. Technol. 2021, 19, 424–438. [Google Scholar] [CrossRef]
  20. Zzaman, W.; Biswas, R.; Hossain, M.A. Application of immersion pre-treatments and drying temperatures to improve the comprehensive quality of pineapple (Ananas comosus) slices. Heliyon 2021, 7, e05882. [Google Scholar] [CrossRef]
  21. AACC. Method 30-20: Crude Fat in Grain and Stock Feeds, Method 44-15A: Moisture, Method 46-13: Crude Protein-Micro-Kjeldahl Method, Method 54-21: Farinograph Method for Flour. Approved Methods of American Asociation of Cereal Chemistry; AACC: Saint Paul, MN, USA, 1995. [Google Scholar]
  22. AACC. Method 08-03.01: Ash—Rapid Method; American Association of Cereal Chemists (AACC): Saint Paul, MN, USA, 2000. [Google Scholar]
  23. Lee, S.C.; Prosky, L.; De Vries, J.W. Determination of total, soluble, and insoluble dietary fiber in foods: Enzymatic-gravimetric method, MES-TRIS buffer: Collaborative study. J. Assoc. Off. Anal. Chem. 1992, 75, 395–416. [Google Scholar] [CrossRef]
  24. White, J.A.; Hart, R.J.; Fry, J.C. An evaluation of the Waters Pico-Tag system for the amino-acid analysis of food materials. J. Autom. Chem. 1986, 8, 170–177. [Google Scholar] [CrossRef] [PubMed]
  25. Vera, N.; Laguna, L.; Zura, L.; Puente, L.; Muñoz, L.A. Evaluation of the physical changes of different soluble fibres produced during an in vitro digestion. J. Funct. Foods 2019, 62, 103518. [Google Scholar] [CrossRef]
  26. AACC. Approved Methods of the American Association of Cereal Chemists; American Association of Cereal Chemists: St. Paul, MN, USA, 1989. [Google Scholar]
  27. Segura-Campos, M.R.; Ciau-Solis, N.; Rosado-Rubio, G.; Chel-Guerrero, L.; Betancur-Ancona, D. Chemical and Functional Properties of Chia Seed (Salvia hispanica L.) Gum. Int. J. Food Sci. 2014, 2014, 241053. [Google Scholar] [CrossRef] [PubMed]
  28. Timilsena, Y.P.; Adhikari, R.; Kasapis, S.; Adhikari, B. Molecular and functional characteristics of purified gum from Australian chia seeds. Carbohydr. Polym. 2016, 136, 128–136. [Google Scholar] [CrossRef] [PubMed]
  29. Ravichandran, K.; Saw, N.M.M.T.; Mohdaly, A.A.A.; Gabr, A.M.M.; Kastell, A.; Riedel, H.; Cai, Z.; Knorr, D.; Smetanska, I. Impact of processing of red beet on betalain content and antioxidant activity. Food Res. Int. 2013, 50, 670–675. [Google Scholar] [CrossRef]
  30. Chua, M.-T.; Tung, Y.-T.; Chang, S.-T. Antioxidant activities of ethanolic extracts from the twigs of Cinnamomum osmophloeum. Bioresour. Technol. 2008, 99, 1918–1925. [Google Scholar] [CrossRef]
  31. Brand-Williams, W.; Cuvelier, M.E.; Berset, C. Use of a free radical method to evaluate antioxidant activity. LWT-Food Sci. Technol. 1995, 28, 25–30. [Google Scholar] [CrossRef]
  32. Lawless, H.T.; Heymann, H. Sensory Evaluation of Food: Principles and Practices; Springer Science & Business Media: New York, USA, 2010. [Google Scholar]
  33. Mandale, N.M.; Attkan, A.K.; Kumar, S.; Kumar, N. Drying kinetics and quality assessment of refractance window dried beetroot. J. Food Process Eng. 2023, 46, e14332. [Google Scholar] [CrossRef]
  34. Çetin, N. Prediction of moisture ratio and drying rate of orange slices using machine learning approaches. J. Food Process. Preserv. 2022, 46, e17011. [Google Scholar] [CrossRef]
  35. Qu, H.; Masud, M.H.; Islam, M.; Khan, M.I.H.; Ananno, A.A.; Karim, A. Sustainable food drying technologies based on renewable energy sources. Crit. Rev. Food Sci. Nutr. 2022, 62, 6872–6886. [Google Scholar] [CrossRef]
  36. Milião, G.L.; de Oliveira, A.P.H.; Soares, L.D.S.; Arruda, T.R.; Vieira, É.N.R.; Junior, B.R.D.C.L. Unconventional food plants: Nutritional aspects and perspectives for industrial applications. Future Foods 2022, 5, 100124. [Google Scholar] [CrossRef]
  37. Tamayo Tenorio, A.; Schreuders, F.K.G.; Zisopoulos, F.K.; Boom, R.M.; van der Goot, A.J. Processing concepts for the use of green leaves as raw materials for the food industry. J. Clean. Prod. 2017, 164, 736–748. [Google Scholar] [CrossRef]
  38. Akyüz, A.; Ersus, S. Optimization of enzyme assisted extraction of protein from the sugar beet (Beta vulgaris L.) leaves for alternative plant protein concentrate production. Food Chem. 2021, 335, 127673. [Google Scholar] [CrossRef] [PubMed]
  39. Abdo, E.; El-Sohaimy, S.; Shaltout, O.; Abdalla, A.; Zeitoun, A. Nutritional Evaluation of Beetroots (Beta vulgaris L.) and Its Potential Application in a Functional Beverage. Plants 2020, 9, 1752. [Google Scholar] [CrossRef]
  40. Alexandra, K.; Anne, V.; Jean-Paul, V.; Harry, G.; Alexander, W.P. Effect of Plant Age on the Quantity and Quality of Proteins Extracted from Sugar Beet (Beta vulgaris L.) Leaves. J. Agric. Food Chem. 2016, 64, 8305–8314. [Google Scholar]
  41. USDA. Agricultural Research Service. FoodData Central. 2019. Available online: https://fdc.nal.usda.gov (accessed on 9 February 2024).
  42. Waseem, M.; Akhtar, S.; Manzoor, M.F.; Mirani, A.A.; Ali, Z.; Ismail, T.; Ahmad, N.; Karrar, E. Nutritional characterization and food value addition properties of dehydrated spinach powder. Food Sci. Nutr. 2021, 9, 1213–1221. [Google Scholar] [CrossRef]
  43. Cui, R.; Fei, Y.; Zhu, F. Physicochemical, structural and nutritional properties of steamed bread fortified with red beetroot powder and their changes during breadmaking process. Food Chem. 2022, 383, 132547. [Google Scholar] [CrossRef]
  44. Anderson, J.W.; Baird, P.; Davis, J.R.H.; Ferreri, S.; Knudtson, M.; Koraym, A.; Waters, V.; Williams, C.L. Health benefits of dietary fiber. Nutr. Rev. 2009, 67, 188–205. [Google Scholar] [CrossRef]
  45. Lee, H.; Kim, J.E.; Chung, M.-S.; Min, S.C. Cold plasma treatment for the microbiological safety of cabbage, lettuce, and dried figs. Food Microbiol. 2015, 51, 74–80. [Google Scholar] [CrossRef] [PubMed]
  46. WHO; FAO; UNU. Protein and Aminoacid Requirements in Human Nutrition; WHO, World Health Organization: Geneva, Switzerland, 2007. [Google Scholar]
  47. Calder, P.C. Functional Roles of Fatty Acids and Their Effects on Human Health. J. Parenter. Enter. Nutr. 2015, 39, 18S–32S. [Google Scholar] [CrossRef]
  48. Cook, R.; Lupette, J.; Benning, C. The Role of Chloroplast Membrane Lipid Metabolism in Plant Environmental Responses. Cells 2021, 10, 706. [Google Scholar] [CrossRef] [PubMed]
  49. Mancini, A.; Imperlini, E.; Nigro, E.; Montagnese, C.; Daniele, A.; Orrù, S.; Buono, P. Biological and Nutritional Properties of Palm Oil and Palmitic Acid: Effects on Health. Molecules 2015, 20, 17339–17361. [Google Scholar] [CrossRef] [PubMed]
  50. Saini, R.K.; Ravishankar, G.A.; Keum, Y.S. Microalgae and Thraustochytrids are Sustainable Sources of Vegan EPA and DHA with Commercial Feasibility. Indian J. Microbiol. 2023, 63, 155–158. [Google Scholar] [CrossRef]
  51. Rahman, N.; Hashem, S.; Akther, S.; Jothi, J.S. Impact of various extraction methods on fatty acid profile, physicochemical properties, and nutritional quality index of Pangus fish oil. Food Sci. Nutr. 2023, 11, 4688–4699. [Google Scholar] [CrossRef]
  52. Hiremath, S.; Fergusson, D.; Knoll, G.; Ramsay, T.; Kong, J.; Ruzicka, M. Diet or additional supplement to increase potassium intake: Protocol for an adaptive clinical trial. Trials 2022, 23, 147. [Google Scholar] [CrossRef] [PubMed]
  53. O’Gallagher, K.; Cardona, S.B.; Hill, C.; Al-Saedi, A.; Shahed, F.; Floyd, C.N.; McNeill, K.; Mills, C.E.; Webb, A.J. Grapefruit juice enhances the systolic blood pressure-lowering effects of dietary nitrate-containing beetroot juice. Br. J. Clin. Pharmacol. 2021, 87, 577–587. [Google Scholar] [CrossRef]
  54. Khare, A.; Samudre, S.; Arora, A. Sneak-peek into iron deficiency anemia in India: The need for food-based interventions and enhancing iron bioavailability. Food Res. Int. 2022, 162, 111927. [Google Scholar] [CrossRef]
  55. Institute of Medicine (US) Panel on Micronutrients. Dietary Reference Intakes for Vitamin A, Vitamin K, Arsenic, Boron, Chromium, Copper, Iodine, Iron, Manganese, Molybdenum, Nickel, Silicon, Vanadium, and Zinc; National Academies Press: Washington, DC, USA, 2001. [Google Scholar]
  56. EFSA. Dietary Reference Values for Nutrients Summary Report; EFSA Supporting Publications: Parma, Italy, 2017; p. e15121E. [Google Scholar]
  57. Dahdouh, S.; Grande, F.; Espinosa, S.N.; Vincent, A.; Gibson, R.; Bailey, K.; King, J.; Rittenschober, D.; Charrondière, U.R. Development of the FAO/INFOODS/IZINCG Global Food Composition Database for Phytate. J. Food Compos. Anal. 2019, 78, 42–48. [Google Scholar] [CrossRef] [PubMed]
  58. Gupta, R.K.; Gangoliya, S.S.; Singh, N.K. Reduction of phytic acid and enhancement of bioavailable micronutrients in food grains. J. Food Sci. Technol. 2015, 52, 676–684. [Google Scholar] [CrossRef]
  59. FAO; WHO. Vitamin and Mineral Requirements in Human Nutrition, 2nd ed.; World Health Organization: Geneva, Switzerland; Food and Agriculture Organization of the United Nations: Rome, Italy, 2004. [Google Scholar]
  60. Hurrell, R.F. Phytic acid degradation as a means of improving iron absorption. Int. J. Vitam. Nutr. Res. 2004, 74, 445–452. [Google Scholar] [CrossRef]
  61. Marolt, G.; Gričar, E.; Pihlar, B.; Kolar, M. Complex Formation of Phytic Acid With Selected Monovalent and Divalent Metals. Front. Chem. 2020, 8, 582746. [Google Scholar] [CrossRef]
  62. Mitrevski, J.; Pantelić, N.Đ.; Dodevska, M.S.; Kojić, J.S.; Vulić, J.J.; Zlatanović, S.; Gorjanović, S.; Laličić-Petronijević, J.; Marjanović, S.; Antić, V.V. Effect of Beetroot Powder Incorporation on Functional Properties and Shelf Life of Biscuits. Foods 2023, 12, 322. [Google Scholar] [CrossRef] [PubMed]
  63. Guillon, F.; Champ, M. Structural and physical properties of dietary fibres, and consequences of processing on human physiology. Food Res. Int. 2000, 33, 233–245. [Google Scholar] [CrossRef]
  64. Sturm, B.; Hensel, O. 12 Pigments and Nutrients during Vegetable Drying Processes, Dried Products Storage, and Their Associated Color Changes. In Handbook of Drying of Vegetables and Vegetable Products; CRC Press: Boca Raton, FL, USA, 2017; Volume 257. [Google Scholar]
  65. Dygas, D.; Nowak, S.; Olszewska, J.; Szymańska, M.; Mroczyńska-Florczak, M.; Berłowska, J.; Dziugan, P.; Kręgiel, D. Ability of Yeast Metabolic Activity to Reduce Sugars and Stabilize Betalains in Red Beet Juice. Fermentation 2021, 7, 105. [Google Scholar] [CrossRef]
  66. Kayın, N.; Atalay, D.; Akçay, T.T.; Erge, H.S. Color stability and change in bioactive compounds of red beet juice concentrate stored at different temperatures. J. Food Sci. Technol. 2019, 56, 5097–5106. [Google Scholar] [CrossRef]
  67. Ben Haj Koubaier, H.; Snoussi, A.; Essaidi, I.; Chaabouni, M.M.; Thonart, P.; Bouzouita, N. Betalain and Phenolic Compositions, Antioxidant Activity of Tunisian Red Beet (Beta vulgaris L. conditiva) Roots and Stems Extracts. Int. J. Food Prop. 2014, 17, 1934–1945. [Google Scholar] [CrossRef]
  68. de França, P.; RCruz-Tirado, J.P.; Barbin, D.F.; Kurozawa, L.E. Hot air drying of red beet: Process and product quality monitoring by digital images and near infrared spectroscopy. Dry. Technol. 2023, 41, 1085–1095. [Google Scholar] [CrossRef]
  69. Bunkar, D.S.; Anand, A.; Kumar, K.; Meena, M.; Goyal, S.K.; Paswan, V.K. Development of production technology for preparation of beetroot powder using different drying methods. Ann. Phytomed. 2020, 9, 293–301. [Google Scholar] [CrossRef]
  70. Bondonno, C.P.; Liu, A.H.; Croft, K.D.; Ward, N.C.; Yang, X.; Considine, M.J.; Puddey, I.B.; Woodman, R.J.; Hodgson, J.M. Short-term effects of nitrate-rich green leafy vegetables on blood pressure and arterial stiffness in individuals with high-normal blood pressure. Free. Radic. Biol. Med. 2014, 77, 353–362. [Google Scholar] [CrossRef]
  71. Kojić, J.; Belović, M.; Krulj, J.; Pezo, L.; Teslić, N.; Kojić, P.; Tukuljac, L.P.; Šeregelj, V.; Ilić, N. Textural, Color and Sensory Features of Spelt Wholegrain Snack Enriched with Betaine. Foods 2022, 11, 475. [Google Scholar] [CrossRef]
  72. Xiao, Z.; Lester, G.E.; Park, E.; Saftner, R.A.; Luo, Y.; Wang, Q. Evaluation and correlation of sensory attributes and chemical compositions of emerging fresh produce: Microgreens. Postharvest Biol. Technol. 2015, 110, 140–148. [Google Scholar] [CrossRef]
Figure 1. Effects of drying temperature on the moisture content curves of beetroot by-products over time. The values are means of triplicate analyses (n = 3) and the error bars represent the standard deviation.
Foods 13 02603 g001
Figure 2. Composition of amino acids (mg/g protein) based on the FAO/WHO/UNU (Food and Agriculture Organization/World Health Organization/United Nations University) standard reference pattern (g/100 g protein). The values are expressed as mean ± standard deviation (n = 3). Different lowercase letters indicate significant differences according to Tukey’s multiple range test (p < 0.05).
Foods 13 02603 g002
Figure 3. Effect of drying temperature on betalain content. Values are averages (n = 3). Different lowercase letters indicate significant differences according to Tukey’s multiple range test (p < 0.05).
Foods 13 02603 g003
Table 1. Tortilla formulation.
FormulationCornmeal
(%)
Beetroot Stem Flour (%)Beetroot Leaf Flour (%)
Snack 1100--
Snack 29055
Snack 3801010
Table 2. Effect of drying temperature on water activity and proximate composition.
Component
(g/100 g) d.m
LeavesStems
50 °C60 °C70 °C50 °C60 °C70 °C
Water Activity0.5036±0.0013 c0.4278±0.0008 b0.2011±0.0148 a0.4957±0.0021 c0.2851±0.0011 b0.1963±0.0066 a
Protein30.39±0.23 c30.54±0.98 c30.24±0.86 c15.24 b±0.3914.20±0.01 a14.44±0.51 a
Lipids4.0±0.02 c4.1±0.03 b3.5±0.02 a0.46±0.01 b0.53±0.02 a0.44±0.02 b
Phytic Acid0.146±0.001 c0.162±0.003 b0.178±0.004 a0.133±0.006 d0.118±0.001 e0.077±0.001 f
Total Dietary Fiber30.74±1.68 a27.09±6.73 ab30.42±1.07 ab32.88±2.24 b33.51±0.424 b32.71±2.04 b
Ash23.72 a±0.1224.15 a±0.0224.21 ab±0.0424.88 c±0.0125.43 bc±0.1825.47 bc±0.07
E.N.N12.4515.3612.7525.5325.3626.10
The values are expressed as mean ± standard deviation of triplicate measurements (n = 3). The data are expressed in dry basis (d.b). Different lowercase letters indicate significant differences according to Tukey’s multiple range test (p < 0.05). E.N.N: Calculated on the basis of 100-moisture-protein-lipid-ash and later corrected by humidity to declare the dry weight.
Table 3. Amino acid profile in stems and leaves of beetroot dried at different temperatures.
Leaves (50 °C)Leaves (60 °C)Leaves (70 °C)Stems (50 °C)Stems (60 °C)Stems (70 °C)
Essential aminoacids
Histidine0.216±0.009 b0.125±0.008 a0.203±0.002 b0.083±0.005 a0.082±0.002 a0.099±0.002 a
Threonine0.466±0.015 b0.464±0.008 b0.418±0.000 a0.144±0.003 b0.138±0.005 ab0.123±0.002 a
Valine0.065±0.002 a0.051±0.006 a0.047±0.001 a0.000±0.0000.000±0.0000.000±0.000
Methionine0.009±0.003 a0.022±0.001 c0.018±0.001 b0.003±0.000 b0.002±0.000 a0.002±0.000 a
Cysteine0.049±0.000 a0.060±0.004 b0.039±0.000 c0.039±0.003 a0.032±0.003 a0.065±0.001 b
Isoleucine0.475±0.002 c0.410±0.001 b0.365±0.000 a0.173±0.001 b0.161±0.002 b0.103±0.005 a
Leucine0.851±0.005 c0.670±0.004 b0.608±0.000 a0.287±0.002 b0.266±0.003 b0.151±0.007 a
Phenylalanine0.524±0.008 c0.486±0.003 b0.436±0.004 a0.168±0.007 b0.157±0.001 b0.102±0.002 a
Tyrosyne0.821±0.002 c0.713±0.006 b0.608±0.006 a0.286±0.001 b0.269±0.001 b0.169±0.011 a
Lysine0.631±0.003 c0.565±0.006 b0.521±0.004 a0.219±0.009 b0.202±0.001 b0.134±0.003 a
EAAs4.106 3.565 3.263 1.402 1.308 0.947
Non-essential aminoacids
Alanine0.744±0.002 c0.707±0.001 b0.633±0.006 a0.299±0.010 ab0.336±0.013 b0.259±0.010 a
Arginine0.489±0.001 a0.470±0.014 a0.439±0.002 a0.013±0.000 a0.018±0.000 b0.013±0.001 a
Aspartic acid1.228±0.028 c1.003±0.020 b0.878±0.005 a0.405±0.002 c0.388±0.002 b0.271±0.002 a
Glutamic acid1.668±0.020 c1.371±0.020 b1.188±0.004 a0.692±0.025 b0.550±0.013 a0.470±0.019 a
Glycine0.700±0.006 b0.744±0.013 b0.673±0.005 a0.297±0.004 b0.303±0.004 b0.278±0.001 a
Hydroxiproline0.071±0.002 b0.065±0.001 a0.069±0.001 ab0.181±0.001 b0.161±0.001 a0.154±0.004 a
Serine0.511±0.028 b0.508±0.010 b0.464±0.000 a0.228±0.003 c0.205±0.003 b0.186±0.003 a
Values are expressed as mean ± standard deviation of triplicate measurements (n = 3). The data are expressed in dry basis (d.b). Different lowercase letters indicate significant differences according to Tukey’s multiple range test (p < 0.05); EAAs—essential amino acids.
Table 4. Fatty acids profile in stems and leaves of beetroot dried at different temperatures.
ParameterLipid NumberUnitsLeaves 50 °CLeaves 60 °CLeaves 70 °CStems 50 °CStems 60 °CStems 70 °C
Lipids g/100 g44.13.50.460.530.44
Total saturated fatty acids g/100 g0.8 a0.93 c0.88 b0.10 a0.10 a0.10 a
Total Polyunsaturated fatty acids g/100 g2.9 c2.84 b2.37 a0.32 b0.39 c0.30 a
Total monounsaturated fatty acids g/100 g0.30 b0.33 c0.25 a0.04 a0.04 a0.04 a
Fatty acid
MyristicC14:0g/100 g0.04±0.00 a0.03±0.00 b0.03±0.00 bTraces TracesTraces
 PalmiticC16:0g/100 g 0.58±0.01 a0.69±0.00 c0.66±0.00 b0.08±0.00 a0.08±0.00 a0.08±0.00 a
MargaricoC17:0g/100 g 0.01±0.00 a0.01±0.00 a0.01±0.00 aTracesTracesTraces
 StearicC18:0g/100 g 0.09±0.01 a0.11±0.01 c0.10±0.01 b0.01±0.00 aTraces0.01±0.00 a
 ArachidicC20:0g/100 g 0.02±0.00 a0.03±0.00 b0.02 ±0.00 aTracesTracesTraces
BehenicC22:0g/100 g 0.03±0.00 b0.03±0.00 b0.01±0.00 aTracesTracesTraces
LignocericoC24:0g/100 g 0.03±0.00 a0.03±0.00 a0.03±0.00 a0.01±0.00 a0.01±0.00 aTraces
Other Unidentified-g/100 g 0.35±0.01 b0.49±0.03 c0.25±0.03 a0.02±0.00 a0.03±0.00 b0.02±0.00 a
Ʃ SFA 0.8 a0.93 c0.88 b0.10 a0.10 a0.10 a
 Palmitoleic acidC16:1n7g/100 g Traces0.01±0.00 a 0.01±0.00 aTracesTracesTraces
 OleicC18:1n9g/100 g 0.29±0.00 b0.31±0.00 c0.24±0.00 a0.04±0.00 b0.04±0.00 b0.03±0.00 a
Eicosanoic acidC20:1n9g/100 g 0.01±0.00 a0.01±0.00 a0.01±0.00 aTracesTracesTraces
Ʃ MUFA 2.9 c2.84 b2.37 a0.32 b0.39 c0.30 a
 Linoleic acid (LA)C18:2n6cg/100 g 0.54±0.00 b0.57±0.00 c0.51±0.00 a0.19±0.00 a0.24±0.00 b0.19±0.00 a
 α-Linolenic acid (ALA)C18:3n3g/100 g 2.36±0.03 c2.26±0.03 b1.86±0.03 a0.13±0.00 b0.15±0.00 c0.10±0.00 a
Ʃ PUFA 0.30 b0.33 c0.25 a0.04 a0.04 a0.04 a
Total omega 3 g/100 g 2.36 c2.26 b1.86 a0.13 b0.15 c0.10 a
Total omega 6 g/100 g 0.54 b0.57 c0.51 a0.19 a0.24 b0.19 a
LA/ALAC18:2n6c/C18:3n3g/g0.220.250.271.461.61.9
Adequate intake (AI) contribution expressed in energy percentage (%E) for LA and ALA for adults (≥18 age). The values are expressed as mean ± SD of three replicated determinations. The data are expressed in dry basis (d.b). Different lowercase letters indicate significant differences according to Tukey’s multiple range test (p < 0.05). SFAs—saturated fatty acids. MUFAs—monounsaturated fatty acids. PUFAs—polyunsaturated fatty acids.
Table 6. Functional properties of beetroot by-products.
SampleWAdC *
(g Water/g Sample)
WAbC *
(g Water/g Sample)
WHC *
(g Water/g Sample)
OHC *
(g Oil/g Sample)
Solubility (%)
30 °C60 °C70 °C80 °C
Leaves50 °C0.631±0.036 a5.93±0.75 bc5.17±0.10 a2.29±0.06 c41.63±1.19 b33.10±1.62 c39.53±0.74 a40.70±2.62 ab
60 °C0.631±0.002 a5.40±0.17 ab5.17±0.12 a2.17±0.09 ab40.69±1.44 ab36.00±1.26 c39.82±0.37 a38.88±1.88 a
70 °C0.618±0.006 a5.22±0.73 a5.09±0.19 a2.19±0.03 bc37.75±1.61 a36.42±1.34 c38.31±1.28 a42.56±1.39 bc
Stems50 °C1.28±0.02 b7.27±0.25 d8.15±0.31 b2.55±0.11 d45.14±1.74 c47.84±1.58 a48.98±1.07 b44.78±1.72 cd
60 °C1.32±0.01 b6.36±0.23 c7.66±0.30 c2.21±0.01 bc47.45±1.85 c48.19±0.46 b48.90±1.79 b48.35±1.78 e
70 °C1.370±0.04 c6.06±0.14 c6.01±0.20 d2.09±0.04 a46.88±2.31 c48.96±0.87 b46.31±0.88 b46.15±0.86 de
(*) WAdC—water adsorption capacity; WAbC—water absorption capacity; WHC/OHC—water/oil holding capacity. Different letters indicate significant differences (p< 0.05) according to the Tukey’s test.
Table 7. Color parameters.
CieLabLeavesStems
50 °C60 °C70 °C50 °C60 °C70 °C
L*54.68±0.31 c52.13±0.50 b50.17±1.47 a49.45±0.31 a50.19±0.60 a52.11±0.33 b
a*−8.79±0.14 a−8.53±0.38 ab−8.14±0.27 b15.52±0.47 e12.61±0.20 d6.72±0.45 c
b*15.57±0.08 d15.33±0.72 d15.53±1.19 d0.86±0.08 a3.22±0.18 b6.37±0.18 c
L*: luminosity; a*: red to green; b*: yellow to blue. Mean SD (n = 3). Different lowercase letters indicate significant differences according to Tukey’s multiple range test (p < 0.05).
Table 8. Effects of drying temperature on total phenolic content, antioxidant capacity, and nitrate content.
ParametersLeavesStems
50 °C60 °C70 °C50 °C60 °C70 °C
TPC (1)
(mg GAE/100 g)
558.9±5.3 b512.3±27.4 a478.2±12.9 a365.3±25.1 a362.2±69.8 a294.7±6.2 a
DPPH (2)
(µmol TE/100 g)
2057.24±1023.8 a3860.53±480.5 b3811.92±198.7 b2561.96±529.5 a3949.78±552.2 a2839.92±1108.7 a
Nitrate (mg/kg)159±0 c126±0 b100±0 a359±0 c314±0 b126.5±0.5 a
(1) Galic acid equivalents (GAEs); (2) Trolox equivalent (TE). The values are expressed as mean ± standard deviation of triplicate measurements (n = 3). Different lowercase letters indicate significant differences according to Tukey’s multiple range test (p < 0.05).
Table 9. Sensory attributes of snacks baked with beetroot by-products.
ParametersControl10%20%
Color4.5±0.7 c3.8±1.1 b3±0.9 a
Flavor3.8±0.9 ab4±1.0 c3.3±1.0 a
Texture3.6±0.8 a3.6±1.2 a3.3±1.0 a
General acceptability3.8±0.8 b3.8±1.1 b3.1±1.0 a
Different proportions of beetroot waste flour were evaluated compared to the control sample with only corn flour. Different lowercase letters indicate significant differences according to Tukey’s multiple range test (p < 0.05).
Disclaimer/Publisher’s Note: The statements, opinions and data contained in all publications are solely those of the individual author(s) and contributor(s) and not of MDPI and/or the editor(s). MDPI and/or the editor(s) disclaim responsibility for any injury to people or property resulting from any ideas, methods, instructions or products referred to in the content.

