Article

Susceptibility of Foodborne Pathogens to Milk-Origin Lactic Acid Bacteria Supernatants: A Comprehensive Meta-Regression Study

by
Nathália Fernandes
1,2,
Yara Loforte
1,2,3,
Vasco Cadavez
1,2 and
Ursula Gonzales-Barron
1,2,*
1
Centro de Investigação de Montanha (CIMO), Instituto Politécnico de Bragança, Campus de Santa Apolónia, 5300-253 Bragança, Portugal
2
Laboratório para a Sustentabilidade e Tecnologia em Regiões de Montanha, Instituto Politécnico de Bragança, Campus de Santa Apolónia, 5300-253 Bragança, Portugal
3
Divisão de Agricultura, Instituto Superior Politécnico de Manica, Campus de Matsinho, Manica 417, Mozambique
*
Author to whom correspondence should be addressed.
Foods 2024, 13(16), 2635; https://doi.org/10.3390/foods13162635
Submission received: 27 June 2024 / Revised: 2 August 2024 / Accepted: 19 August 2024 / Published: 22 August 2024
(This article belongs to the Special Issue Natural Antimicrobial Agents Utilized in Food Preservation)

Abstract

:
This systematic review and meta-analysis compile the in vitro antimicrobial efficacy of lactic acid bacteria (LAB) supernatants against three common pathogenic bacteria found in dairy products: Salmonella spp., L. monocytogenes, and Staphylococcus aureus. After screening and analysis of full papers, identified by searches in PubMed, Scopus, and Web of Science databases, thirty-nine studies were regarded as relevant, and a total of 510 observations were recorded. The effects of moderators on inhibition diameters were assessed by adjusting three pathogen-specific meta-regression models. Results showed that, in general terms, strains from the Enterococcus genus displayed the highest inhibition values against L. monocytogenes (15.90 ± 2.138 mm), whereas Lacticaseibacillus strains were more effective against S. aureus (11.89 ± 0.573 mm). The well diffusion test outperformed the spot and disk diffusion tests, and more acidic LAB supernatants resulted in higher measurements of inhibition diameters (p < 0.001). Meta-regression models incorporating LAB genus, pathogen concentration, and incubation time explained 33.8%, 52.3%, and 19.8% of the total variance in inhibition diameters for L. monocytogenes, Salmonella spp., and S. aureus, respectively. None of the three models showed evidence of publication bias. This meta-regression study demonstrated that LAB strains present in dairy products possess a variable capacity to inhibit any of the three foodborne pathogens. Overall, L. monocytogenes was found to exhibit greater susceptibility than Salmonella spp. and S. aureus; thus, the antilisterial capacity of the selected LAB strains could be exploited in developing biocontrol strategies for cheese-making.

1. Introduction

Fermented milk products such as cheese have a long history of preservation and culinary significance. In 2022, the European Union (EU) produced 160 million tons (m.t.) of raw milk, predominantly sourced from bovine (154.3 m.t.), ovine (3 m.t.), caprine (2.5 m.t.) and bubaline (0.3 m.t.) origins [1]. A portion of this raw milk was converted into cheese (10.4 m.t. of total production), with artisanal cheese production, particularly thriving in the Mediterranean regions [2,3,4]. However, artisanal cheese-making operations face challenges related to microbial contamination. To address this issue, there is a growing trend toward employing natural lactic acid bacteria (LAB) cultures to mitigate contamination risks and ensure the microbial safety and quality of cheese [3,4].
LAB constitute a specific taxonomic group of microorganisms characterized by their Gram-positive nature, lack of catalase enzyme, and limited mobility [5]. Owing to their technological and probiotic potential, autochthonous LAB have been sought [6]. Artisanal cheeses, particularly those made from raw milk, are rich sources of microbial diversity, especially for the discovery of new LAB strains. During fermentation, LAB produce substances that prevent harmful bacteria from growing in food. The main mechanism to achieve this is by producing lactic acid, which lowers pH and negatively influences bacteria survival [7]. LAB also releases other compounds, such as hydrogen peroxide, carbon dioxide, diacetyl, and bacteriocins, which further prevent bacterial growth [5].
However, ensuring the safety of raw milk cheese relies on various factors, including the type of cheese, initial microbial contamination, and the presence of harmful pathogens [6]. Foodborne diseases, as defined by the World Health Organization (WHO), are illnesses caused by consuming food contaminated with harmful microorganisms and their toxins [8,9]. These diseases can lead to a range of severe symptoms, including organ failure, digestive issues, immune system problems, and neurological complications [9,10].
Contaminated food poses a significant threat to both food safety and human health. There have been 181 notifications since 2020 for milk and milk products in the EU, according to the Rapid Alert System for Food and Feed (RASFF) [11]. Pathogens such as Listeria monocytogenes (n = 106), Salmonella spp. (n = 15), and Staphylococcus aureus (n = 3) are frequently associated with outbreaks of cheese consumption (124 of 181 notifications) [10,11].
Given the association of milk and its derivatives with various pathogenic microorganisms, improving the microbiological quality of cheese is imperative, warranting intensified efforts to ensure the safety of these products [12]. Traditional cheeses made from raw milk, without added starter cultures, harbor indigenous LAB strains with protective properties against pathogenic bacteria and are more suited for cheese-making environments compared to commercial starters [13]. Moreover, using LAB for natural food preservation meets the demand for healthier foods with fewer chemical additives and contributes to expanding the range of functional dairy products [14,15].
Numerous studies have focused on isolating autochthonous LAB strains and testing their efficacy against common pathogens. However, the lack of standardization and the absence of a unified protocol for evaluating these traits pose challenges. The variability in methodologies across studies makes it difficult to compare the results and draw comprehensive conclusions.
This study aimed to (1) perform a systematic review and meta-analysis of the in vitro susceptibility of foodborne pathogens, namely, L. monocytogenes, Salmonella spp., and S. aureus, to autochthonous LAB species isolated from dairy products and (2) assess the relative importance of different moderators in LAB supernatant antimicrobial activity. To achieve this, separate multilevel meta-analyses were conducted using up-to-date information extracted from relevant literature sources.

2. Materials and Methods

This systematic review was conducted in accordance with the Preferred Reporting Items for Systematic Reviews and Meta-Analyses (PRISMA) guidelines, which aim to improve the reporting of systematic reviews and meta-analyses, with the following statement questions: “Which LAB genus display the highest levels of antimicrobial activity; and which moderators influence the measured antimicrobial activity of LAB supernatant against pathogenic bacteria?” [16].

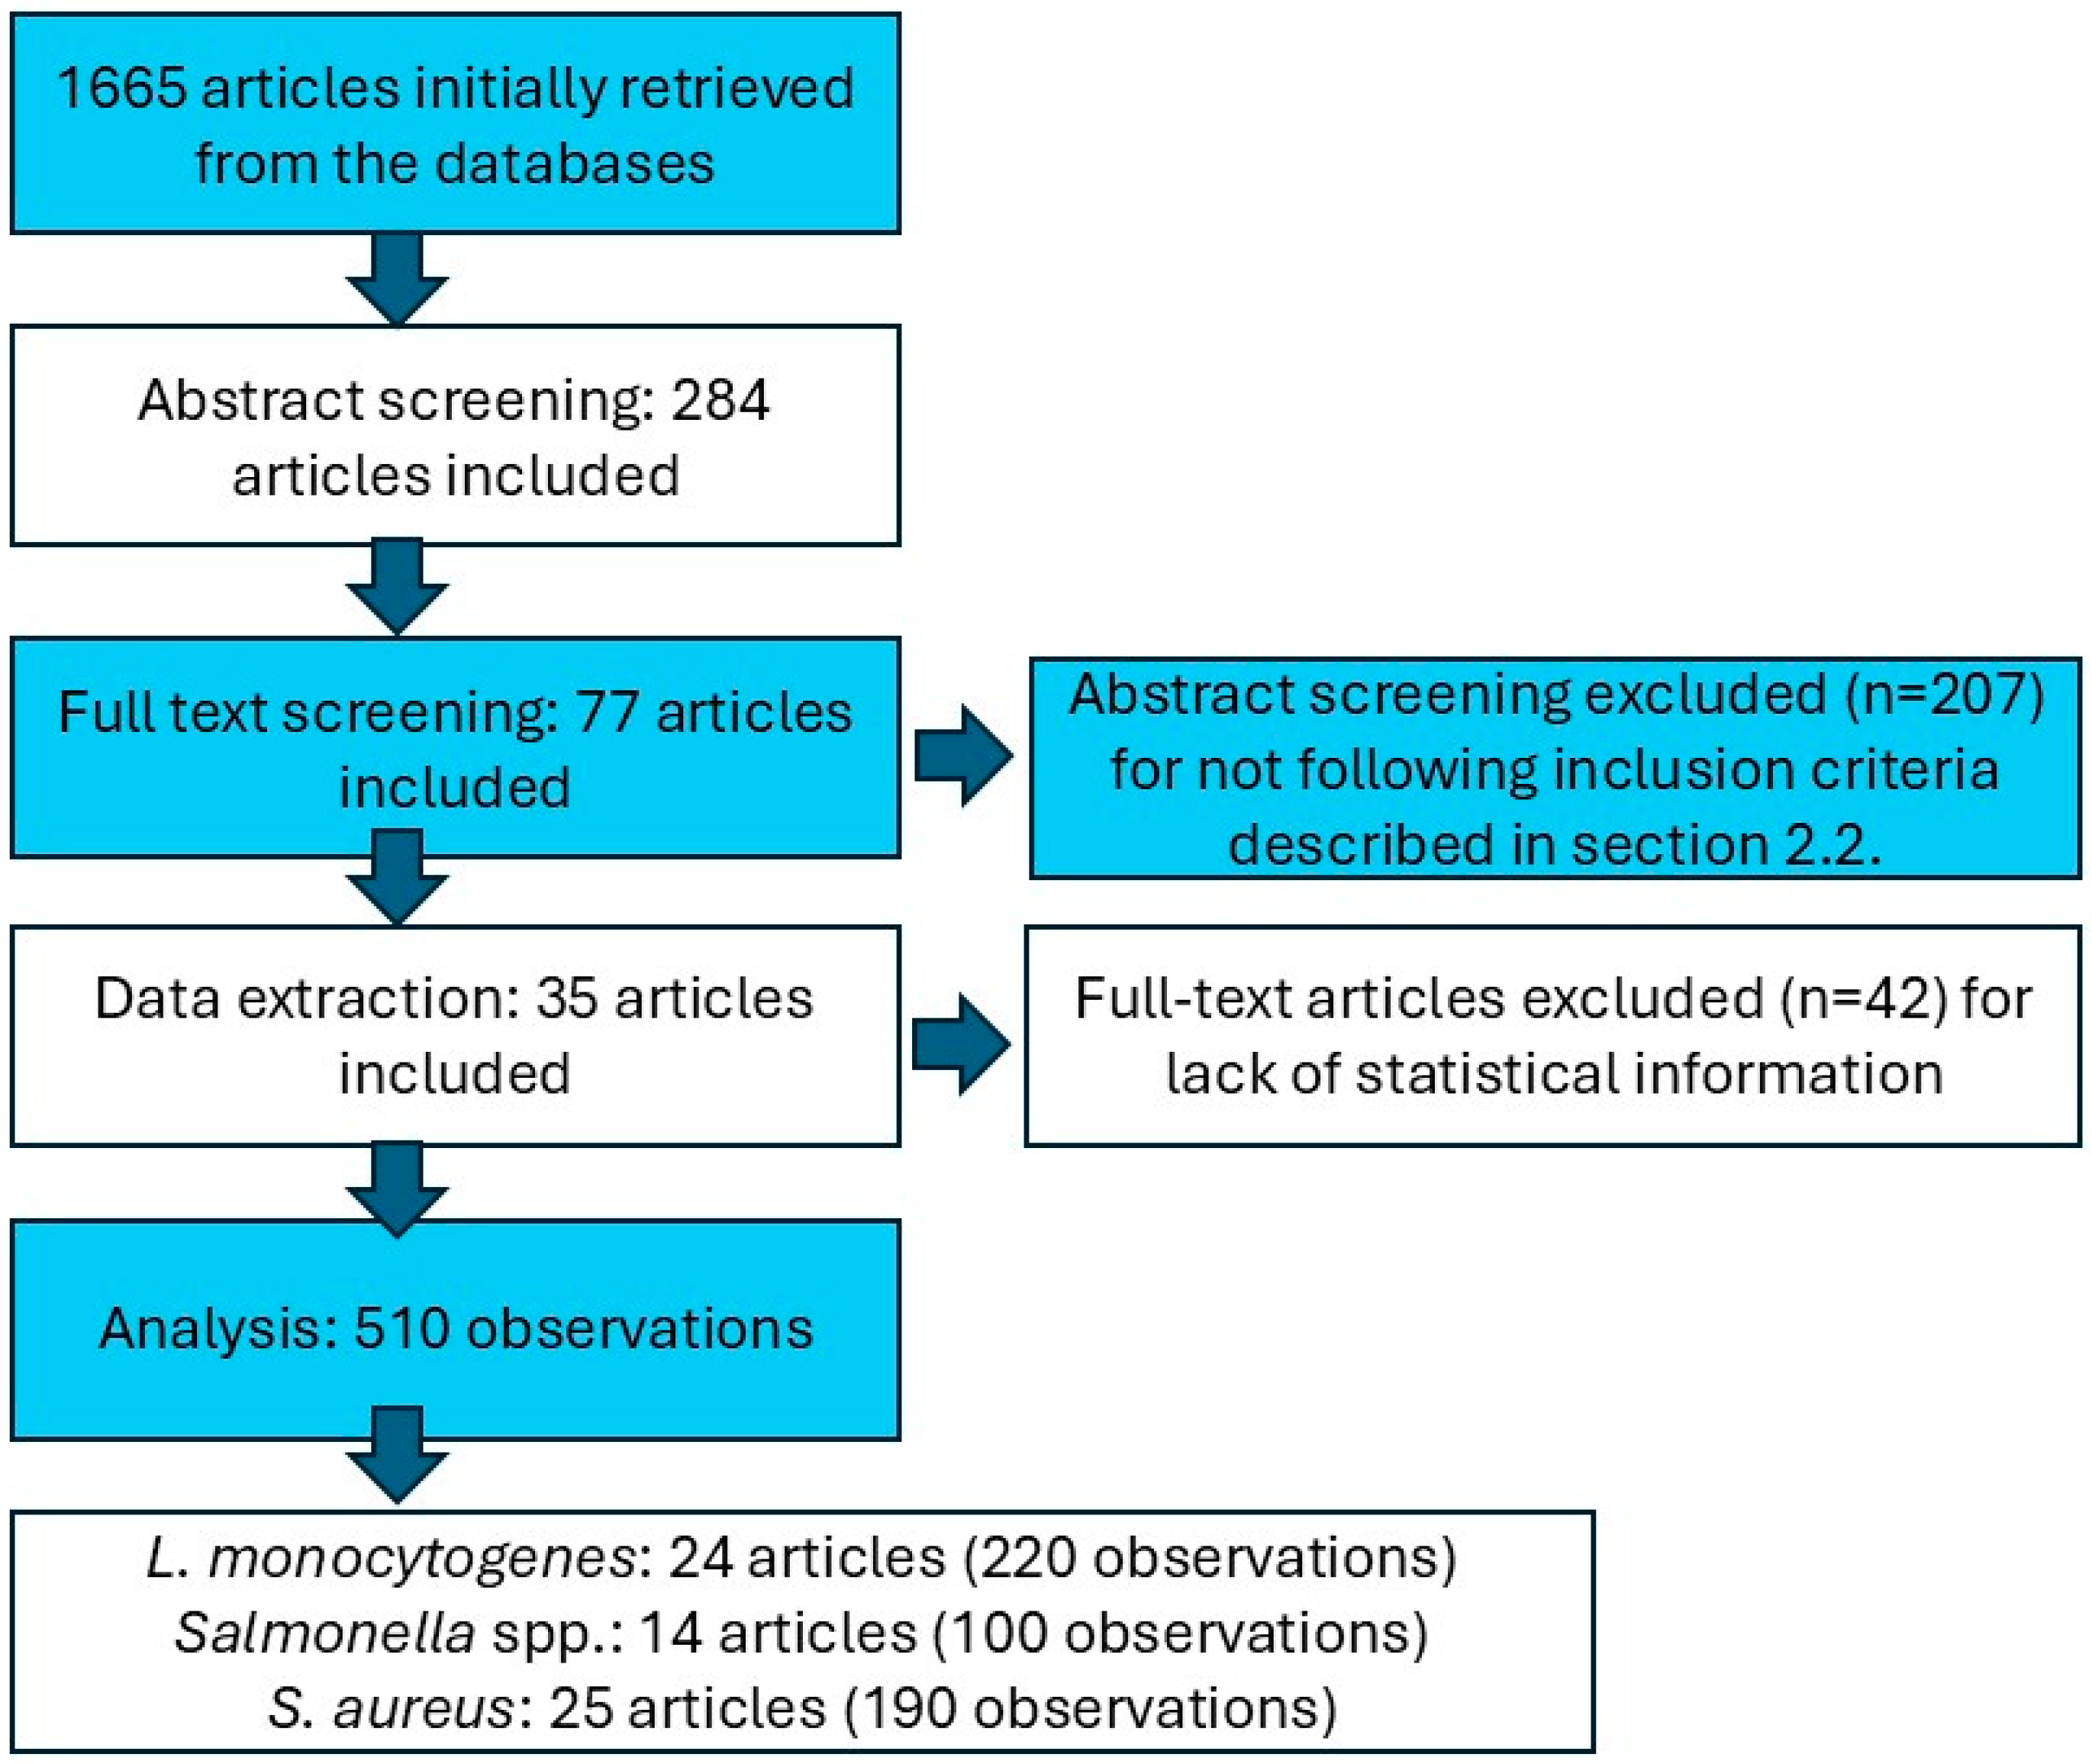
2.1. Bibliographic Search

Electronic searches were conducted in the PubMed, Scopus, and Web of Science databases to gather articles presenting results from in vitro assays carried out with autochthonous dairy LAB and their antimicrobial effects against foodborne pathogens such as L. monocytogenes, Salmonella spp., and S. aureus. The search was carried out by two reviewers in November 2022. The abstract bibliographic search was defined by terms encompassing cheese, starter culture, and antimicrobial properties against specific pathogens as follows:
(((cheese OR Milk OR Dairy) AND (lactic acid bacteria)) OR (starter culture) OR biocontrol) OR (lactobacillus)) AND (antimicrobial**)) OR (functional)) OR (preserv*)) OR (biopreserv*)) OR (antagoni*)) AND (Salmonella)) OR (Listeria monocytogenes)) OR (Staphylococcus aureus)) OR (pathogen*).
Searches were carried out using the specific syntax of PubMed, Scopus, and the Web of Science.

2.2. Data Extraction

Duplicate references were identified with the Rayyan software [17]; reviewers manually verified and removed duplicates. Subsequently, individual reviewers examined the titles and abstracts of the citations retrieved. The title and abstract evaluation adhered to specific inclusion criteria: (i) the article must be written in English or Portuguese; (ii) the article must be a primary study, this is, must present original results; (iii) studies should present results of inhibition diameter of LAB against at least one of the selected pathogens; (iv) articles must specify the origin of LAB, and it should be of dairy origin; and (v) studies must have LAB identified at species level
In the second step, the full text of selected articles were assessed to confirm their inclusion, considering any supplementary material if available. If the full text could not be retrieved, the corresponding author was contacted to request access [18]. Additional inclusion criteria for the full-text screening phase included the reporting of inhibition diameter or radius in continuous numeric values. Furthermore, the article had to provide the sample size or number of repetitions (N).
Next, data extraction was performed from the selected articles using Excel [19]. The extracted information encompassed details regarding the origin of LAB (milk source [cow, goat, sheep, NA], food type [milk, cheese, yogurt]), identification of LAB and pathogens (genus, species and strain), parameters from the susceptibility test method [agar spot, disc diffusion, well diffusion], duration of incubation, temperature of incubation, agar medium [Muller-Hinton, De Man–Rogosa–Sharpe, Nutrient, Trypticase soy, Brain Heart Infusion], mode of LAB application (bacteriocin or supernatant) and variations in protocol: concentration of pathogen, concentration of LAB, aliquot volume, pH of LAB (bacteriocin or supernatant).

2.3. Meta-Regression Modeling

This meta-analysis considered LAB to be evaluated for their antimicrobial activity as the study population. The primary measured outcome was the mean inhibition diameter (ID) in millimeters, which refers to the total halo formed around the colony, including the measurement of the colony, well, or disk in the final ID calculation [20]. If the articles presented the results in terms of radius, the values were converted to diameters.
Two types of multilevel random-effects meta-analysis regressions were fitted to data in order to answer different questions: the overarching meta-regression and the pathogen-specific meta-regressions.

2.3.1. Overarching Meta-Regression Models

The meta-regression model of the type,
I D p g a j = β 0 + u j + β 1 · P a t h o g e n p + β 2 · L A B g e n u s g + β 3 · A n t a g o n i s m A s s a y a + β 4 · [ P a t h o g e n ] + β 5 · I n c u b a t i o n T i m e + β 6 · A l i q u o t V o l u m e + ϵ p g a j
was adjusted to the full data, where β0 is an intercept, and β1, β2, and β3 are sets of fixed effects of the p types of pathogens, the g types of LAB genus, and a types of antagonism assay methods. The term β4 is the effect of a one log increase in pathogen concentration (log CFU/mL); β5 the effect of the incubation time (h), and β6 the effect of the aliquot volume (μL). The error term εpgaj represents the residuals and accounts for the variability between studies j. The remaining unexplained variability was extracted by placing random effects uj due to study j in the intercept β0.
The purpose of this model was to compare the extent of susceptibility to LAB supernatant among the three pathogens. Next, by removing the pathogen effect β1 from Equation (1), the same model was fitted to data subsets partitioned by the type of pathogen. The purpose of adjusting these three other models was to obtain meta-analytical estimates of ID (pooled ID) by the LAB genus and susceptibility method, solved for a pathogen concentration of 7.0 log CFU/mL and an incubation time of 24 h. In this way, the pooled ID aligned under the same conditions allowed for comparisons between the pooled estimates.

2.3.2. Pathogen-Specific Meta-Regression Models

Three separate meta-regression models were adjusted for pathogens. Data were then partitioned by L. monocytogenes, Salmonella spp., and S. aureus, and the following models were adjusted, respectively,
I D g j = β 0 + u j + β 1 · L A B g e n u s g + β 2 · [ P a t h o g e n ] + β 3 · I n c u b a t i o n T i m e + ϵ g j
I D a m j = β 0 + u j + β 3 · A n t a g o n i s m A s s a y a + β 2 · A g a r m + β 3 · I n c u b a t i o n T i m e + ϵ a m j
I D a g j = β 0 + u j + β 1 · L A B g e n u s g + β 2 · [ P a t h o g e n ] + β 3 · A n t a g o n i s m A s s a y a + ϵ a g j
where the coefficients can be interpreted as exposed beforehand; and, in addition, in Equation (3), β2 is the set of fixed effects for the types of agar. It can be observed that a different meta-regression solution was achieved for each pathogen. This occurs because the partitions have different data structures, which is very common in meta-analytical data sets; moreover, the models are data-driven. For the three pathogen-specific models, only significant terms were retained. Non-significant terms were dropped at α = 0.10. The purpose of the pathogen-specific meta-regressions was to assess the effect of moderators and, therefore, deduce which moderators are more determinant in observing changes in the measured ID. To further understand the effect of certain quantitative moderators, bubble plots were generated. Meta-analysis models and graphs were built in R version 4.3.3 [21] using the metafor package [22].

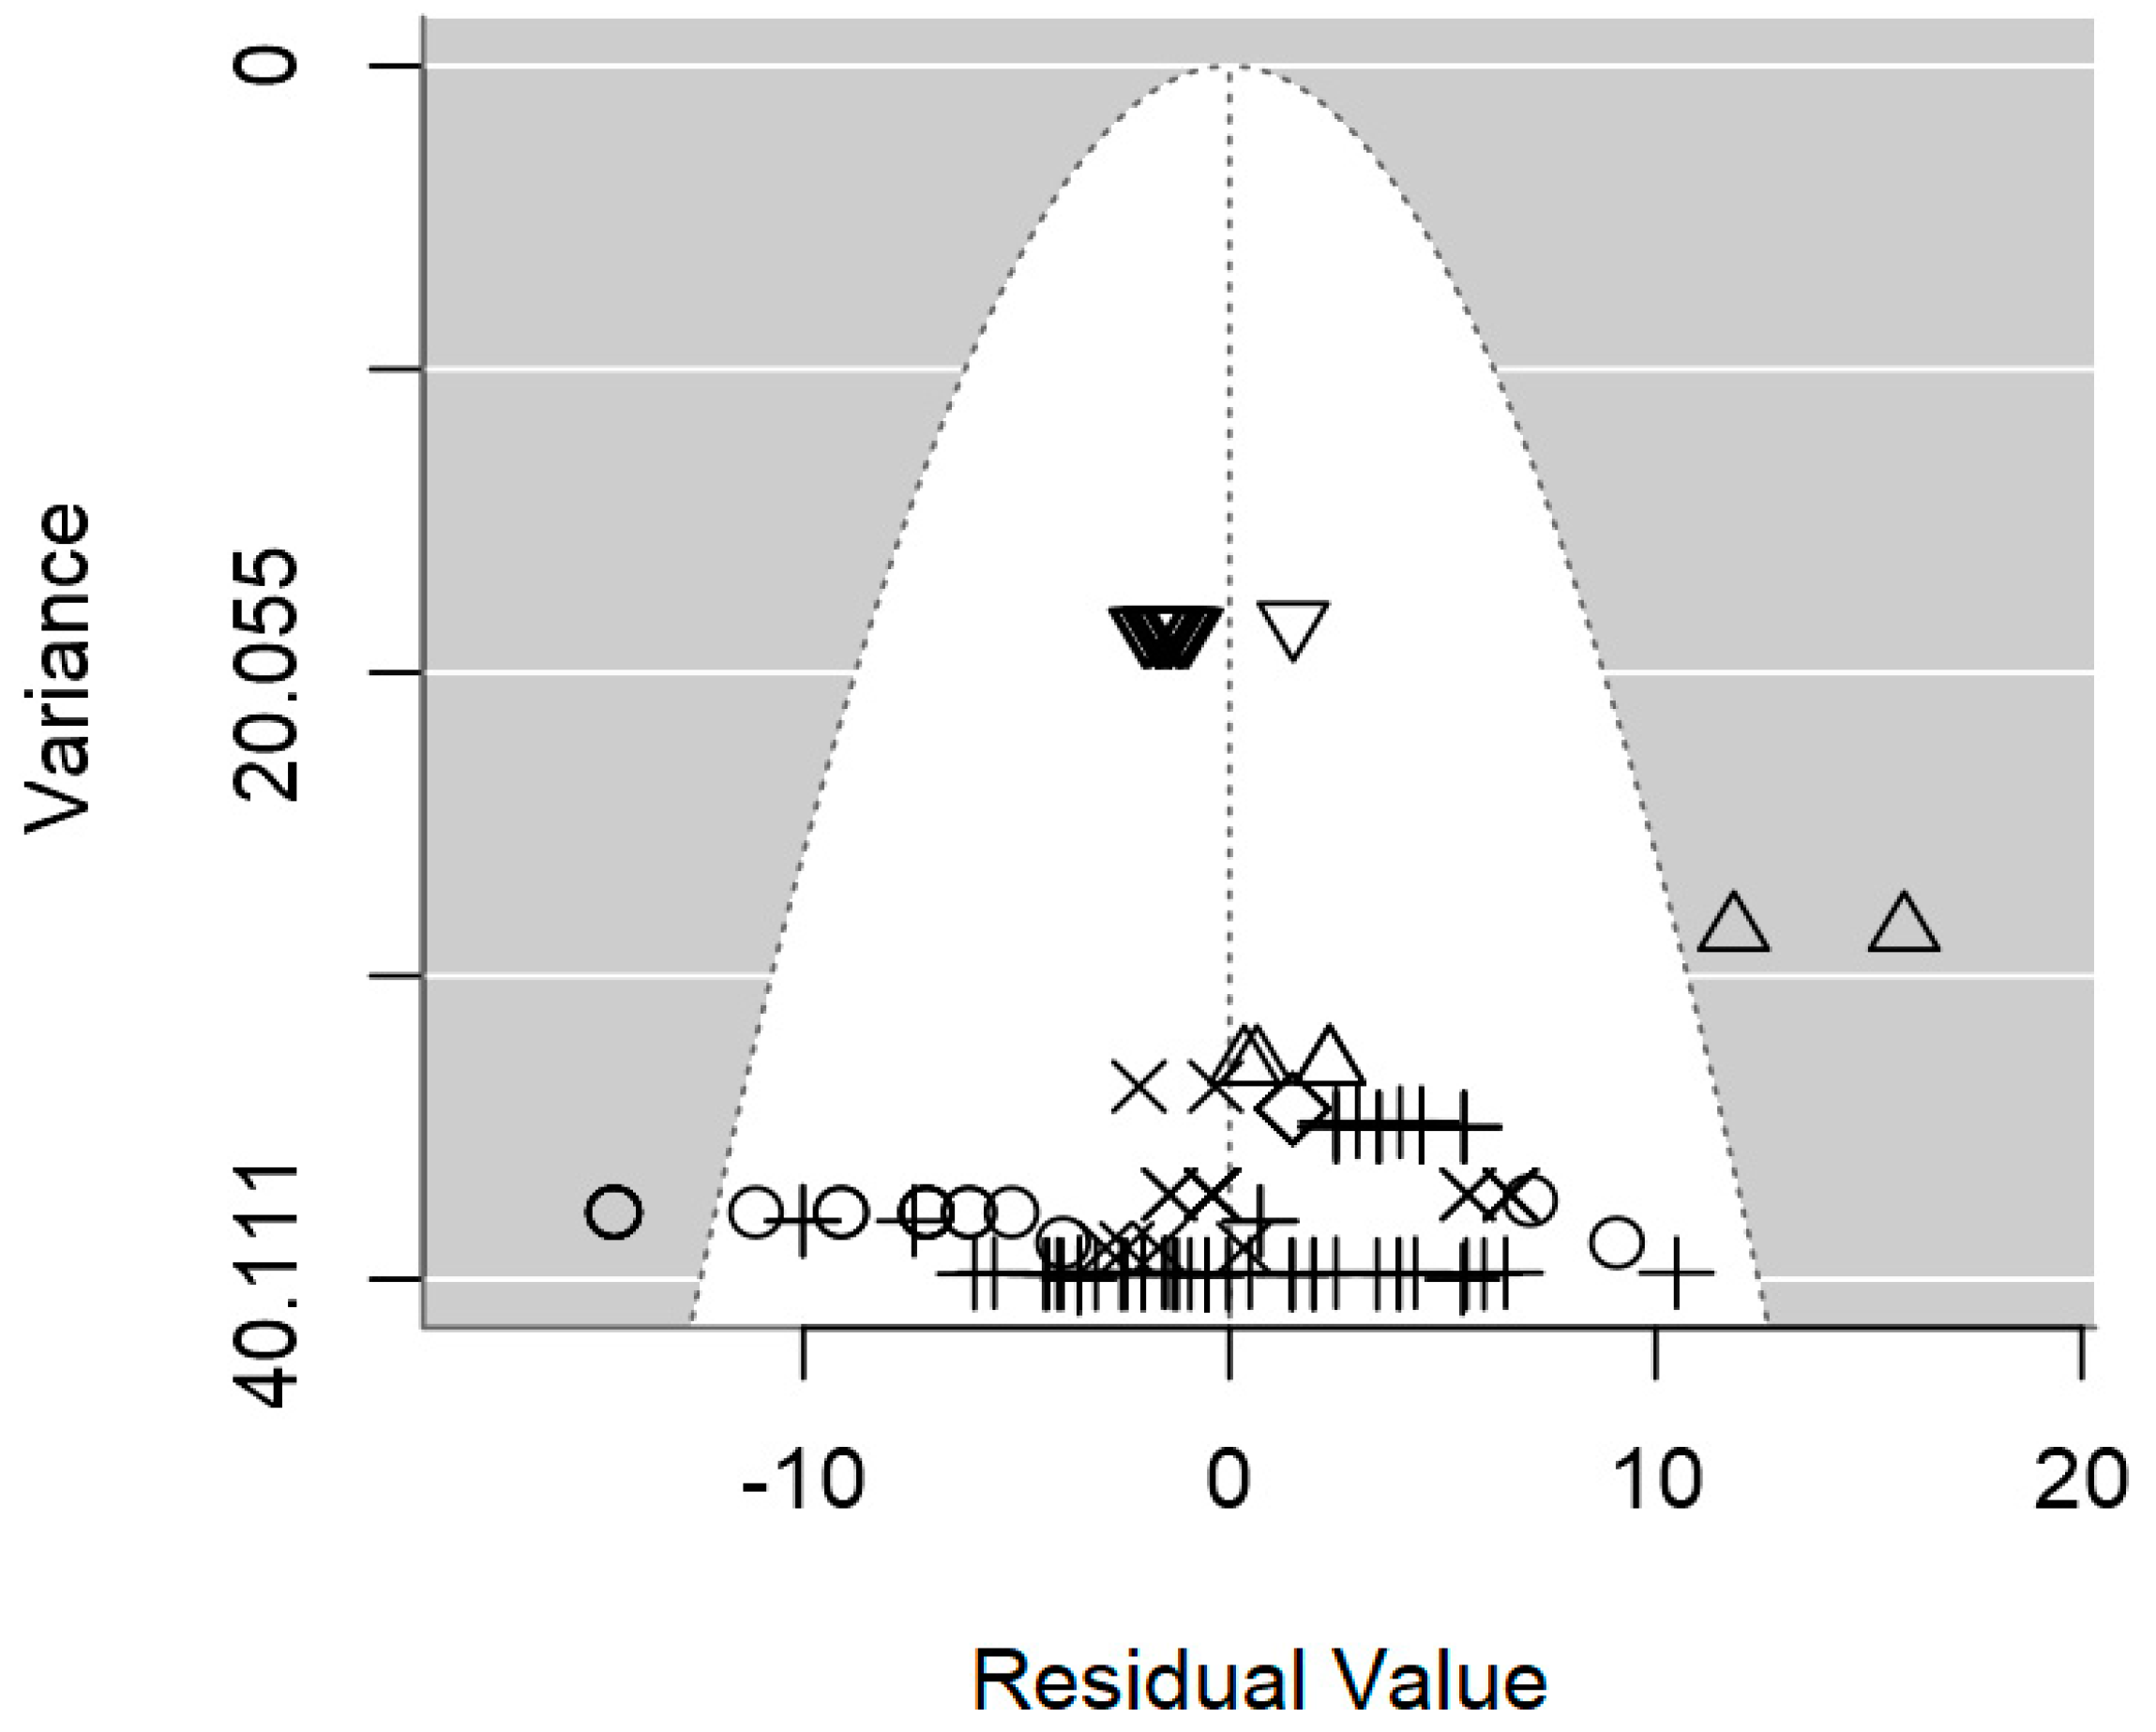
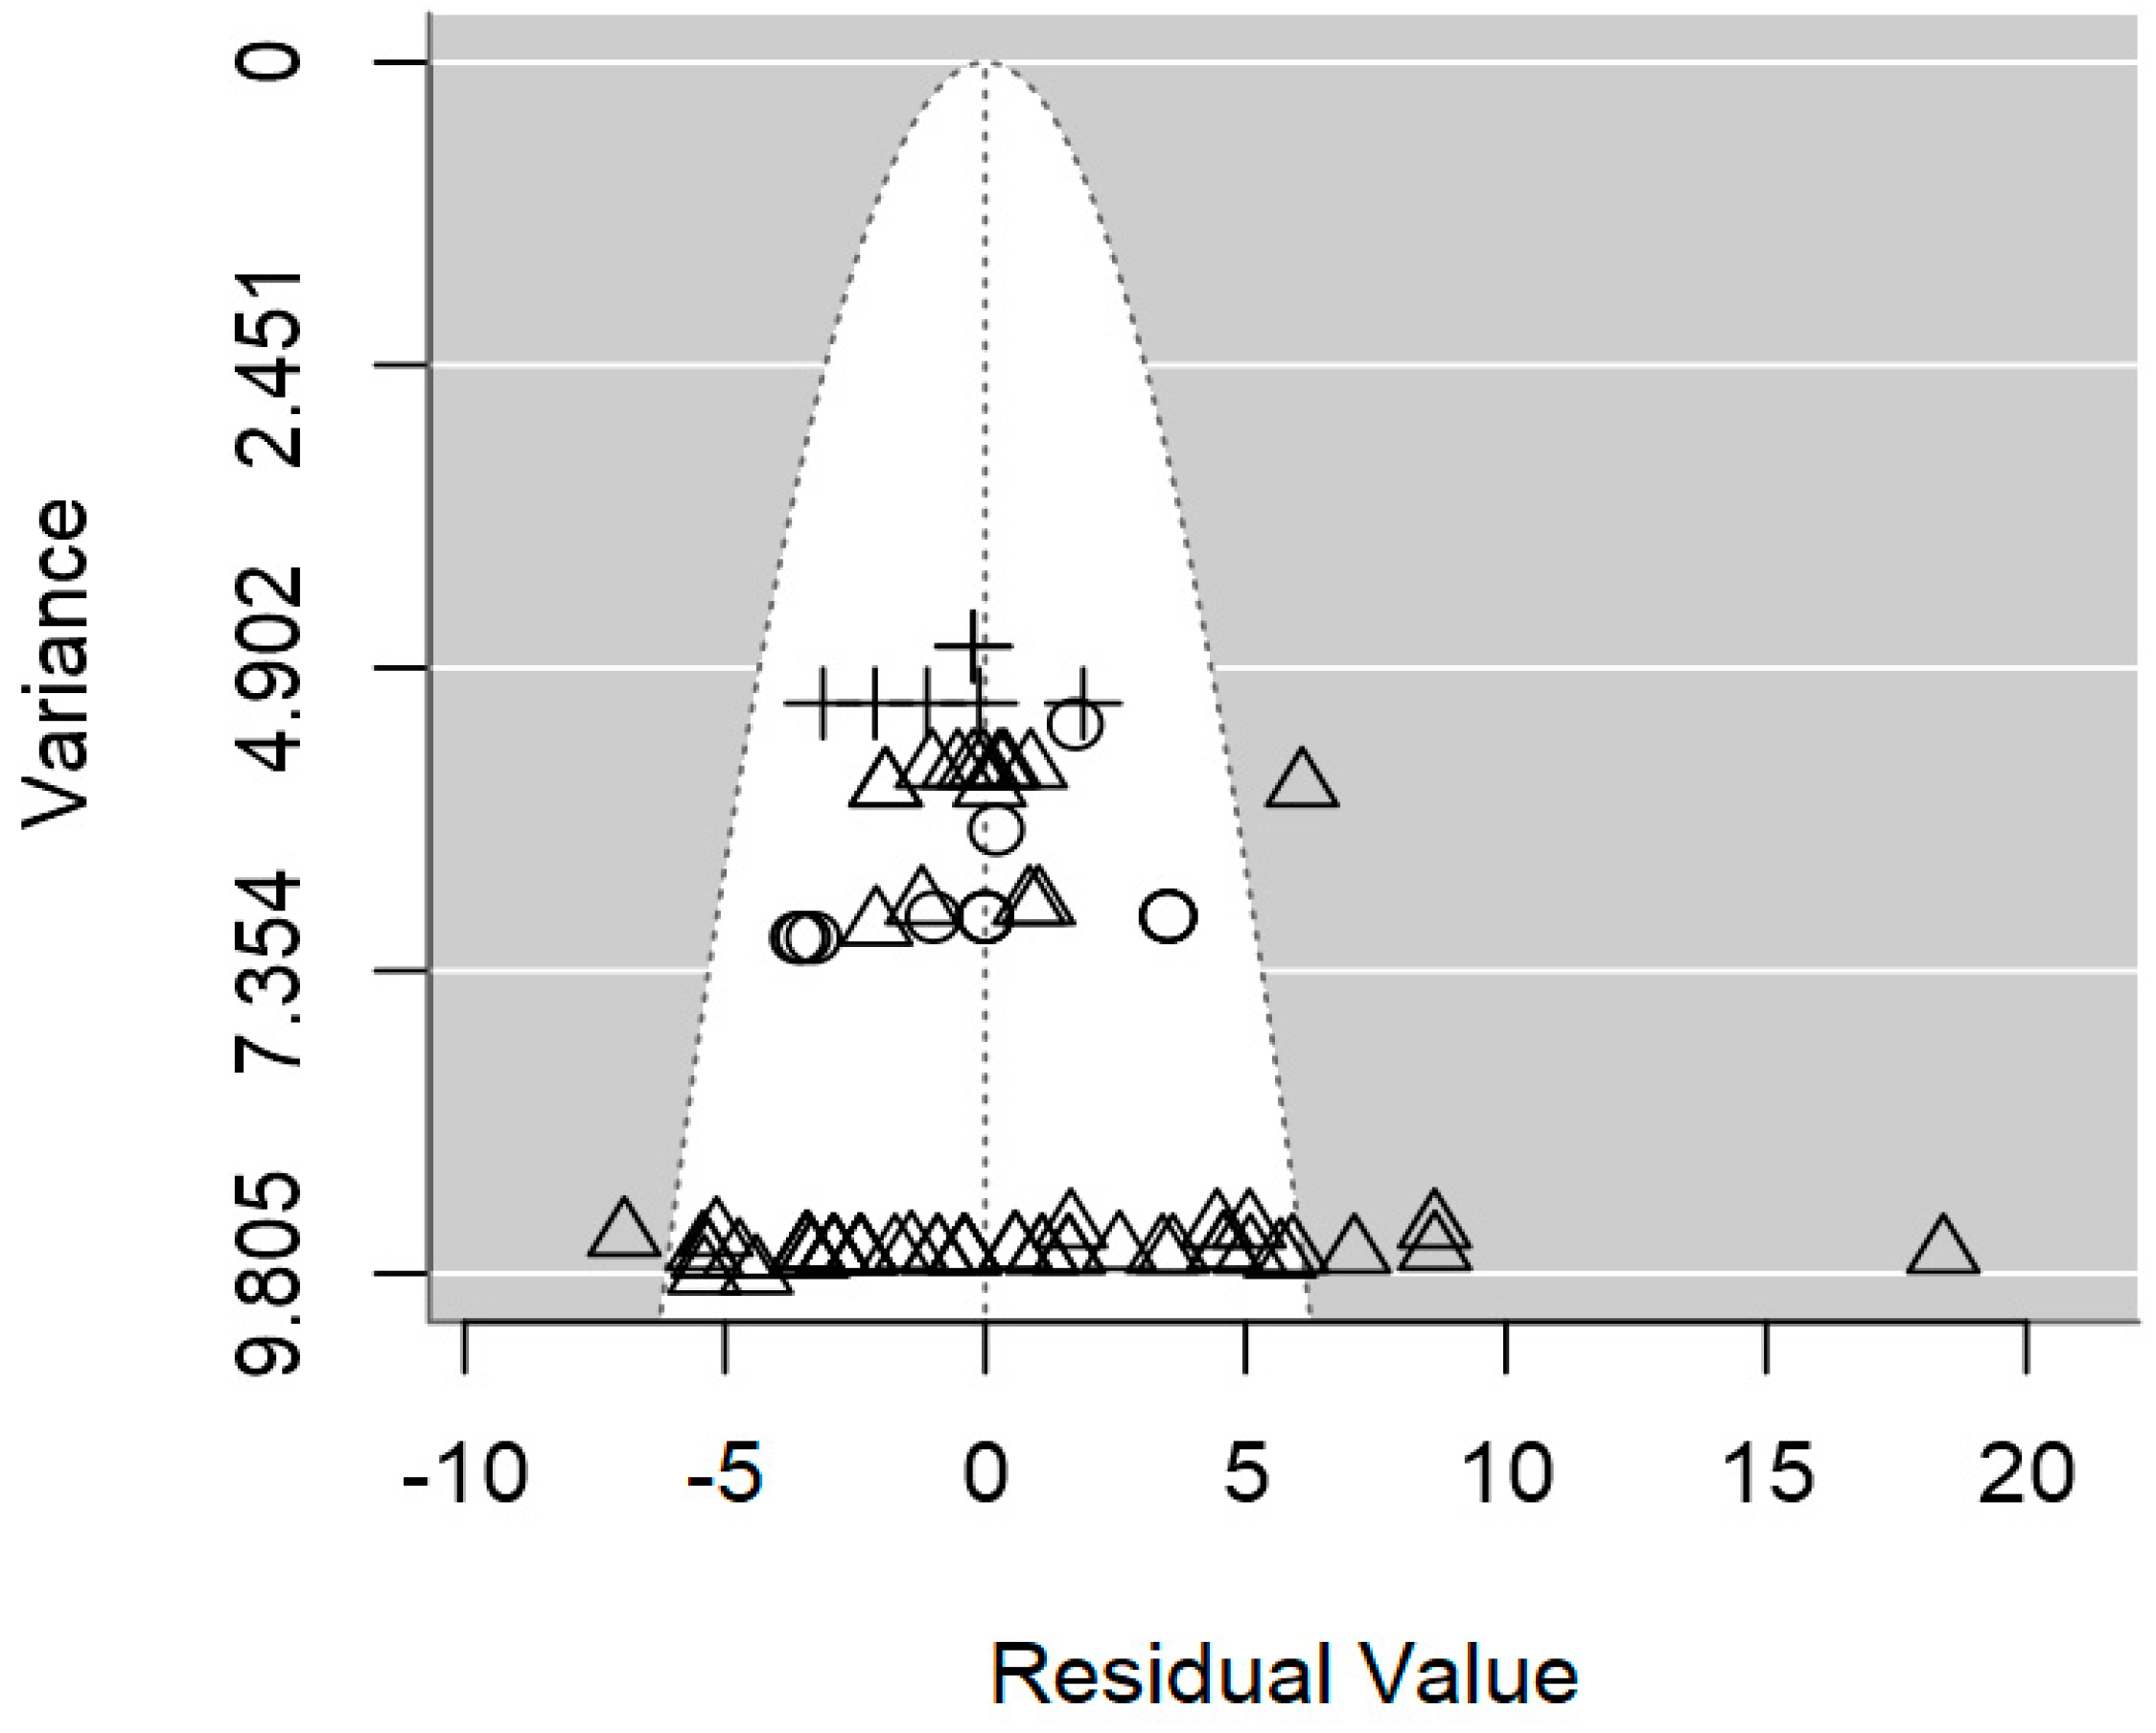
2.4. Assessment of Heterogeneity and Publication Bias

Assessment of heterogeneity and publication bias were undertaken for each of the three pathogen-specific meta-regressions. First, from the null model (intercept only), within-study variability (s2) and between-study variability (τ2) were obtained. The intra-class correlation (I2) of the null model was then calculated as,
I 2 = τ 2 τ 2 + s 2 × 100 %
The I2 statistic measures the percentage of variation due to between-study heterogeneity, with values below 25% indicating low heterogeneity, between 25 and 50% moderate, and above 50% high heterogeneity. As a rule of thumb, if I2 > 25%, an attempt should be made to explain the variability between studies by incorporating significant moderators (also known as study characteristics). After fitting the full (final) model, the residual between-study variability (τ2res) is obtained. Next, the between-study variability explained by significant moderators (R2) can be estimated as,
R 2 = τ 2 τ r e s 2 τ 2
Publication bias was ascertained using two methods: (1) by adding the sample size N as a moderator to each of the pathogen-specific models (Equations (2)–(4)) and applying the decision rule that publication bias is likely if p < 0.05; and (2) by constructing funnel plots to visually identify potential publication bias and further evaluate the heterogeneity within a meta-regression based on the spread of standard errors among individual outcomes [23].

3. Results

3.1. Description of the Meta-Analytical Data

The study selection process is illustrated in the PRISMA flow diagram (Figure 1). A total of 1665 articles were initially retrieved from the databases. Following the removal of duplicates and abstract screening, two hundred and eighty-four articles remained. Subsequently, seventy-seven articles were included after the full-text screening phase. Of these, thirty-five primary studies met the quality inclusion criteria, presenting sufficient data in an extractable form. This resulted in 510 observations to be analyzed. The analysis of the studies identified eight studies conducted prior to 2015 and 27 after 2015. The meta-analyses for each pathogen subset, such as L. monocytogenes, were based on 24 primary studies with 220 observations [24,25,26,27,28,29,30,31,32,33,34,35,36,37,38,39,40,41,42,43,44,45,46,47], Salmonella spp. based on 14 primary studies with 100 observations [26,30,32,33,34,35,37,48,49,50,51,52,53,54], and S. aureus based on 25 studies with 190 observations [24,25,26,28,29,30,32,33,35,37,38,43,46,48,49,50,51,52,55,56,57,58,59,60,61].
Overall, the majority of LAB sources were cheese. For assays of L. monocytogenes, 92.65% of LAB were isolated from cheese, with the remainder sourced from milk (3.6%), mixed dairy products (3.2%), and yogurt (0.55%). The majority of milk species were from cows (52.7%), followed by goats (1.81%), mixed sources (16.36%), sheep (17.32%), buffalo (0.45%), and unspecified sources (11.36%).
Similarly, the LAB tested against Salmonella spp. mainly originated from cheese (91%), milk (3.4%), and mixed dairy products (5.6%), of which 46.06% of milk species were from cow’s milk, with the remainder from goat (8.98%), mixed sources (6.74%), sheep (16.85%), buffalo (3.37%), or unspecified sources (18%).
For S. aureus, 70.32% of tested LAB were from cheese, with the remaining cases originating from milk (15.38%), mixed dairy products (13.18%), and yogurt (1.12%), with the milk sources coming from cow’s milk (35.71%), goat (2.75%), mixed (21.98%), sheep (23.63%), buffalo (1.65%), or unspecified sources (14.28%).
In this study, the main genera of LAB obtained were Lactobacillus (n = 310), Pediococcus (n = 30), Enterococcus (n = 104), Lactococcus (n = 34), Lacticaseibacillus (n = 19) and Leuconostoc (n = 13). In terms of the types of data analyzed, there were no significant differences in the observed ID between the supernatant (n = 476) and bacteriocin (n = 37), leading to the decision to combine the data for analysis.

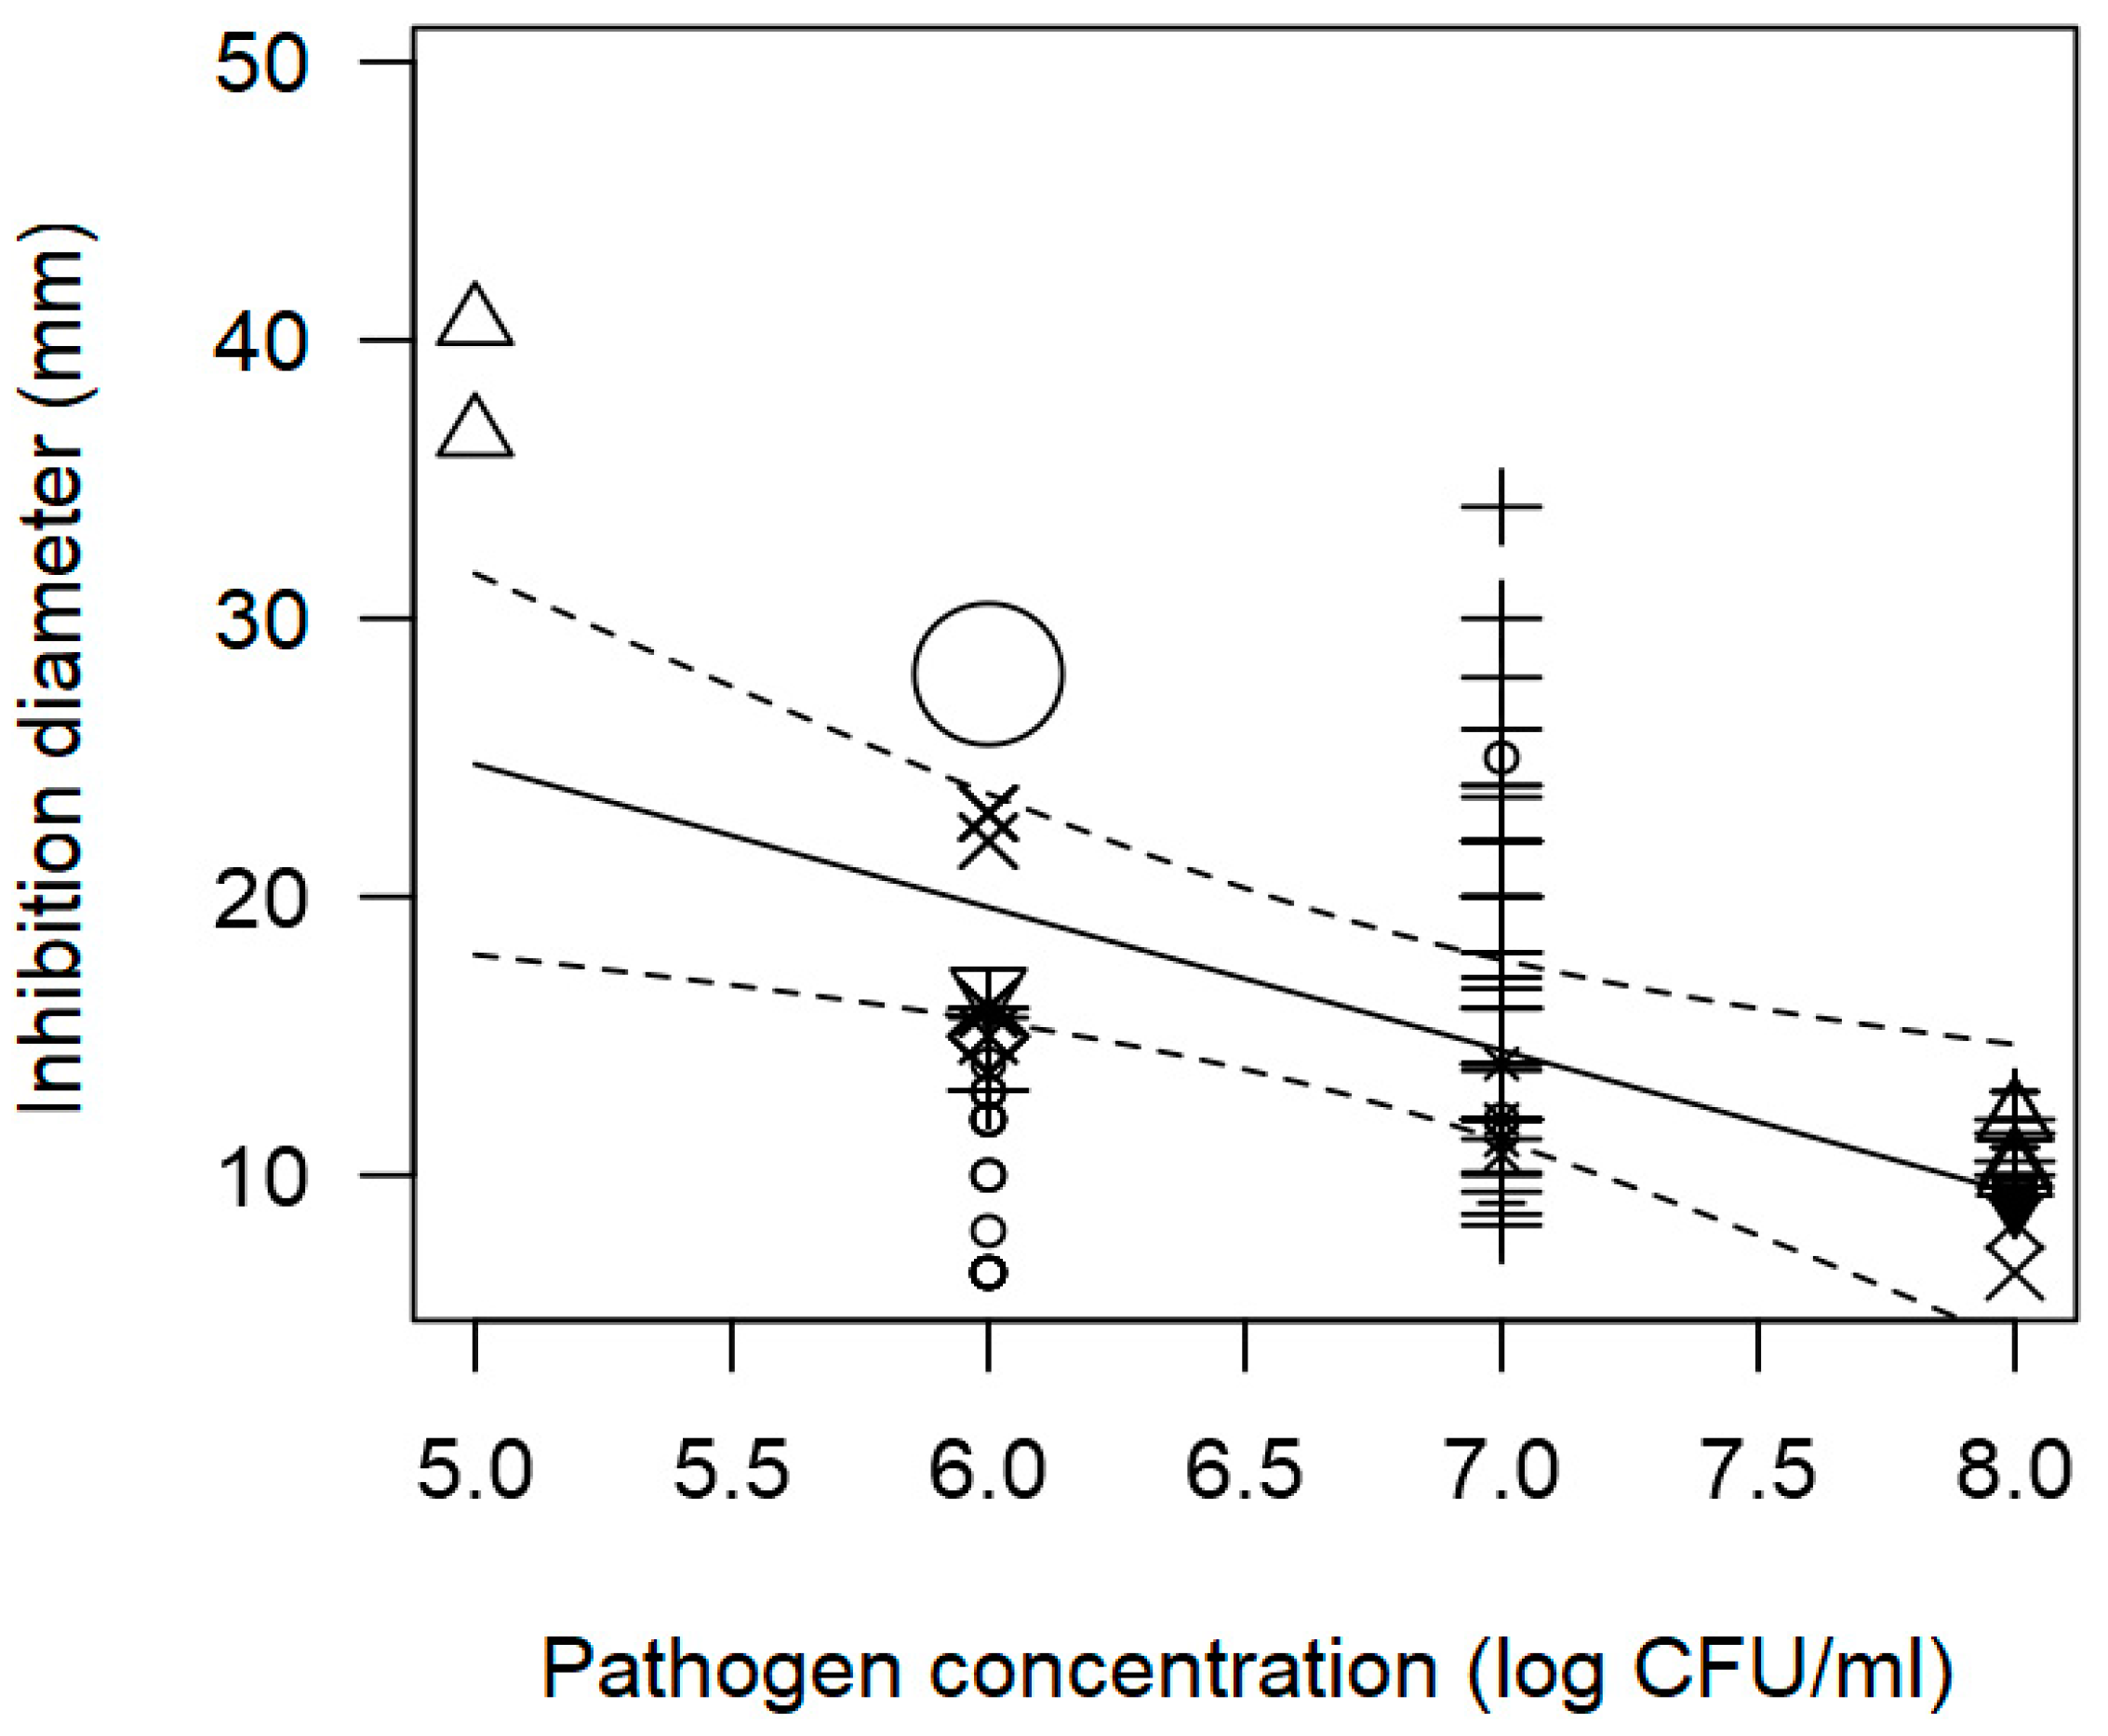
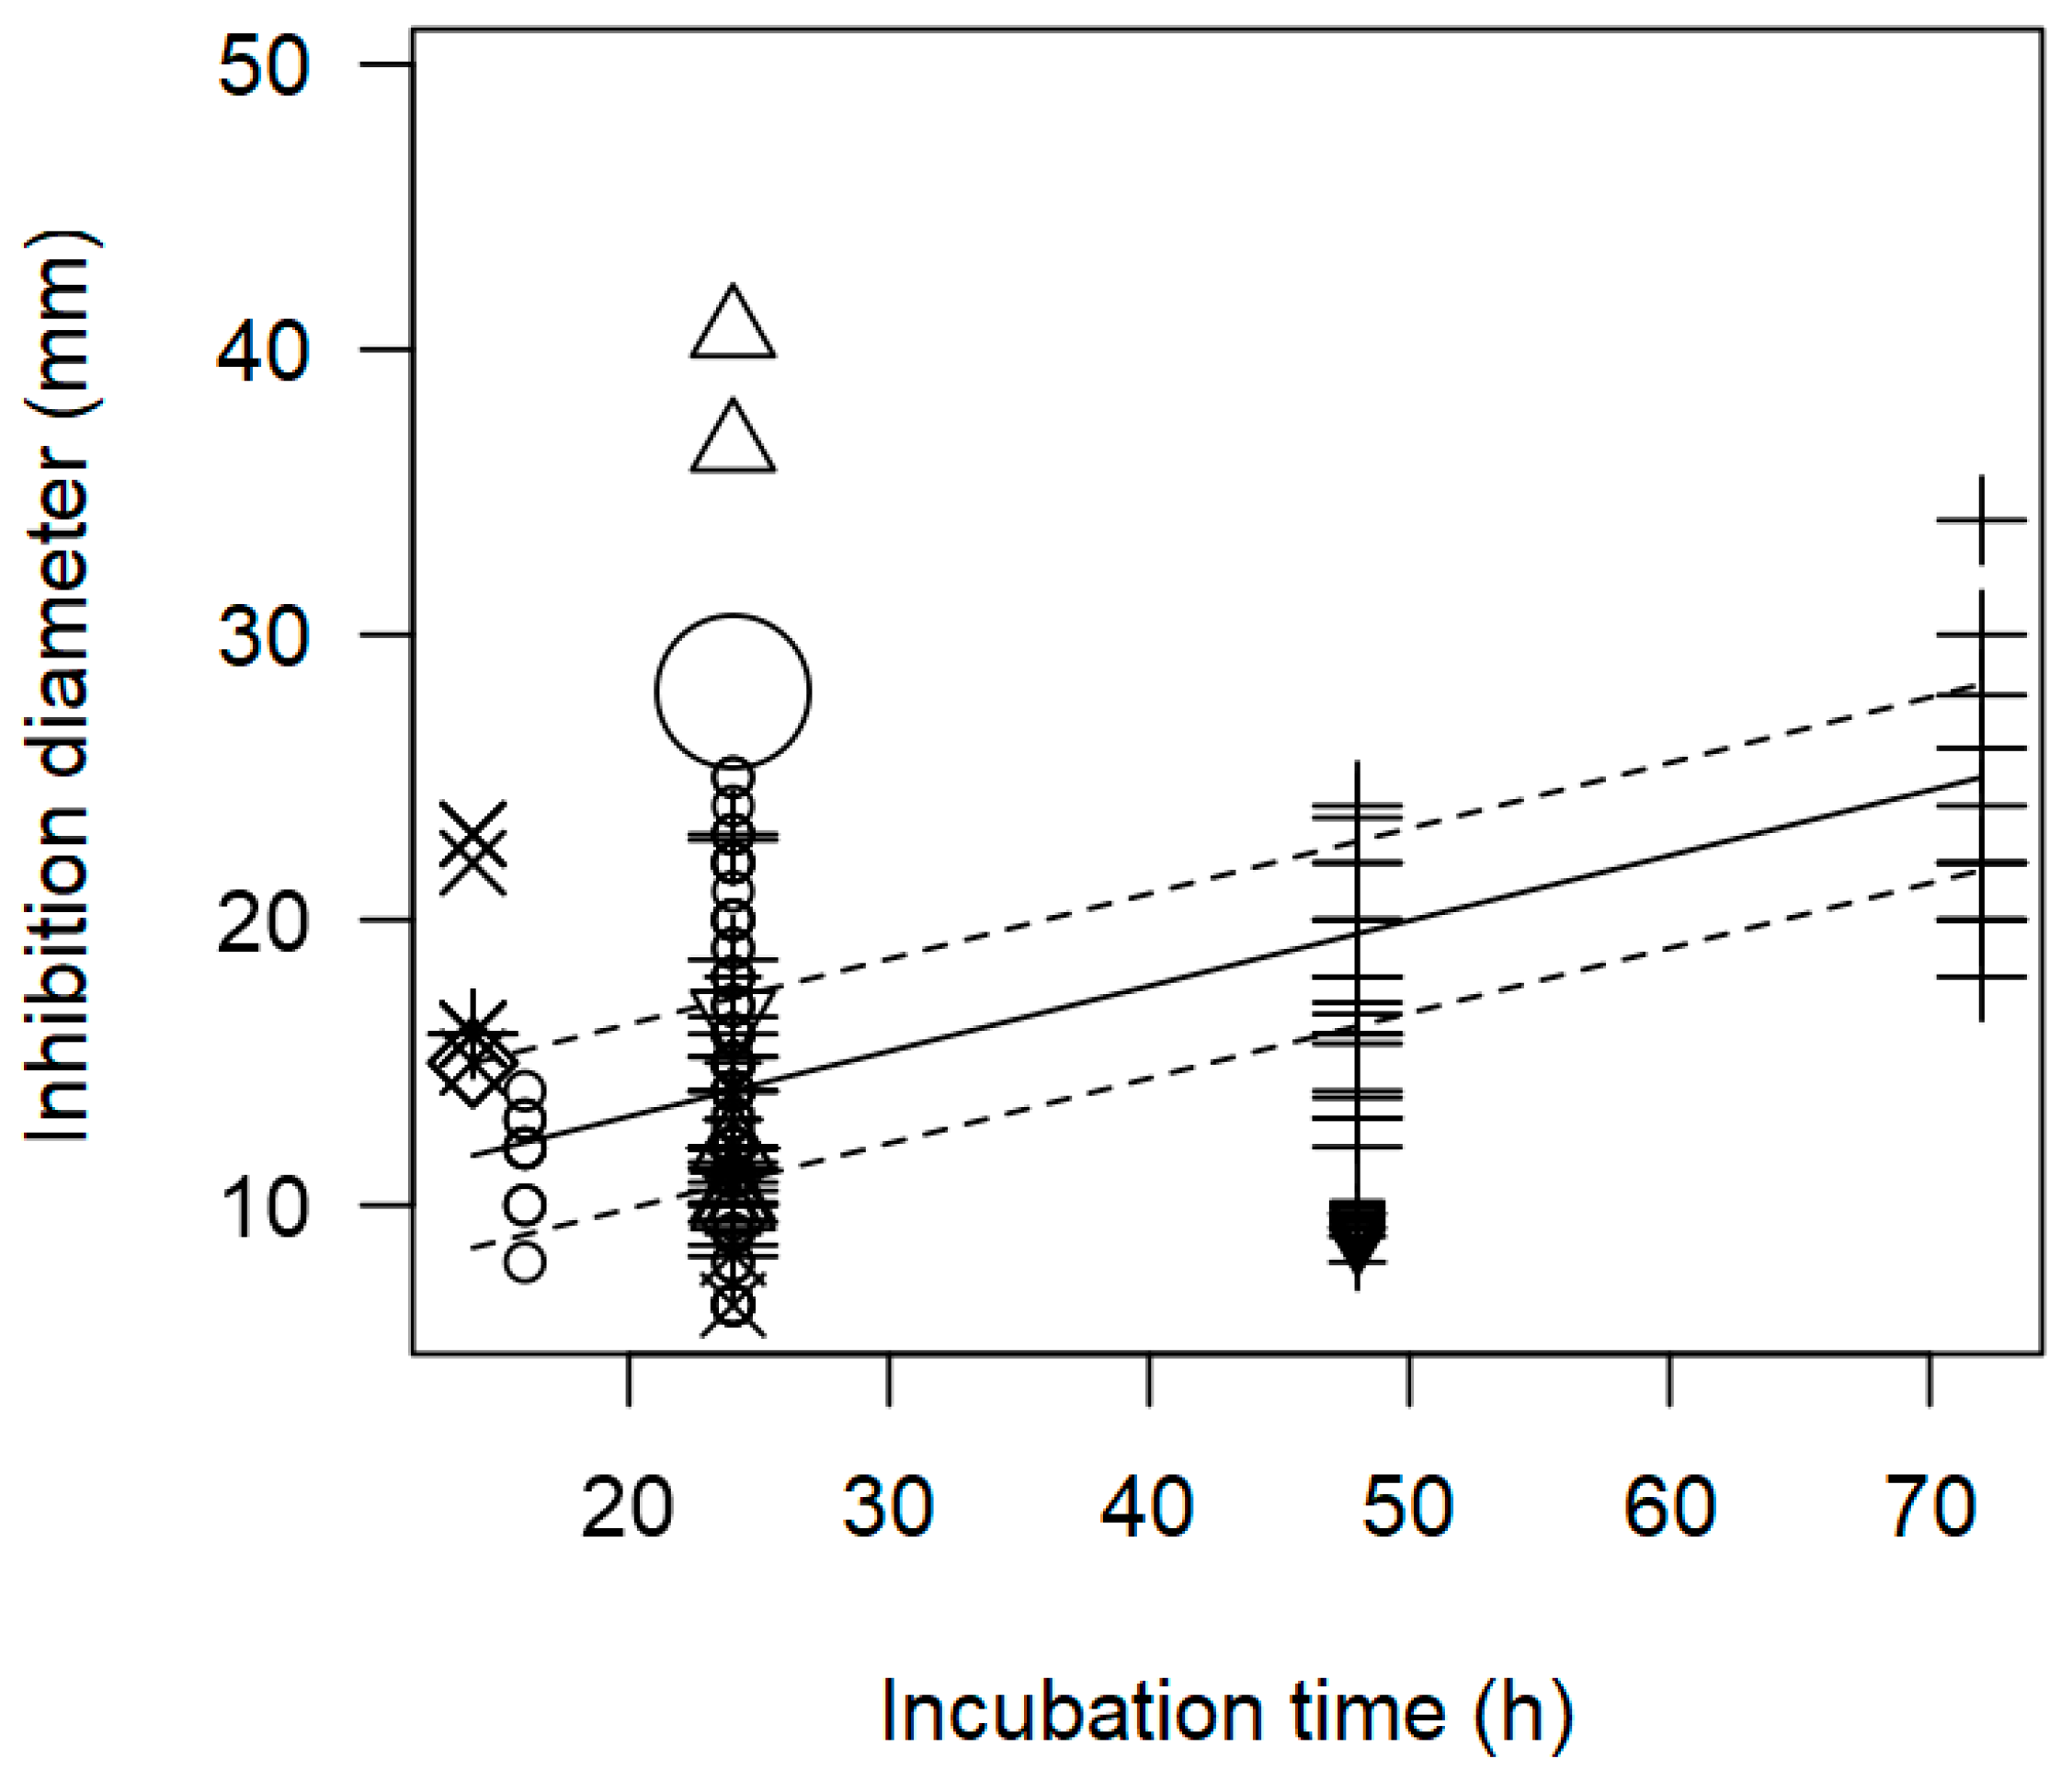
3.2. Overarching Meta-Regression Models

The outcomes of the overarching meta-regression models are shown in Table 1. First of all, these results demonstrate that, overall, L. monocytogenes presented greater susceptibility to the LAB supernatant (i.e., higher inhibition values) compared to Salmonella spp., and S. aureus, although there were no differences between the latter two. Table 1 shows the pooled outcome of the LAB genera separated by type of pathogen. There, it can be observed that Enterococcus strains (15.90 ± 2.138 mm) were in general linked to higher inhibition values against L. monocytogenes, followed by Lacticaseibacillus (13.95 ± 2.313 mm), Lactococcus (13.12 ± 2.129 mm), Lactobacillus (11.96 ± 1.886 mm), Leuconostoc (10.25 ± 2.712 mm) and Pediococcus (8.735 ± 4.663 mm).
Regarding Salmonella spp., Enterococcus (12.00 ± 1.195), Lactobacillus (12.36 ± 1.148), and Lactococcus (12.76 ± 1.194) had no significant differences (p > 0.05) between their inhibition values, although Lactococcus had numerically higher inhibition diameters than the other two.
With regards to S. aureus, the LAB genus which displayed higher inhibition were Enterococcus (11.01 ± 2.105), Lacticaseibacillus (11.89 ± 0.573), Lactobacillus (11.35 ± 1.096), and Lactococcus (11.33 ± 9.578), followed by Leuconostoc (7.173 ± 0.287) and Pediococcus (7.173 ± 0.225). An overall higher inhibition diameter against this pathogen was obtained by Lacticaseibacillus.
The pooled IDs were also estimated using the susceptibility test method from the overarching model, and it was found that, as a whole, the well diffusion test method produced higher inhibition halos than those produced by the spot and disk diffusion tests (Table 1). There were a few exceptions, specifically, in the cases of Lactobacillus against L. monocytogenes, and Lactobacillus against S. aureus., for which spot and disk tests were found to be more closely associated with higher inhibition levels.

3.3. Pathogen-Specific Meta-Regression Models

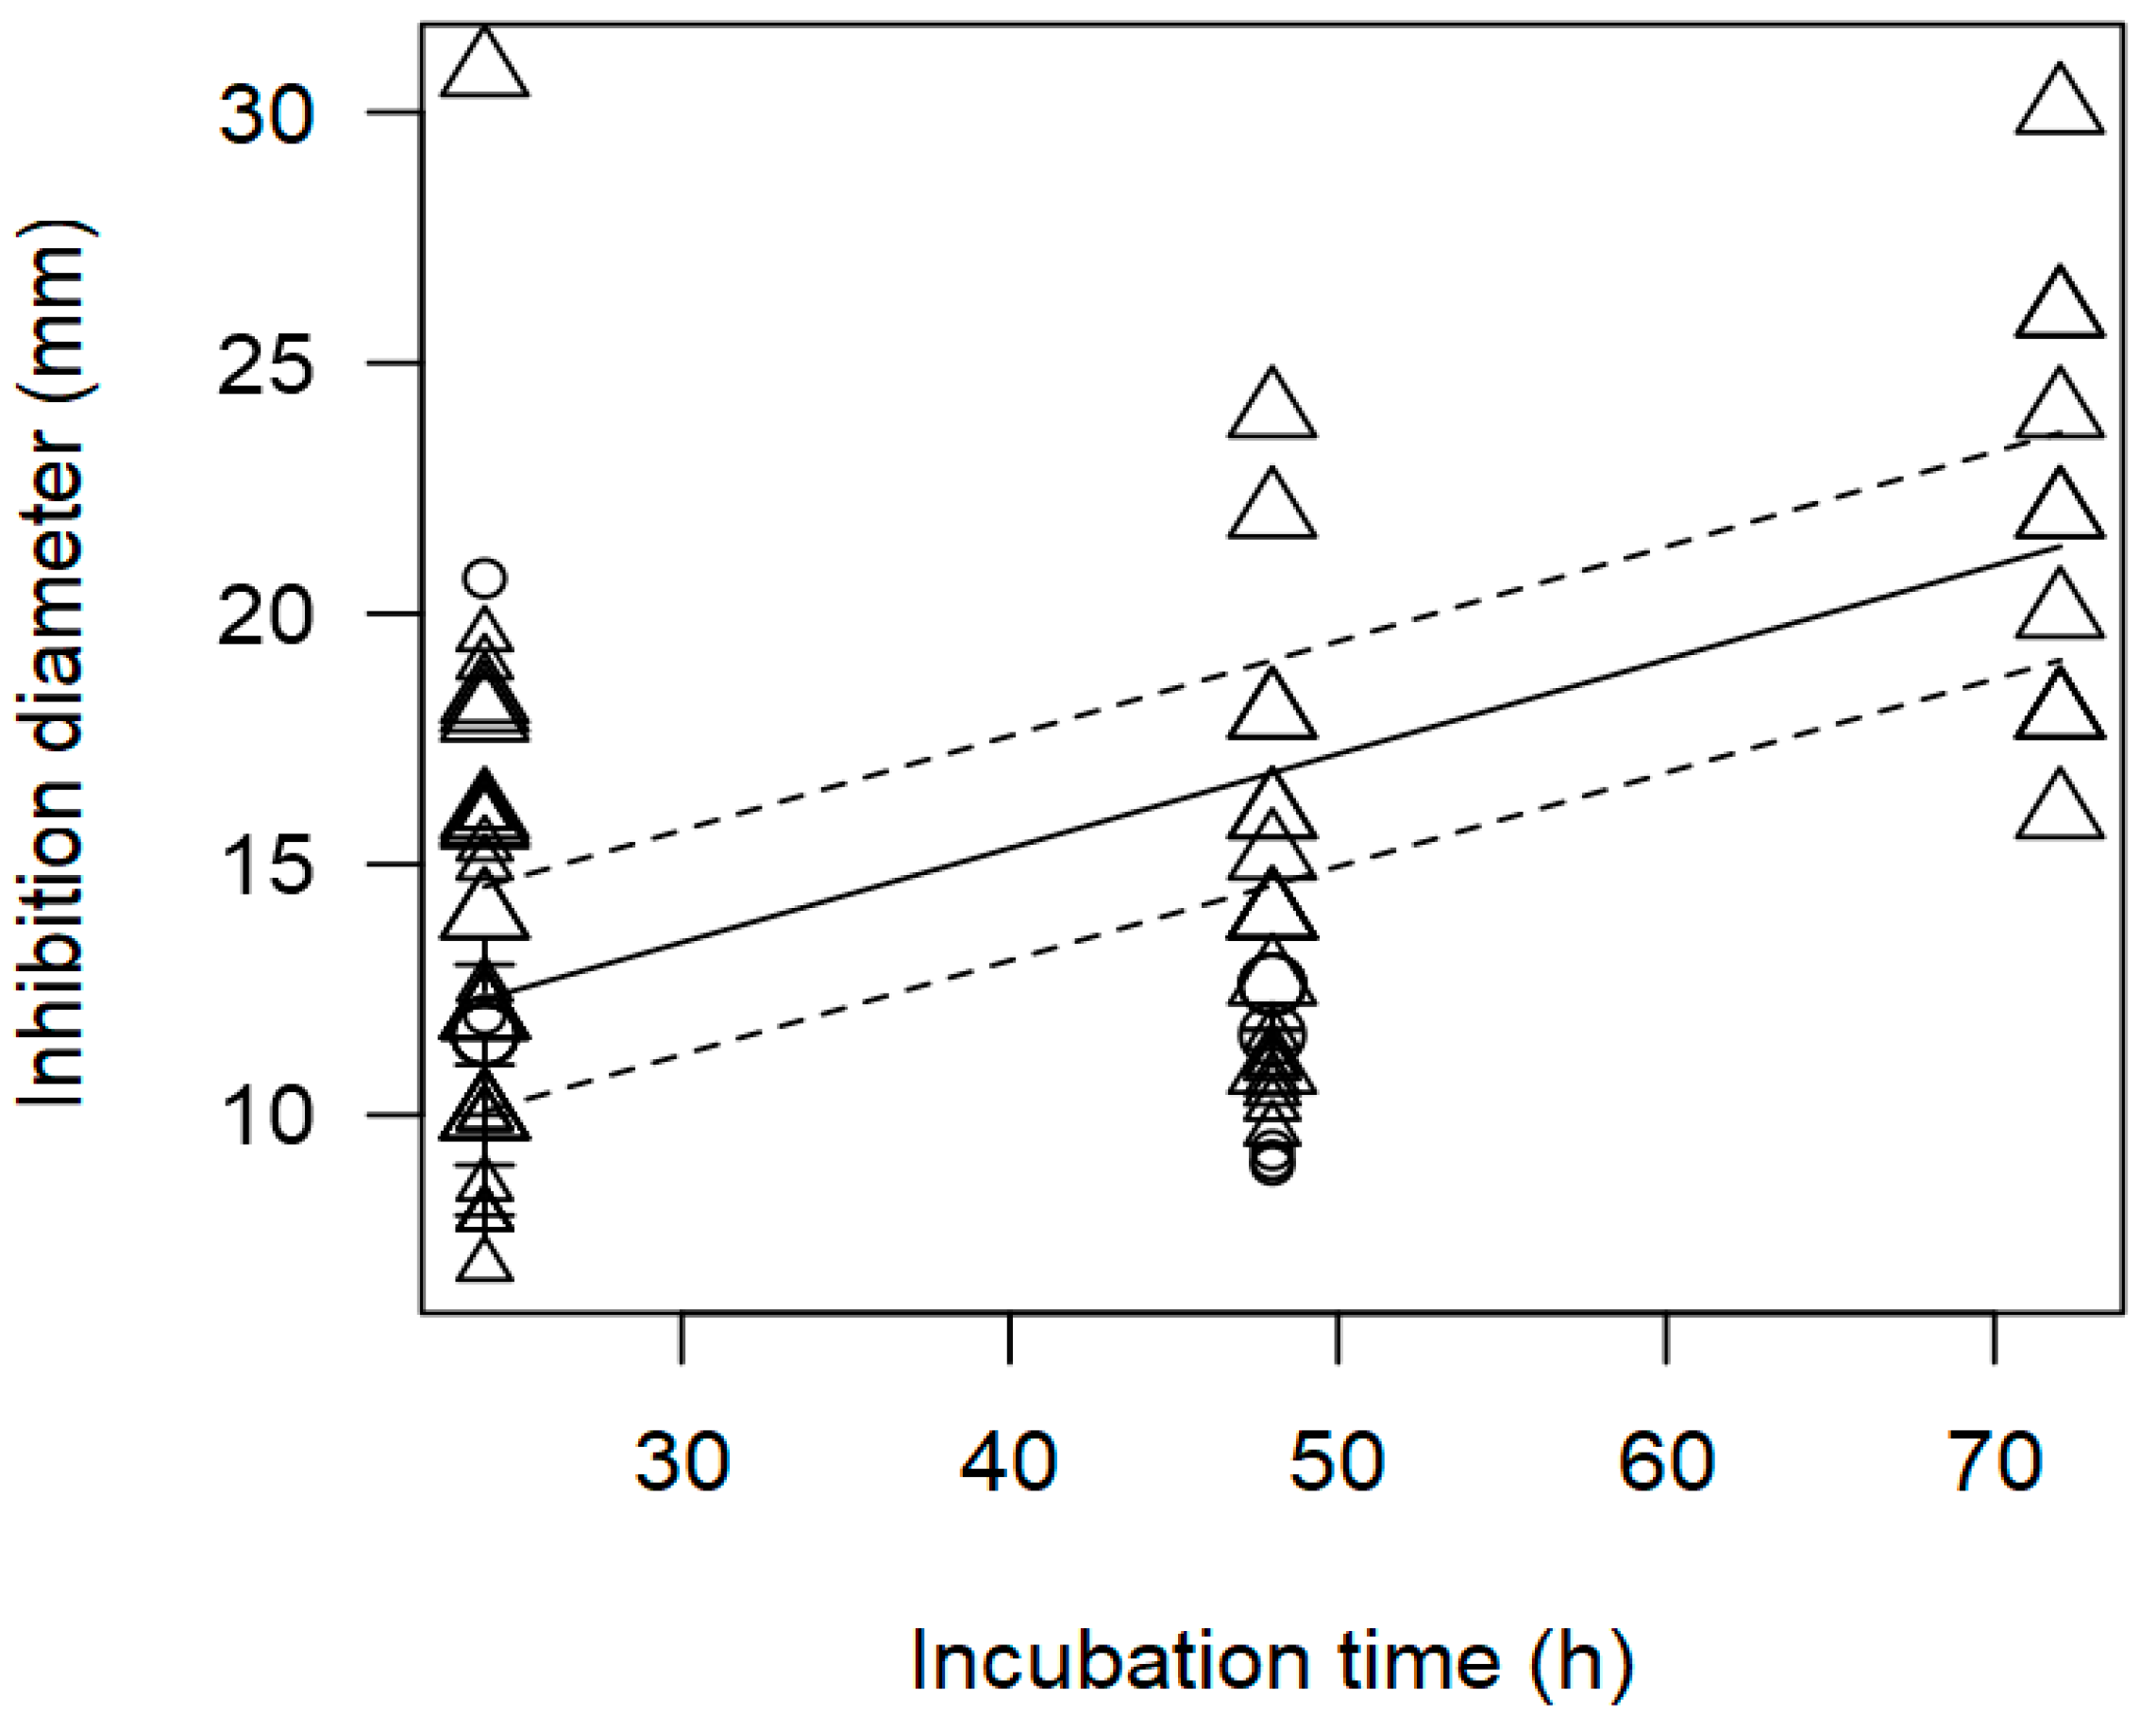
3.3.1. Listeria Monocytogenes

The best-fit regression model for L. monocytogenes (Table 2) included the LAB genus, pathogen concentration, and incubation time. The Enterococcus supernatant provided overall higher inhibition of the pathogen; meanwhile, Leuconostoc and Lactobacillus supernatants were found to provide significantly lower inhibition, which can be deduced from the higher intercept for ID.
The meta-regression model (Figure 2 and Figure 3) also demonstrated a significant inverse association between the concentration of pathogen inoculated in the agar and the measured ID, for instance, at a pathogen concentration of 8 log CFU/mL, an ID value of ~12 mm was measured. A direct association between incubation time and observed ID was also found(Table 2); at longer incubation times, for instance, 72 h, the inhibition values measured tended to be higher than 20 mm.
In terms of publication bias, a symmetrical distribution of data points could be observed within the funnel (Figure 4), which provides no discernible evidence of publication bias. Likewise, the p-value for the presence of publication bias was not significant (p = 0.977). Heterogeneity analysis pointed out a moderate intra-class correlation (I2 = 55.1%), from which 33.8% could be explained jointly by the three significant moderators. It is likely that the highly unbalanced nature of the data, which hindered the inclusion of other moderators was the cause of the relatively low R2.

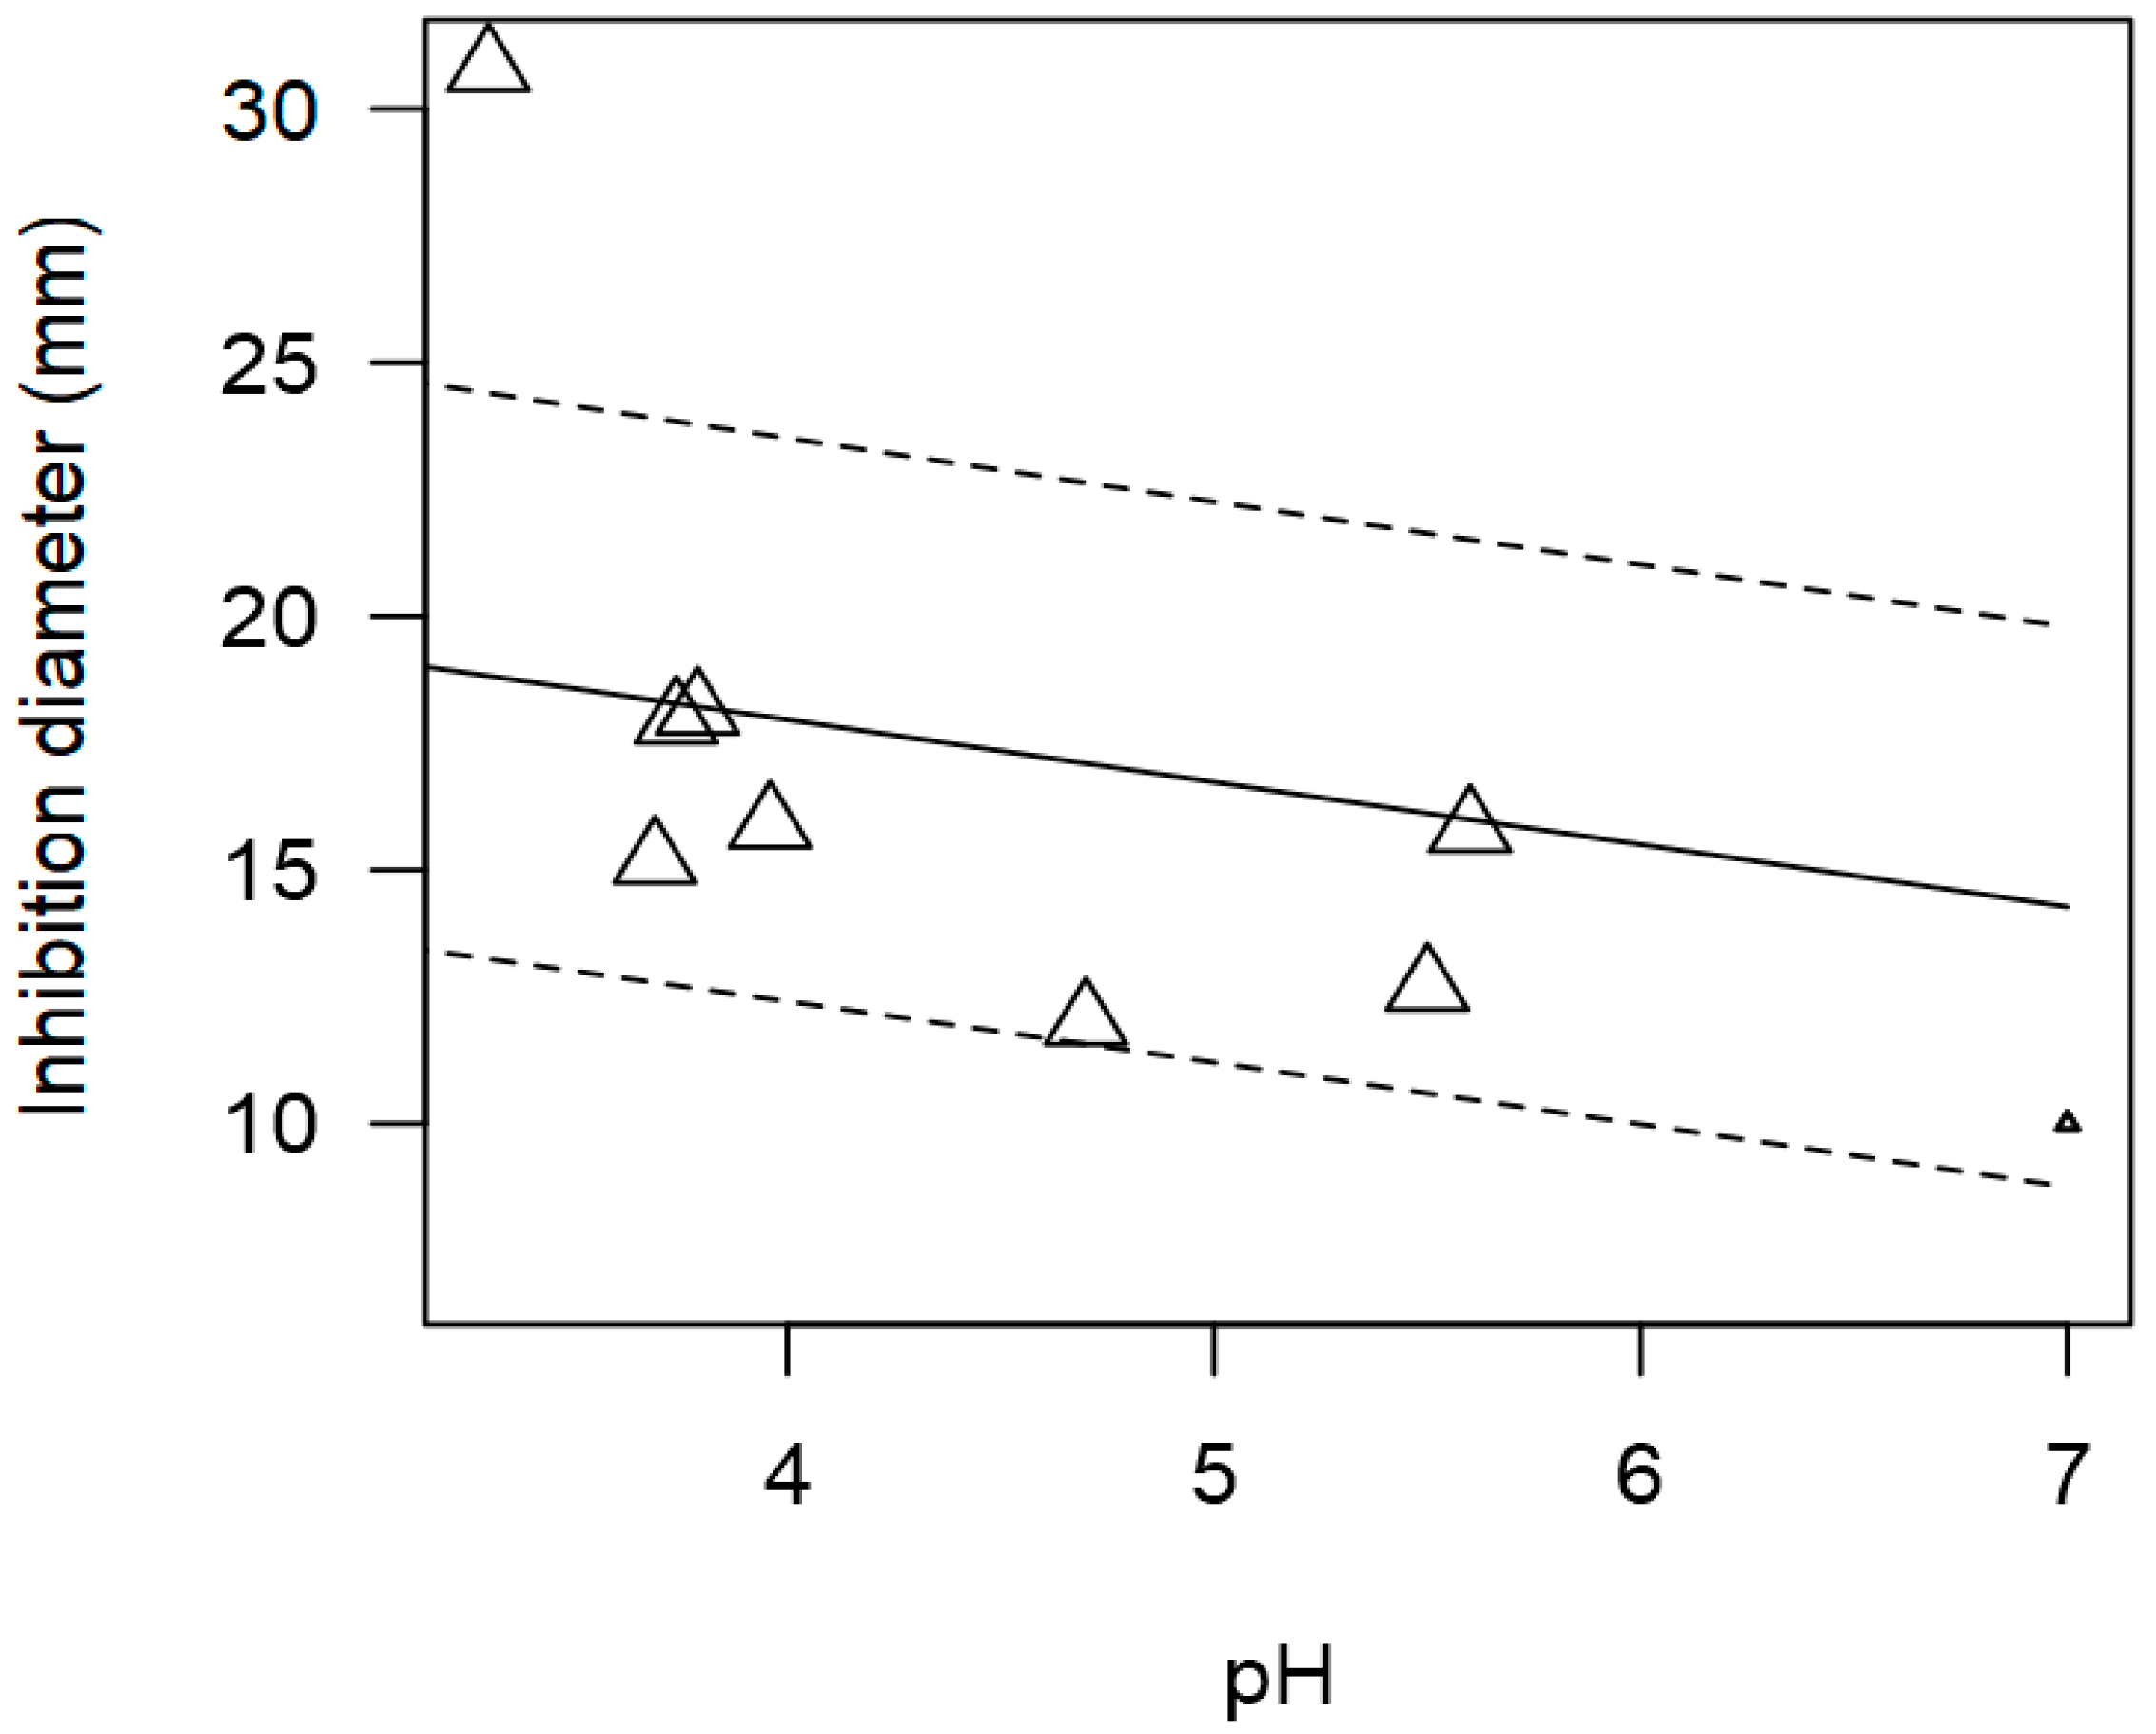
3.3.2. Salmonella spp.

The meta-regression model fitted to the ID outcomes for Salmonella spp. allowed the assessment of the effects of the susceptibility method, type of agar, and incubation time. Results (Table 3) showed that the well diffusion method and the Brain Heart Infusion (BHI) agar resulted in the highest inhibition diameters measured. Conversely, the disk diffusion method and de Man Rogosa and Sharpe (MRS) agar were significantly correlated with lower values of inhibition diameter (mm).
As found with the meta-regression for L. monocytogenes, the model of inhibition against Salmonella spp. showed a positive relationship between incubation time and measured ID values (p < 0.001). Figure 5 shows the data scattered at three incubation times, 24, 48, and 72 h, and it is mainly Lactobacillus strains that were associated with higher inhibition diameters at longer incubation times.
Although pH could not be included as a moderator in the meta-regression model due to its very low incidence, the relationship between pH and ID values was still explored. The tendency of pH of the supernatant from LAB and inhibition diameter values were significantly correlated (p < 0.001). Figure 6 shows that Lactobacillus displayed higher inhibitory activity at a more acidic pH compared to a neutral pH.
The publication bias p-value of the meta-regression on ID values for Salmonella spp. was not significant (p = 0.217; Table 3), which was also supported by the symmetrical dispersion of the data points of the funnel plot shown in Figure 7. The intra-class correlation of this meta-regression was fairly low (I2 = 33.6%), and the three moderators were able to explain 52.3% of the between-study variability (Table 3).

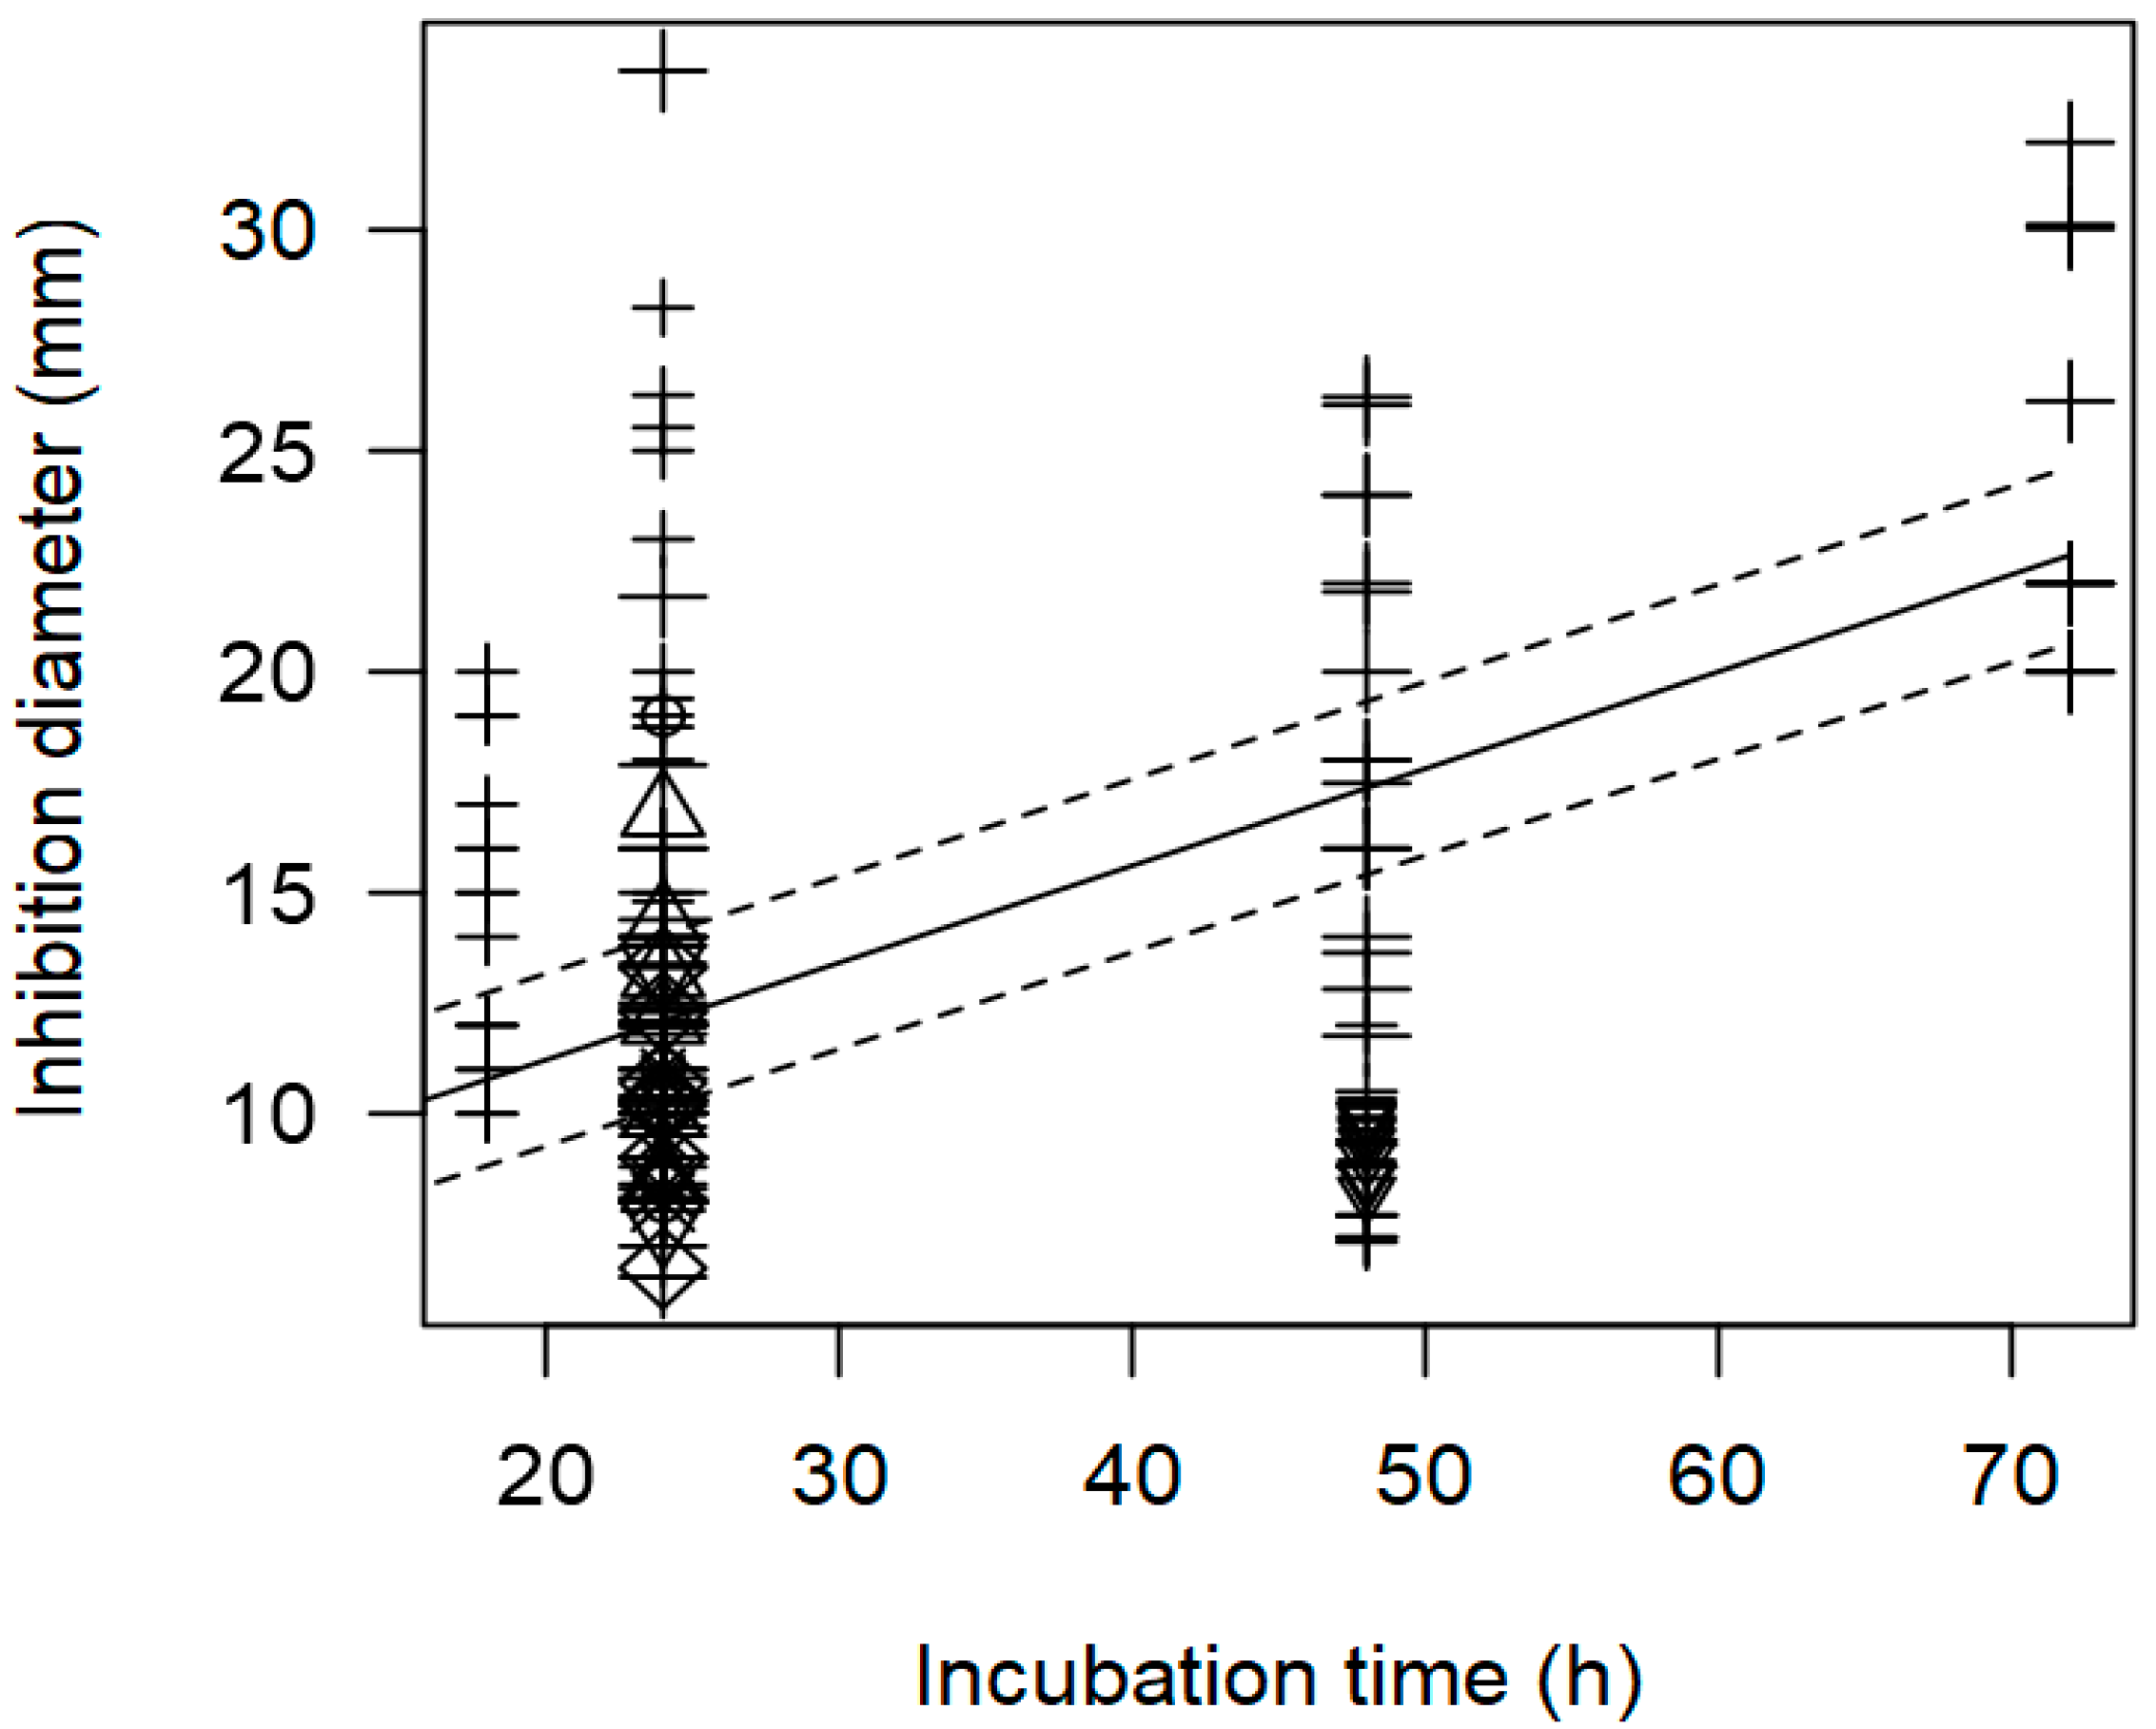
3.3.3. Staphylococcus aureus

The data-driven model fitted for the pathogen S. aureus, included LAB genus, pathogen concentration, incubation time, and assay method as significant moderators. The results compiled in Table 4 show that higher measurements of inhibition diameter were associated with the well diffusion method, and mainly by Enterococcus strains. In contrast, the disk diffusion method led to significantly lower inhibition values, as did LAB strains belonging to the genera Leuconostoc and Pediococcus.
In this model, the intra-class correlation was relatively low (I2 = 38.8%), and the four moderators could explain only 19.8% of the total between-study variability (Table 4). Since the variance associated with the different studies is not high, the unexplained part of the variance could be attributed to, more likely, “false” non-significant moderators arising from the data’s lack of balance or, less likely, to traits not measured in this study.
In addition, the meta-regression model showed a significant effect of the incubation time (h) on the inhibition diameter of the indicator strains. The longer the incubation period of the indicator strain with the tested supernatant, the greater the inhibition diameter. In Figure 8, a significant effect of incubation time (p < 0.001) on the inhibition of S. aureus is clearly shown. In this case, Lactobacilli were associated with higher inhibition diameters (>20 mm) when the plates were incubated for a longer time (72 h).
Once again, due to the few outcomes with information on pH, this variable could not be included in the full meta-regression model. Nonetheless, the association between pH and inhibition diameter was assessed to find a significant inverse correlation (p < 0.001). Figure 9 shows that more acidic pH values (3 to 5) would tend to increase the measured inhibition diameters, resulting in higher values (approximately higher than 12 mm). On the other hand, a more neutral pH (6 to 7) results in less inhibition with lower diameter values (≤10 mm).
In Figure 10, the symmetrical distribution of the data in the plots indicates the absence of significant publication bias. Moreover, these plots imply minimal residual heterogeneity among the studies (τ2res), with no discernible evidence of publication bias (p = 0.492).

4. Discussion

Indigenous starter cultures have become a trend in the dairy food industry due to their fast adaptation to the cheese microenvironment and their ability to provide traditional cheese with its characteristic organoleptic features [4]. Starter LAB inhibit pathogenic or spoilage microorganisms by competition or ecosystem conditioning, such as lowering the pH and reducing water activity [62]. LAB produce several important enzymes, including proteases, lipases, bacteriocins, glucoamylases, peptidoglycan hydrolases, ureases, and phenol oxidases, which can also be found in supernatants [63].
In this meta-analysis, we found that most studies assessing the antimicrobial activity of LAB originated from cheese, especially from cow milk sources. A notable limitation found in this study was the lack of species-level insights due to insufficient statistical power, which restricted findings at the genus level. Additionally, the composition of the supernatant used in the experiments was not described in detail by the original authors, which hampers an in-depth analysis as to the source of inhibition. However, a significant advantage was identifying the most common LAB naturally occurring in dairy matrices, which are likely to be more effective against pathogens in food environments.
The most common LAB were Lactobacillus, Enterococcus, and Lactococcus, in accordance with previous research [4,63]. In a meta-analysis of traditional artisanal Irish cheese microbiomes, LAB were found to have a prevalence of 91.3%, with Lactococcus lactis, Streptococcus thermophilus, and Lactobacillus helveticus being the most prevalent species. These LAB harbored genes encoding for class II/III bacteriocins and metalloproteases [64].
Bacteriocins are small peptides synthesized in the ribosome and are generally considered safe for consumption as they are degraded by gastric and pancreatic enzymes during digestion due to their chemical nature, although some may present toxicity at high concentrations [63]. Currently, the use of bacteriocins as food additives for dairy production is limited. In Europe, nisin (E 234), synthesized by Lactococcus lactis, is approved by the European Food Safety Authority (EFSA) [2]. Nisin was found to be effective against L. monocytogenes in dairy products, reducing its presence by up to 1 log cycle in cottage cheese stored at 20 °C for 7 days at a pH of 4.6–4.7 and exhibits antimicrobial activity against numerous other Gram-positive bacteria, including Staphylococcus, Bacillus, and Clostridium [65,66,67].
Table 1 shows the conditions normalized to 24 h of incubation with a pathogen at 7 log CFU/mL. Contrasting the effects of LAB supernatant on different pathogens, L. monocytogenes showed greater susceptibility compared to Salmonella spp. and S. aureus, especially when tested against Enterococcus. Enterococci LAB, commonly found in the gastrointestinal tracts of humans and dairy animals, can play both beneficial and harmful roles in milk and dairy products [68].
The best-fit regression model for L. monocytogenes explained 33.8% of the total variation and showed a significant inverse association between pathogen concentration and inhibition diameter (ID). A meta-analysis of in situ pathogen inhibition in cheese found a similar negative association between inoculum and log reduction (p = 0.025), indicating lower inhibitory effects with higher pathogen populations [68].
Within Salmonella spp., Lactococcus showed the highest inhibition values. Contaminated raw milk or curd can lead to Salmonella surviving the fermentation and ripening processes, resulting in contaminated final products [69]. The meta-regression model for Salmonella spp. ID outcomes accounted for 52.3% of the variability, showing a positive relationship between the incubation time and ID values (p < 0.001). This is in accordance with previous studies showing that while LAB inoculum exerts immediate antimicrobial effects on the indicator strain, the supernatant shows a greater effect with longer incubation [68].
Additionally, a significant correlation was found between the pH of LAB supernatants and ID values, with higher IDs associated with acidic pH. Different composition of organic acids in supernatants result in varying pH levels. Neutralizing the pH standardizes the testing conditions, ensuring that the observed effects are due to antimicrobial properties rather than pH changes, allowing for consistent comparisons [63].
S. aureus in contaminated milk and dairy products is a significant food safety concern, this pathogen is often introduced during milking due to poor hygiene or contaminated equipment [70]. S. aureus was highly inhibited by Lacticaseibacillus and the significant moderators for the final inhibition included the LAB genus, pathogen concentration, incubation time, and assay method, accounting for 19.8% of the variation. As with L. monocytogenes, longer incubation resulted in higher IDs, with acidic pH values increasing IDs. Furthermore, S. aureus is more susceptible to the effect of organic acids [66,67,68,69,71].
The pooled IDs showed that the well diffusion test method produced higher inhibition halos than the disk tests, likely due to superior diffusion in wells versus disks. Susceptibility methods vary in antimicrobial applications: directly (agar spot), via a disk (disk diffusion), or through a well (well diffusion) [66].

5. Conclusions

In conclusion, this meta-analysis has revealed that pathogen concentration negatively influences the effect of the supernatant; the longer the incubation time, the better the results of inhibition, and the more acidic the supernatant pH, the higher the inhibition; however, there is an issue regarding the reporting of pH measurements for supernatant screening assays. The more adequate LAB to be used as biological control agent changes according to the specific pathogen.
Future research should detail the components of the LAB supernatant, investigate the impact of uncultured organisms on LAB antimicrobial activity, and explore the specific supernatant composition. Increasing the statistical power of species-level analysis could provide more detailed insights into LAB effectiveness. By understanding the dynamics of autochthonous LAB species and their antimicrobial activity against foodborne pathogens, stakeholders can implement targeted interventions to improve the safety and quality of dairy products and ultimately safeguard public health. Continued research on the microbiological quality of cheeses, including the exploration of bacteriocins produced by dairy strains, is essential for enhancing food safety and expanding the range of functional dairy products.

Author Contributions

Conceptualization, V.C. and U.G.-B.; methodology, N.F., Y.L., V.C. and U.G.-B.; software, N.F. and U.G.-B.; validation, V.C. and U.G.-B.; formal analysis, N.F. and U.G.-B.; investigation, N.F., Y.L., V.C. and U.G.-B.; resources, V.C. and U.G.-B.; data curation, N.F. and Y.L.; writing—original draft preparation, N.F. and U.G.-B.; writing—review and editing, N.F., V.C. and U.G.-B.; visualization, N.F., Y.L., V.C., and U.G.-B.; supervision, V.C. and U.G.-B.; project administration, V.C. and U.G.-B.; funding acquisition, V.C. and U.G.-B. All authors have read and agreed to the published version of the manuscript.

Funding

This research was funded by the Foundation for Science and Technology (FCT, Portugal) through national funds FCT/MCTES (PIDDAC) to CIMO (UIDB/00690/2020 and UIDP/00690/2020) and SusTEC (LA/P/0007/2021) and through funding of the PAS-AGRO-PAS (PRIMA/0014/2022).

Institutional Review Board Statement

Not applicable.

Informed Consent Statement

Not applicable.

Data Availability Statement

The original contributions presented in the study are included in the article, further inquiries can be directed to the corresponding author.

Conflicts of Interest

The authors declare no conflicts of interest.

References

  1. EUROSTAT. Milk and Milk Product Statistics, Eurostat Statistics Explained; EUROSTAT: Luxembourg, 2022; Available online: https://ec.europa.eu/eurostat/statistics-explained/index.php?title=Milk_and_milk_product_statistics (accessed on 25 March 2024).
  2. Cardinali, F.; Osimani, A.; Taccari, M.; Milanović, V.; Garofalo, C.; Clementi, F.; Polverigiani, S.; Zitti, S.; Raffaelli, N.; Mozzon, M.; et al. Impact of Thistle Rennet from Carlina Acanthifolia All. subsp. Acanthifolia on Bacterial Diversity and Dynamics of a Specialty Italian Raw Ewes’ Milk Cheese. Int. J. Food Microbiol. 2017, 255, 7–16. [Google Scholar] [CrossRef]
  3. Cardinali, F.; Ferrocino, I.; Milanović, V.; Belleggia, L.; Corvaglia, M.R.; Garofalo, C.; Foligni, R.; Mannozzi, C.; Mozzon, M.; Cocolin, L.; et al. Microbial Communities and Volatile Profile of Queijo de Azeitão PDO Cheese, a Traditional Mediterranean Thistle-Curdled Cheese from Portugal. Food Res. Int. 2021, 147, 110537. [Google Scholar] [CrossRef]
  4. Silva, B.N.; Fernandes, N.; Carvalho, L.; Faria, A.S.; Teixeira, J.A.; Rodrigues, C.; Gonzales-Barron, U.; Cadavez, V. Lactic Acid Bacteria from Artisanal Raw Goat Milk Cheeses: Technological Properties and Antimicrobial Potential. Ital. J. Food Saf. 2023, 12, 11559. [Google Scholar] [CrossRef]
  5. Nero, L.A.; Andretta, M.; Almeida, T.T.; Ferreira, L.R.; Camargo, A.C.; Yamatogi, R.S.; Carvalho, A.F.; Call, D.R. Lactic Microbiota of the Minas Artisanal Cheese Produced in the Serro Region, Minas Gerais, Brazil. LWT 2021, 148, 111698. [Google Scholar] [CrossRef]
  6. Alvarez-Sieiro, P.; Montalbán-López, M.; Mu, D.; Kuipers, O.P. Bacteriocins of Lactic Acid Bacteria: Extending the Family. Appl. Microbiol. Biotechnol. 2016, 100, 2939–2951. [Google Scholar] [CrossRef]
  7. Pineda, A.P.A.; Campos, G.Z.; Pimentel-Filho, N.J.; Franco, B.D.G.d.M.; Pinto, U.M. Brazilian Artisanal Cheeses: Diversity, Microbiological Safety, and Challenges for the Sector. Front. Microbiol. 2021, 12, 666922. [Google Scholar] [CrossRef]
  8. Favaro, L.; Basaglia, M.; Casella, S.; Hue, I.; Dousset, X.; Dora Gombossy de Melo Franco, B.; Todorov, S.D. Bacteriocinogenic Potential and Safety Evaluation of Non-Starter Enterococcus Faecium Strains Isolated from Home Made White Brine Cheese. Food Microbiol. 2014, 38, 228–239. [Google Scholar] [CrossRef]
  9. Havelaar, A.H.; Kirk, M.D.; Torgerson, P.R.; Gibb, H.J.; Hald, T.; Lake, R.J.; Praet, N.; Bellinger, D.C.; de Silva, N.R.; Gargouri, N.; et al. World Health Organization Global Estimates and Regional Comparisons of the Burden of Foodborne Disease in 2010. PLoS Med. 2015, 12, e1001923. [Google Scholar] [CrossRef]
  10. Fung, F.; Wang, H.-S.; Menon, S. Food Safety in the 21st Century. Biomed. J. 2018, 41, 88–95. [Google Scholar] [CrossRef]
  11. European Commission Rapid Alert System for Food and Feed (RASFF). Available online: https://webgate.ec.europa.eu/rasff-window/screen/search (accessed on 25 July 2024).
  12. Delgado, J.; Álvarez, M.; Cebrián, E.; Martín, I.; Roncero, E.; Rodríguez, M. Biocontrol of Pathogen Microorganisms in Ripened Foods of Animal Origin. Microorganisms 2023, 11, 1578. [Google Scholar] [CrossRef]
  13. Silva, C.C.G.; Silva, S.P.M.; Ribeiro, S.C. Application of Bacteriocins and Protective Cultures in Dairy Food Preservation. Front. Microbiol. 2018, 9, 594. [Google Scholar] [CrossRef] [PubMed]
  14. Vandera, E.; Kakouri, A.; Koukkou, A.-I.; Samelis, J. Major Ecological Shifts within the Dominant Nonstarter Lactic Acid Bacteria in Mature Greek Graviera Cheese as Affected by the Starter Culture Type. Int. J. Food Microbiol. 2019, 290, 15–26. [Google Scholar] [CrossRef]
  15. Lahiri, D.; Nag, M.; Dutta, B.; Sarkar, T.; Pati, S.; Basu, D.; Abdul Kari, Z.; Wei, L.S.; Smaoui, S.; Wen Goh, K.; et al. Bacteriocin: A Natural Approach for Food Safety and Food Security. Front. Bioeng. Biotechnol. 2022, 10, 1005918. [Google Scholar] [CrossRef]
  16. Page, M.J.; Moher, D.; Bossuyt, P.M.; Boutron, I.; Hoffmann, T.C.; Mulrow, C.D.; Shamseer, L.; Tetzlaff, J.M.; Akl, E.A.; Brennan, S.E.; et al. PRISMA 2020 Explanation and Elaboration: Updated Guidance and Exemplars for Reporting Systematic Reviews. BMJ 2021, 372, n160. [Google Scholar] [CrossRef]
  17. Ouzzani, M.; Hammady, H.; Fedorowicz, Z.; Elmagarmid, A. Rayyan—A Web and Mobile App for Systematic Reviews. Syst. Rev. 2016, 5, 210. [Google Scholar] [CrossRef] [PubMed]
  18. Godolphin, P.J.; Bath, P.M.; Montgomery, A.A. Short Email with Attachment versus Long Email without Attachment When Contacting Authors to Request Unpublished Data for a Systematic Review: A Nested Randomised Trial. BMJ Open 2019, 9, e025273. [Google Scholar] [CrossRef]
  19. Microsoft Corporation. Microsoft Excel Online, Spreadsheet Software. Available online: https://office.microsoft.com/excel (accessed on 15 January 2024).
  20. Priya, B.K.; Reddy, D.A.; Rani, A.D.; Kalahasthi, N.; Soliman, W.G.; Reddy, D.V.R.K. Automatic Inhibition Zone Diameter Measurement for Disc Diffusion Test Using Image Segmentation. IETE J. Res. 2023, 69, 5708–5725. [Google Scholar] [CrossRef]
  21. R Core Team. R: A Language and Environment for Statistical Computing; R Foundation for Statistical Computing: Vienna, Austria, 2021; Available online: https://www.R-project.org/ (accessed on 20 January 2024).
  22. Viechtbauer, W. Conducting Meta-Analyses in R with the Metafor Package. J. Stat. Softw. 2010, 36, 1–48. [Google Scholar] [CrossRef]
  23. Doleman, B.; Freeman, S.C.; Lund, J.N.; Williams, J.P.; Sutton, A.J. Funnel Plots May Show Asymmetry in the Absence of Publication Bias with Continuous Outcomes Dependent on Baseline Risk: Presentation of a New Publication Bias Test. Res. Synth. Methods 2020, 11, 522–534. [Google Scholar] [CrossRef]
  24. Alvarado, C.; García-Almendárez, B.E.; Martin, S.E.; Regalado, C. Anti-Listeria Monocytogenes Bacteriocin-like Inhibitory Substances from Enterococcus Faecium UQ31 Isolated from Artisan Mexican-Style Cheese. Curr. Microbiol. 2005, 51, 110–115. [Google Scholar] [CrossRef]
  25. Azizi, F.; Habibi Najafi, M.B.; Edalatian Dovom, M.R. The Biodiversity of Lactobacillus spp. from Iranian Raw Milk Motal Cheese and Antibacterial Evaluation Based on Bacteriocin-Encoding Genes. AMB Express 2017, 7, 176. [Google Scholar] [CrossRef]
  26. Bian, X.; Evivie, S.E.; Muhammad, Z.; Luo, G.-W.; Liang, H.-Z.; Wang, N.-N.; Huo, G.-C. In Vitro Assessment of the Antimicrobial Potentials of Lactobacillus Helveticus Strains Isolated from Traditional Cheese in Sinkiang China against Food-Borne Pathogens. Food Funct. 2016, 7, 789–797. [Google Scholar] [CrossRef] [PubMed]
  27. Câmara, S.P.; Dapkevicius, A.; Riquelme, C.; Elias, R.B.; Silva, C.C.G.; Malcata, F.X.; Dapkevicius, M.L.N.E. Potential of Lactic Acid Bacteria from Pico Cheese for Starter Culture Development. Food Sci. Technol. Int. 2019, 25, 303–317. [Google Scholar] [CrossRef]
  28. Ferrari, I.D.S.; de Souza, J.V.; Ramos, C.L.; da Costa, M.M.; Schwan, R.F.; Dias, F.S. Selection of Autochthonous Lactic Acid Bacteria from Goat Dairies and Their Addition to Evaluate the Inhibition of Salmonella Typhi in Artisanal Cheese. Food Microbiol. 2016, 60, 29–38. [Google Scholar] [CrossRef]
  29. Hejazi, M.A.; Ghafouri-Fard, S.; Eslami, S.; Afshar, D.; Barzegari, A.; Khorshidian, N. Polyphasic Characterization of Enterococcus Strains Isolated from Traditional Moghan Cheese in Iran. J. Food Saf. 2019, 39, e12631. [Google Scholar] [CrossRef]
  30. Heredia-Castro, P.Y.; Méndez-Romero, J.I.; Hernández-Mendoza, A.; Acedo-Félix, E.; González-Córdova, A.F.; Vallejo-Cordoba, B. Antimicrobial Activity and Partial Characterization of Bacteriocin-like Inhibitory Substances Produced by Lactobacillus spp. Isolated from Artisanal Mexican Cheese. J. Dairy Sci. 2015, 98, 8285–8293. [Google Scholar] [CrossRef]
  31. Jutinico-Shubach, A.; Gutiérrez-Cortés, C.; Suarez, H. Antilisterial Activity of Chitosan-Based Edible Coating Incorporating Cell-Free Supernatant from Pediococcus Pentosaceus 147 on the Preservation of Fresh Cheese. J. Food Process. Preserv. 2020, 44, e14715. [Google Scholar] [CrossRef]
  32. Kačániová, M.; Borotová, P.; Terentjeva, M.; Kunová, S.; Felšöciová, S.; Haščík, P.; Lopašovský, L.; Štefániková, J. Bryndza Cheese of Slovak Origin as Potential Resources of Probiotic Bacteria. Potravin. Slovak J. Food Sci. 2020, 14, 641–646. [Google Scholar] [CrossRef]
  33. Kanak, E.K.; Yilmaz, S.Ö. Maldi-Tof Mass Spectrometry for the Identification and Detection of Antimicrobial Activity of Lactic Acid Bacteria Isolated from Local Cheeses. Food Sci. Technol. 2019, 39, 462–469. [Google Scholar] [CrossRef]
  34. Kanak, E.K.; Yilmaz, S.Ö. Identification, Antibacterial and Antifungal Effects, Antibiotic Resistance of Some Lactic Acid Bacteria. Food Sci. Technol. 2021, 41, 174–182. [Google Scholar] [CrossRef]
  35. Leboš Pavunc, A.; Kos, B.; Beganović, J.; Uroić, K.; Bučan, D.; Šušković, J. Antibiotic Susceptibility and Antimicrobial Activity of Autochthonous Starter Cultures as Safety Parameters for Fresh Cheese Production. Mljekarstvo 2013, 63, 185–194. [Google Scholar]
  36. Loessner, M.; Guenther, S.; Steffan, S.; Scherer, S. A Pediocin-Producing Lactobacillus Plantarum Strain Inhibits Listeria Monocytogenes in a Multispecies Cheese Surface Microbial Ripening Consortium. Appl. Environ. Microbiol. 2003, 69, 1854–1857. [Google Scholar] [CrossRef] [PubMed]
  37. Muhammad, Z.; Ramzan, R.; Abdelazez, A.; Amjad, A.; Afzaal, M.; Zhang, S.; Pan, S. Assessment of the Antimicrobial Potentiality and Functionality of Lactobacillus Plantarum Strains Isolated from the Conventional Inner Mongolian Fermented Cheese Against Foodborne Pathogens. Pathogens 2019, 8, 71. [Google Scholar] [CrossRef]
  38. Nespolo, C.R.; Brandelli, A. Production of Bacteriocin-like Substances by Lactic Acid Bacteria Isolated from Regional Ovine Cheese. Braz. J. Microbiol. 2010, 41, 1009–1018. [Google Scholar] [CrossRef]
  39. Ołdak, A.; Zielińska, D.; Kołożyn-Krajewska, D. Comparison of antagonistic activity of lactic acid bacteria isolated from various types of traditional food. Zywnosc. Nauka Technol. Jakosc/Food Sci. Technol. Qual. 2019, 26, 60–72. [Google Scholar] [CrossRef]
  40. Partovi, R.; Gandomi, H.; Akhondzadeh Basti, A. Safety Aspects of Lactobacillus Plantarum Strains Isolated from Siahmazgi Cheese. Ank. Univ. Vet. Fak. Derg. 2019, 66, 337–342. [Google Scholar] [CrossRef]
  41. Settanni, L.; Franciosi, E.; Cavazza, A.; Cocconcelli, P.S.; Poznanski, E. Extension of Tosèla Cheese Shelf-Life Using Non-Starter Lactic Acid Bacteria. Food Microbiol. 2011, 28, 883–890. [Google Scholar] [CrossRef]
  42. Sip, A.; Więckowicz, M.; Olejnik-Schmidt, A.; Grajek, W. Anti-Listeria Activity of Lactic Acid Bacteria Isolated from Golka, a Regional Cheese Produced in Poland. Food Control 2012, 26, 117–124. [Google Scholar] [CrossRef]
  43. Toğay, S.Ö.; Ay, M.; Güneşer, O.; Yüceer, Y.K. Investigation of Antimicrobial Activity and entA and entB Genes in Enterococcus Faecium and Enterococcus Faecalis Strains Isolated from Naturally Fermented Turkish White Cheeses. Food Sci. Biotechnol. 2016, 25, 1633–1637. [Google Scholar] [CrossRef]
  44. Tulini, F.L.; Winkelströter, L.K.; De Martinis, E.C.P. Identification and Evaluation of the Probiotic Potential of Lactobacillus Paraplantarum FT259, a Bacteriocinogenic Strain Isolated from Brazilian Semi-Hard Artisanal Cheese. Anaerobe 2013, 22, 57–63. [Google Scholar] [CrossRef]
  45. Vandera, E.; Tsirka, G.; Kakouri, A.; Koukkou, A.-I.; Samelis, J. Approaches for Enhancing in Situ Detection of Enterocin Genes in Thermized Milk, and Selective Isolation of Enterocin-Producing Enterococcus Faecium from Baird-Parker Agar. Int. J. Food Microbiol. 2018, 281, 23–31. [Google Scholar] [CrossRef]
  46. Vataščinová, T.; Pipová, M.; Fraqueza, M.J.R.; Maľa, P.; Dudriková, E.; Drážovská, M.; Lauková, A. Short Communication: Antimicrobial Potential of Lactobacillus Plantarum Strains Isolated from Slovak Raw Sheep Milk Cheeses. J. Dairy Sci. 2020, 103, 6900–6903. [Google Scholar] [CrossRef] [PubMed]
  47. Vera Pingitore, E.; Todorov, S.D.; Sesma, F.; Gombossy de Melo Franco, B.D. Application of Bacteriocinogenic Enterococcus Mundtii CRL35 and Enterococcus Faecium ST88Ch in the Control of Listeria Monocytogenes in Fresh Minas Cheese. Food Microbiol. 2012, 32, 38–47. [Google Scholar] [CrossRef] [PubMed]
  48. Champiri, I.D.; Bamzadeh, Z.; Rahimi, E.; Rouhi, L. Isolation and Identification of Lactobacillus Brevis from Local Cheese of Bazoft and Evaluation of Antimicrobial Activity against Some Pathogenic Microorganisms. Iran. J. Med. Microbiol. 2022, 16, 17–34. [Google Scholar] [CrossRef]
  49. Erdoǧrul, Ö.; Erbilir, F. Isolation and Characterization of Lactobacillus Bulgaricus and Lactobacillus Casei from Various Foods. Turk. J. Biol. 2006, 30, 39–44. [Google Scholar]
  50. Heredia-Castro, P.Y.; Reyes-Díaz, R.; Rendón-Rosales, M.Á.; Beltrán-Barrientos, L.M.; Torres-Llanez, M.J.; Estrada-Montoya, M.C.; Hernández-Mendoza, A.; González-Córdova, A.F.; Vallejo-Cordoba, B. Novel Bacteriocins Produced by Lactobacillus Fermentum Strains with Bacteriostatic Effects in Milk against Selected Indicator Microorganisms. J. Dairy Sci. 2021, 104, 4033–4043. [Google Scholar] [CrossRef]
  51. Hojjati, M.; Behabahani, B.A.; Falah, F. Aggregation, Adherence, Anti-Adhesion and Antagonistic Activity Properties Relating to Surface Charge of Probiotic Lactobacillus Brevis Gp104 against Staphylococcus Aureus. Microb. Pathog. 2020, 147, 104420. [Google Scholar] [CrossRef] [PubMed]
  52. Huang, L.; Goda, H.A.; Abdel-Hamid, M.; Renye, J.A., Jr.; Yang, P.; Huang, Z.; Zeng, Q.-K.; Li, L. Partial Characterization of Probiotic Lactic Acid Bacteria Isolated from Chinese Dairy Products. Int. J. Food Prop. 2021, 24, 446–456. [Google Scholar] [CrossRef]
  53. Potočnjak, M.; Pušić, P.; Frece, J.; Abram, M.; Jankovic, T.; Gobin, I. Three New Lactobacillus Plantarum Strains in the Probiotic Toolbox against Gut Pathogen Salmonella Enterica Serotype Typhimurium. Food Technol. Biotechnol. 2017, 55, 48–54. [Google Scholar] [CrossRef] [PubMed]
  54. Slyvka, I.; Tsisaryk, O.; Musii, L.; Kushnir, I.; Koziorowski, M.; Koziorowska, A. Identification and Investigation of Properties of Strains Enterococcus spp. Isolated from Artisanal Carpathian Cheese. Biocatal. Agric. Biotechnol. 2022, 39, 102259. [Google Scholar] [CrossRef]
  55. Ait Chait, Y.; Gunenc, A.; Hosseinian, F.; Bendali, F. Antipathogenic and Probiotic Potential of Lactobacillus Brevis Strains Newly Isolated from Algerian Artisanal Cheeses. Folia Microbiol. 2021, 66, 429–440. [Google Scholar] [CrossRef]
  56. Jabbari, V.; Khiabani, M.S.; Mokarram, R.R.; Hassanzadeh, A.M.; Ahmadi, E.; Gharenaghadeh, S.; Karimi, N.; Kafil, H.S. Lactobacillus Plantarum as a Probiotic Potential from Kouzeh Cheese (Traditional Iranian Cheese) and Its Antimicrobial Activity. Probiotics Antimicrob. Proteins 2017, 9, 189–193. [Google Scholar] [CrossRef]
  57. Karami, S.; Roayaei, M.; Hamzavi, H.; Bahmani, M.; Hassanzad-Azar, H.; Leila, M.; Rafieian-Kopaei, M. Isolation and Identification of Probiotic Lactobacillus from Local Dairy and Evaluating Their Antagonistic Effect on Pathogens. Int. J. Pharm. Investig. 2017, 7, 137–141. [Google Scholar] [CrossRef] [PubMed]
  58. Khalil, N.; Kheadr, E.; El-Ziney, M.; Dabour, N. Lactobacillus plantarum Protective Cultures to Improve Safety and Quality of Wheyless Domiati-like Cheese. J. Food Process. Preserv. 2022, 46, e16416. [Google Scholar] [CrossRef]
  59. Madi, N.; Boushaba, R. Identification of Potential Biopreservative Lactic Acid Bacteria Strains Isolated from Algerian Cow’s Milk and Demonstration of Antagonism against S. aureus in Cheese. Food Sci. Technol. Res. 2017, 23, 679–688. [Google Scholar] [CrossRef]
  60. Ngamsomchat, A.; Kaewkod, T.; Konkit, M.; Tragoolpua, Y.; Bovonsombut, S.; Chitov, T. Characterisation of Lactobacillus Plantarum of Dairy-Product Origin for Probiotic Chèvre Cheese Production. Foods 2022, 11, 934. [Google Scholar] [CrossRef] [PubMed]
  61. Vahabzadeh, S.; Özpinar, H. Investigation of Some Biochemical Properties, Antimicrobial Activity and Antibiotic Resistances of Kefir Supernatants and Lactococcus Lactis Ssp. Lactis Strains Isolated from Raw Cow Milk and Cheese Samples. Kafkas Univ. Vet. Fak. Derg. 2018, 24, 443–450. [Google Scholar] [CrossRef]
  62. Parente, E.; Zotta, T.; Ricciardi, A. Microbial Association Networks in Cheese: A Meta-Analysis. bioRxiv 2021. bioRxiv:2021.07.21.453196. [Google Scholar] [CrossRef]
  63. García-Cano, I.; Rocha-Mendoza, D.; Kosmerl, E.; Zhang, L.; Jiménez-Flores, R. Technically Relevant Enzymes and Proteins Produced by LAB Suitable for Industrial and Biological Activity. Appl. Microbiol. Biotechnol. 2020, 104, 1401–1422. [Google Scholar] [CrossRef]
  64. Walsh, A.M.; Macori, G.; Kilcawley, K.N.; Cotter, P.D. Meta-Analysis of Cheese Microbiomes Highlights Contributions to Multiple Aspects of Quality. Nat. Food 2020, 1, 500–510. [Google Scholar] [CrossRef]
  65. Fu, Y.; Mu, D.; Qiao, W.; Zhu, D.; Wang, X.; Liu, F.; Xu, H.; Saris, P.; Kuipers, O.P.; Qiao, M. Co-Expression of Nisin Z and Leucocin C as a Basis for Effective Protection against Listeria Monocytogenes in Pasteurized Milk. Front. Microbiol. 2018, 9, 547. [Google Scholar] [CrossRef] [PubMed]
  66. Henderson, L.O.; Erazo Flores, B.J.; Skeens, J.; Kent, D.; Murphy, S.I.; Wiedmann, M.; Guariglia-Oropeza, V. Nevertheless, She Resisted-Role of the Environment on Listeria Monocytogenes Sensitivity to Nisin Treatment in a Laboratory Cheese Model. Front. Microbiol. 2020, 11, 635. [Google Scholar] [CrossRef] [PubMed]
  67. Taye, Y.; Degu, T.; Fesseha, H.; Mathewos, M. Isolation and Identification of Lactic Acid Bacteria from Cow Milk and Milk Products. ScientificWorldJournal 2021, 2021, 4697445. [Google Scholar] [CrossRef] [PubMed]
  68. Silva, B.N.; Cadavez, V.; Teixeira, J.A.; Gonzales-Barron, U. Meta-Regression Models Describing the Effects of Essential Oils and Added Lactic Acid Bacteria on Pathogen Inactivation in Cheese. Microb. Risk Anal. 2021, 18, 100131. [Google Scholar] [CrossRef]
  69. Lam, L.H.; Monack, D.M. Intraspecies Competition for Niches in the Distal Gut Dictate Transmission during Persistent Salmonella Infection. PLoS Pathog. 2014, 10, e1004527. [Google Scholar] [CrossRef]
  70. Shafique, B.; Ranjha, M.M.A.N.; Murtaza, M.A.; Walayat, N.; Nawaz, A.; Khalid, W.; Mahmood, S.; Nadeem, M.; Manzoor, M.F.; Ameer, K.; et al. Recent Trends and Applications of Nanoencapsulated Bacteriocins against Microbes in Food Quality and Safety. Microorganisms 2022, 11, 85. [Google Scholar] [CrossRef]
  71. Coelho, M.C.; Malcata, F.X.; Silva, C.C.G. Lactic Acid Bacteria in Raw-Milk Cheeses: From Starter Cultures to Probiotic Functions. Foods 2022, 11, 2276. [Google Scholar] [CrossRef]
Figure 1. PRISMA flow diagram.
Foods 13 02635 g001
Figure 2. Scatter plot depicting the effect (p = 0.006) of L. monocytogenes concentration on the inhibition diameters. Markers symbolize bacterium: ○ = Enterococcus, ∆ = Lacticaseibacillus, + = Lactobacillus, × = Lactococcus, ◊ = Leuconostoc, ∇ = Pediococcus; and marker size is proportional to the study size. Solid line represents fitted values and dashed lines the 95% confidence interval.
Foods 13 02635 g002
Figure 3. Scatter plot depicting the effect (p < 0.001) of incubation time on the inhibition diameters. Markers symbolize bacterium: ○ = Enterococcus, ∆= Lacticaseibacillus, + = Lactobacillus, × = Lactococcus, ◊ = Leuconostoc, ∇ = Pediococcus; and marker size is proportional to the study size. Solid line represents fitted values and dashed lines the 95% confidence interval.
Foods 13 02635 g003
Figure 4. Funnel plot of the meta-regression model of the inhibition diameter produced by lactic acid bacteria supernatant against L. monocytogenes. Markers symbolize bacterium: ○ = Enterococcus, ∆ = Lacticaseibacillus, + = Lactobacillus, × = Lactococcus, ◊ = Leuconostoc, ∇ = Pediococcus.
Foods 13 02635 g004
Figure 5. Scatter plot depicting the effect (p < 0.001) of incubation time on the inhibition diameters of Salmonella spp. Markers symbolize bacterium: ○ = Enterococcus, ∆ = Lactobacillus, + = Lactococcus; and marker size is proportional to the study size. Solid line represents fitted values and dashed lines the 95% confidence interval.
Foods 13 02635 g005
Figure 6. Scatter plot depicting the effect (p < 0.001) of pH on the inhibition diameters of Lactobacillus against Salmonella spp. Marker size is proportional to study size. The pH was not added to the final model as a moderator because there were too few incidences. Solid line represents fitted values and dashed lines the 95% confidence interval.
Foods 13 02635 g006
Figure 7. Funnel plot of the meta-regression model of the inhibition diameter produced by lactic acid bacteria supernatant against Salmonella spp. Markers symbolize bacterium: ○ = Enterococcus, ∆ = Lactobacillus, + = Lactococcus.
Foods 13 02635 g007
Figure 8. Scatter plot depicting the effect (p < 0.001) of incubation time on the inhibition diameters. Markers symbolize bacterium: ○ = Enterococcus, ∆ = Lacticaseibacillus, + = Lactobacillus, × = Lactococcus, ◊ = Leuconostoc, ∇ = Pediococcus; and marker size is proportional to the study size. Solid line represents fitted values and dashed lines the 95% confidence interval.
Foods 13 02635 g008
Figure 9. Scatter plot depicting the effect (p < 0.001) of pH on the inhibition diameters. Markers symbolize bacterium: ○ = Enterococcus, ∆ = Lacticaseibacillus, + = Lactobacillus, × = Lactococcus, ◊ = Leuconostoc, ∇ = Pediococcus; and marker size is proportional to study size. pH was not added in the final model as a moderator because there were too few incidences. Solid line represents fitted values and dashed lines the 95% confidence interval.
Foods 13 02635 g009
Figure 10. Funnel plot of the meta-regression model of the inhibition diameter produced by lactic acid bacteria supernatant against S. aureus. Markers symbolize bacterium: ○ = Enterococcus, ∆ = Lacticaseibacillus, + = Lactobacillus, × = Lactococcus, ◊ = Leuconostoc, ∇ = Pediococcus.
Foods 13 02635 g010
Table 1. Pooled inhibition diameters (mean and standard error in mm) produced by lactic acid bacteria (LAB) supernatant using pathogen’s concentration of 7.0 log CFU/mL and an incubation time of 24 h, as estimated by meta-regression models adjusted by foodborne pathogen. The number of observations (n) and number of primary studies (N) are shown.
Pathogen 1LAB GenusMethodPooled Inhibition
Diameter 2,3 (SE) [mm]
nN
Listeria monocytogenes AEnterococcusOverall15.90 A (2.138) 3824
 Well 19.47 a (2.409)28
 Disk 10.98 c (1.962)10
LacticaseibacillusOverall13.95 B (2.313) 8
 Well 28.57 a (5.058)4
 Disk 11.73 c (1.835)4
LactobacillusOverall11.96 C (1.886) 92
 Spot 14.87 b (2.883)14
 Well 12.02 c (2.541)18
 Disk 10.88 c (1.598)60
LactococcusOverall13.12 B (2.129) 20
 Spot 17.75 a (2.076)14
 Disk 10.23 c (1.792)6
LeuconostocOverall 10.25 C (2.712) 5
 Spot 14.04 b (3.045)4
PediococcusOverall8.735 C (4.663) 14
 Well 8.800 c (3.025)14
Salmonella spp BEnterococcusOverall12.00 A (1.195) 1314
 Well 13.39 a (1.408)12
LactobacillusOverall12.36 A (1.148) 69
 Well 13.58 a (1.362)18
 Disk 11.13 b (1.361)51
LactococcusOverall12.76 A (1.194) 7
 Disk 10.82 b (1.433)5
Staphylococcus aureus BEnterococcusOverall11.01 A (2.105) 1025
 Well 14.16 a (0.716)4
 Disk 5.28 d (0.366)6
LacticaseibacillusOverall11.89 A (0.573) 9
 Well 12.36 b (1.501)5
 Disk 12.00 b (1.197)4
LactobacillusOverall11.35 A (1.096) 133
 Well 10.00 c (1.772)67
 Disk 12.03 b (1.394)66
LactococcusOverall11.33 A (9.578) 7
 Disk 11.24 b (0.529)5
LeuconostocOverall 7.173 B (0.287) 8
 Well 7.198 (0.304)8
PediococcusOverall7.173 B (0.225) 15
 Well 7.161 (0.232)15
1 Different superscript uppercase letters indicate significant differences in the pooled inhibition diameter between pathogens according to a single meta-regression including pathogen, lactic acid bacteria (LAB) genus, susceptibility test method, aliquot volume, pathogen concentration, and incubation time as moderators. 2 Different superscript uppercase letters indicate significant differences in the pooled inhibition diameter between LAB genera according to three meta-regression models (by pathogen) including LAB genus, aliquot volume, pathogen concentration and incubation time as moderators. 3 Different superscript lowercase letters indicate significant differences in the pooled inhibition diameter between LAB genera according to three meta-regression models (by pathogen), including LAB genus, aliquot volume, pathogen concentration, incubation time, and susceptibility test method as moderators.
Table 2. Final meta-regression model of inhibition diameter produced by lactic acid bacteria (LAB) supernatant against L. monocytogenes as a function of LAB genus, pathogen concentration (log CFU/mL), and incubation time (h). Number of observations (n) per LAB genus, pathogen concentration (log CFU/mL), and incubation time (h). The number of observations (n) per LAB genus, heterogeneity analysis, and p-values for the publication bias test are shown.
ParameterEstimateStandard Errorp-ValuenHeterogeneity Analysis 1
Intercept 45.6712.410.002 s2 = 53.0
LAB genus τ2 = 65.2
 Lacticaseibacillus−1.2172.1120.5658τ2res = 43.1
 Lactobacillus−3.3751.5800.03392R2 = 33.8%
 Lactococcus−2.2481.7870.20820
 Leuconostoc−5.1402.5280.0425
 Enterococcus---81
Pathogen concentration−5.0371.8400.006 Publication bias
Incubation time0.2290.229<0.0001 p = 0.977
1 Heterogeneity analysis encompasses within-study variability (s2), between-study variability (τ2), and intra-class correlation (I2) of the null model, and residual between-study variability (τ2res), and between-study variability explained by significant moderators (R2) from the full model.
Table 3. Final meta-regression model of inhibition diameter produced by lactic acid bacteria (LAB) supernatant against Salmonella spp. as a function of susceptibility test method, agar, and incubation time (h). Heterogeneity analysis and p-value of the publication bias test are shown.
ParameterEstimate Standard Errorp-ValuenHeterogeneity Analysis 1
Intercept10.412.250<0.0001
Susceptibility method
 Disk diffusion−2.5290.9790.009 s2 = 25.1
Agar τ2 = 12.8
 MH−1.5402.9200.58911I2 = 33.6%
 MRS−8.1142.2730.00120τ2res = 6.1
 Nutrient3.5752.5530.1615R2 = 52.3%
 TSA−2.1112.0370.30010
 BHI---43Publication bias
Incubation time0.1880.005<0.0001 p = 0.217
1 Heterogeneity analysis encompasses within-study variability (s2), between-study variability (τ2), and intra-class correlation (I2) of the null model, and residual between-study variability (τ2res), and between-study variability explained by significant moderators (R2) from the full model. MH: Mueller-Hinton; MRS: de Man Rogosa and Sharpe; TSA: Trypticase Soy Agar; BHI: Brain Heart Infusion.
Table 4. Final meta-regression model of inhibition diameter produced by lactic acid bacteria (LAB) supernatant against S. aureus, as a function of LAB genus, pathogen concentration (log CFU/mL), incubation time (h), and susceptibility test method. Heterogeneity analysis and p-value of the publication bias test are shown.
ParameterEstimateStandard Errorp-ValuenHeterogeneity Analysis 1
Intercept 22.042.545<0.0001
LAB genus s2 = 31.8
 Lacticaseibacillus−0.9231.4810.5339τ2 = 20.2
 Lactobacillus−1.2951.2080.283133I2 = 38.8%
 Lactococcus−1.7581.8420.3407τ2res = 16.2
 Leuconostoc−5.6661.8350.0028R2 = 19.8%
 Pediococcus−7.3352.1540.00115
 Enterococcus---10
Pathogen concentration−1.8880.297<0.0001 Publication bias
Incubation time0.2200.005<0.0001 p = 0.492
Susceptibility method
 Disk diffusion−2.3730.483<0.0001
1 Heterogeneity analysis encompasses within-study variability (s2), between-study variability (τ2), and intra-class correlation (I2) of the null model, and residual between-study variability (τ2res), and between-study variability explained by significant moderators (R2) from the full model.
Disclaimer/Publisher’s Note: The statements, opinions and data contained in all publications are solely those of the individual author(s) and contributor(s) and not of MDPI and/or the editor(s). MDPI and/or the editor(s) disclaim responsibility for any injury to people or property resulting from any ideas, methods, instructions or products referred to in the content.

