Article

Investigation of the Lipid-Lowering Activity and Mechanism of Three Extracts from Astragalus membranaceus, Hippophae rhamnoides L., and Taraxacum mongolicum Hand. Mazz Based on Network Pharmacology and In Vitro and In Vivo Experiments

1
College of Life Sciences, Northeast Forestry University, Harbin 150040, China
2
Key Laboratory of Forest Food Resources Utilization of Heilongjiang Province, Harbin 150040, China
*
Author to whom correspondence should be addressed.
These authors contributed equally to this work.
Foods 2024, 13(17), 2795; https://doi.org/10.3390/foods13172795
Submission received: 8 August 2024 / Revised: 30 August 2024 / Accepted: 31 August 2024 / Published: 2 September 2024
(This article belongs to the Section Food Engineering and Technology)

Abstract

:
Hyperlipidemia is a metabolic disorder characterized by abnormal lipid metabolism, resulting in lipid accumulation in the plasma. According to reports, medicinal and edible plants can reduce the risk of metabolic diseases such as hyperlipidemia. This study investigates the effects and mechanisms of Astragalus membranaceus extract (AME), Hippophae rhamnoides L. extract (HRE), and Taraxacum mongolicum Hand. Mazz extract (TME) on hyperlipidemia. Active compounds and potential gene targets of AME, HRE, and TME were screened using LC-MS and TCMSP databases, and hyperlipidemia targets were detected from the OMIM and DisGeNet databases. A drug-target pathway disease network was constructed through protein interactions, GO enrichment, and KEGG pathway analysis. Finally, the lipid-lowering effects of three extracts were validated through in vitro HepG2 cell and in vivo animal experiments. The results show that LC-MS and network pharmacology methodologies identified 41 compounds and 140 targets. KEGG analysis indicated that the PI3K-Akt and MAPK signaling pathways significantly treat hyperlipidemia with AHT. In vitro experiments have shown that AHT is composed of a ratio of AME:HRE:TME = 3:1:2. HepG2 cell and animal experiments revealed that AHT exhibits strong lipid-lowering and antioxidant properties, significantly regulating the levels of total cholesterol (TC), triglycerides (TG), high-density lipoprotein cholesterol (HDL-C), low-density lipoprotein cholesterol (LDL-C), superoxide dismutase (SOD), and total antioxidant capacity (T-AOC). It is worth noting that AHT can effectively downregulate the protein expression levels of p-AKT/AKT and p-PI3K/PI3K and upregulate the protein expression levels of p-AMPK/AMPK and SIRT1, verifying the results predicted by network pharmacology. This study presents a novel approach to utilizing these natural plant extracts as safe and effective treatments for hyperlipidemia.

1. Introduction

Hyperlipidemia (HLP) is a metabolic disorder caused by abnormal lipid metabolism or transport, resulting in one or more lipids in the plasma being higher than the normal range [1]. Its characteristics are an increase in total cholesterol (TC), triglycerides (TGs), and low-density lipoprotein cholesterol (LDL-C) levels or a decrease in circulating high-density lipoprotein cholesterol (HDL-C) levels [2]. Hyperlipidemia is recognized as a significant risk factor for nonalcoholic fatty liver disease, atherosclerosis, diabetes, and various other metabolic disorders [3]. Currently, statins are the primary treatment for hyperlipidemia. While they act quickly, long-term use may result in side effects, including a single treatment mechanism, liver and kidney complications, and muscle-related issues [4]. Consequently, developing a treatment plan with good efficacy and minimal side effects has become a research hotspot in recent years.
Medicinal and edible plants contain a variety of natural active ingredients. In comparison to traditional chemically synthesized drugs, traditional Chinese medicine, which boasts extensive experience in pharmacotherapy, is noted for its reduced adverse reactions and more pronounced long-term effects [5,6]. Previous studies have indicated that medicinal and edible plants mainly treat hyperlipidemia by improving blood lipids, antioxidation, and regulating gut microbiota [7,8,9]. Astragalus membranaceus, Hippophae rhamnoides L., and Taraxacum mongolicum Hand. Mazz are typical medicinal and edible plants rich in active ingredients such as flavonoids, saponins, polysaccharides, and triterpenes. They have the characteristics of lowering blood lipids, lowering blood sugar, regulating immunity, antioxidation, and being anti-inflammatory. Multiple studies have demonstrated that Astragalus membranaceus, Hippophae rhamnoides L., and Taraxacum mongolicum Hand. Mazz can inhibit cholesterol synthesis and regulate lipid metabolism [10,11,12]. They demonstrate significant potential in the treatment of hyperlipidemia and metabolic disorders. In recent years, due to the advancement of databases related to drugs and diseases, research in the field of bioinformatics has become increasingly popular. Network pharmacology has become widely used in studying medicinal and edible plants, which can construct networks and interactions related to drugs, targets, diseases, and pathways. Network pharmacology can conduct in-depth analysis and explore the pharmacological mechanisms of various active ingredients and targets in medicinal and edible plants [13]. Therefore, network pharmacology can be used to further elucidate the chemical composition and mechanism of the three extracts’ lipid-lowering effects.
This study initially identified the active ingredients of three extracts through liquid chromatography–mass spectrometry (LC-MS). Subsequently, network pharmacology was employed to predict the lipid-lowering mechanisms associated with these active ingredients, utilizing databases to construct an interaction network relevant to the three extracts’ treatment of hyperlipidemia. The potential lipid-lowering mechanisms of the three extracts were validated through assays conducted on HepG2 cells. Finally, a hyperlipidemia mouse model was established to assess the lipid-lowering efficacy of the three extracts. This research offers a novel strategy for the prevention and treatment of hyperlipidemia.

2. Materials and Methods

2.1. Chemicals and Reagents

Astragalus membranaceus extract (AME), Hippophae rhamnoides L. extract (HRE), and Taraxacum mongolicum Hand. Mazz extract (TME) were purchased from Xi’an Ruihe Biotechnology Co., Ltd. (Xi’an, China). The MTT cell proliferation and cytotoxicity assay kit and BCA protein quantification kit were purchased from Beyotime Biotechnology Co., Ltd. (Shanghai, China), while the total cholesterol (TC), triglycerides (TGs), low-density lipoprotein cholesterol (LDL-C), high-density lipoprotein cholesterol (HDL-C), aspartate aminotransferase (AST), alanine aminotransferase (ALT), superoxide dismutase (SOD), and total antioxidant capacity (T-AOC) assay kits were purchased from Nanjing Jiancheng Bioengineering Research Institute (Nanjing, China). Oleic acid and simvastatin were purchased from MACKUN Biotech (Shanghai, China).

2.2. LC-MS Analysis Conditions

AHT powder was measured using liquid chromatography (Vanquish, Thermo, Waltham, MA, USA) and mass spectrometry (Orbitrap Exploris 120, Thermo, Waltham, MA, USA). Firstly, AHT powder (10 mg) was dissolved in 90% methanol (3 mL) and centrifuged (10,000× g, 10 min, 4 °C) to obtain the supernatant. Then, 150 μL of supernatant was filtered through a 0.22 μm filter membrane into an LC vial for LC-MS analysis.
The liquid chromatography conditions were as follows: The LC analysis was performed on a Vanquish UHPLC System (Thermo Fisher Scientific, Waltham, MA, USA). A 2 μL aliquot was injected into a 2.1 × 100 mm, 1.8 µm column (Waters, Milford, MA, USA) with a flow rate of 0.3 mL/min. For LC-ESI (+)-MS analysis, the mobile phases consisted of (A) 0.1% formic acid in acetonitrile (v/v) and (B) 0.1% formic acid in water (v/v) under the following gradient: 0~1 min, 10% A; 1~5 min, 10~98% A; 5~6.5 min, 98% A; 6.5~6.6 min, 98~10% A; 6.6~8 min, 10% A. For LC-ESI (−)-MS analysis, the mobile phases consisted of (C) acetonitrile and (D) ammonium formate (5 mM) under the following gradient: 0~1 min, 10% C; 1~5 min, 10~98% C; 5~6.5 min, 98% C; 6.5~6.6 min, 98~10% C; 6.6~8 min, 10% C.
Mass spectrometric detection of metabolites was performed on Orbitrap Exploris 120 (Thermo Fisher Scientific, Waltham, MA, USA) with an ESI ion source. Simultaneous MS1 and MS/MS acquisition were used. The parameters were as follows: sheath gas pressure, 40 arb; aux gas flow, 10 arb; spray voltage, 3.50 kV and −2.50 kV for ESI (+) and ESI (−), respectively; capillary temperature, 325 °C; MS1 range, m/z 100–1000.
A quantitative list of substances was obtained using the R XCMS software (V3.12.0) package for peak detection, peak filtering, and peak alignment processing. Normalizing the total peak area was used to achieve data correction and eliminate systematic errors. The substance identification process uses the Human Metabolome Database (HMDB), LipidMaps, McCloud, and KEGG databases for retrieval and comparison. The molecular weight of metabolites was determined. The molecular formula was predicted based on the mass-to-charge ratio of parent ions in primary mass spectrometry and information on added ions, and then matched with a database. Meanwhile, fragment ions from secondary spectra were utilized for secondary qualitative identification of metabolites [14,15].

2.3. AHT Chemical Composition Screening and Target Prediction

From the Traditional Chinese Medicine System Pharmacology Analysis Platform (TCMSP), (http://lsp.nwu.edu.cn/tcmsp.php, accessed on 20 July 2024). The database used Huangqi, Shaji, and Pugongying as keywords, and the filtering criteria were set to OB ≥ 30% and DL ≥ 0.18. Through the UniProt database (https://sparql.uniprot.org/, accessed on 20 July 2024), all targets are standardized [16,17].

2.4. Prediction of Targets for Hyperlipidemia

Potential targets related to hyperlipidemia have been identified from Genecards (https://www.Genecards.org/, accessed on 22 July 2024), the DisGeNet database (https://www.disgenet.org/, accessed on 18 July 2024), and Online Mendelian Inheritance in Man (OMIM, https://www.genecards.org/, accessed on 18 July 2024). After eliminating duplicate targets, potential targets related to HLP were obtained [18,19].

2.5. Construction of Drug Target Network and Pathways

Firstly, in order to obtain common targets for compounds and diseases, Venny 2.1.0 was used (https://bioinfogp.cnb.csic.es/tools/venny/, accessed on 23 July 2024) to perform filtering. Common targets imported into Cytoscape 3.9.1 software to construct a drug–target disease network. The interacting targets were mapped to the STRING database (https://string-db.org/, accessed on 23 July 2024). After visualization using Cytoscape 3.9.1 software, the protein–protein interaction (PPI) network was obtained and filtered based on intermediate centrality (BC), compact centrality (CC), degree centrality (DC), eigenvector centrality (EC), local average connectivity (LAC), and network centrality (NC), with values greater than or equal to twice the median. After deleting duplicate targets, the core targets were merged to obtain 140 common targets, which were imported into the DAVID database (https://david.ncifcrf.gov/, accessed on 24 July 2024). They were used for gene ontology (GO) and Kyoto Encyclopedia of Genes and Genomes (KEGGs) analysis to explore the biological processes and signaling pathways involved in treating hyperlipidemia in AHT [20,21,22].

2.6. Pancreatic Lipase Inhibition Test and Combined Index Analysis

Ten mg of pancreatic lipase (PL) was accurately weighed and dissolved in 10 mL Tris HCl buffer, resulting in a 1.0 mg/mL PL solution. A volume of 8.44 μL of NPB liquid was accurately transferred, and 4 mL of acetonitrile was added to obtain a 12 mmol/L NPB solution, which was used as a substrate. The sample, PL solution, and 4-nitrophenylbutyrate were added to a 96-well plate and reacted at 37 °C for 2 h. The absorbance was measured at 405 nm [23,24]. The formula for calculating the pancreatic lipase inhibition rate is:
Inhibition   rate   ( % ) = ( A 1 A 2 ) ( A 3 A 4 ) A 1 A 2 × 100
A1 is the absorbance value of the blank group; A2 is the absorbance value of the blank control group; A3 is the absorbance value of the sample group; and A4 is the absorbance value of the sample control group.
The Chou Talalay method, also known as the combination index method (CI), is widely used for quantitative evaluation of the interactions between multiple drug formulations [25]. Using the Chou and Talalay formulas, calculate the effects of each extract alone and in combination.
f a f u = ( D D m ) m
D: Dose, Dm: the dose that produces moderate effects, fa: the practical portion of the dose, m: the coefficient of the dose–response curve.
The data analysis and calculation formula for the combination drug index (CI) is as follows:
CI = D 1 D X 1 + D 2 D X 2
D1 and D2 are the effective concentrations when the drug combination inhibition rate is 50%, while DX1 and DX2 are effective when the drug is used alone with an inhibition rate of 50%. The CI values of the complex in each group were calculated using the combination index calculation formula and CompuSyn program to analyze the effects of the three extracts combined [26,27].

2.7. Cell Culture and MTT Assay

HepG2 cells were derived from the cell bank of the Chinese Academy of Sciences (Shanghai, China); DMEM was used (adding 10% fetal bovine serum and 1% penicillin and streptomycin); and the cells were cultured in a humidified incubator at 37 ℃ and 5% CO2, and the medium was changed every two to three days. When the cell density reached over 80%, trypsin was used for subculture [28]. HepG2 cells were detected for cell proliferation using an MTT assay. The cells were seeded at a density of 5 × 10³ cells/well into a 96-well plate for 24 h and then replaced with standard culture medium containing different concentrations (0, 10, 50, 100, 200, and 500 μM) of HRE, AME, TME, and AHT for 24 h. Then, 10 μL of MTT solution were added and the cells were incubated for 4 h. Afterward, 150 μL of dimethyl sulfoxide was added to each well and the absorbance value was measured at 490 nm using a microplate reader (Tecan Infinite 200 Pro, Shanghai, China) [17,29].

2.8. Establishment of High-Fat Model and Administration Regimen

Cells were seeded at a density of 5 × 10⁵ cells/well in a 12-well culture plate and cultured for 24 h. They were then exposed to oleic acid (0.5 mM) for 24 h to induce a high-fat model. The treatment group was cultured with 100 μM HRE, 200 μM AME, 100 μM TME, and AHT (AME: HRE: TME = 3:1:2) for 24 h.

2.9. Oil Red O Staining

HepG2 cells in each well were washed gently with PBS 3 times and then rinsed quickly with 60% isopropanol for 20 s. The cells were stained with Oil Red O in the dark at room temperature (25 °C) for 20 min. Then, the staining solution was discarded and the cells were rinsed 5 times with distilled water, each for 1 min per well. In addition, 100% isopropanol (1 mL) was added to each well and stirred at room temperature (25 °C) for 10 min [30].

2.10. Determination of Lipid-Lowering Levels in HepG2 Cells by AHT

Cells were seeded at a density of 5 × 10⁵ cells/well in a 12-well culture plate and cultured for 24 h. Except for the NC group, which was added to the standard culture medium, all other groups were added to the culture medium containing OA. The treatment group was added with AME at a concentration of 200 μM, HRE, and TME at a concentration of 100 μM, and AHT for 24 h to evaluate their lipid-lowering effects on cells. The cell culture medium was removed, and the cells were washed three times with PBS before being lysed. The levels of TC, TG, HDL-C, and LDL-C were measured according to the instructions of the reagent kit. The protein concentrations of each group were measured using the BCA protein quantification kit.

2.11. Western Blot Analysis

Cells were seeded at a density of 1 × 10⁶ cells/well in a 6-well culture plate and cultured for 24 h. All other groups were added to the standard culture medium except for the NC group, which was added to the culture medium containing OA. The treatment group was added with 100 μM HRE, 200 μM AME, and 100 μM TME and AHT for 24 h, respectively, and Western blotting was performed for testing. The Western blotting method is described below.
Cells were lysed in RIPA buffer (Beyotime, Shanghai, China) containing 1% PMSF for 10 min, then centrifuged at 4 °C and 12,000× g for 10 min. Protein quantification was performed using the BCA protein assay kit (Beyotime, Shanghai, China). The protein sample was boiled at 100 °C for 10 min and then separated by 10% SDS-PAGE. It was transferred to a PVDF Western blotting membrane (Biotopped, Beijing, China) and then blocked with 5% skim milk powder (Biosharp, Hefei, China) at room temperature (RT) for 2 h. The membrane was washed three times with TBST buffer (Biotopped, Beijing, China). The primary antibody was incubated overnight at 4 °C, and the membrane was washed three times with TBST and then incubated with the secondary antibody goat anti-rabbit (ABclonal, AS014, WB: 1:2000). An ECL chemiluminescence detection kit (ABclonal, Wuhan, China) was used for protein detection, a gel imager (Tanon 5200, Shanghai, China) was used for image capture, and image J software (Version 1.46r) was used to analyze the gray value. β—actin rabbit (ABclonal, AC038, WB: 1:20,000) was used as an endogenous control. The selected primary antibodies were: PI3 kinase p85 alpha rabbit pAb (ABclonal, A11526, WB: 1:500), AKT1 rabbit mAb (ABclonal, A17909, WB: 1:1000), phospho-AKT1-S129 rabbit pAb (ABclonal, AP1272, WB: 1:200), phospho-PI3K (ABclonal, AP0854, WB: 1:500), AMPKα1 rabbit pAb (ABclonal, AP1229, WB: 1:2000), phospho-AMPKα1 rabbit pAb (ABclonal, AP0871, WB: 1:2000), SIRT1 rabbit pAb (ABclonal, A11267, WB: 1:2000).

2.12. Animal Experiments

Eight-week-old male KM mice weighing 32 ± 2 g were purchased from Qingdao Petford White Mouse Breeding Professional Cooperative (Qingdao, China). The certificate number is SCXK (Lu) 2019-00003. All mice were free to eat and drink, with a 12 h/12 h light–dark cycle. All animal procedures were conducted by the National Research Council’s “Guidelines for the Care and Use of Experimental Animals” and were approved by the Ethics Committee of Northeast Forestry University (NEFU2024-011) [31].
After adaptive feeding for 1 w, KM mice were randomly divided into 6 groups based on body weight, namely normal control (NC), model control (MC), positive control (PC), low-dose administration (LD), medium-dose administration (MD), and high-dose administration (HD), with 8 mice in each group. NC was given standard feed, while the other groups were given high-fat feed for 8 w. NC and MC were given saline by gavage, the PC group was given 10 mg/kg simvastatin by gavage, and the LD group was given 41.25 mg/kg AME, 13.75 mg/kg HRE, and 27.5 mg/kg TME by gavage. MD was orally administered 82.5 mg/kg AME, 27.5 mg/kg HRE, and 55 mg/kg TME, while HD was orally administered 165 mg/kg AME, 110 mg/kg HRE, and 55 mg/kg TME for 8 w. Food intake was measured daily, and the weight of each mouse was measured weekly. After the experiment, blood was collected from the eyeballs of anesthetized mice.

2.13. Determination of Serum Biochemical Indicators

Mouse blood was centrifuged at 3000× g for 15 min to obtain mouse serum. The levels of TC, TG, LDL-C, HDL-C, AST, ALT, SOD, and T-AOC were measured in serum according to the instructions of the kit [32].

2.14. Statistical Analysis

All experiments were conducted in at least three parallel experiments, and the results were reported as mean ± standard deviation. Statistical analysis was conducted using GraphPad Prism 9.5, and ****, ***, **, * and ns represent p < 0.0001, p < 0.001, p < 0.01, p < 0.05, and p > 0.05, respectively.

3. Results

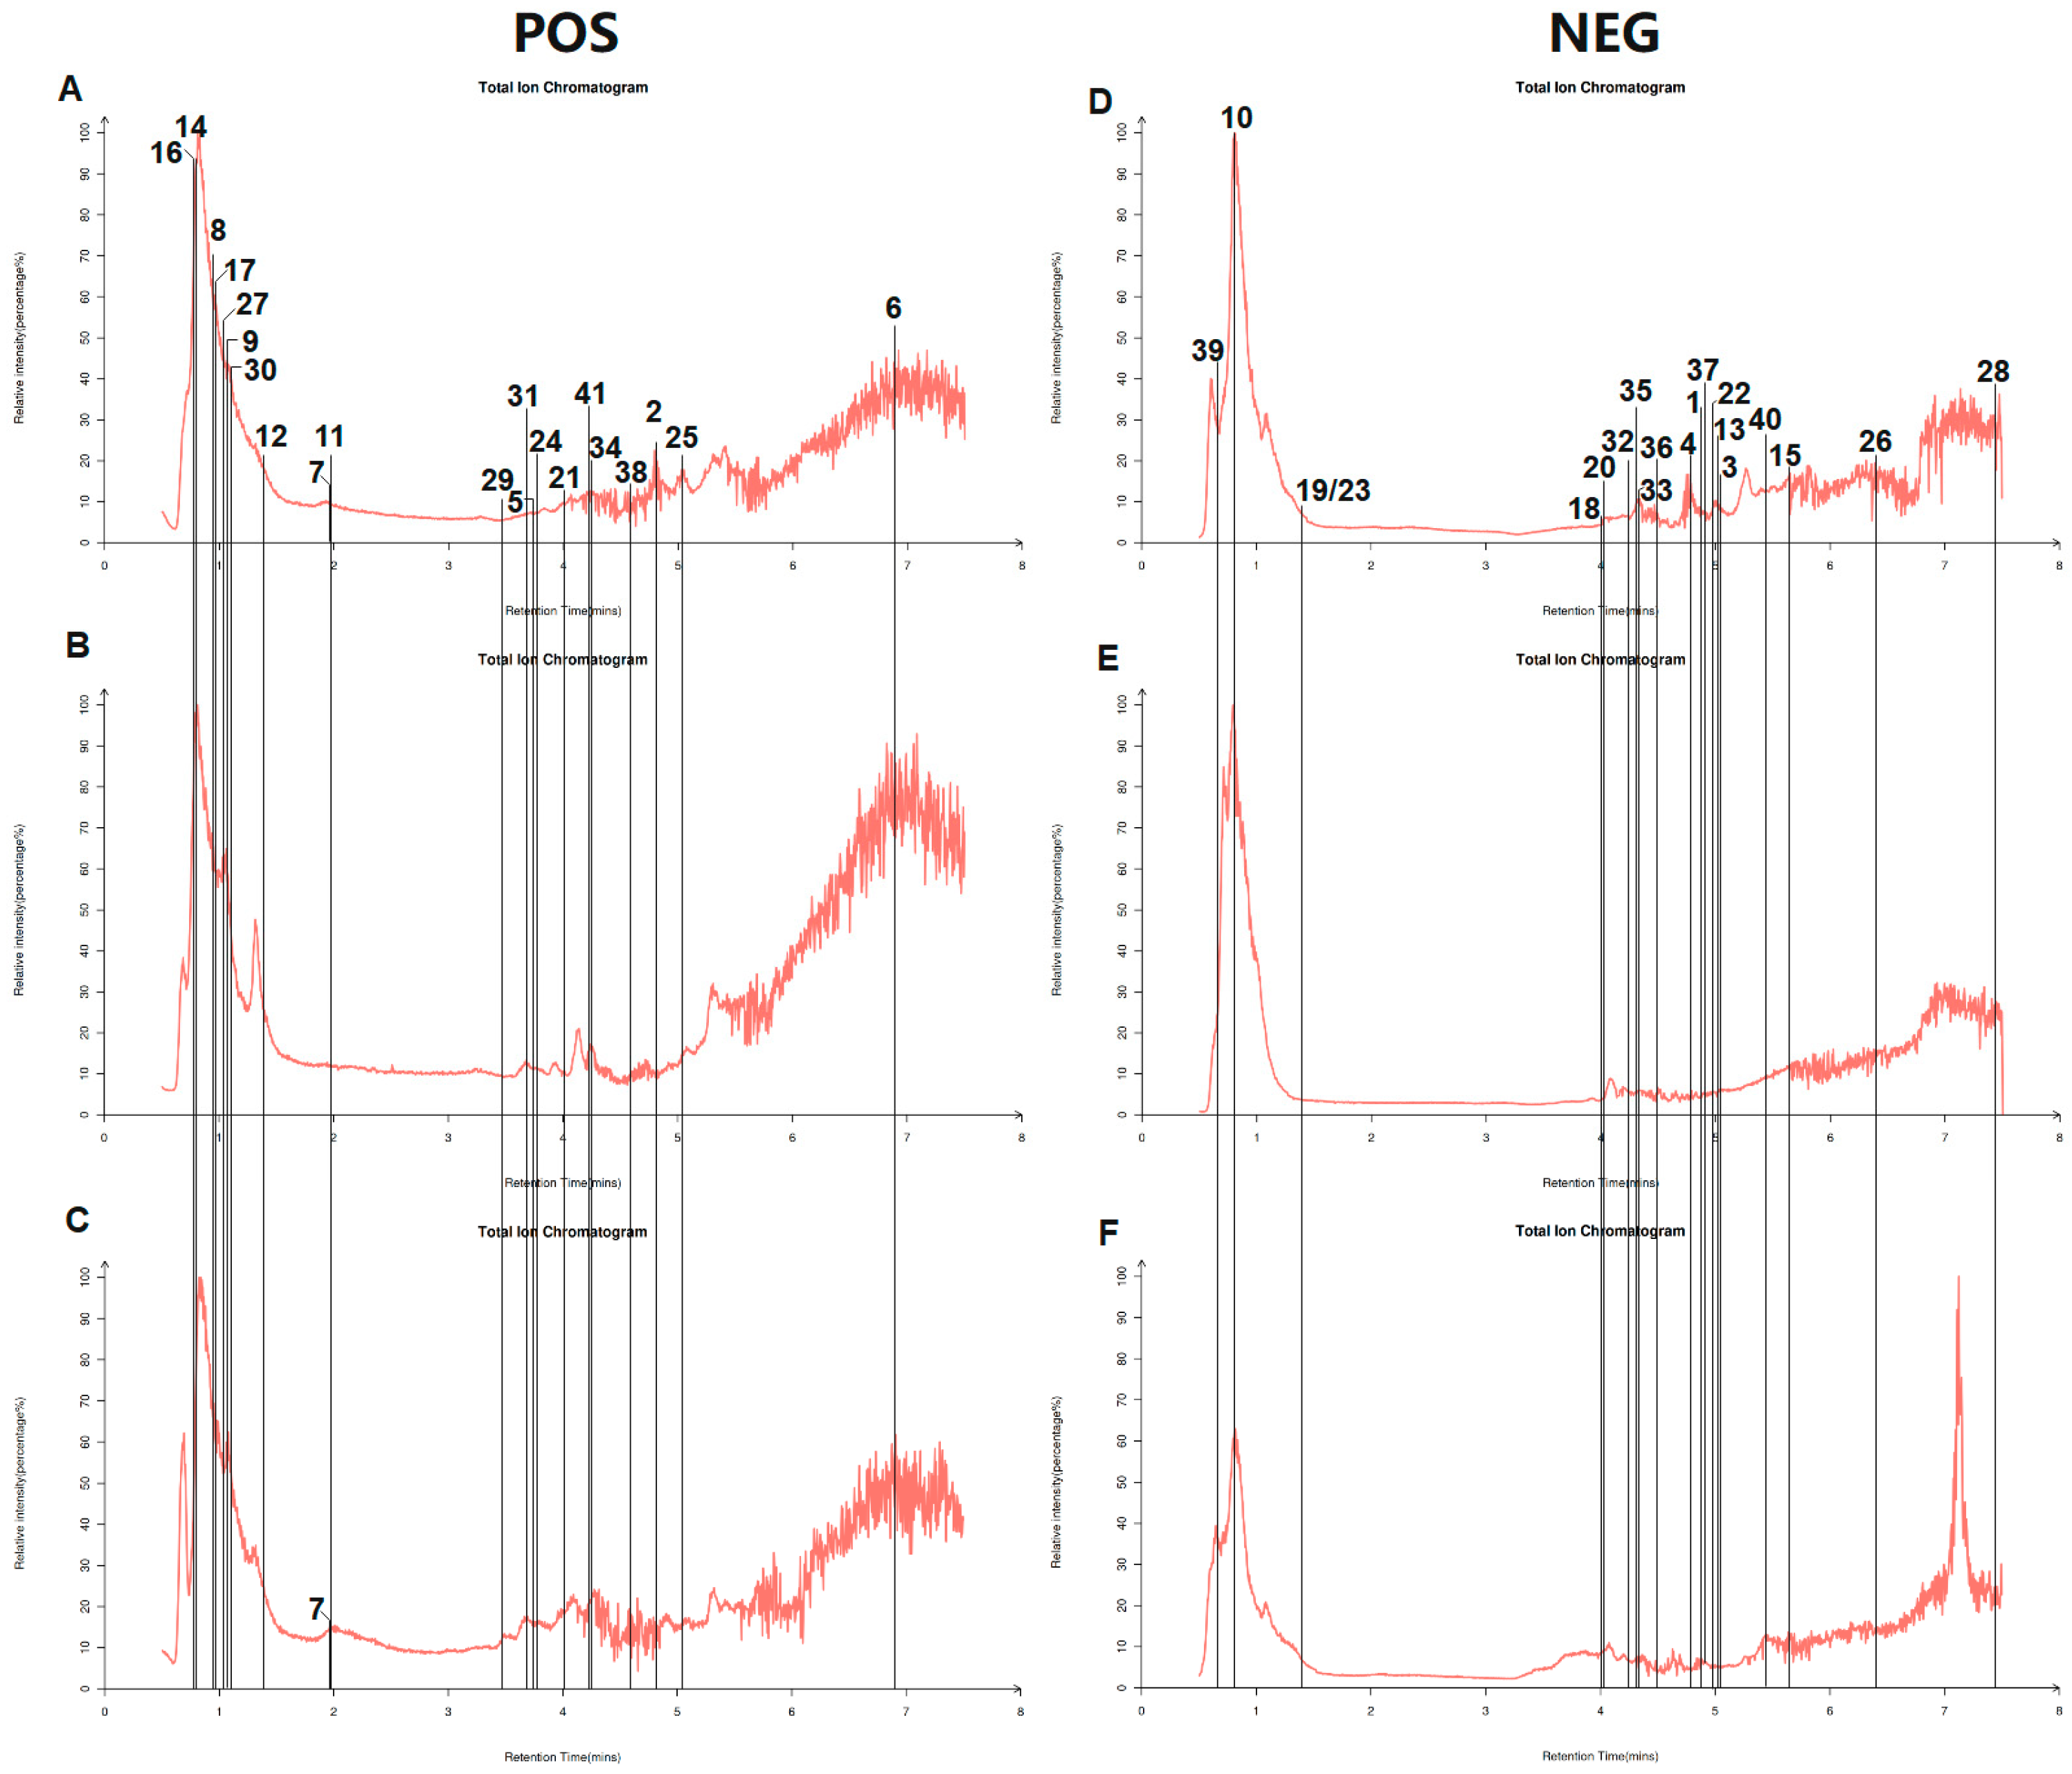
3.1. Analysis of AHT Active Ingredients

Firstly, the active ingredients of AHT were identified, and a total of 1539 metabolites were detected by LC-MS. These metabolites include a series of compounds such as flavonoids, polyphenols, terpenes, and alkaloids. Then, 1539 compounds were identified and analyzed through the TCMSP database. Setting oral bioavailability (OB) ≥ 30% and drug-like (DL) ≥ 0.18, 41 compounds were obtained, as shown in Table 1, including bioactive ingredients such as luteolin, quercetin, isorhamnetin, and kaempferol. Next, a qualitative analysis of AHT was conducted, summarizing the retention time, m/z, molecular formula, and error (ppm) of 41 compounds (Table 2). In addition, the total ion chromatogram (TIC) of AHT in positive and negative ion modes was labeled based on the retention time of the compounds (Figure 1).

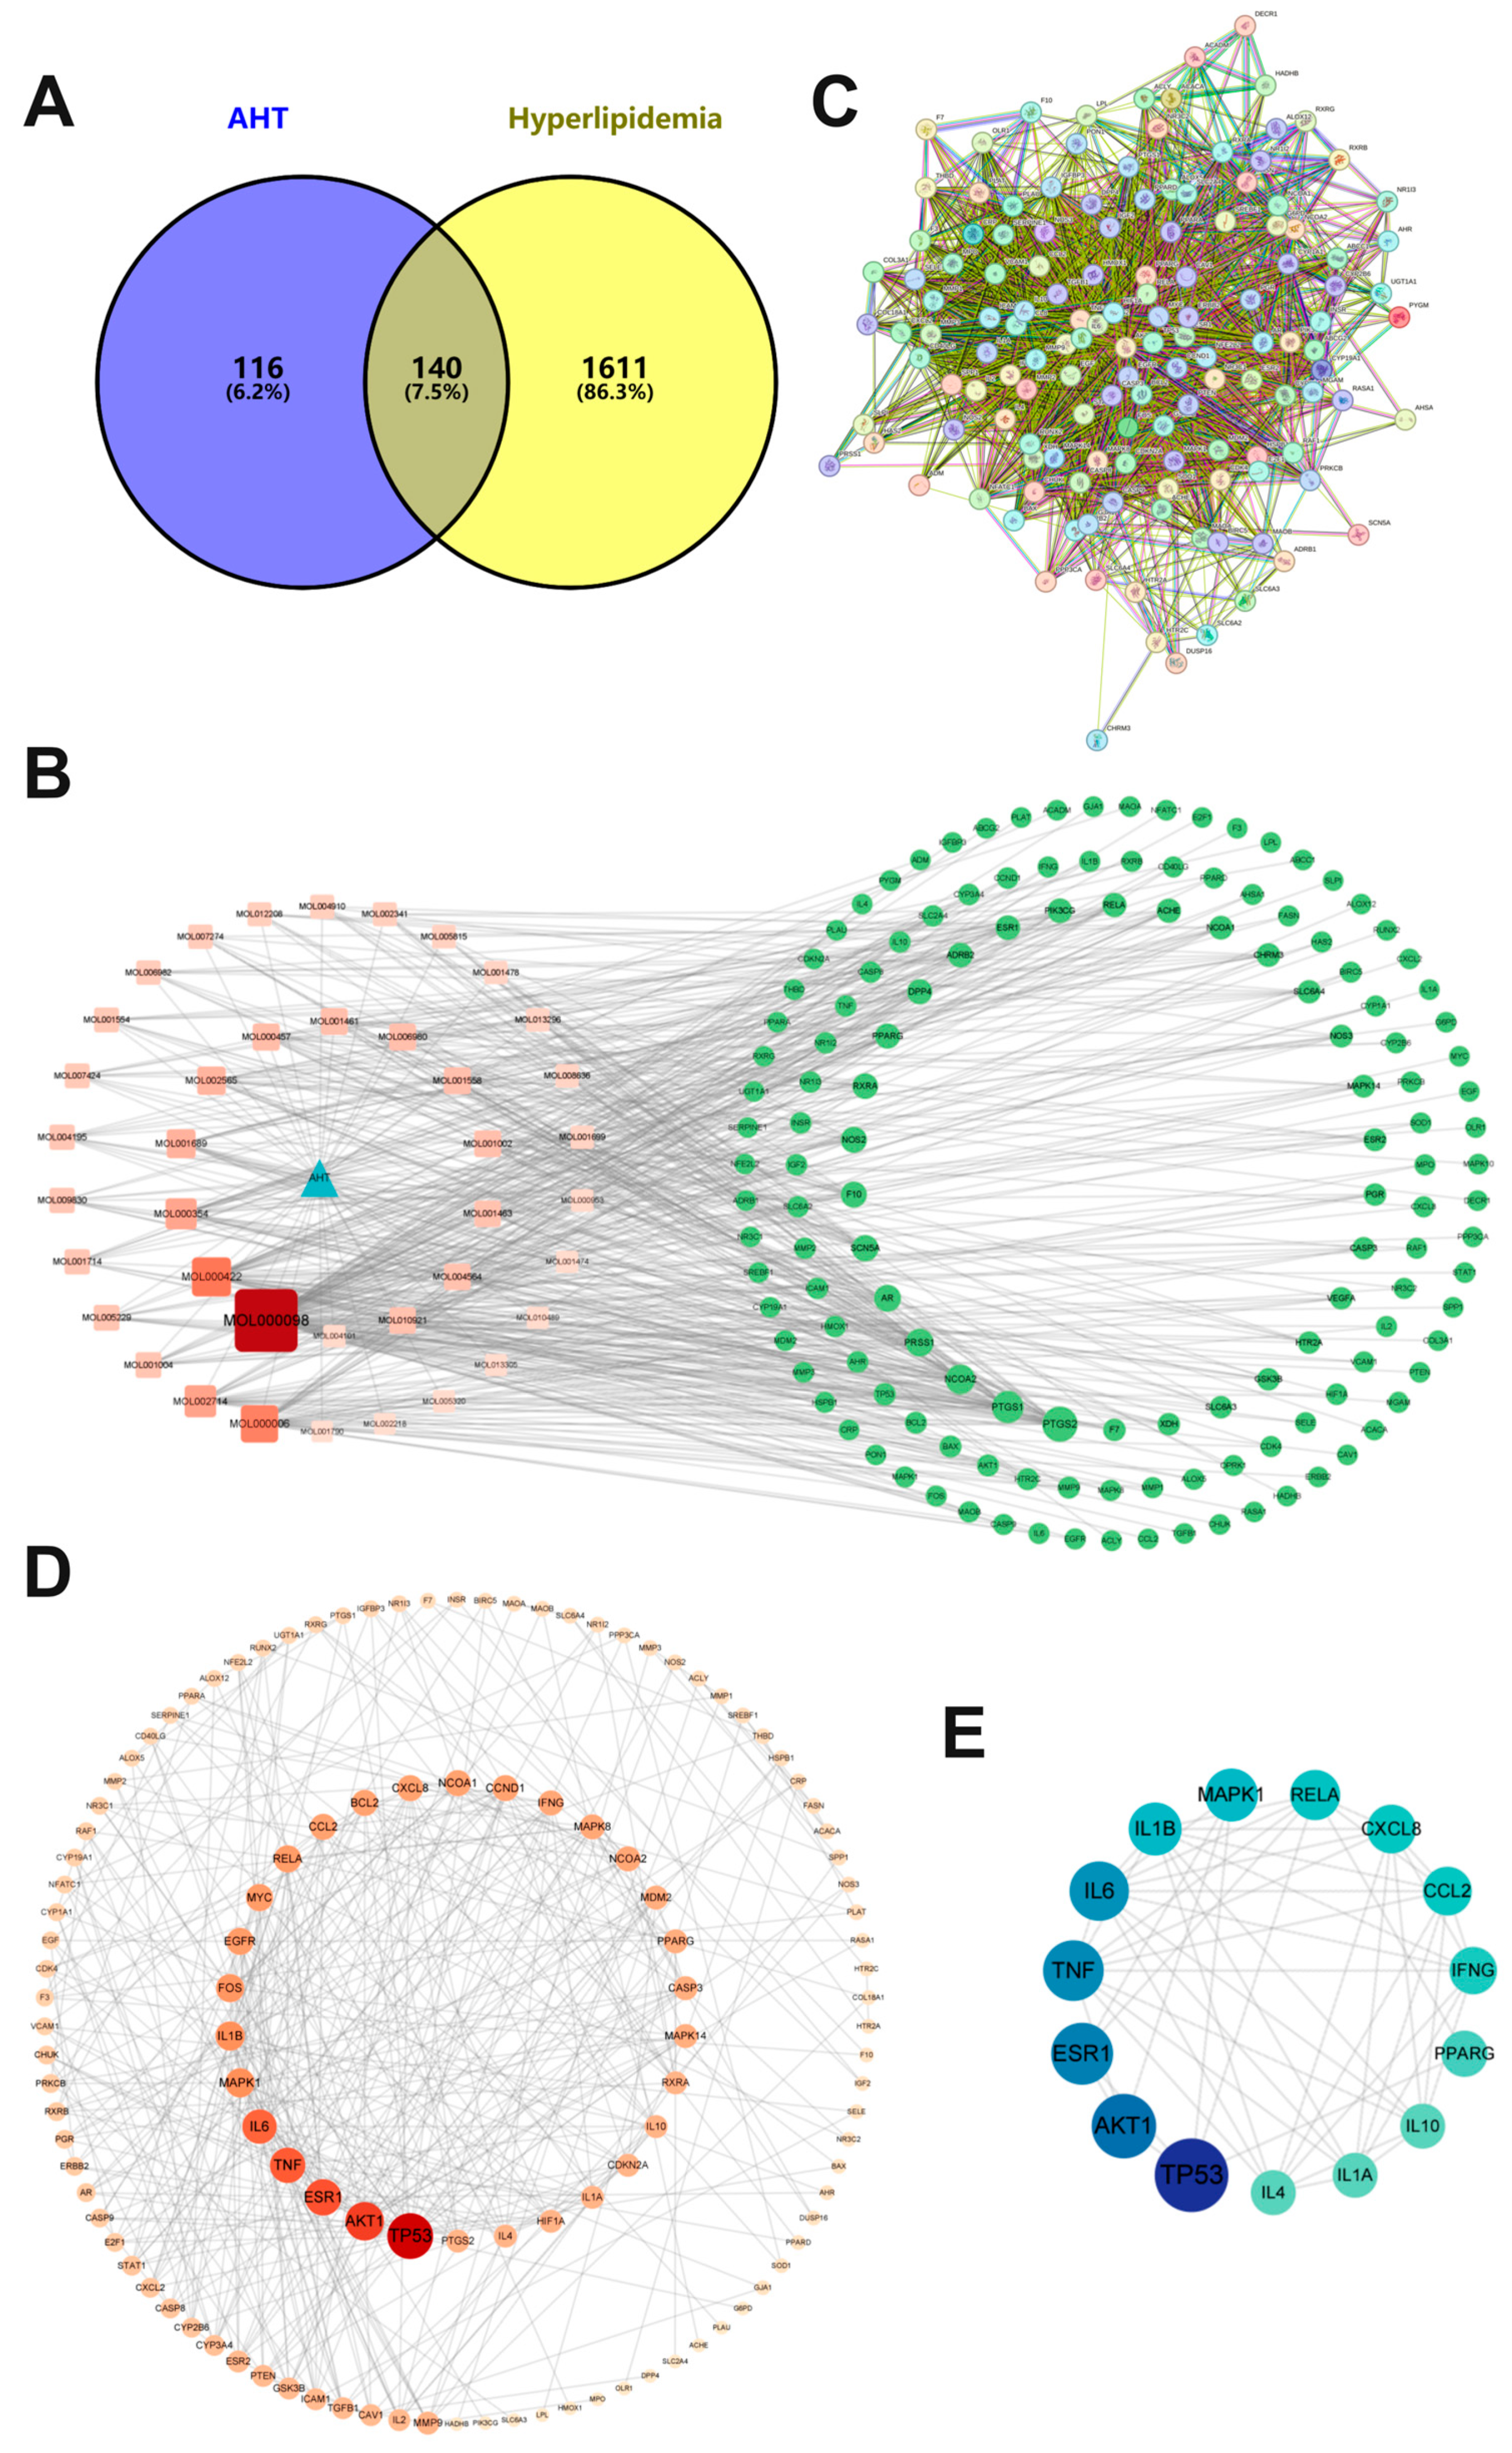
3.2. Potential Target Prediction of AHT and HLP

Firstly, the TCMSP database filtering criteria (OB ≥ 30%, DL ≥ 0.18) was set, a total of 256 potential targets of compounds in AHT were searched for, and all potential targets with the “Homo sapiens” species were standardized using the UniProt database to obtain Table S1. The potential targets related to hyperlipidemia were obtained from the Genecards database and Drugbank database. After eliminating duplicate targets, 1571 potential targets related to HLP were obtained (Table S2).

3.3. Target Network Construction for AHT and HLP

Firstly, the common targets of AHT and HLP were screened using Venny 2.1.0, resulting in 140 common targets (Figure 2A, Table S3). These targets are potential targets for AHT treatment of HLP. The above targets were imported into Cytoscape 3.9.1 software to construct a drug–target disease network. There are 181 nodes and 546 edges in Figure 2B, and the size of the nodes in the figure is related to the degree centralities (DCs) value. The 40 compounds of AHT are represented by red squares; green circles represent common targets; and blue triangles represent AHT. The results show that quercetin, kaempferol, luteolin, baicalein, isorhamnetin, acacetin, medicarpin, phaseollidin, papaverine, and dihydrochelerythrine ranked in the top ten in terms of DC values, suggesting that they are key compounds.

3.4. Construction of PPI Network

Common targets were imported into the STRING 11.0 database for PPI network analysis (Figure 2C). There were a total of 139 nodes and 395 edges, with an average node degree of 5.68. Import the cross targets obtained through STRING database analysis into Cytoscape 3.9.1 software to obtain the PPI network diagram for AHT treatment of HLP. As shown in Figure 2D, the larger the degree value, the darker the color and the larger the area of the gene target, indicating that the target has a more significant influence in the PPI network. In addition, the target’s BC, CC, DC, EC, LAC, and NC values were obtained through network topology analysis in Cytoscape 3.9.1 software. By screening and removing duplicate targets from the first six targets in each item, 15 key targets were obtained (Figure 2E and Table 3), namely TP53, PPARG, ESR1, TNF, CCL2, AKT1, RELA, MAPK1, IL6, CXCL8, IL1A, IL4, IL10, IL1B, and IFNG. We speculate that they may be key targets for treating HPL.

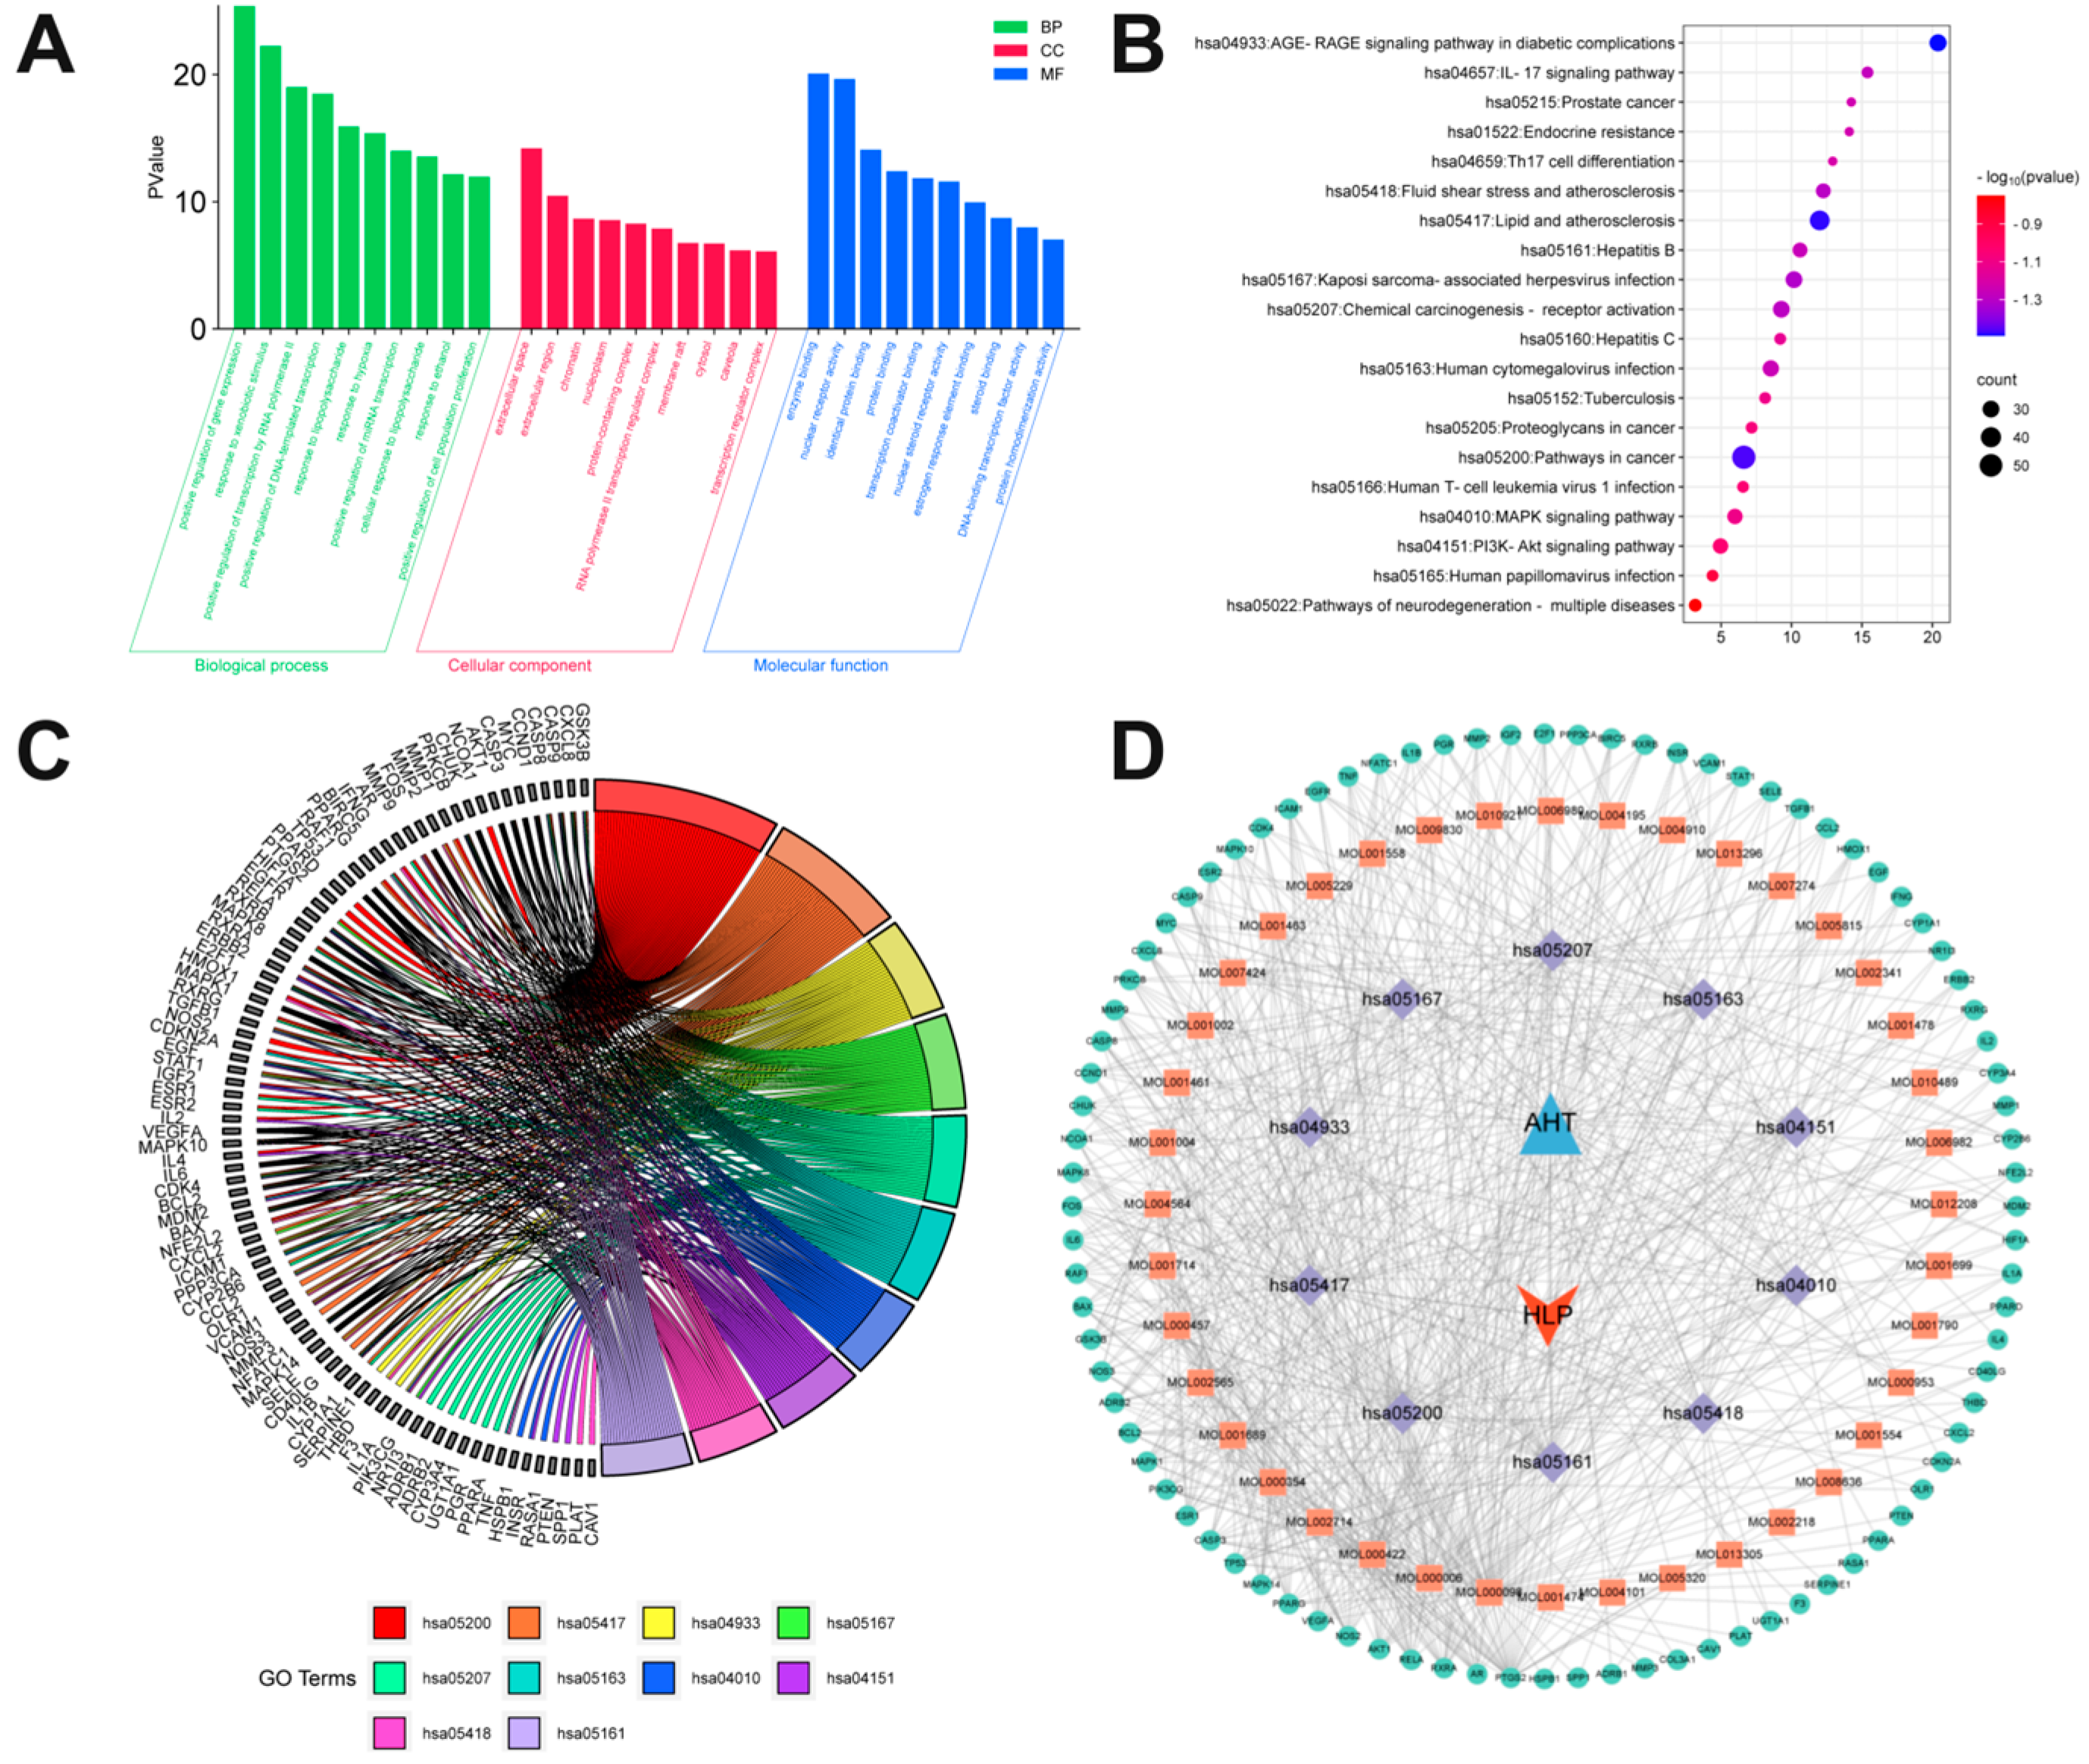
3.5. Enrichment Analysis of GO and KEGG Pathways

To explore the potential therapeutic mechanism of AHT for hyperlipidemia we imported the overlapping genes of AHT and HLP into the DAVID database for GO and KEGG pathway enrichment analysis. Firstly, visual analysis was conducted on biological progress (BP), cellular components (CC), and molecular functions (MF). the top 10 enriched GO terms were identified separately (p-Value < 0.05) and the key targets were analyzed (Figure 3A). The results show that in BP, the targets of AHT were associated with response to lipolysis (GO: 0032496) and cellular response to lipolysis (GO: 0071222). In MF, the target of AHT was associated with steroid binding (GO: 0005496). In CC, the targets of AHT were associated with membrane raft (GO: 0045121), protein-containing complex (GO: 0032991), and transcription regulator complex (GO: 0005667). The GO enrichment analysis results indicated that compounds in AHT can exert therapeutic effects on hyperlipidemia from lipopolysaccharides, inflammatory factors, and protein regulation. The false discovery rate (FDR) was used as the X-axis; the size of the dots represented the number of targets in different pathways, and dots of different colors represented the p-values of different pathways. The darker the red color, the higher the significance. As shown in Figure 3B, enrichment analysis was performed on the top 20 signaling pathways for AHT treatment of hyperlipidemia. It was found that AHT mainly occurs through lipids and atherosclerosis, the AGE–RAGE signaling pathway in diabetic complications, and the inflammatory pathway, MAPK signaling pathway, and PI3K-Akt signaling pathway play a role. Table 4 presents detailed information on the top 10 signaling pathways and their corresponding targets. Moreover, the target and signaling pathway were visualized in Figure 3C. The above 10 pathways connected with relevant key targets and compounds to form a compound–target–signaling pathway network. It included 140 nodes and 657 edges (Figure 3D). A significant correlation was indicated between key signaling pathways and the main compounds of AHT. The core compounds included quercetin (MOL000098, edge count = 67), luteolin (MOL000006, edge count = 31), kaempferol (MOL000422, edge count = 27), and baicalein (MOL002714, edge count = 18).

3.6. Determination of AHT Compounding Ratio

An orthogonal experiment was conducted to determine the optimal blending ratio of AME, HRE, and TME. According to the theoretical analysis of the k value, the optimal combination is A3H1T2, which meant the ratio of AME, HRE, and TME was 3:1:2. To verify this ratio, the pancreatic lipase inhibition rate was 97.74 ± 0.62% (Table 5).

3.7. Combination Index Analysis of AHT, AME, HRE, and TME

To further determine whether the combination of various extraction solutions has a synergistic effect, the dose–response relationship between each individual extraction solution and the combination group was studied, and the combination index (CI) value of each experimental group was calculated based on the principle of medium effect. The CI value of less than 1 indicated a synergistic effect between the components. As shown in Figure 4A, the CI values of all groups were less than 1, indicating that the combination of the three extracts showed sound synergistic effects. The CI value of AHT (A3H1T2) was significantly lower than that of the other groups (p < 0.05), indicating that AHT had the best synergistic effect. Figure 4B showed that the pancreatic lipase inhibition effect of AHT was superior to that of AME, HRE, and TME at various addition ratios. Figure 4C illustrates that when the synergistic effect reached 50%, the drug activity size was AHT > HRE > TME > AME. The above results indicated that the in vitro lipid-lowering effect of AHT was due to the combination of a single extract and other ratios.

3.8. The Effects of AHT, AME, HRE, and TME on HepG2 Cell Proliferation and Oleic Acid Staining

To verify the lipid-lowering effect of AHT, we chose to establish a high-fat blood model using HepG2 cells. Before establishing the model, the cytotoxicity of AME, HRE, and TME were first detected by MTT assay. As shown in Figure 5A, AME and HRE had a promoting effect on cell proliferation at concentrations of 200 μM and 100 μM, while TME had a significant promoting effect at concentrations of 50 μM and 100 μM (p > 0.05). TME at a concentration of 100 μM was selected for the next experiment. When the dosage continued to increase, the activity of cells was inhibited. Next, the optimal concentrations of AME, HRE, and TME were compounded in a ratio of 3:1:2 to obtain the compound extract AHT. The lipid-lowering effect of AHT was verified. HepG2 cells were induced to produce lipid droplets using 0.5 mM OA, and the lipid droplets inside the cells were observed by staining with Oil Red O. Figure 5B showed that no obvious lipid droplet staining was observed in the NC group, and the cell morphology was good. Red lipid droplets were clearly observed within the OA group cells, covering the entire cell periphery. After adding AHT, AME, HRE, and TME, a decrease in intercellular lipid droplets was observed. The results showed that AHT, AME, HRE, and TME could alleviate lipid deposition in HepG2 cells to varying degrees.

3.9. The Lipid-Lowering Effect of AHT on Oleic Acid-Induced HepG2 Cells

The HepG2 cell model induced by oleic acid (OA) had been widely used for in vitro studies of hyperlipidemia (Figure 6). Compared with the NC group, HepG2 cells induced by OA showed significantly increased levels of TC, TG, and LDL-C (p < 0.01) and significantly decreased levels of HDL-C (p < 0.01). After administration, compared with the OA group, the levels of AHT, AME, HRE, and TME decreased by 31.53%, 21.04%, 22.95%, and 24.88% (p < 0.01) in TC, 30.37%, 14.84%, 14.50%, and 18.84% (p < 0.01) in TG, 25.93%, 20.74%, 19.26%, and 23.70% (p < 0.01) in LDL-C, and 90.10%, 63.37%, 67.33%, and 72.28% (p < 0.01) in HDL-C, respectively. It indicated that AHT, AME, HRE, and TME all have good lipid-lowering effects, and the lipid-lowering performance of AHT after compounding has been further improved.

3.10. The Effect of AHT on the Lipid-Lowering Mechanism Induced by Oleic Acid in HepG2 Cells

Based on the prediction of lipid-lowering-related proteins by network pharmacology, we treated HepG2 cells induced by oleic acid with AHT, AME, HRE, and TME and verified the effects of the MAPK signaling pathway and the PI3K-Akt signaling pathway on the lipid-lowering mechanism of HepG2 cells (Figure 7A). As shown in Figure 7B,C, the protein expression of AKT, phosphorylated AKT (p-AKT), PI3K, and phosphorylated PI3K (p-PI3K) were validated and the relevant protein ratios were calculated. It was found that the protein expression levels of p-AKT/AKT and p-PI3K/PI3K in HepG2 cells induced by oleic acid were significantly reduced after treatment with AHT, AME, HRE, and TME (p < 0.05). AHT significantly reduced the phosphorylation of AKT and PI3K in HepG2 cells (p < 0.01). As shown in Figure 7D,E, AHT significantly increased the protein expression levels of AMPKα1, phosphorylated AMPKα1, and SIRT1 (p < 0.05). The above results indicated that AHT could regulate lipid function and improve lipid metabolism balance through the MAPK signaling pathway and the PI3K-Akt signaling pathway.

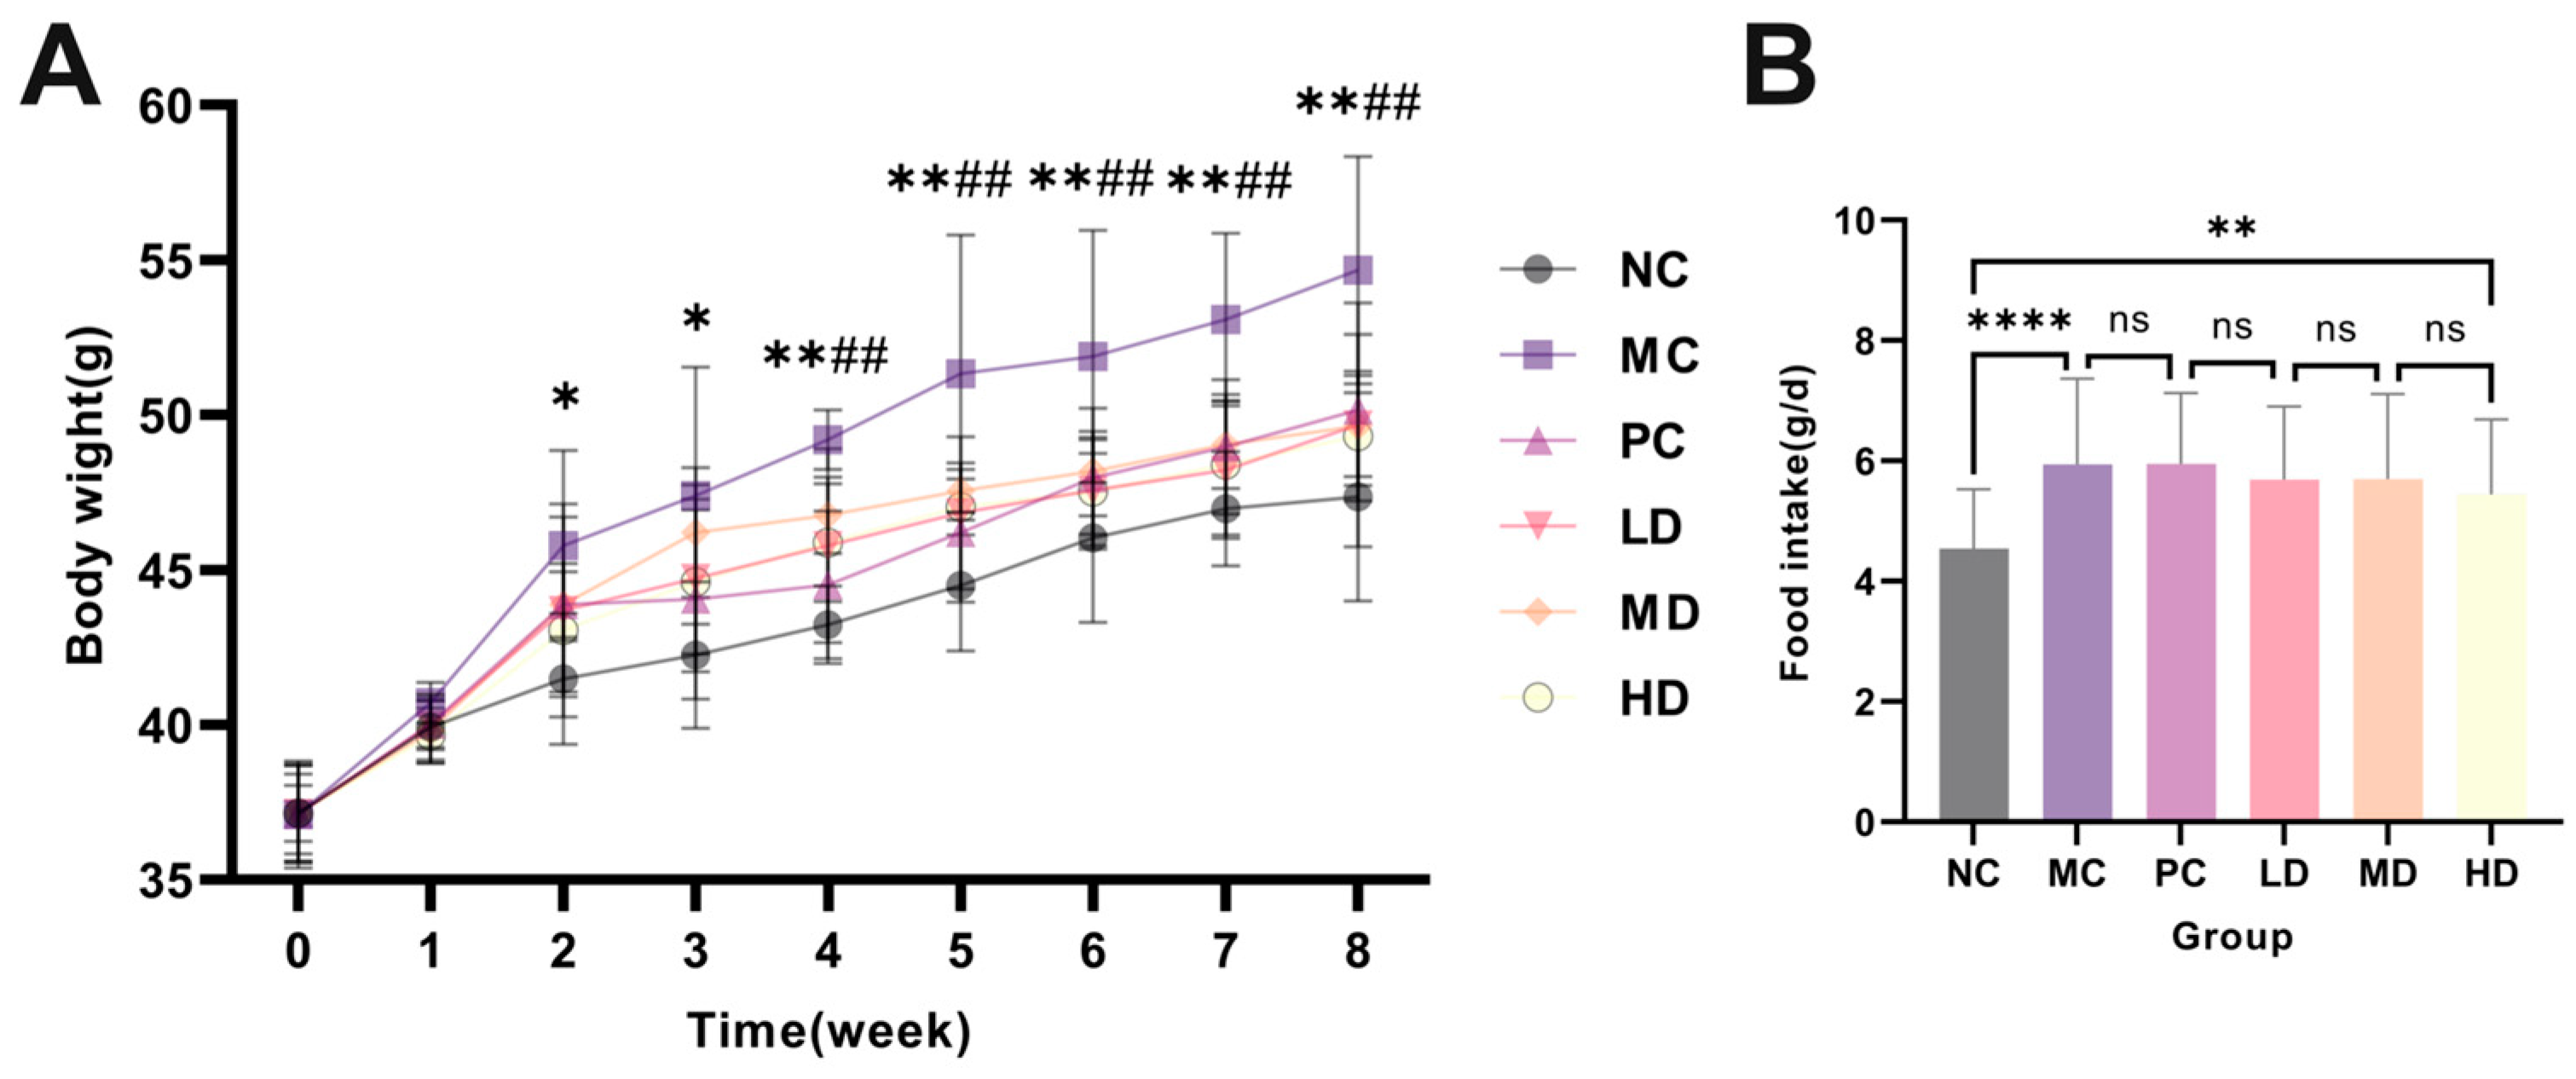
3.11. The Effect of AHT on Body Weight, Food Intake, and Organ Index in Mice

As shown in Figure 8A, there was no significant difference in the initial body weight of mice at 0 w (p > 0.05). With the prolongation of time, at 2 w, the weight of the MC group fed with a high-fat diet was significantly higher than that of the NC group fed with a normal diet (p < 0.05). At 4 w, the weight of the MC group was significantly higher than that of the HD group (p < 0.01). However, as shown in Figure 8B, there was no significant difference in food intake among the groups fed a high-fat diet (p > 0.05). It indicated that a high-fat diet could lead to weight gain in mice, and when AHT was supplemented, it prevented weight gain induced by a high-fat diet. But there was no significant difference in organ index, indicating that AHT had no adverse effects on mice (p > 0.05) (Table 6).

3.12. The Effect of AHT on Serum Biochemical Indicators in High-Fat Mice

Blood lipids, liver damage, and antioxidant levels in mouse serum were measured. As shown in Figure 9A–D, compared with the NC group, the levels of TC, TG, and LDL-C were significantly increased in the MC group, while the level of HDL-C was significantly decreased. The LD group, MD group, and HD group all showed varying degrees of improvement, with TC, TG, and LDL-C levels in the HD group decreasing by 29.01%, 42.98%, and 55.01%, respectively, compared to the MC group (p < 0.01), while HDL-C levels increased significantly by 165.85% (p < 0.0001). AST and ALT are considered indicators for detecting liver injury and can verify the damage of hyperlipidemia to the liver of mice. As shown in Figure 9E,F, the AST and ALT levels in the HD group decreased by 49.19% and 45.23%, respectively, compared to the MC group and returned to normal levels. Dysregulation of lipid metabolism could lead to the production of large amounts of reactive oxygen species in the body, causing oxidative stress. Therefore, we validated the antioxidant level and found that the antioxidant capacity of the MC group significantly decreased, while the SOD and T-AOC levels of the HD group significantly increased by 18.99% and 44.20%, respectively, compared to the MC group (p < 0.01) (Figure 9G,H).

4. Discussion

Long-term high-fat diets will lead to a disorder of lipid metabolism and increase the risk of chronic diseases such as obesity, hyperlipidemia, and diabetes [33]. Hyperlipidemia is a complex disease; the traditional intervention method is taking statins. However, these drugs usually have a single site of action, and long-term use can cause some toxic side effects. Previous studies have found that disturbances in liver lipid metabolism, oxidative stress, and chronic inflammation in the body often accompany the occurrence of hyperlipidemia [34]. Therefore, using natural plant ingredients with multi-target, multi-pathway, natural, safe, and efficient characteristics to prevent or intervene in lipid metabolism disorders has attracted widespread attention from researchers [35]. Astragalus membranaceus, Hippophae rhamnoides L., and Taraxacum mongolicum Hand. Mazz are traditional edible and medicinal plants with a long history of consumption. They have been widely reported to have various bioactive functions, such as lowering blood lipids, antioxidation, and immune regulation [36,37,38]. Therefore, this study aimed to explore the lipid-lowering effects, targets, and mechanisms of the combined application of Astragalus membranaceus extract, Hippophae rhamnoides extract, and dandelion extract.
We first identified the main compounds in Astragalus membranaceus extract, Hippophae rhamnoides L. extract, and Taraxacum mongolicum Hand. Mazz extract using LC-MS and identified 1539 compounds. Research has confirmed that compound plants have better regulatory effects on lipid metabolism/diseases than single plants. Previous studies have shown that AME, HRE, and TME all have lipid-lowering activity, but their potential mechanisms for preventing hyperlipidemia have yet to be fully explored. Further research is needed to verify their mechanisms of action, such as key compounds, targets, and mechanisms. Therefore, network pharmacology was used to predict the targets and signaling pathways of the combined intervention of AME, HRE, and TME in hyperlipidemia. A total of 41 compounds and 140 potential targets for treating hyperlipidemia were detected. Fifteen core targets, including TP53, PPARG, ESR1, AKT1, RELA, and MAPK1, were identified through PPI analysis. Key compounds such as quercetin, luteolin, kaempferol, and baicalein were identified through compound target pathway analysis. These key compounds and core targets may be key factors in treating hyperlipidemia. Research has shown that the main component of the polyphenol-rich extract from Allium cepa and Gynostemma pentaphyllum is quercetin, demonstrating that quercetin can achieve therapeutic effects on hyperlipidemia through LOX1-PI3K AKT eNOS [39,40]. In addition, Astragalus membranaceus can regulate lipid metabolism by downregulating AKT1 and upregulating ESR1 [41]. These results are similar to our research findings [42]. The results of KEGG enrichment analysis indicate that AHT may regulate hyperlipidemia through lipids and atherosclerosis, MAPK signaling pathway, and PI3K-Akt signaling pathway.
To verify the predictive results of network pharmacology, AME, HRE, and TME were combined to obtain AHT. The lipid-lowering ability, antioxidant capacity, and mechanism of action of AHT were validated by establishing oleic acid-induced HepG2 cell models and high-fat diet-induced hyperlipidemia mouse models. The results showed that AHT can regulate lipid function, alleviate oxidative stress, and have an excellent lipid-lowering effect through the MAPK and PI3K-Akt signaling pathways. Research shows that the PI3K-Akt signaling pathway can participate in atherosclerosis activity and improve glucose and lipid metabolism in mice [43,44]. In this study, AHT can regulate the PI3K-Akt signaling pathway and activate the expression of SIRT1 protein. SIRT1, as a dependent acylase, is involved in lipid metabolism disorders such as hyperlipidemia, which reduces the protein expression level of SITR1 [45]. The SIRT1/AMPK pathway can regulate lipid content, increase mitochondrial fatty acid oxidation, and promote lipid breakdown and energy metabolism. In Zheng et al.’s study [46], SDF-PPs effectively reversed the decrease in p-AMPK/AMPK and inhibited the activity of acetyl CoA carboxylase 1 (ACC1). Our research also found that AMPK phosphorylation was enhanced in HepG2 cells treated with AHT. Previous reports have shown that α-ketoglutarate (AKG) activates AMPK protein in liver cells in dyslipidemia, enhancing its phosphorylation. After AMPK phosphorylation enhancement, it can inhibit the increase in TC and TG and oxidative stress induced by palmitic acid in HepG2 cells [47]. Our results also found a significant decrease in TC, TG, and LDL-C levels in cells after AHT intervention, as well as a significant increase in HDL-C levels. It indicates that AHT regulates the lipid breakdown ability in liver cells by activating the MAPK and PI3K-Akt signaling pathways, inhibiting TC and TG accumulation in HepG2 cells and mice. The above results indicate that AHT can enhance the regulatory ability of liver cells toward lipid metabolism and their resistance to oxidative stress. To further evaluate the lipid-lowering effect of AHT, we established a high-fat mouse model using a high-fat diet. After 8 weeks of AHT intervention, we found that the levels of TC, TG, and LDL-C in the HD group were significantly reduced, HDL-C levels were significantly increased, AST and ALT activities were decreased, and SOD and T-AOC levels were increased [7,48,49]. These results indicate that AHT can improve lipid metabolism disorders in high-fat mice by increasing the body’s antioxidant levels and reducing liver damage. In summary, we validated the targets and pathways predicted by network pharmacology through cell and animal experiments. We found that AHT can improve hyperlipidemia and regulate lipid metabolism by regulating the MAPK and PI3K-Akt signaling pathways.

5. Conclusions

In this work, network pharmacology was used to predict and analyze the potential mechanisms of bioactive compounds in AME, HRE, and TME for treating hyperlipidemia, and the lipid-lowering mechanism of AHT was explored through in vitro and in vivo experiments. The research results indicate that compounds in AHT, such as quercetin, luteolin, kaempferol, and baicalein, might affect hyperlipidemia by targeting core targets such as TP53, PPARG, ESR1, AKT1, RELA, MAPK1, as well as by acting on the PI3K-Akt and MAPK signaling pathways. In vitro and in vivo experiments showed that AHT could reduce TC, TG, and LDL-C levels, increase HDL-C levels, reduce liver injury, and enhance the body’s antioxidant capacity. Most importantly, AHT could improve hyperlipidemia by affecting the expression of proteins related to the PI3K-Akt and MAPK signaling pathways. In summary, these findings provide a new strategy for AHT to serve as a safe and efficient resource for improving lipid metabolism disorders such as hyperlipidemia.

Supplementary Materials

The following supporting information can be downloaded at: https://www.mdpi.com/article/10.3390/foods13172795/s1, Table S1: Drug targets, Table S2: Target of hyperlipidemia, Table S3: Targets of drugs and diseases.

Author Contributions

Investigation, J.L.; formal analysis, Y.A. and Z.C.; conceptualization, Y.B.; methodology, X.Y. and M.J.; writing—original draft, X.Y. and M.J.; writing—review and editing, X.Y. and M.J.; resources, Y.B.; funding acquisition, Y.B. All authors have read and agreed to the published version of the manuscript.

Funding

This research was funded by Heilongjiang Province Key Research and Development Project (JD2023SJ08), National Key Research and Development Program Project (2022YFD1600500), Heilongjiang Province Discipline Collaborative Innovation Project (Zxkxt220100002).

Institutional Review Board Statement

The animal research protocol has been approved by the Science and Technology Ethics Committee of Northeast Forestry University (NEFU2024-011) for research involving animals.

Informed Consent Statement

Not applicable.

Data Availability Statement

The original contributions presented in the study are included in the article and Supplementary Materials, further inquiries can be directed to the corresponding author.

Conflicts of Interest

The authors declare no conflicts of interest.

List of Abbreviations

ALTAlanine aminotransferase
ASTAspartate aminotransferase
AMEAstragalus membranaceus extract
AHTAstragalus membranaceus extract: Hippophae rhamnoides L. extract: Taraxacum mongolicum Hand. Mazz extract = 3:1:2
HDL-CHigh-density lipoprotein cholesterol
HREHippophae rhamnoides L. extract
LC-MSLiquid chromatography–mass spectrometry
LDL-CLow-density lipoprotein cholesterol
OMIMOnline Mendelian Inheritance in Man
PPIProtein–protein interaction
SODSuperoxide dismutase
TMETaraxacum mongolicum Hand. Mazz extract
TCMSPTraditional Chinese Medicine System Pharmacology Analysis Platform
T-AOCTotal antioxidant capacity
TCTotal cholesterol
TGTriglycerides

References

  1. Zhou, H.; Wang, X.; She, Z.; Huang, L.; Wei, H.; Yang, S.; Wei, Z.; Chen, H.; Yang, B.; Hu, Z.; et al. Combining bioinformatics and multiomics strategies to investigate the key microbiota and active components of Liupao tea ameliorating hyperlipidemia. J. Ethnopharmacol. 2024, 333, 118438. [Google Scholar] [CrossRef]
  2. Edward, O.C.; Jeong, D.-Y.; Yang, H.-J.; Han, A.; Cha, Y.-S. Doenjang Ameliorates Diet-Induced Hyperlipidemia and Hepatic Oxidative Damage by Improving Lipid Metabolism, Oxidative Stress, and Inflammation in ICR Mice. Foods 2024, 13, 1471. [Google Scholar] [CrossRef]
  3. Liu, Y.; Sun, Z.; Dong, R.; Liu, P.; Zhang, X.; Li, Y.; Lai, X.; Cheong, H.-F.; Wu, Y.; Wang, Y.; et al. Rutin ameliorated lipid metabolism dysfunction of diabetic NAFLD via AMPK/SREBP1 pathway. Phytomedicine 2024, 126, 155437. [Google Scholar] [CrossRef]
  4. Xie, J.; Luo, M.; Chen, Q.; Zhang, Q.; Qin, L.; Wang, Y.; Zhao, Y.; He, Y. Hypolipidemic effect and gut microbiota regulation of Gypenoside aglycones in rats fed a high-fat diet. J. Ethnopharmacol. 2024, 328, 118066. [Google Scholar] [CrossRef]
  5. Ma, M.; Gu, F.; Yue, Z.; Gao, L.; Chen, C.; Lin, Q.; Huang, K.; Li, X.; Dai, J.; Han, B. Dendrobium huoshanense Improves Lipid Metabolism Disorder by Restoring Gut Flora and Metabolites in Mice Fed a High-Fat Diet. J. Food Biochem. 2024, 2024, 6245499. [Google Scholar] [CrossRef]
  6. Liu, J.; Zhang, H.; Ji, B.; Cai, S.; Wang, R.; Zhou, F.; Yang, J.; Liu, H. A diet formula of Puerariae radix, Lycium barbarum, Crataegus pinnatifida, and Polygonati rhizoma alleviates insulin resistance and hepatic steatosis in CD-1 mice and HepG2 cells. Food Funct. 2014, 5, 1038–1049. [Google Scholar] [CrossRef]
  7. Cristina, R.T.; Mohamed, E.A.; Tulcan, C.; Dumitrescu, E.; Muselin, F.; Orasan, S.A.; Mateoc-Sirb, T.; Vlad, D. The Oxidative Stress Markers’ Protective Influence of Sea Buckthorn and Grape Extracts in Atorvastatin-Treated Hyperlipidemic Rats. Nutrients 2024, 16, 1954. [Google Scholar] [CrossRef]
  8. Tian, B.; Pan, Y.; Zhou, X.; Jiang, Y.; Zhang, X.; Luo, X.; Yang, K. Yellow leaf green tea modulates the AMPK/ACC/SREBP1c signaling pathway and gut microbiota in high-fat diet-induced mice to alleviate obesity. J. Sci. Food Agric. 2024, 104, 5882–5895. [Google Scholar] [CrossRef]
  9. Yang, X.; Chi, C.; Li, W.; Zhang, Y.; Yang, S.; Xu, R.; Liu, R. Metabolomics and lipidomics combined with serum pharmacochemistry uncover the potential mechanism of Huang-Lian-Jie-Du decoction alleviates atherosclerosis in ApoE−/− mice. J. Ethnopharmacol. 2024, 324, 117748. [Google Scholar] [CrossRef]
  10. Xiao, P.-T.; Liu, S.-Y.; Kuang, Y.-J.; Jiang, Z.-M.; Lin, Y.; Xie, Z.-S.; Liu, E.-H. Network pharmacology analysis and experimental validation to explore the mechanism of sea buckthorn flavonoids on hyperlipidemia. J. Ethnopharmacol. 2021, 264, 113380. [Google Scholar] [CrossRef]
  11. Zheng, N.; Wang, H.; Zhu, W.; Li, Y.; Li, H. Astragalus polysaccharide attenuates nonalcoholic fatty liver disease through THDCA in high-fat diet-fed mice. J. Ethnopharmacol. 2024, 320, 117401. [Google Scholar] [CrossRef]
  12. Zhou, X.; Ge, B.; Zhang, X.; Wang, K.; Zhou, C.; Fu, D. Metabolomics Analysis Reveals the Effects of Compound Fuzhuan Brick Tea (CFBT) on Regulating Dyslipidemia and Metabolic Disorders in Mice Induced by High-Fat Diet. Nutrients 2022, 14, 1128. [Google Scholar] [CrossRef]
  13. Azman, A.N.S.S.; Tan, J.J.; Abdullah, M.N.H.; Bahari, H.; Lim, V.; Yong, Y.K. Network Pharmacology and Molecular Docking Analysis of Active Compounds in Tualang Honey against Atherosclerosis. Foods 2023, 12, 1779. [Google Scholar] [CrossRef]
  14. Want, E.J.; Masson, P.; Michopoulos, F.; Wilson, I.D.; Theodoridis, G.; Plumb, R.S.; Shockcor, J.; Loftus, N.; Holmes, E.; Nicholson, J.K. Global metabolic profiling of animal and human tissues via UPLC-MS. Nat. Protoc. 2013, 8, 17–32. [Google Scholar] [CrossRef]
  15. Zelena, E.; Dunn, W.B.; Broadhurst, D.; Francis-McIntyre, S.; Carroll, K.M.; Begley, P.; O’Hagan, S.; Knowles, J.D.; Halsall, A.; Wilson, I.D.; et al. Development of a Robust and Repeatable UPLC-MS Method for the Long-Term Metabolomic Study of Human Serum. Anal. Chem. 2009, 81, 1357–1364. [Google Scholar] [CrossRef]
  16. Wu, B.; Li, C.; Kan, H.; Zhang, Y.; Rao, X.; Liu, Y.; Zhao, P. Hypolipidemic and Antithrombotic Effect of 6′-O-Caffeoylarbutin from Vaccinium dunalianum Based on Zebrafish Model, Network Pharmacology, and Molecular Docking. Molecules 2024, 29, 780. [Google Scholar] [CrossRef]
  17. Yi, M.; Zhang, Y.; Zhang, L.; Li, Y.; Zhang, H.; Jin, Q.; Wu, G.; Wang, X. Screening of fish oil fatty acids for antihyperlipidemic activity based on network pharmacology and validation of synergistic efficacy in vitro. Food Biosci. 2024, 58, 103745. [Google Scholar] [CrossRef]
  18. Zhao, L.; Wang, S.; Xu, X.; Guo, W.; Yang, J.; Liu, Y.; Xie, S.; Piao, G.; Xu, T.; Wang, Y.; et al. Integrated metabolomics and network pharmacology to reveal the lipid-lowering mechanisms of Qizha Shuangye granules in hyperlipidemic rats. J. Sci. Food Agric. 2024, 104, 3265–3274. [Google Scholar] [CrossRef]
  19. Wu, X.; Pan, J.; Yu, J.J.J.; Kang, J.; Hou, S.; Cheng, M.; Xu, L.; Gong, L.; Li, Y. DiDang decoction improves mitochondrial function and lipid metabolism via the HIF-1 signaling pathway to treat atherosclerosis and hyperlipidemia. J. Ethnopharmacol. 2023, 308, 116289. [Google Scholar] [CrossRef] [PubMed]
  20. Chen, D.; Chen, X.; He, C.; Xiao, C.; Chen, Z.; Chen, Q.; Chen, J.; Bo, H. Sanhuang xiexin decoction synergizes insulin/PI3K-Akt/FoxO signaling pathway to inhibit hepatic glucose production and alleviate T2DM. J. Ethnopharmacol. 2023, 306, 116162. [Google Scholar] [CrossRef]
  21. Jia, M.J.; Yang, X.; Bao, Y.H.; Huo, J.W. Anti-osteoporosis effect of Mori Follum-Portulaca oleracea L.-Lycium barbarum L. extract based on network pharmacology and experimental validation and its utilization in functional yogurt. Food Biosci. 2024, 59, 103974. [Google Scholar] [CrossRef]
  22. Zhang, F.; Li, Y.; Xin, W.; Wang, L.; Zhang, Y.; Xu, H.; Wang, H.; Zhao, H.; Yang, H.; Si, N.; et al. Gypenosides and capsaicinoids in combination ameliorates high-fat-diet-induced rat hyperlipidemia via the PPARγ-LXRa-ABCA1/ABCG1 pathway. J. Funct. Foods 2023, 108, 105714. [Google Scholar] [CrossRef]
  23. Chen, J.; Wu, X.; Zhou, Y.; He, J. Camellia nitidissima Chi leaf as pancreatic lipasen inhibitors: Inhibition potentials and mechanism. J. Food Biochem. 2021, 45, e13837. [Google Scholar] [CrossRef]
  24. Sharma, N.; Sharma, V.K.; Seo, S.Y. Screening of some medicinal plants for anti-lipase activity. J. Ethnopharmacol. 2005, 97, 453–456. [Google Scholar] [CrossRef]
  25. Falcao, S.I.; Duarte, D.; Diallo, M.; Santos, J.; Ribeiro, E.; Vale, N.; Vilas-Boas, M. Improvement of the In Vitro Cytotoxic Effect on HT-29 Colon Cancer Cells by Combining 5-Fluorouacil and Fluphenazine with Green, Red or Brown Propolis. Molecules 2023, 28, 3393. [Google Scholar] [CrossRef]
  26. Wu, Q.; Ma, X.; Jin, Z.; Ni, R.; Pan, Y.; Yang, G. Zhuidu Formula suppresses the migratory and invasive properties of triple-negative breast cancer cells via dual signaling pathways of RhoA/ROCK and CDC42/MRCK. J. Ethnopharmacol. 2023, 315, 116644. [Google Scholar] [CrossRef]
  27. Ortiz, J.E.; Pineiro, M.; Martinez-Peinado, N.; Barrera, P.; Sosa, M.; Bastida, J.; Alonso-Padilla, J.; Feresin, G.E. Candimine from Hippeastrum escoipense (Amaryllidaceae): Anti-Trypanosoma cruzi activity and synergistic effect with benznidazole. Phytomedicine 2023, 114, 154788. [Google Scholar] [CrossRef]
  28. Xiao, Y.; Liu, Z.; Li, P.; Wang, Y.; Wang, X.; Piao, C.; Yuan, L. Lipid-lowering capacity of GABA-rich supernatant from fermented okara in OA-induced HepG2 cells. Food Biosci. 2024, 58, 103659. [Google Scholar] [CrossRef]
  29. Wu, X.; Li, B.; Lu, H.; Ling, X.; Hu, Z.; Luo, Y.; Qin, D.; Yang, F.; Tang, Y.; Xie, T.; et al. Parboiled rice extracts ameliorate oleic acid-induced steatosis of HepG2 cell and its molecular mechanism. J. Funct. Foods 2023, 110, 105853. [Google Scholar] [CrossRef]
  30. Yao, Y.; Li, Z.; Qin, B.; Ju, X.; Wang, L. Evaluation of the intracellular lipid-lowering effect of polyphenols extract from highland barley in HepG2 cells. Food Sci. Hum. Wellness 2024, 13, 454–461. [Google Scholar] [CrossRef]
  31. Ta, N.; Lisha, A.; Erdunduleng, E.; Qi, R.; Mu, X.; Feng, L.; Ba, G.; Li, Y.; Zhang, J.; Bai, L.; et al. Metabolomics analysis reveals amelioration effects of yellowhorn tea extract on hyperlipidemia, inflammation, and oxidative stress in high-fat diet-fed mice. Front. Nutr. 2023, 10, 1087256. [Google Scholar] [CrossRef]
  32. Li, S.; Wu, X.; Ma, Y.; Zhang, H.; Chen, W. Prediction and verification of the active ingredients and potential targets of Erhuang Quzhi Granules on non-alcoholic fatty liver disease based on network pharmacology. J. Ethnopharmacol. 2023, 311, 116435. [Google Scholar] [CrossRef]
  33. Zhang, P.-P.; Zhuo, B.-Y.; Duan, Z.-W.; Li, X.; Huang, S.-L.; Cao, Q.; Zhao, T.; Wei, S.-L.; Hub, X.-H.; Zhang, Y. Marein reduces lipid levels via modulating the PI3K/AKT/mTOR pathway to induce lipophagy. J. Ethnopharmacol. 2023, 312, 116523. [Google Scholar] [CrossRef]
  34. Duan, Y.; Guo, F.; Li, C.; Xiang, D.; Gong, M.; Yi, H.; Chen, L.; Yan, L.; Zhang, D.; Dai, L.; et al. Aqueous extract of fermented Eucommia ulmoides leaves alleviates hyperlipidemia by maintaining gut homeostasis and modulating metabolism in high-fat diet fed rats. Phytomedicine 2024, 128, 155291. [Google Scholar] [CrossRef]
  35. Li, R.; Wang, J.; Liu, J.; Li, M.; Lu, J.; Zhou, J.; Zhang, M.; Ferri, N.; Chen, H. Mulberry leaf and its effects against obesity: A systematic review of phytochemistry, molecular mechanisms and applications. Phytomedicine 2024, 128, 155528. [Google Scholar] [CrossRef]
  36. Teng, H.; He, Z.; Hong, C.; Xie, S.; Zha, X. Extraction, purification, structural characterization and pharmacological activities of polysaccharides from sea buckthorn (Hippophae rhamnoides L.): A review. J. Ethnopharmacol. 2024, 324, 117809. [Google Scholar] [CrossRef] [PubMed]
  37. Huang, Z.F.; Ye, Y.L.; Kong, L.M.; Xu, A.L.; Liu, L.H.; Li, Z.B. Regulatory effects of Astragalus membranaceus polysaccharides on lipid metabolism disorders induced by a high-fat diet in spotted sea bass (Lateolabrax maculatus). Int. J. Biol. Macromol. 2024, 271, 132584. [Google Scholar] [CrossRef] [PubMed]
  38. Zhang, Y.; Hu, Y.F.; Li, W.; Xu, G.Y.; Wang, K.R.; Li, L.; Luo, H.; Zou, L.; Wu, J.S. Updates and advances on pharmacological properties of Taraxacum mongolicum Hand.-Mazz and its potential applications. Food Chem. 2022, 373, 131380. [Google Scholar] [CrossRef]
  39. Li, W.; Yang, C.; Mei, X.; Huang, R.; Zhang, S.; Tang, Y.; Dong, Q.; Zhou, C. Effect of the polyphenol-rich extract from Allium cepa on hyperlipidemic sprague-dawley rats. J. Food Biochem. 2021, 45, e13565. [Google Scholar] [CrossRef]
  40. Shen, Z.; Gao, X.; Huang, D.; Xu, X.; Shen, J. The potential of Gynostemma pentaphyllum in the treatment of hyperlipidemia and its interaction with the LOX1-PI3K-AKT-eNOS pathway. Food Sci. Nutr. 2024, 8, 25. [Google Scholar] [CrossRef]
  41. Wang, L.; Zheng, W.; Yang, J.; Ali, A.; Qin, H. Mechanism of Astragalus membranaceus Alleviating Acquired Hyperlipidemia Induced by High-Fat Diet through Regulating Lipid Metabolism. Nutrients 2022, 14, 954. [Google Scholar] [CrossRef] [PubMed]
  42. Wang, F.; Rong, P.; Wang, J.; Yu, X.; Wang, N.; Wang, S.; Xue, Z.; Chen, J.; Meng, W.; Peng, X. Anti-osteoporosis effects and regulatory mechanism of Lindera aggregata based on network pharmacology and experimental validation. Food Funct. 2022, 13, 6419–6432. [Google Scholar] [CrossRef]
  43. Liu, Y.; Han, Y.; Liu, Y.; Huang, C.; Feng, W.; Cui, H.; Li, M. Xanthoceras sorbifolium leaves alleviate hyperuricemic nephropathy by inhibiting the PI3K/AKT signaling pathway to regulate uric acid transport. J. Ethnopharmacol. 2024, 327, 117946. [Google Scholar] [CrossRef]
  44. Meng, H.; Song, J.; Fan, B.; Li, Y.; Zhang, J.; Yu, J.; Zheng, Y.; Wang, M. Monascus vinegar alleviates high-fat-diet-induced inflammation in rats by regulating the NF-KB and PI3K/AKT/mTOR pathways. Food Sci. Hum. Wellness 2022, 11, 943–953. [Google Scholar] [CrossRef]
  45. Shen, B.; Wen, Y.; Li, S.; Zhou, Y.; Chen, J.; Yang, J.; Zhao, C.; Wang, J. Paeonol ameliorates hyperlipidemia and autophagy in mice by regulating Nrf2 and AMPK/mTOR pathways. Phytomedicine 2024, 132, 155839. [Google Scholar] [CrossRef]
  46. Zheng, Z.; Gao, W.; Zhu, Z.; Li, S.; Chen, X.; Cravotto, G.; Sui, Y.; Zhou, L. Complexes of Soluble Dietary Fiber and Polyphenols from Lotus Root Regulate High-Fat Diet-Induced Hyperlipidemia in Mice. Antioxidants 2024, 13, 466. [Google Scholar] [CrossRef]
  47. Cheng, D.; Zhang, M.; Zheng, Y.; Wang, M.; Gao, Y.; Wang, X.; Liu, X.; Lv, W.; Zeng, X.; Belosludtsev, K.N.; et al. α-Ketoglutarate prevents hyperlipidemia-induced fatty liver mitochondrial dysfunction and oxidative stress by activating the AMPK-pgc-1α/Nrf2 pathway. Redox Biol. 2024, 74, 103230. [Google Scholar] [CrossRef]
  48. Yang, J.-H.; Bai, T.-C.; Shi, L.-L.; Hou, B.; Tang, R.; Zhang, R.-P.; Chen, X.-L. Antihyperlipidemic effect of Vaccinium dunalianum buds based on biological activity screening and LC-MS. J. Ethnopharmacol. 2023, 306, 116190. [Google Scholar] [CrossRef]
  49. Lin, Z.; Wang, F.; Yan, Y.; Jin, J.; Quan, Z.; Tong, H.; Du, J. Fucoidan derived from Sargassum pallidum alleviates metabolism disorders associated with improvement of cardiac injury and oxidative stress in diabetic mice. Phytother. Res. 2023, 37, 4210–4223. [Google Scholar] [CrossRef]
Figure 1. Total ion chromatogram in positive and negative ion modes. Ionic chromatograms of AME, HRE, and TME in positive-ion mode (AC). Ionic chromatograms of AME, HRE, and TME in negative-ion mode (DF). The numbers in Figure 1 represent the substances in Table 2.
Foods 13 02795 g001
Figure 2. Network pharmacology analysis of AHT treatment for hyperlipidemia. (A) Common targets of AHT and HLP. (B) AHT compound target network diagram. (C) Analysis of protein–protein interaction networks with 140 common targets. (D) PPI network diagram of common targets. (E) Core target PPI network diagram (node size and color depth indicate the high or low DC value).
Foods 13 02795 g002
Figure 3. Network pharmacology pathway analysis of AHT treatment for HLP. (A) GO enrichment analysis. (B) The top 20 KEGG enrichment pathways. (C) KEGG chord diagram, it indicated the top 10 pathways and their corresponding targets; the different colors of the graphics represent different signal pathways. (D) Compound–target–pathway–disease network diagram.
Foods 13 02795 g003
Figure 4. Combination Index analysis of AHT, AME, HRE, and TME. (A) CI values are combined in different proportions. (B) Dose effect curves of AHT, AME, HRE, and TME on pancreatic lipase inhibition. (C) Intermediate effect diagrams of AHT, AME, HRE, and TME. (n = 3, **** and * represent p < 0.01 and p < 0.05, respectively).
Foods 13 02795 g004
Figure 5. Effects of AHT, AME, HRE, and TME on HepG2 cell proliferation and oleic acid staining. (A) Cytotoxicity assay. (B) Oleic acid staining image. (n = 3, ****, ***, **, *, and ns represent p < 0.0001, p < 0.001, p < 0.01, p < 0.05, and p > 0.05, respectively).
Foods 13 02795 g005
Figure 6. Determination of AHT lipid-lowering levels. (A) TC. (B) TG. (C) LDL-C. (D) HDL-C. (n = 3, ****, ***, **, *, and ns represent p < 0.0001, p < 0.001, p < 0.01, p < 0.05, and p > 0.05, respectively).
Foods 13 02795 g006
Figure 7. The effect of AHT on critical proteins in the PI3K Akt signaling pathway and MAPK signaling pathway. (A) Immunoblot analysis of related proteins. (B) The ratio of p-AKT/AKT protein quantification results. (C) The ratio of p-PI3K/PI3K protein quantification results. (D) The ratio of p-AMPK/AMPK protein quantification results. (E) SIRT1 protein quantification results. (n = 3, ****, ***, **, *, and ns represent p < 0.0001, p < 0.001, p < 0.01, p < 0.05, and p > 0.05, respectively).
Foods 13 02795 g007
Figure 8. Body weight and food intake of mice. (A) Changes in body weight of mice in each group during 8 w. (n = 8, *, ** represent significant and extremely significant differences between the MC group and the NC group (p < 0.05, p < 0.01); ## represents extremely significant differences between the MC group and the HD group (p < 0.05). (B) During the 8 w period, the food intake of mice in each group. (n = 3, ****, **, and ns represent p < 0.0001, p < 0.01, and p > 0.05, respectively).
Foods 13 02795 g008
Figure 9. Serum indicators. (A) TC. (B) TG. (C) LDL-C. (D) HDL-C. (E) AST. (F) ALT. (G) SOD. (H) T-AOC. (n = 3, ****, ***, **, *, and ns represent p < 0.0001, p < 0.001, p < 0.01, p < 0.05, and p > 0.05, respectively).
Foods 13 02795 g009
Table 1. Active ingredients of AME, HRE, and TME.
No.NameMolecule IDMolecule NameOB (%)DL
1LuteolinMOL000006Luteolin36.160.25
2QuercetinMOL000098Quercetin46.430.28
3IsorhamnetinMOL000354Isorhamnetin49.60.31
4KaempferolMOL000422Kaempferol41.880.24
5PhaseollidinMOL000457Phaseollidin52.040.53
6CholesterolMOL000953CLR37.870.68
7Ellagic acidMOL001002Ellagic acid43.060.43
8PelargonidinMOL001004Pelargonidin37.990.21
9DihydrochelerythrineMOL001461Dihydrochelerythrine32.730.81
10DihydrosanguinarineMOL001463Dihydrosanguinarine59.310.86
11SanguinarineMOL001474Sanguinarine37.810.86
12ChelerythrineMOL001478Toddaline25.990.81
13ScopolamineMOL001554Scopolamine67.970.27
14(+)-SesaminMOL001558Sesamin56.550.83
15AcacetinMOL001689Acacetin34.970.24
16DiphyllinMOL001699Diphyllin36.230.75
17PodofiloxMOL001714Podophyllotoxin59.940.86
18LinarinMOL001790Linarin39.840.71
19ScopolinMOL002218Scopolin56.450.39
20HesperetinMOL002341Hesperetin70.310.27
21MedicarpinMOL002565Medicarpin49.220.34
22BaicaleinMOL002714Baicalein33.520.21
23MelilotosideMOL004101Melilotoside36.850.26
24CorydalineMOL004195CORYDALINE65.840.68
25KaempferideMOL004564Kaempferid73.410.27
26GlabraninMOL004910Glabranin52.90.31
27ArtemetinMOL005229Artemetin49.550.48
28Arachidonic acidMOL005320Arachidonate45.570.2
29CitromitinMOL005815Citromitin86.90.51
30PapaverineMOL006980Papaverine64.040.38
31CodeineMOL006982Codeine45.480.56
32CirsimaritinMOL007274Skrofulein30.350.3
33ArtemisininMOL007424Artemisinin49.880.31
34CorynolineMOL008636Corynoline30.530.85
35CamptothecinMOL009830EHD61.040.81
36LeucocyanidinMOL010489Resivit30.840.27
37EstroneMOL010921Estrone53.560.32
38LobelanineMOL012208Lobelanine54.130.32
39Uridine 5’-monophosphateMOL0128205’-Uridylic acid40.250.2
40FustinMOL013296Fustin50.910.24
41GarbanzolMOL013305Garbanzol83.670.21
Table 2. The compound composition in AHT determined by LC-MS.
Peak No.Proposed CompoundRT/sPrecursor m/zError (ppm)Formula
1Luteolin290285.07612.606C15H10O6
2Quercetin287303.04980.420C15H10O7
3Isorhamnetin303.7315.05151.512C16H12O7
4Kaempferol282285.03914.770C15H10O6
5Phaseollidin224325.137917.003C20H20O4
6CLR412.7369.358819.607C27H46O
7Ellagic acid116.6324.999913.574C14H6O8
8Pelargonidin57.5543.12634.175C15H11O5
9Dihydrochelerythrine63.8332.12851.169C21H19NO4
10Dihydrosanguinarine48.1665.19073.352C20H15NO4
11Sanguinarine116.9289.11031.990C20H14NO4
12Toddaline83.9332.131510.197C21H18NO4
13Scopolamine301.9285.116310.784C17H21NO4
14Sesamin48.5337.111513.218C20H18O6
15Acacetin336.1283.06062.098C16H12O5
16Diphyllin46.8381.09368.594C21H16O7
17Podophyllotoxin58.8829.26881.687C22H22O8
18Linarin240.2653.18417.888C28H32O14
19Scopolin81.8335.07584.287C16H18O9
20Hesperetin241.6301.0712.518C16H14O6
21Medicarpin240.9254.072811.289C16H14O4
22Baicalein297.6269.04482.767C15H10O5
23Melilotoside81.8371.09684.221C15H18O8
24CORYDALINE226.1387.222114.781C22H27NO4
25Kaempferid302.1299.05671.977C16H12O6
26Glabranin385.4369.14714.907C20H20O4
27Artemetin61.3345.13679.972C20H20O8
28Arachidonate447.9303.23517.121C20H32O2
29Citromitin206.6405.133918.738C21H24O8
30Papaverine66.5322.1274.678C20H21NO4
31Codeine219.3300.15872.372C18H21NO3
32Skrofulein252359.07311.803C17H14O6
33Artemisinin260.9343.13824.764C15H22O5
34Corynoline254.3350.14583.569C21H21NO5
35EHD260.3330.236311.189C20H16N2O4
36Resivit267.9288.044314.498C15H14O7
37Estrone292.4269.07910.881C18H22O2
38Lobelanine276336.19785.963C22H25NO2
395’-Uridylic acid41.1323.02743.682C9H13N2O9P
40Fustin326.2333.047315.279C15H12O6
41Garbanzol252.4273.080517.407C15H12O5
Table 3. Prediction of key targets for AHT treatment of HPL.
NO.Symbol IDProtein NamePathways
1TP53Tumor protein p53hsa05417, hsa04010, hsa04151
2PPARGPeroxisome proliferator-activated receptor gammahsa05417
3ESR1Estrogen receptorhsa05207
4TNFTumor necrosis factorhsa05417, hsa04933, hsa04010
5CCL2C-C motif chemokine 2hsa05417, hsa04933, hsa05418
6AKT1Potassium channel AKT1hsa05417, hsa04933, hsa04010, hsa04151
7RELATranscription factor p65hsa05417, hsa04933, hsa04010, hsa04151
8MAPK1Mitogen-activated protein kinase 1hsa05417, hsa04933, hsa04010, hsa04151
9IL6Interleukin-6hsa05417, hsa04933, hsa04151
10CXCL8Interleukin-8hsa05417, hsa04933
11IL1AInterleukin-1 alphahsa04933, hsa04010, hsa05418
12IL4Interleukin-4hsa04151
13IL10Interleukin-10-
14IL1BInterleukin-1 betahsa05417, hsa04933, hsa04010
15IFNGInterferon gammahsa05418
Table 4. Annotation of the top 10 KEGG pathways.
IDDescriptionp-ValueGene IDCount
hsa05200Pathways in cancer29.15GSK3B, CXCL8, PTEN, CASP9, CASP8, CCND1, MYC, CASP3, AKT1, NCOA1, CHUK, PRKCB, MMP1, MMP2, FOS, MMP9, AR, IFNG, BIRC5, PPARG, RAF1, TP53, PPARD, PTGS2, HIF1A, EGFR, RELA, RXRB, MAPK8, RXRA, ERBB2, E2F1, HMOX1, MAPK1, RXRG, TGFB1, NOS2, CDKN2A, EGF, STAT1, IGF2, ESR1, ESR2, IL2, VEGFA, MAPK10, IL4, IL6, CDK4, BCL2, MDM2, BAX, NFE2L253
hsa05417Lipid and atherosclerosis30.27GSK3B, CXCL8, TNF, CXCL2, RELA, ICAM1, CASP9, RXRB, PPP3CA, MAPK8, CASP8, CYP2B6, RXRA, CASP3, CCL2, AKT1, MAPK1, OLR1, RXRG, VCAM1, CHUK, MMP1, NOS3, MMP3, NFATC1, FOS, MAPK14, SELE, MMP9, MAPK10, IL6, CD40LG, IL1B, CYP1A1, BCL2, BAX, PPARG, TP53, NFE2L239
hsa04933AGE-RAGE signaling pathway in diabetic complications31.05CXCL8, SERPINE1, TNF, RELA, ICAM1, THBD, MAPK8, CCND1, CASP3, CCL2, AKT1, MAPK1, TGFB1, VCAM1, PRKCB, NOS3, STAT1, MMP2, NFATC1, MAPK14, SELE, F3, VEGFA, MAPK10, IL1A, COL3A1, IL6, CDK4, IL1B, BCL2, BAX31
hsa05167Kaposi sarcoma-associated herpesvirus infection20.65GSK3B, CXCL8, PTGS2, HIF1A, CXCL2, RELA, PIK3CG, ICAM1, CASP9, PPP3CA, MAPK8, CASP8, CCND1, MYC, CASP3, E2F1, AKT1, MAPK1, CHUK, STAT1, NFATC1, FOS, MAPK14, VEGFA, MAPK10, IL6, CDK4, BAX, RAF1, TP5330
hsa05207Chemical carcinogenesis—receptor activation19.50NR1I3, ADRB1, AHR, ADRB2, CYP3A4, RELA, EGFR, RXRB, CYP2B6, RXRA, CCND1, MYC, E2F1, AKT1, MAPK1, RXRG, UGT1A1, PRKCB, EGF, FOS, ESR1, ESR2, VEGFA, AR, CYP1A1, BCL2, BIRC5, PGR, RAF1, PPARA30
hsa05163Human cytomegalovirus infection17.81GSK3B, CXCL8, PTGS2, TNF, RELA, EGFR, CASP9, PPP3CA, CASP8, CCND1, MYC, CASP3, E2F1, CCL2, AKT1, MAPK1, CHUK, CDKN2A, PRKCB, NFATC1, MAPK14, VEGFA, IL6, CDK4, IL1B, MDM2, BAX, RAF1, TP5329
hsa04010MAPK signaling pathway12.69HSPB1, TNF, RELA, EGFR, PPP3CA, MAPK8, MYC, CASP3, ERBB2, AKT1, MAPK1, TGFB1, CHUK, PRKCB, EGF, INSR, IGF2, NFATC1, FOS, MAPK14, VEGFA, MAPK10, IL1A, RASA1, IL1B, RAF1, TP5327
hsa04151PI3K-Akt signaling pathway10.81GSK3B, PTEN, RELA, EGFR, PIK3CG, CASP9, RXRA, CCND1, MYC, ERBB2, SPP1, AKT1, MAPK1, CHUK, EGF, NOS3, INSR, IGF2, IL2, VEGFA, IL4, IL6, CDK4, BCL2, MDM2, RAF1, TP5327
hsa05418Fluid shear stress and atherosclerosis19.75PLAT, TNF, RELA, ICAM1, THBD, MAPK8, CCL2, AKT1, HMOX1, VCAM1, CHUK, NOS3, CAV1, MMP2, FOS, MAPK14, SELE, MMP9, VEGFA, MAPK10, IL1A, IFNG, IL1B, BCL2, TP53, NFE2L226
hsa05161Hepatitis B18.15CXCL8, TNF, RELA, CASP9, MAPK8, CASP8, MYC, CASP3, E2F1, AKT1, MAPK1, TGFB1, CHUK, PRKCB, STAT1, NFATC1, FOS, MAPK14, MMP9, MAPK10, IL6, BCL2, BAX, BIRC5, RAF1, TP5326
Table 5. Pancreatic lipase inhibition rates of AME, HRE, and TME with different compounding ratios.
GroupAMEHRETMEInhibition Rate%
111180.71 ± 0.83
212279.84 ± 0.80
313372.11 ± 1.94
421294.25 ± 1.10
522386.08 ± 0.86
623189.64 ± 1.23
731396.72 ± 1.30
832195.87 ± 0.25
933296.47 ± 0.32
k177.5590.5688.74
k289.9987.2690.19
k396.3586.0784.97
R18.804.495.13
Best combinationA3H1T2
Table 6. The effect of AHT on organ indices in different groups of mice.
GroupNCMCPCLDMDHD
Heart (%)0.693 ± 0.110.672 ± 0.110.602 ± 0.100.707 ± 0.190.660 ± 0.090.613 ± 0.10
Liver (%)4.554 ± 0.474.527 ± 0.353.847 ± 1.404.750 ± 0.674.483 ± 0.664.548 ± 0.74
Spleen (%)0.327 ± 0.030.309 ± 0.050.253 ± 0.060.306 ± 0.080.282 ± 0.100.321 ± 0.09
Kidney (%)1.462 ± 0.181.367 ± 0.131.357 ± 0.171.463 ± 0.191.334 ± 0.231.271 ± 0.14
(n = 8, p > 0.05; there was no significant difference between the groups).
Disclaimer/Publisher’s Note: The statements, opinions and data contained in all publications are solely those of the individual author(s) and contributor(s) and not of MDPI and/or the editor(s). MDPI and/or the editor(s) disclaim responsibility for any injury to people or property resulting from any ideas, methods, instructions or products referred to in the content.

