Article

Microbial and Quality Attributes of Beef Steaks under High-CO2 Packaging: Emitter Pads versus Gas Flushing

by
Seyed Mohammad Hassan Mortazavi
,
Mandeep Kaur
,
Asgar Farahnaky
,
Peter Joseph Torley
* and
Andrew Mark Osborn
Discipline of Biosciences and Food Technology, School of Science, RMIT University, Melbourne 3000, Australia
*
Author to whom correspondence should be addressed.
Foods 2024, 13(18), 2913; https://doi.org/10.3390/foods13182913
Submission received: 21 August 2024 / Revised: 9 September 2024 / Accepted: 11 September 2024 / Published: 14 September 2024
(This article belongs to the Section Food Packaging and Preservation)

Abstract

:
Over 21 days of cold storage, the quality and microbial composition of beef steaks in response to different high-CO2 packaging conditions achieved by flushing gas mixtures or embedding gas emitters into the packages were studied. The results revealed that the high levels of CO2, achieved by either the gas flushing or the CO2 emitter pads, effectively controlled the number of aerobic counts. The headspace CO2 increased quickly in response to using the CO2 emitter pads, and the meat samples presented different pH levels and surface color (a* and b*) values compared to the samples packaged with the gas flushing technique. Excessive accumulation of gas in the packages that contained CO2 emitters resulted in package swelling and higher levels of drip loss. The longest overall quality and attractive red color of the meat samples were observed when the packages were initially flushed with the headspace gas mixture containing high levels of oxygen. Overall, using CO2 emitters for meat packaging can be suggested when a topfilm with proper permeability to O2 and CO2 gases is used to regulate the internal CO2/O2 and gas/product ratios.

1. Introduction

Fresh meat is normally a very perishable product with a limited shelf life. Containing high water content and a range of nutrients such as sugars, amino acids, nucleotides and peptides makes meat a product prone to microbial spoilage [1]. A combination of microbial and biochemical changes including discoloration [2], pH change [3] and texture degradation [4] will start in response to packaging and storage conditions, and spoiled meat is normally characterized by development of unacceptable color, odors and flavors together with slime formation [5].
In the meat ‘case-ready’ market, beef cuts are packaged in different ways including modified atmosphere packaging (MAP), vacuum packed, skin packed or being overwrapped on polystyrene trays [6]. The effect of modified atmosphere packaging on meat shelf life is largely dependent on inhibitory effects of high-CO2 atmospheres on growth of a varied range of spoilage and pathogenic bacteria [7]. It has been demonstrated that the presence of at least 30% CO2 in package headspace can effectively reduce growth and population of many key meat-associated bacteria including Enterobacteriaceae [8], Pseudomonas spp. [9], Brochothrix thermosphacta [10], Lactobacillus spp. [11], Leuconostoc spp. and lactic acid bacteria [12].
In designing an effective MAP system and to take advantage of the antibacterial effect of high-CO2 active packaging, several parameters should be considered including meat product respiration rate [13], packaging film permeability [14], headspace gas-to-product (G:P) ratio [15] and also solubility of CO2 gas within the product [16]. Following packaging, part of the headspace CO2 gradually dissolves within meat surface layers to form carbonic acid that subsequently dissociates into bicarbonate (HCO3) and hydrogen (H+) ions [17]. Accumulation of protons can directly or indirectly influence meat quality parameters such as pH [18], color [19], drip loss [20] and water holding capacity [21] as well as cooking flavor and texture [22].
Currently, to achieve an effective modified atmosphere environment for meat products, the trays are flushed with a mixture of N2, O2 and CO2 gases before the topfilm is sealed [23]. Commercially, a mixture of 60–80% O2 and 20–30% CO2 is used to produce an attractive red color in the meat and to retard the growth of spoilage microorganisms [7]. The requirements for gas flushing (i.e., the need for food-grade gases, specialized mixing equipment and precise metering tools to ensure the right balance of gas mixture) make this method expensive and difficult to implement in some situations (e.g., small-scale meat processing and packaging companies). Furthermore, due to the high solubility of CO2 gas in meat (ca. 1 L.kg−1) an initial G:P ratio of 2:1 to 3:1 is required to prevent deformation and collapse of the packages following gradual absorption of the headspace gases into the meat during storage time [24]. The resulting bigger package volume leads to increased costs due to the need for more chilled storage and transportation space [25].
Recently, a number of CO2 emitter pads have been developed to be used in meat packages. These emitter pads commonly contain a mixture of sodium bicarbonate and citric acid (1:1 w:w), which releases CO2 upon receiving meat exudates [26]. The effect of CO2 emitter pads in prolonging the shelf life of some types of meat products such as fresh fish fillets [27,28], chicken fillets [29] and reindeer meat [30] have been previously reported. Whilst this prior research demonstrates the potential efficacy of these CO2 emitting pads for different packaged-meat types, there is a gap of data on the efficiency of these active pads compared to conventional gas flushing methods on physicochemical and microbiological qualities of beef meat. The purpose of this research was to compare the responses of fresh beef cuts in terms of quality parameters and spoilage bacteria throughout storage time in different high-CO2 active packaging treatments gained by flushing with a known gas mixture or placing different types of CO2 emitter pads under the meat.

2. Materials and Methods

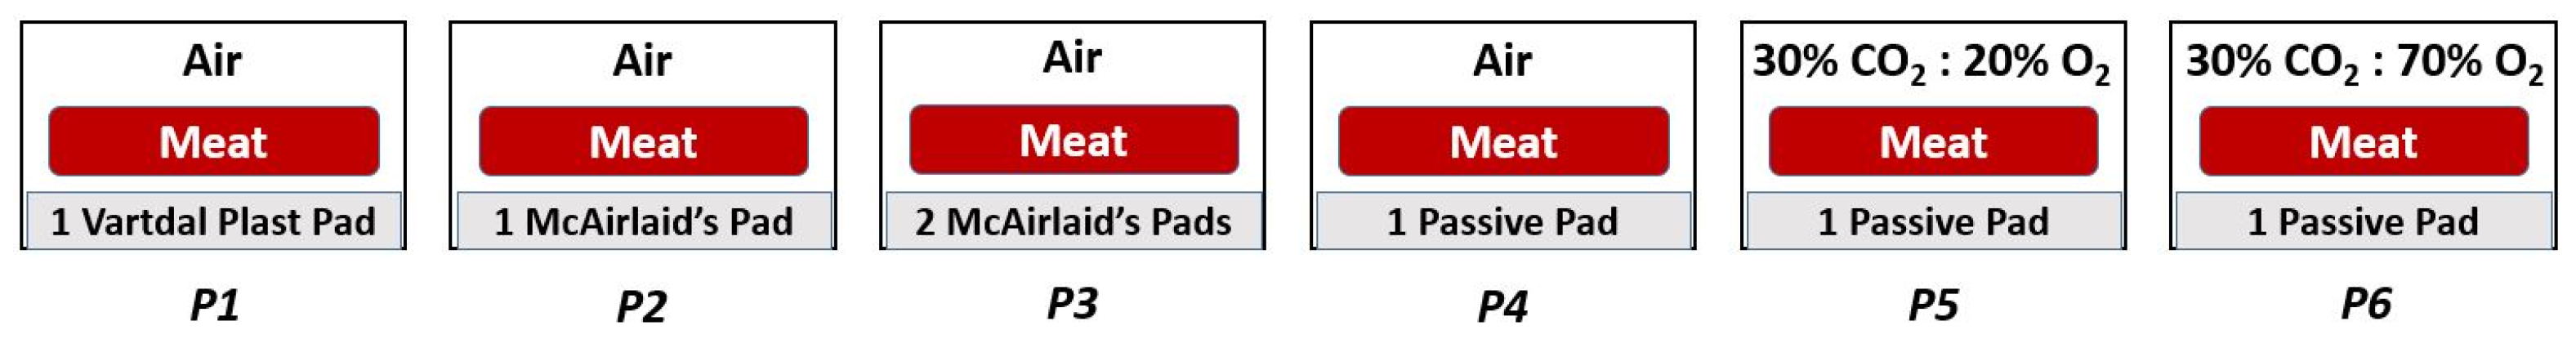
2.1. CO2 Emitter Pads and Meat Samples: Selection and Suppliers

Two different commercial CO2 emitter pads were obtained from Vartdal Plast (VP), Vartdal, Norway and McAirlaid’s (MA), Berlingerode, Germany. The sizes for VP and MA pads were 10 cm × 15 cm and 8 cm × 13 cm, respectively. Both pad types are designed to release CO2 gas upon contact with water or meat exudate, causing a chemical reaction by the combination of citric acid and sodium bicarbonate. Passive pads (PP), 8 × 13 cm in size with no CO2 emitting chemicals, were used as negative control. The meat samples (beef semitendinosus) were purchased from a local meat wholesaler (PJ Meats, Melbourne, Australia) on the day of the experiment. The wholesaler cut the muscles into uniform ~2 cm-thick slices. The meat slices were transferred immediately to the Food Research and Innovation Centre at RMIT University.

2.2. CO2 Emitter Pads, Gas Flushing, and Meat Sample Preparation

To create the six different active and passive packaging conditions illustrated in Figure 1, a T-200 Multivac (Keilor Park, Australia) equipped with a gas flushing system was used. For each treatment, 18 packaging trays (1L PP, Cryovac®) (Fawkner, Australia) were prepared and the appropriate number/type of VP, MA and PP were put at the bottom of trays (1 VP pad for P1, 1 MA pad for P2, 2 MA pads for P3 and 1 passive pad for P4, P5, P6). Immediately after placing 250 ± 2 g beef meat slices on the pads, the trays were flushed with the selected headspace gas composition and sealed with biaxially oriented polyamide/ethylene vinyl alcohol copolymer polyethylene film (oxygen transmission rate ≤ 4 cm3/m2–24 h-atm at 38 °C in dry air; LID-AEE-AP-45, Multivac, Wolfertschwenden, Germany).
Three separate replications were considered for each treatment at each analysis time. Packaged meat trays were stored at 4 °C, and analyses of samples were performed at days 3, 7, 10, 14, 17 and 21 for meat quality and microbiology counts. Untreated samples were used as purchased for day 0 analysis.

2.3. CO2 Emitter Pads and Meat Sample Analyses

Gas composition: Before opening each package, the headspace gas composition was measured using a portable O2/CO2 gas analyzer (Quantek Model Q2, Grafton, MA, USA). This was accomplished by inserting the gas analyzer needle through the top film, then drawing a gas sample from the pack’s headspace into the gas analyzer through the connecting plastic hose.
Surface color: Ten minutes after opening each tray, the surface colors of both the top side (air facing) and pad side (bottom facing and in contact with the pad) of beef slices was evaluated based on the CIE Lab system using a Chroma Meter (CR-400, Konica Minolta, Tokyo, Japan). Six readings for lightness (L), redness (a) and yellowness (b) were taken on each side of the meat slice, and the mean values were used for data analysis.
Determination of pH: Each meat sample was cut into two halves (pad side and top side) using a sharp knife. From each side, 10 g was removed and placed in a plastic beaker. After adding 10 mL distilled water, a slurry was made using an overhead stirrer (Ultra Turrax T25—IKA, Staufen, Germany) at 8000 rpm for 1 min. The Oakton pH 700 Benchtop Meter (Oakton Instruments, Vernon Hills, IL, USA) was first calibrated according to manufacturer’s instructions for two-point calibration with pH 4.01 and 7.01 buffer solutions and then used for measuring the pH of prepared meat slurries [31].
Tray swelling/collapse: To understand the effect of the interaction of meat, pad and headspace gas on the package swelling or collapse, the increase or decrease in the package height compared to day 0 was measured with a metal ruler (millimeter markings) at each sampling time point.
Drip loss: The weight of the meat slices was recorded on day 0 (D0) and after removal from package on the day of sampling and quality analysis (Da). Prior to weighing, the samples were gently blotted using tissue paper. The equation below, Equation (1), was used to calculate the percentage drip loss [32].
% Drip Loss = (D0 − Da)/D0 × 100
Bacterial Counts: Total aerobic, Enterobacteriaceae, Brochothrix thermosphacta, Pseudomonas and lactic acid bacterial counts were determined at days 0, 3, 7, 10, 14, 17 and 21. According to the method described in ISO 6887-2:2017 [33], a section of the meat surface (5 cm2) was removed from each meat sample, weighed and placed in Interscience 400 mL Filter Bags (Edwards, Herblay-sur-Seine, France). According to the sample weight, 10× sterile 0.1% (w/v) peptone solution (LP0037, Oxoid, Basingstoke, UK) was added to each bag, and the meat was homogenized in a stomacher (BagMixer, Bernolsheim, France) for 2 min. A volume of 1 mL of the filtered suspension was used to generate a ten-fold dilution series [34].
Total aerobic (AC), Enterobacteriaceae (EB) and lactic acid bacteria (LAB) counts were determined using 3M™ Petrifilm Rapid Plates (St. Paul, MN, USA) (Codes 6478, 6421 and 6461, respectively). Briefly, the Petrifilm plates were placed on a flat surface, the top film lifted, 1 mL of sample suspension was dispensed onto the center of the bottom film and then the top film was gently dropped down to the sample. A spreader was used to distribute the sample evenly on the plate growth area. After allowing 1 min to form the gel, the plates were incubated in a horizontal position with the clear side up for 24 h at 30 °C (for EB) or 4 days at 25 °C (for AC and LAB). To determine the numbers of Pseudomonas spp. and B. thermosphacta, agar-based plates were used. From appropriate dilutions, 0.1 mL aliquots were spread onto Pseudomonas agar base (CM0559, Oxoid, UK) and onto streptomycin thallous acetate actidione agar (CM0881, Oxoid, UK); inoculated plates were incubated at 25 °C for 48 h.
The number of Colony Forming Units (CFU) for all agar-based plates and Petrifilm Rapid plates were counted using a standard colony counter, and microbiological data were expressed as Log10 CFU/cm2.

2.4. Statistical Analysis

The data of both microbial and physical parameters were subjected to one-way analysis of variance (ANOVA) to explore the significant differences among packaging treatments, storage duration and packaging–time interaction. The ANOVA was performed using MSTAT-C 8.0 for randomized complete block design (two factors), and the differences between the means (p < 0.05) were determined by the least significant difference (LSD test).

3. Results and Discussion

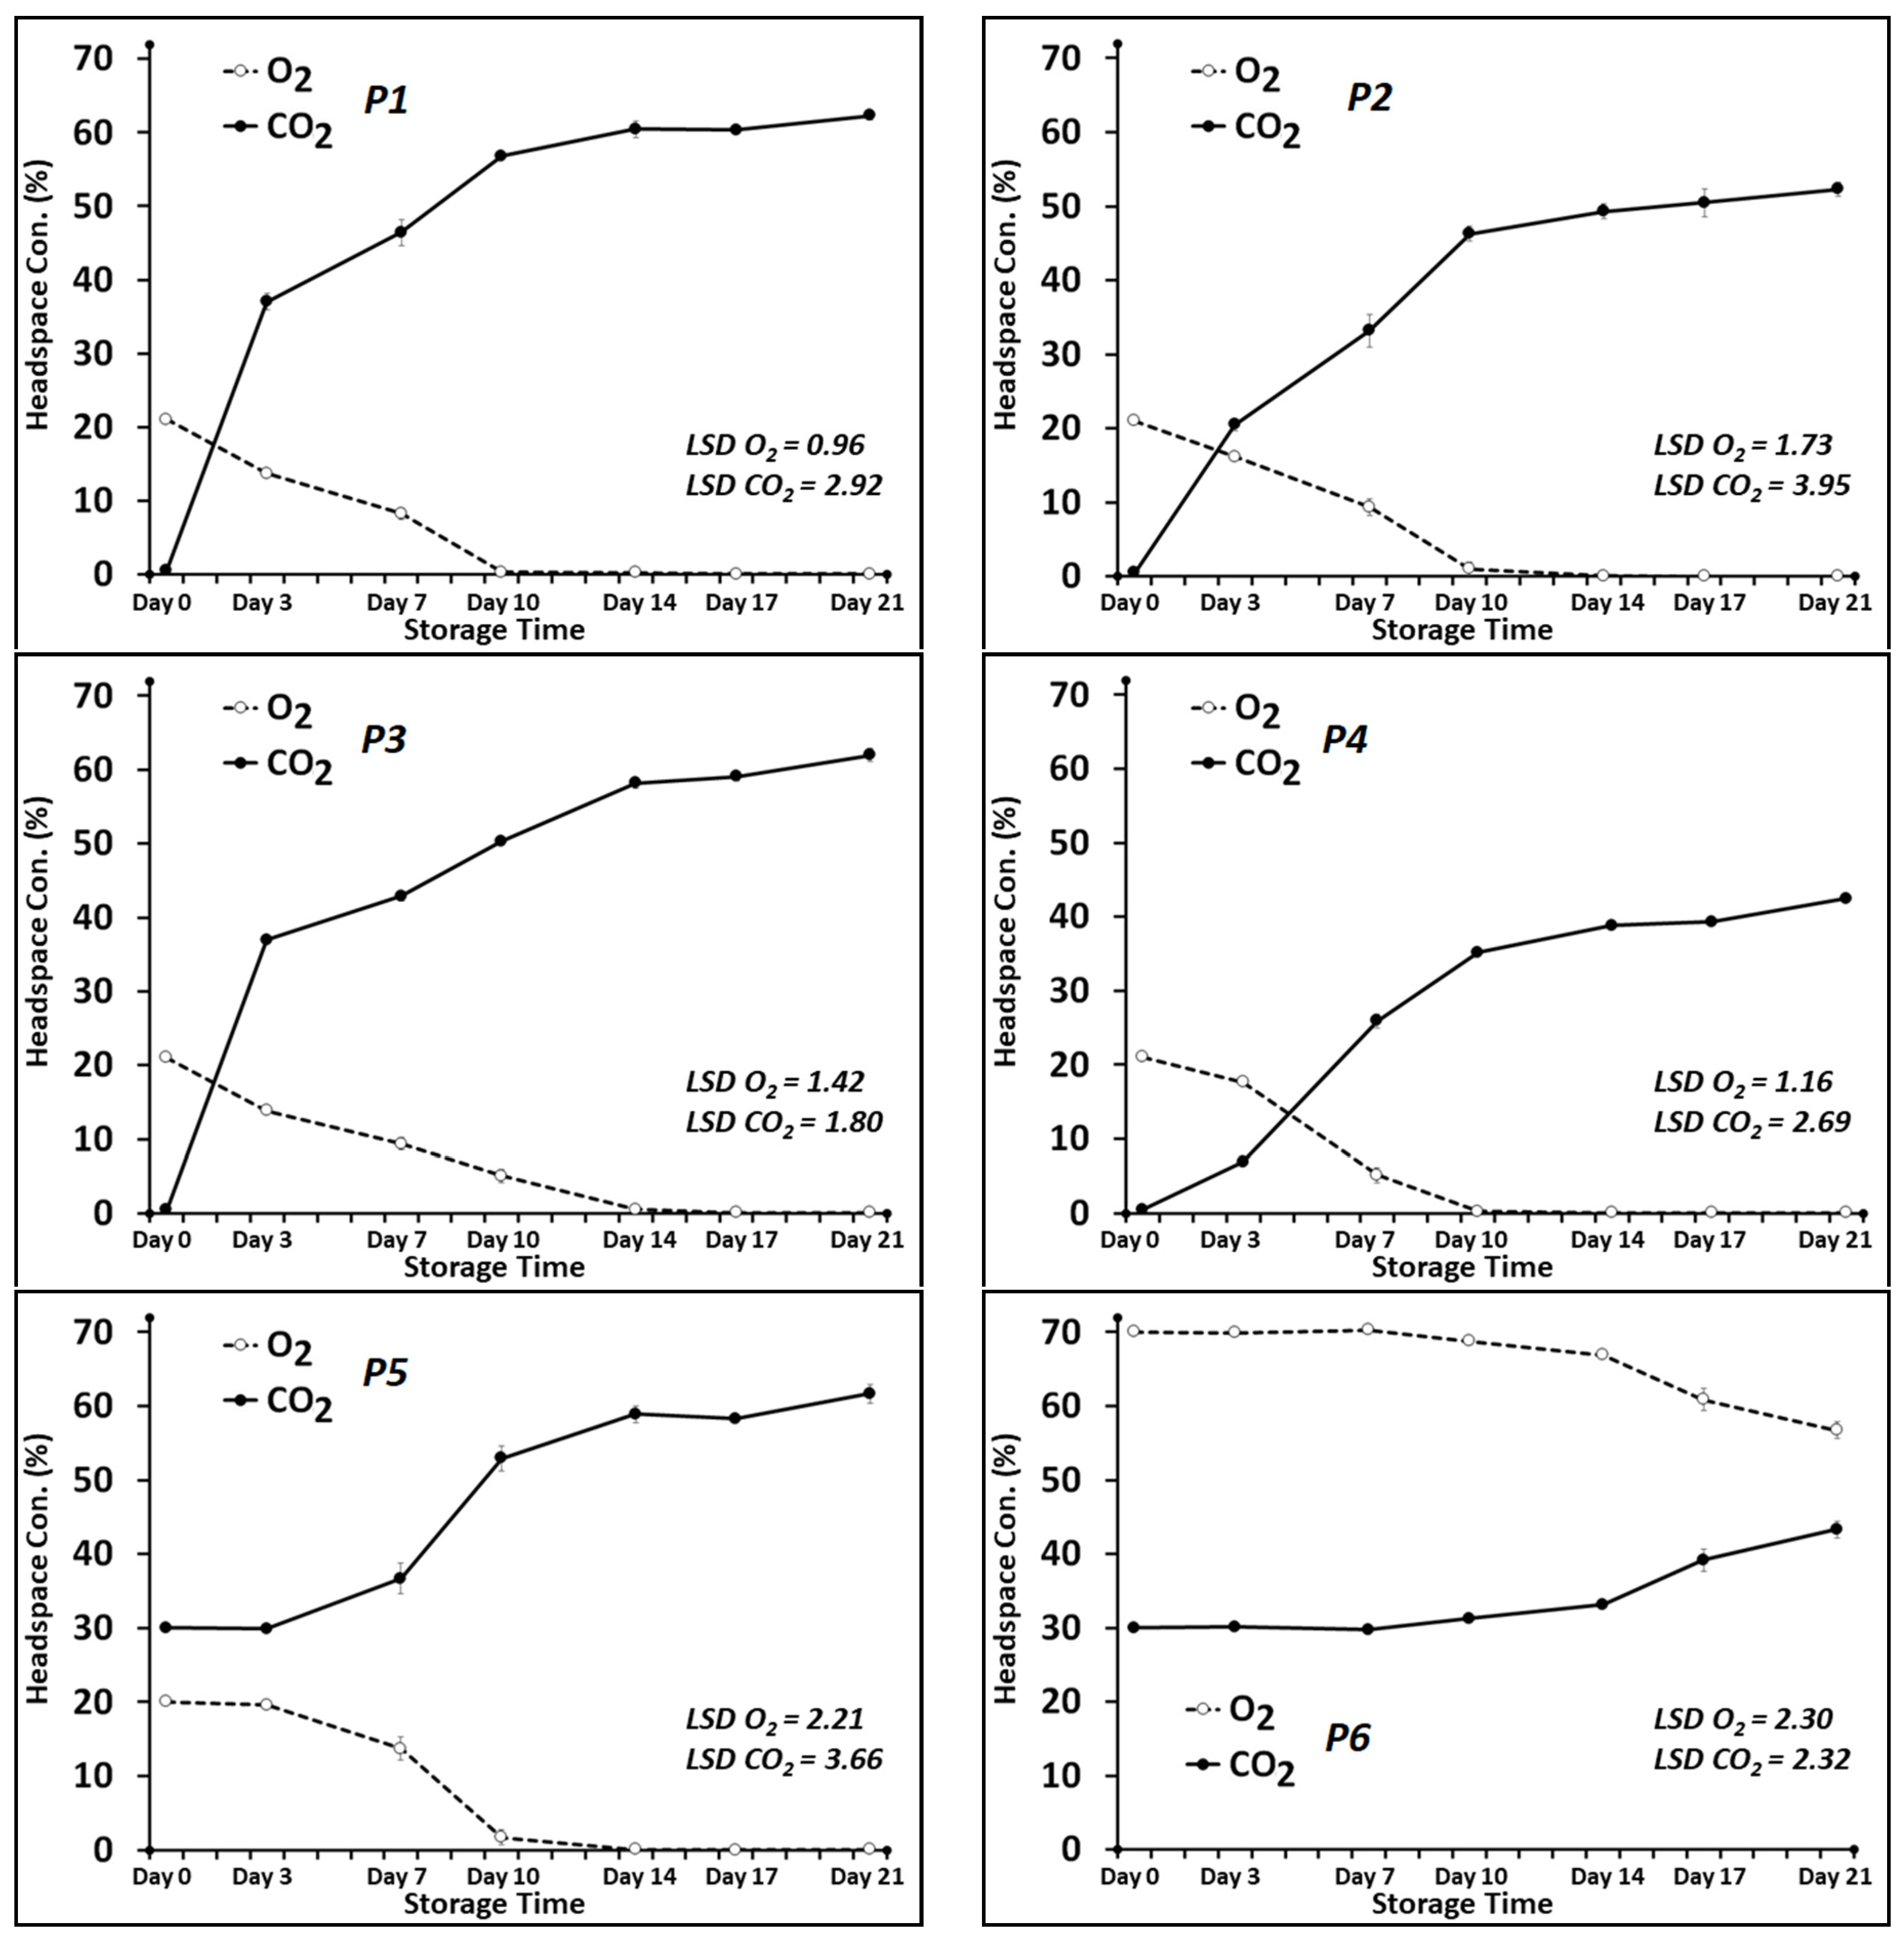
3.1. Headspace CO2 and O2 Levels

Throughout the storage time, the headspace concentrations of CO2 and O2 gases changed significantly (p ≤ 0.05) in all the treatments. The treatments which contained CO2 emitter pads, i.e., P1, P2 and P3, experienced the most rapid changes in the headspace gas composition (Figure 2). After 3 days, CO2 sharply increased to ~37% in P1 and P3 and ~20% in P2. The rising trend for headspace CO2 continued for all the treatments throughout the study time and rose to around 60% (for P1, P3, P5), 50% (for P2) and 40% (for P4 and P6) after 21 days of cold storage. A comparison of the two different commercial CO2 emitter pads, i.e., VP (P1) and MA (P2), clearly showed that the VP pads, which were 1.4 times bigger in size, had considerably higher rates of CO2-release capacity compared to the MA pads. For P3, when two MA pads were used, the pattern of the headspace CO2 changes was fairly similar to P1, using one VP pad.
Oxygen is an important gas in terms of its effect on respiratory behaviors of meat and associated microbes as well as on oxidative reactions which determine meat color. The initial concentrations of O2 were 70% for treatment P6 and 21% (ambient air concentration) for the other treatments. With the exception of the P6 treatment, the levels of oxygen dropped quickly for all the treatments and fell to around zero after 10 days (for P1, P2, P4, P5) or 14 days (for P3) of cold storage. Dynamic behavior of headspace gases under modified atmosphere packaging is well documented, and it is attributed to many parameters including food respiration rate, associated microbial respiration, G:P ratio and gas permeability of the packaging film [35].
The exact amount of CO2 generated by meat/associated microbiome cannot be monitored easily, as gaseous CO2 is highly soluble into the water phase of meat products [36]. In this current study, only treatment P6 maintained a balanced level of CO2 and O2 in the package over the entire storage time. For the treatments containing the CO2 emitter pads (P1, P3 and P2), the rapid increase of CO2 to over 30% and the depletion of O2 to near zero can primarily be explained by the production of high volumes of CO2 gas by the emitter pads. Previously, the activity of spoilage bacteria associated with fresh meat, such as Brochothrix thermosphacta, Pseudomonas spp., and varied range of LAB, has been reported as utilizing the available O2 and emitting more CO2 into the package headspace [37,38,39]. Additionally, ‘high barrier’ packaging materials (trays and lidding materials) could be considered as factors in limiting oxygen transmission when in-pack O2 quickly falls to the very low concentrations where anaerobic respiration initiates [7].
Choosing a topfilm with reasonable levels of permeability can induce a desirable equilibrium modified atmosphere (EMA) when the transmission rates of O2 and CO2 through the film equal the rates of generated/consumed gases in the tray, achieving a successful MAP using CO2 emitter pads.

3.2. Color

Meat color is one of the major features that determines consumer acceptance of meat products at the point of sale [8]. The color CIE a* (red–green) and b* (yellow–blue) values for both sides (pad side and top side) of the beef steaks are presented in Figure 3. Results showed that in the treatments containing the CO2 emitter pads (P1, P2 and P3), the pad sides (which were in contact with the pads) and the top sides of the meat samples had significantly different values for both a* and b*, and the parts of the meat which were in contact with the CO2 emitter pads had lower b* values and higher a* values throughout the storage time. The largest differences were recorded for the P1 and P3 treatments at day seven, where the a* values of the pad sides (15.4 and 16.5, respectively) were more than three units higher, and the b* values of the pad sides (11.1 and 11.8, respectively) were around 1.3 units lower than the top sides’ values. For other treatments (i.e., P4, P5 and P6), no differences were found between the two sides of the meat samples. Holman et al. [40] demonstrated that a* value will provide the simplest and strongest prediction of beef color acceptability by customers. Pertaining to the b* values, however, an increase from the initial value of 7.3 happened for all the treatments, but almost all of them (except P6) followed the same pattern of changes over the 21 days of storage.
Initial L* value of the meat samples at day 0 was 36.14. For the first three days of storage, all the treatments exhibited a slight increase in the L* values (p < 0.05), but there was not any notable difference between the applied treatments, and the L* value fluctuated between 40 and 50 for all the samples throughout the storage period.
The a* value is an indicator of the red color of meat. The most acceptable red color and the lowest alteration of a* value was noted for treatment P6. Presence of high levels of O2 (60–80%) in a MAP can produce high levels of OxyMb on meat surfaces, which provide an attractive red color for short-term retail display [7]. After day 10, the red color and consequently the a* value of P6 dropped dramatically. The quick fading of the red color can be attributed to the stimulation of lipid and protein oxidation and consequent premature browning of the meat, which is detrimental to meat flavor, texture and color [41].
For the other treatments, the a* value (or red color) decreased gradually to around seven until day 10 or 14 and then experienced increases with different rates. These increases can be explained by formation of DeoxyMb pigment and development of purple-red color in the absence of enough headspace oxygen [42].

3.3. pH

Meat pH is believed to be a physiological parameter which reacts quickly in response to most post-slaughter conditions. The pH changes of the meat samples for both the top sides and the pad sides over 21 days of cold storage are presented in Table 1. The results revealed that the treatments which contained the CO2 emitter pads (P1, P2 and P3) followed a similar pattern of pH change with significantly higher values for pad sides for the majority of storage time. In those treatments, pH increased from the initial value of 5.3 to around 5.8 on day 14, and then slightly decreased for the rest of storage time. In P4, the pH did not fluctuate significantly, and the maximum pH value (5.7) was recorded on day 7. In P5, the pH increased gently until day 14 (pH 5.7) and then decreased to pH 5.4 for the pad side on day 21. An entirely different pattern of pH alteration was recorded for the treatment P6 which was almost stable for the first 10 days and then dropped sharply to around pH 5.1 by day 21.
Many studies have been conducted regarding pre- and post-slaughter meat pH and impacts of meat type, packaging condition and storage time on variations of pH. Normally, microbial contamination and spoilage of meat starts from outer layers and any changes in pH of these layers is of great importance. Carse and Locker [43] examined surface pH of sheep and beef carcasses stored at 5 °C for 5 days. Over the first three days, the pH of both meat types tended to be stable, but in the subsequent two days some locations started to show a decrease or increase in pH. Conte-Junior et al. [7] applied different levels of headspace CO2 (10, 20, 30, 40 and 50%) for packaging ground beef, and they did not report any difference in pH of the meat samples within 20 days of storage at 2 °C. In Australia, according to Meat Standards Australia (MSA) the optimum pH level for meat certification is 5.7 and below [44].
As presented in Table 1, for the treatments containing the CO2 emitter pads, the meat pH exceeded this limit when it reached pH 5.9 at day 7 (for the pad side of P1) or day 10 (for both sides of P2 and the pad side of P3). The most stable pH was found for treatment P6, where the meat samples were packaged with the passive pads under 30% CO2: 70% O2. The initial increases in the levels of pH for the P1, P2 and P3 treatments could be attributed to the accumulation of basic compounds resulting from the activity of specific bacterial groups such as Brochothrix thermosphacta and Pseudomonas spp., and the later reductions of pH can be explained by dissolution of the headspace CO2 in the meat, formation of carbonic acid and gradual release and accumulation of H+ in the meats’ water [45]. Our results were in accordance with Muhlisin et al. [46], who examined the quality of beef meat in modified atmosphere packaging under 20% CO2 in combination with 0, 30 or 70% O2 and reported a gradual increase of meat pH over 12 days of cold storage. According to Borch et al. [47], fluctuation of meat pH during storage is a complex interaction between muscular glucose resources, glycolytic enzymes and activity of different bacterial groups.

3.4. Microbiological Examination

Except Enterobacteriaceae which was not detected in any of the treatments throughout the storage time, the data of the viable counts for the other microbial groups including total aerobic count, lactic acid bacteria, Brochothrix thermosphacta and Pseudomonas spp. from the meat samples under the different packaging conditions are presented in Table 2. The low number of counts from each microbial group at day zero indicates that good hygiene was practiced during preparation and packaging. Among the applied treatments, P1 and P3, which contained 1 VP and 2 MA CO2 emitter pads, respectively, plus P5, which contained 30% flushed CO2 initially, controlled the number of aerobic bacteria effectively. Treatment P2, which contained one MA pad only, recorded a higher number of bacterial growth for almost all the bacterial groups studied. For treatment P4 which had no CO2 emitter pad and an initial headspace of ambient air, a sharp increase in the number of aerobic counts (from 2.3 to 4.3 Log CFU/cm2) was recorded within the first 3 days of storage, and this growth continued to the end of the experiment and reached 6.3 Log CFU/cm2 after 21 days. This data revealed that high levels of CO2 in packages from the initial hours of storage can significantly lower the activity of aerobic bacteria. Gill and Gill [48] stated that presence of 20% CO2 in the headspace of meat packages can reduce growth of psychrotrophic microorganisms by 50%. Wang et al. [49] indicated that initial presence of 20, 60 and/or 100% CO2 in packages effectively inhibited growth of viable bacteria and delayed bacterial spoilage of smoked chicken legs.
Lactic acid bacteria (LAB) are believed to contribute to meat spoilage when there is an increased level of CO2 in packages [50]. In this experiment, the numbers of LAB grew quickly in the P6 treatment (30% CO2: 70% O2 initially) compared to the other treatments and increased from the initial level of 1.8 to 5.0 Log cfu/cm2 at day 5 and finally to 7.1 Log cfu/cm2 after 21 days of cold storage. Today, so-called high-O2 MAP (70–80% O2: 20–30% CO2) is mainly used for short-term retail packaging of fresh meat. According to the results in Table 2, some members of lactic acid bacteria can perform aerobic respiration making them facultative anaerobes with their ability to grow under high levels of CO2. Similar growth in numbers of LAB on minced buffalo meat under high-O2 MAP (80% O2: 20% CO2) was reported by Jaberi et al. [51].
For the first two weeks of storage, the P3 and P5 treatments kept their LAB contamination (5.3 and 5.5 Log cfu/cm2, respectively) at an acceptable threshold, and using CO2 emitter pads in P1 and P2 did not show any meaningful effect on LAB counts. Presence of a flora of psychrotrophic lactic acid bacteria on fresh chilled meats usually ensures extended shelf life [52]. Overall, in the treatments containing the CO2 emitter pads, the presence of LAB communities did not result in quality defects up to day 14 of the storage, and spoilage symptoms including slime formation were not detected.
Brochothrix thermosphacta is one of the most frequent spoilage bacteria of fresh meats, due to its tolerance to low-pH conditions and growth at refrigeration temperatures [53]. Among the applied treatments, P6 presented the lowest B. thermosphacta levels with no colonies for the first seven storage days, and a slow increase to 2.0 Log cfu/cm2 after 21 days of cold storage. For the CO2 emitter pad-containing treatments (P1, P2 and P3), a similar pattern of changes and moderate numbers of B. thermosphacta colonies were recorded. Treatment P4, as the control with no CO2 releasing pad and no initial flushing CO2, presented the quickest increase in B. thermosphacta colonies (3.4 Log cfu/cm2 on day 7). Thus, the activity of this fermentative bacteria can be considered as a reason for the sharp increase in the headspace CO2 in this treatment (Table 2). Presence of B. thermosphacta on meat samples even when there is no oxygen in packages can be explained by the capability of this bacterium to grow both aerobically and anaerobically which makes it a substantial meat-spoilage flora [11].
Several Pseudomonas spp. are recognized as causative agents of meat spoilage under aerobic conditions. These proteolytic bacteria can activate in a wide range of temperatures (−1 to 25 °C) and commonly break down proteins and produce a variety of odors and flavors under extended refrigerated storage [10]. The initial level of Pseudomonas contamination on day 0 was around 2 Log cfu/cm2. In the P1, P2 and P3 treatments (the trays containing the CO2 emitter pads), Pseudomonas increased slightly throughout the storage time and fluctuated between 2–3 Log cfu/cm2. Treatment P5, which started with 30% CO2: 20% O2, followed the same pattern. The most changes and the highest number of Pseudomonas counts were recorded for treatment P4 followed by P6. Treatment P4 was the only treatment which started with zero additional CO2 in the trays, and it seems that in the absence of additional CO2 and its inhibitory effect and before developing a number of LAB as competitive bacteria, Pseudomonas spp. had enough time to grow and deteriorate the P4 meat samples.

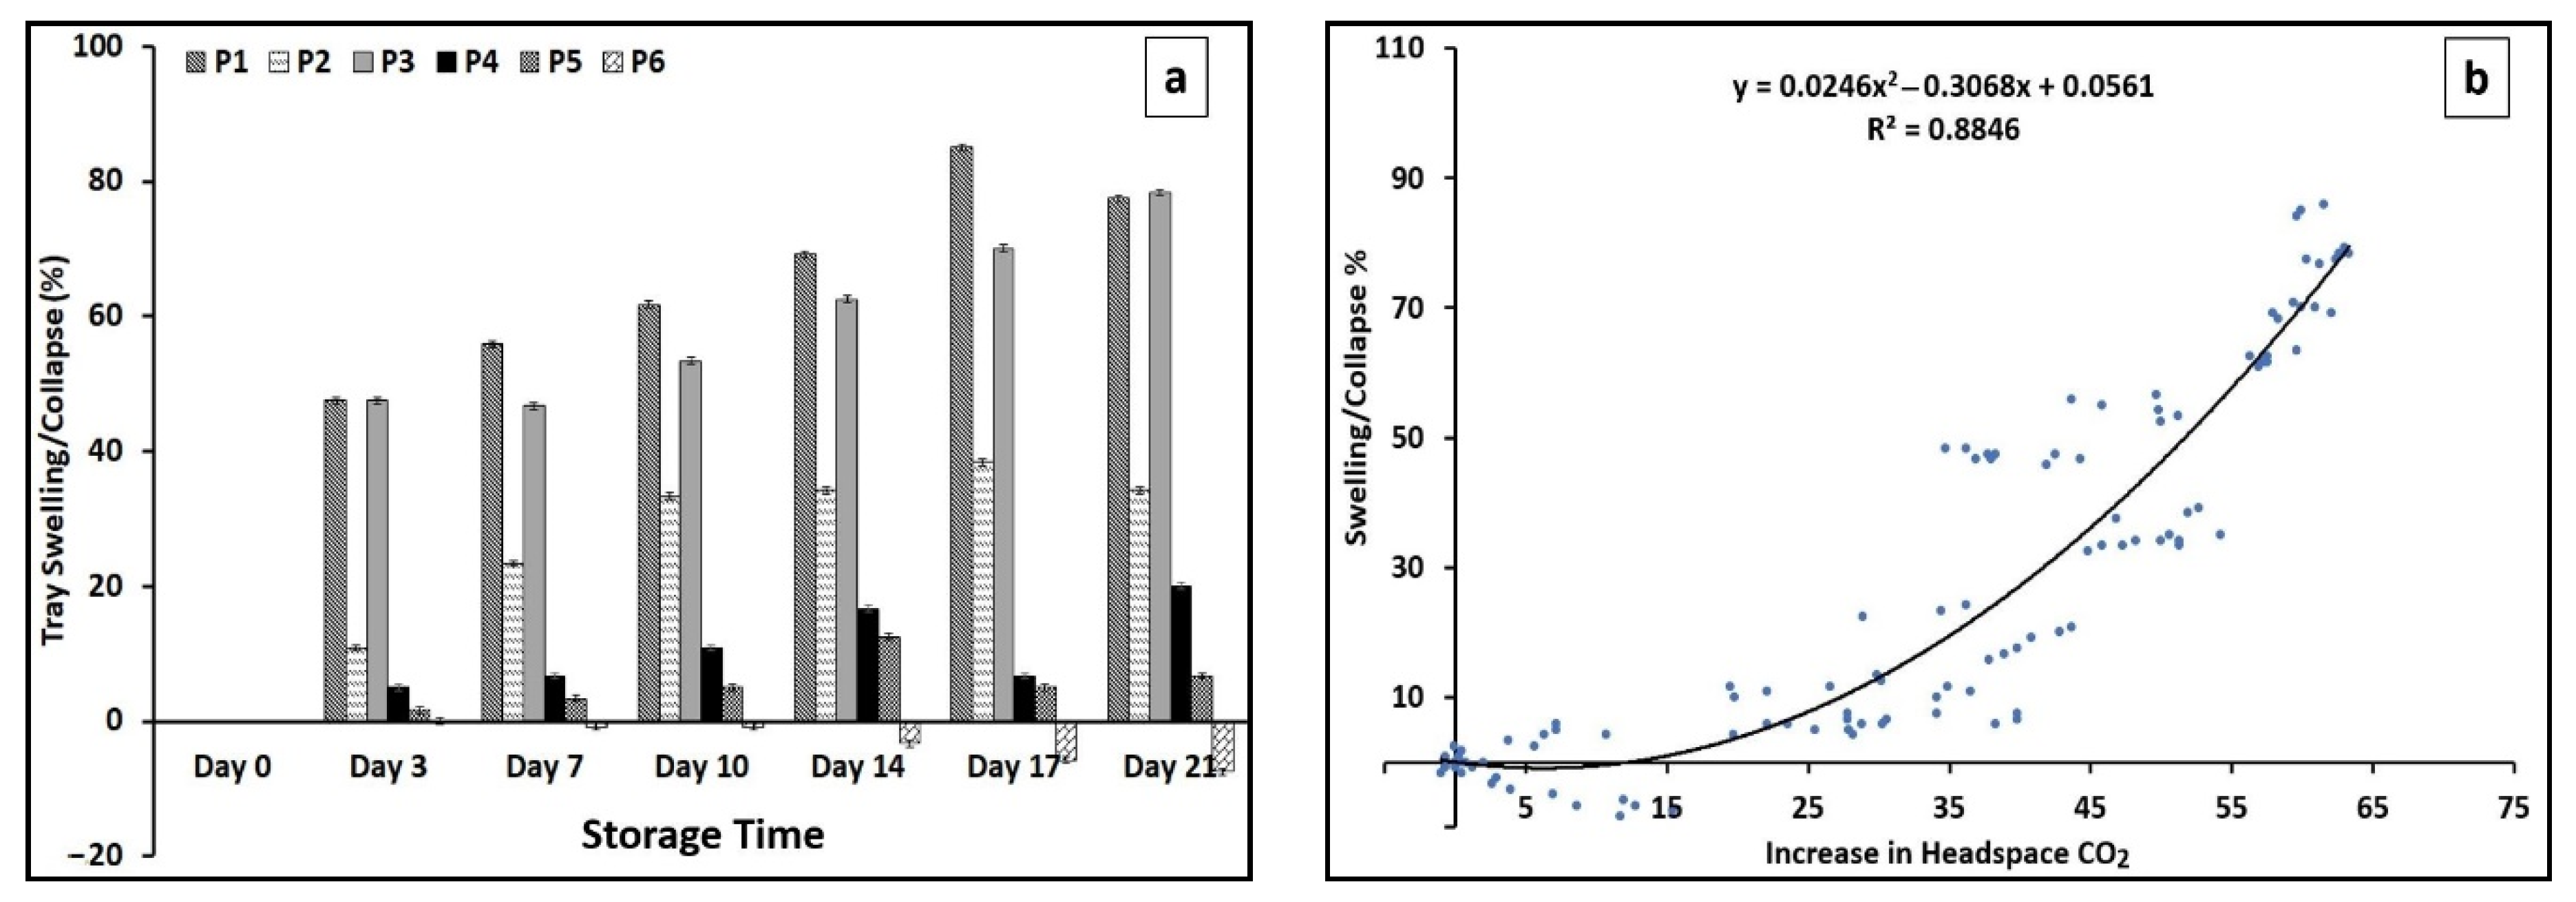
3.5. Tray Swelling/Collapse
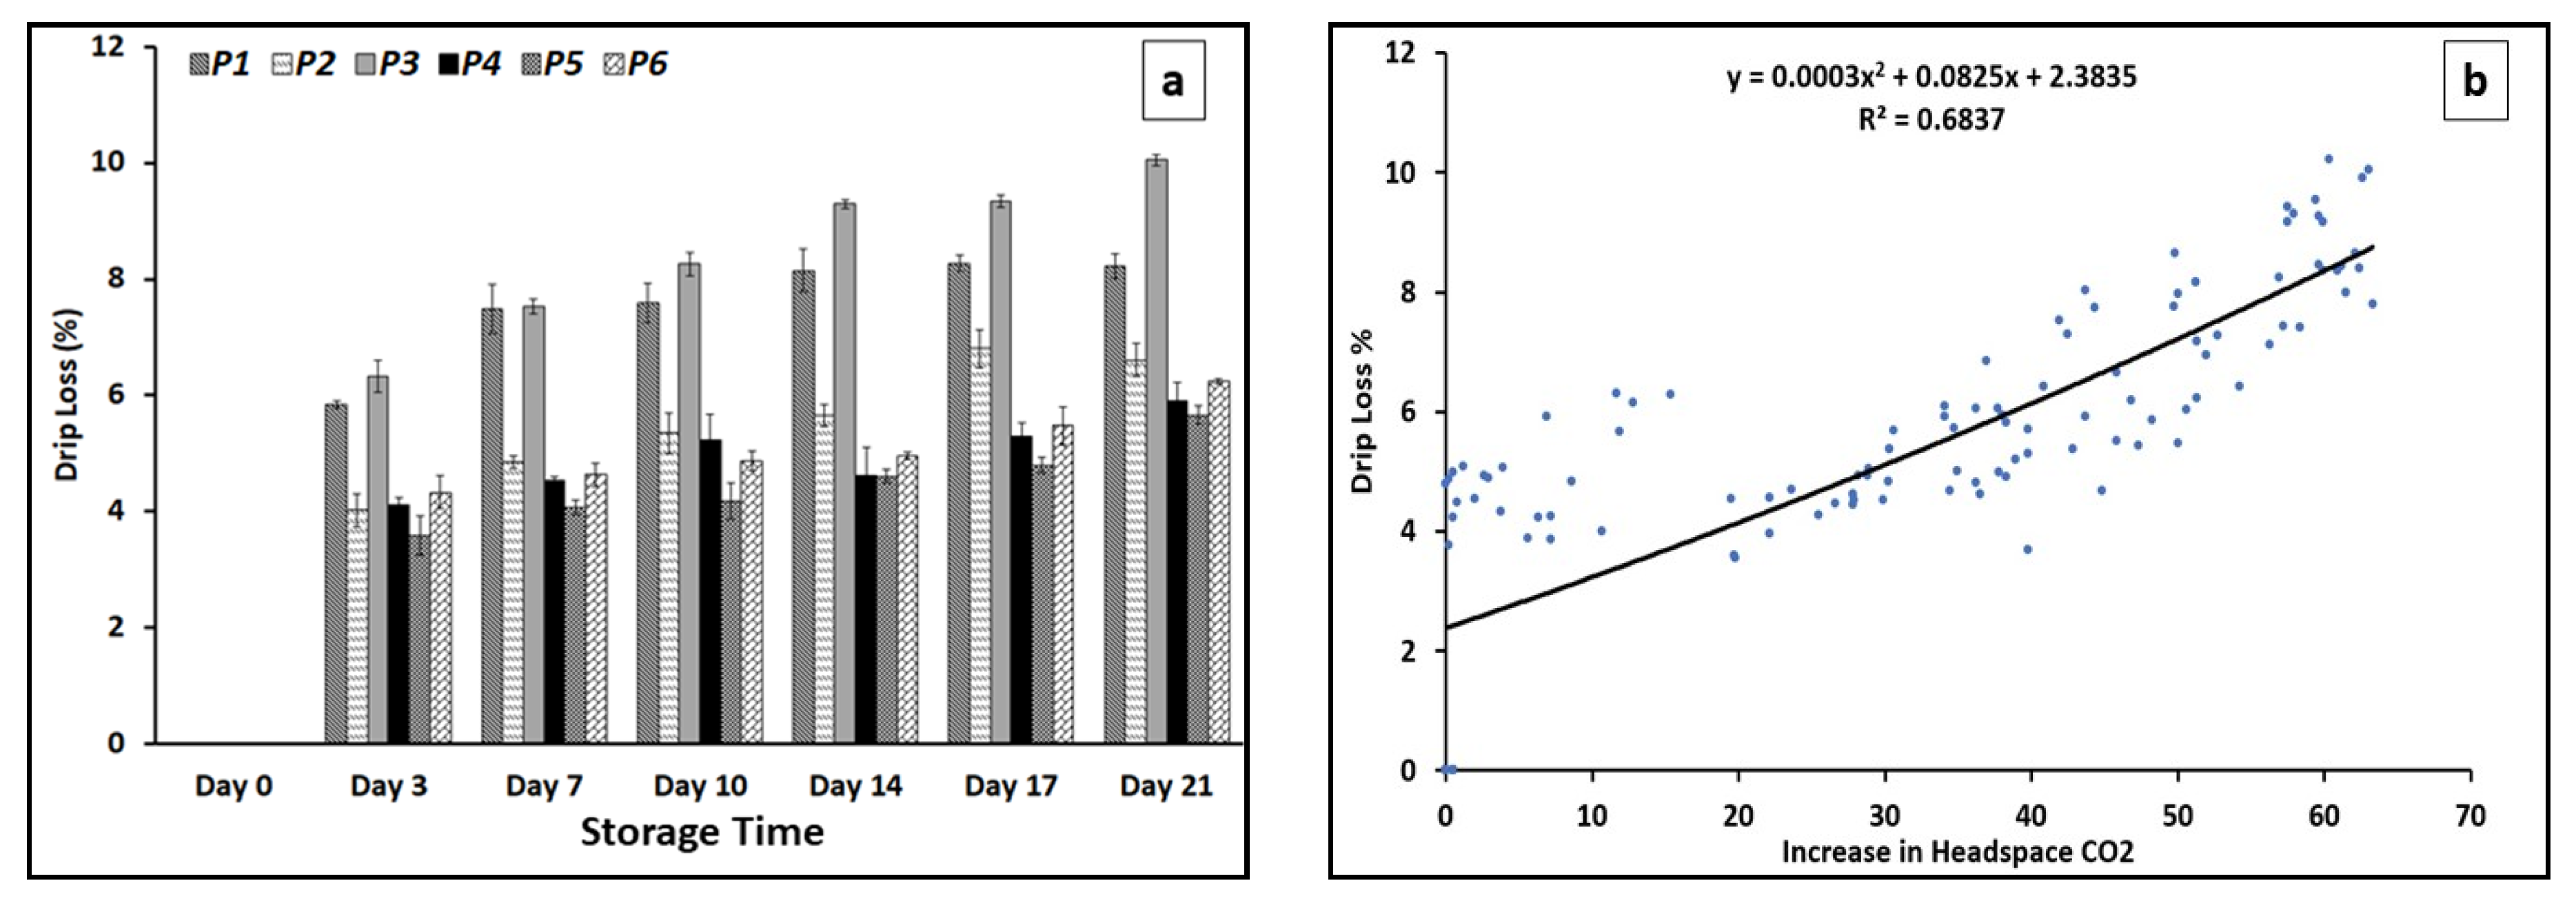
Blown packaging over storage times has been previously reported for vacuum-packaged beef and lamb meat [54]. Swollen or puffy-looking packages are considered a sign of CO2 gas release as a result of excessive growth of some types of bacteria such as psychrophilic Clostridia spp. [55]. As presented in Figure 4a, an increasing rate of package swelling throughout the storage period was recorded for almost all the treatments (except P6). The highest values of package swelling were found for treatments P1 (85%) and P3 (78%), followed by P2 (38%). This means the treatments containing the CO2 emitter pads experienced excessive accumulation of CO2 inside the packages. We used an EVOH (ethyl vinyl alcohol) with polyethylene (PE)-based film as the sealing topfilm. This film is widely used in creating MAP because of its excellent gas barrier, having high thermal resistance and high puncture resistance as well as good optical characteristics. The impermeability of the topfilm contributed to the accumulation of gases by trapping the released gases inside the package. Figure 4b, shows the linear correlation between the percentage of package swelling and the increase in the concentration of CO2 in packages which clearly confirms the role of the CO2 emitter pads in the swelling of the packages. Up to around ± 10%, changes in the package height normally didn’t affect the package shape significantly. Between the applied treatments, P5 with around 12% increase (swelling) and P6 with 7% decrease (collapse) in the tray height maintained the acceptable package shape after 21 days of storage. Collapse in meat packages normally happens when part of the headspace gases, mainly CO2, is absorbed by the meat [56]. Since interactions between product, film permeability and package size determine gas compositions inside packages, more research is required to predict the dynamics of gas exchange of packages throughout storage periods [57].

3.6. Drip Loss

In general, drip loss is a natural event, referring to loss of intramuscular fluids from meat due to gravitational forces. Water remaining in the meat is one of the most important traits of meat quality [58]. As expressed in Figure 5a, the highest rates of drip loss were recorded in the CO2 emitter pad-containing treatments (P1 and P3 followed by P2). The majority of the drip loss occurred during the first three days of storage (~6% for P1 and P3 and ~4% for P2, P4, P5 and P6) with a gradual further loss throughout the remainder of the storage time.
A negative effect of storage time on drip loss has been demonstrated previously [59]. The correlation between the increase in the headspace CO2 and the drip loss (Figure 5b) demonstrated the impact of the high levels of CO2 accumulation in the packages on the drip loss. In the CO2-releasing pad treatments, the accumulation of CO2 gas inside the packages put pressure on the package walls and the meat samples inside and resulted in the larger values of drip loss from the samples. The drip loss values in the beef meat for the P4, P5 and P6 treatments in the current study were higher than those found by Payne et al. [60] for different non-vacuum chilled beef packages but were in the range reported by Hur et al. [31] for beef meat under modified atmosphere packaging.

4. Conclusions

In conclusion, these results showed that using CO2 emitter pads could effectively control the number of aerobic counts. The highest number of aerobic counts, Pseudomonas and Brochothrix thermosphacta of the meat samples were detected in the P4 (control) where there was neither an emitter pad nor initial CO2 flushed to the trays. The sharp decreases in the headspace O2 and the excessive package swelling due to the accumulation of CO2 revealed that among the several controlling parameters in designing a successful MAP, the permeability of the packaging film to O2 and CO2 gases is very important in keeping a balanced gas–product (G:P) ratio, O2: CO2 ratio and package shape throughout storage periods. Keeping a minimum level of oxygen alongside a balanced level of high CO2 is critical in preserving attractive meat color, controlling microbial spoilage and increasing the shelf life of fresh meat. CO2 emitter pads could successfully replace the gas flushing system if they are used with an appropriate topfilm. More importantly, there is more work required to adjust the CO2-releasing capacity of gas emitters to meat type, meat and package size and the product’s expected shelf life.

Author Contributions

Conceptualization, S.M.H.M.; Methodology, S.M.H.M., M.K., A.F., P.J.T. and A.M.O.; Formal analysis, S.M.H.M.; Investigation, S.M.H.M.; Resources, P.J.T.; Writing—original draft, S.M.H.M.; Writing—review & editing, M.K., A.F., P.J.T. and A.M.O.; Supervision, M.K., A.F., P.J.T. and A.M.O.; Project administration, M.K.; Funding acquisition, P.J.T. and A.M.O. All authors have read and agreed to the published version of the manuscript.

Funding

This research was funded by Australian Meat Processor Corporation (AMPC) grant number 2016-1438.

Institutional Review Board Statement

This study did not require ethical approval.

Informed Consent Statement

Not applicable.

Data Availability Statement

The original contributions presented in the study are included in the article, further inquiries can be directed to the corresponding author.

Acknowledgments

We acknowledge Australian Meat Processor Corporation (AMPC) for financial support.

Conflicts of Interest

The authors declare no conflict of interest.

References

  1. Comi, G. Spoilage of meat and fish. In The microbiological Quality of Food; Bevilacqua, A., Corbo, M.R., Sinigaglia, M., Eds.; Woodhead Publishing: Cambridge, UK, 2017; pp. 179–210. [Google Scholar]
  2. Wang, Z.; Tu, J.; Zhou, H.; Lu, A.; Xu, B. A comprehensive insight into the effects of microbial spoilage, myoglobin autoxidation, lipid oxidation, and protein oxidation on the discoloration of rabbit meat during retail display. Meat Sci. 2021, 172, 108359. [Google Scholar] [CrossRef] [PubMed]
  3. Koutsoumanis, K.; Stamatiou, A.; Skandamis, P.; Nychas, G.J. Development of a microbial model for the combined effect of temperature and pH on spoilage of ground meat, and validation of the model under dynamic temperature conditions. Appl. Environ. Microbiol. 2006, 72, 124–134. [Google Scholar] [CrossRef] [PubMed]
  4. Trabelsi, I.; Slima, S.B.; Ktari, N.; Triki, M.; Abdehedi, R.; Abaza, W.; Moussa, H.; Abdeslam, A.; Salah, R.B. Incorporation of probiotic strain in raw minced beef meat: Study of textural modification, lipid and protein oxidation and color parameters during refrigerated storage. Meat Sci. 2019, 154, 29–36. [Google Scholar] [CrossRef] [PubMed]
  5. Iulietto, M.F.; Sechi, P.; Borgogni, E.; Cenci-Goga, B.T. Meat spoilage: A critical review of a neglected alteration due to ropy slime producing bacteria. Ital. J. Anim. Sci. 2015, 14, 4011. [Google Scholar] [CrossRef]
  6. Mortazavi, S.M.H.; Kaur, M.; Farahnaky, A.; Torley, P.J.; Osborn, A.M. The pathogenic and spoilage bacteria associated with red meat and application of different approaches of high CO2 packaging to extend product shelf-life. Crit. Rev. Food Sci. Nutr. 2023, 63, 1733–1754. [Google Scholar] [CrossRef]
  7. Conte-Junior, C.A.; Monteiro, M.L.G.; Patrícia, R.; Mársico, E.T.; Lopes, M.M.; Alvares, T.S.; Mano, S.B. The effect of different packaging systems on the shelf life of refrigerated ground beef. Foods 2020, 9, 495. [Google Scholar] [CrossRef]
  8. Chen, X.; Zhao, J.; Zhu, L.; Luo, X.; Mao, Y.; Hopkins, D.L.; Zhang, Y.; Dong, P. Effect of modified atmosphere packaging on shelf life and bacterial community of roast duck meat. Food Res. Int. 2020, 137, 109645. [Google Scholar] [CrossRef]
  9. Wang, G.; Ma, F.; Zeng, L.; Bai, Y.; Wang, H.; Xu, X.; Zhou, G. Modified atmosphere packaging decreased Pseudomonas fragi cell metabolism and extracellular proteolytic activities on meat. Food Microbiol. 2018, 76, 443–449. [Google Scholar] [CrossRef]
  10. Ercolini, D.; Russo, F.; Torrieri, E.; Masi, P.; Villani, F. Changes in the spoilage-related microbiota of beef during refrigerated storage under different packaging conditions. Appl. Environ. Microbiol. 2006, 72, 4663–4671. [Google Scholar] [CrossRef]
  11. Brooks, J.C.; Alvarado, M.; Stephens, T.P.; Kellermeier, J.D.; Tittor, A.W.; Miller, M.F.; Brashears, M.M. Spoilage and safety characteristics of ground beef packaged in traditional and modified atmosphere packages. J. Food Prot. 2008, 71, 293–301. [Google Scholar] [CrossRef]
  12. Huang, J.; Guo, Y.; Hou, Q.; Huang, M.; Zhou, X. Dynamic changes of the bacterial communities in roast chicken stored under normal and modified atmosphere packaging. J. Food Sci. 2020, 85, 1231–1239. [Google Scholar] [CrossRef] [PubMed]
  13. Berk, Z. Food Process Engineering and Technology; Academic Press: Cambridge, MA, USA, 2013; pp. 545–559. [Google Scholar]
  14. Greengrass, J. Packaging materials for MAP of foods. In Principles and Applications of Modified Atmosphere Packaging of Foods; Blakistone, B.A., Blakistone, B.A., Eds.; Springer: Boston, MA, USA, 1998; pp. 63–101. [Google Scholar]
  15. Murphy, K.M.; O’Grady, M.N.; Kerry, J.P. Effect of varying the gas headspace to meat ratio on the quality and shelf-life of beef steaks packaged in high oxygen modified atmosphere packs. Meat Sci. 2013, 94, 447–454. [Google Scholar] [CrossRef] [PubMed]
  16. Chaix, E.; Couvert, O.; Guillaume, C.; Gontard, N.; Guillard, V. Predictive microbiology coupled with gas (O2/CO2) transfer in food/packaging systems: How to develop an efficient decision support tool for food packaging dimensioning. Compr. Rev. Food Sci. Food Saf. 2015, 14, 1–21. [Google Scholar] [CrossRef] [PubMed]
  17. Manu-Tawiah, W. Microbiological, Physical and Chemical Studies on Fresh Red Meats Packaged under Different Modified Gas Atmospheres; Iowa State University: Ames, IA, USA, 1991. [Google Scholar]
  18. Gokoglu, N.; Yerlikaya, P.; Uran, H.; Topuz, O.K. The effect of modified atmosphere packaging on the quality and shelf life of frankfurter type-sausages. J. Food Qual. 2010, 33, 367–380. [Google Scholar] [CrossRef]
  19. Rodrigues, I.; Trindade, M.A.; Palu, A.F.; Baldin, J.C.; de Lima, C.G.; de Alvarenga Freire, M.T. Modified atmosphere packaging for lamb meat: Evaluation of gas composition in the extension of shelf life and consumer acceptance. J. Food Sci. Technol. 2018, 55, 3547–3555. [Google Scholar] [CrossRef]
  20. Vergara, H.; Berruga, M.I.; Linares, M.B. Effect of gas composition on rabbit meat quality in modified atmosphere packaging. J. Sci. Food Agric. 2005, 85, 1981–1986. [Google Scholar] [CrossRef]
  21. Bagdatli, A.; Kayaardi, S. Influence of storage period and packaging methods on quality attributes of fresh beef steaks. CyTA-J. Food 2015, 13, 124–133. [Google Scholar] [CrossRef]
  22. Clausen, I.; Madsen, N.T. Sensory evaluation of ground beef stored in different atmospheres. In Proceedings of the 51st International Congress of Meat Science and Technology, Baltimore, MD, USA, 7–12 August 2005. [Google Scholar]
  23. Boz, Z.; Welt, B.A.; Brecht, J.K.; Pelletier, W.; McLamore, E.; Kiker, G.A.; Butler, J.E. Review of challenges and advances in modification of food package headspace gases. J. Appl. Packag. Res. 2018, 10, 1. [Google Scholar]
  24. Ghris, S. Effect of the carbon dioxide grinding on modified atmosphere and color shelf life of ground beef. Available online: https://www.proquest.com/docview/304892671?fromopenview=true&pq-origsite=gscholar (accessed on 14 July 2023).
  25. Vilela, C.; Kurek, M.; Hayouka, Z.; Röcker, B.; Yildirim, S.; Antunes, M.D.C.; Nilsen-Nygaard, J.; Pettersen, M.K.; Freire, C.S. A concise guide to active agents for active food packaging. Trends Food Sci. Technol. 2018, 80, 212–222. [Google Scholar] [CrossRef]
  26. Hansen, A.Å.; Høy, M.; Pettersen, M.K. Prediction of optimal CO2 emitter capacity developed for modified atmosphere packaging of fresh salmon fillets (Salmo salar L.). Packag. Technol. Sci. Int. J. 2009, 22, 199–208. [Google Scholar] [CrossRef]
  27. Tsironi, T.; Ntzimani, A.; Gogou, E.; Tsevdou, M.; Semenoglou, I.; Dermesonlouoglou, E.; Taoukis, P. Modeling the effect of active modified atmosphere packaging on the microbial stability and shelf life of gutted sea bass. Appl. Sci. 2019, 9, 5019. [Google Scholar] [CrossRef]
  28. Hansen, A.A.; Moen, B.; Rødbotten, M.; Berget, I.; Pettersen, M.K. Effect of vacuum or modified atmosphere packaging (MAP) in combination with a CO2 emitter on quality parameters of cod loins (Gadus morhua). Food Packag. Shelf Life 2016, 9, 29–37. [Google Scholar] [CrossRef]
  29. Holck, A.L.; Pettersen, M.K.; Moen, M.H.; Sørheim, O. Prolonged shelf life and reduced drip loss of chicken filets by the use of carbon dioxide emitters and modified atmosphere packaging. J. Food Prot. 2014, 77, 1133–1141. [Google Scholar] [CrossRef] [PubMed]
  30. Pettersen, M.K.; Hansen, A.Å.; Mielnik, M. Effect of different packaging methods on quality and shelf life of fresh reindeer meat. Packag. Technol. Sci. 2014, 27, 987–997. [Google Scholar] [CrossRef]
  31. Hur, S.J.; Jin, S.K.; Park, J.H.; Jung, S.W.; Lyu, H.J. Effect of modified atmosphere packaging and vacuum packaging on quality characteristics of low grade beef during cold storage. Asian-Australas. J. Anim. Sci. 2013, 26, 1781–1789. [Google Scholar] [CrossRef]
  32. Łopacka, J.; Półtorak, A.; Wierzbicka, A. Effect of MAP, vacuum skin-pack and combined packaging methods on physicochemical properties of beef steaks stored up to 12 days. Meat Sci. 2016, 119, 147–153. [Google Scholar] [CrossRef]
  33. ISO 6887-2; Microbiology of the Food Chain—Preparation of Test Samples, Initial Suspension and Decimal Dilutions for Microbiological Examination Part 2: Specific Rules for the Preparation of Meat and Meat Products. International Organization for Standardization: Geneva, Switzerland, 2017.
  34. Xu, M.M.; Kaur, M.; Pillidge, C.J.; Torley, P.J. Evaluation of the potential of protective cultures to extend the microbial shelf-life of chilled lamb meat. Meat Sci. 2021, 181, 108613. [Google Scholar] [CrossRef]
  35. Dumont, M.J.; Orsat, V.; Raghavan, V. Reducing postharvest losses. In Emerging Technologies for Promoting Food Security; Madramootoo, C., Ed.; Woodhead Publishing: Cambridge, UK, 2016; pp. 135–156. [Google Scholar]
  36. Jakobsen, M.; Bertelsen, G. Solubility of carbon dioxide in fat and muscle tissue. J. Muscle Foods 2006, 17, 9–19. [Google Scholar] [CrossRef]
  37. Kolbeck, S.; Reetz, L.; Hilgarth, M.; Vogel, R.F. Quantitative oxygen consumption and respiratory activity of meat spoiling bacteria upon high oxygen modified atmosphere. Front. Microbiol. 2019, 10, 2398. [Google Scholar] [CrossRef]
  38. Esmer, O.K.; Irkin, R.; Degirmencioglu, N.; Degirmencioglu, A. The effects of modified atmosphere gas composition on microbiological criteria, color and oxidation values of minced beef meat. Meat Sci. 2011, 88, 221–226. [Google Scholar] [CrossRef]
  39. Rouger, A.; Moriceau, N.; Prévost, H.; Remenant, B.; Zagorec, M. Diversity of bacterial communities in French chicken cuts stored under modified atmosphere packaging. Food Microbiol. 2018, 70, 7–16. [Google Scholar] [CrossRef] [PubMed]
  40. Holman, B.W.B.; van de Ven, R.J.; Mao, Y.; Coombs, C.E.; Hopkins, D.L. Using instrumental (CIE and reflectance) measures to predict consumers’ acceptance of beef colour. Meat Sci. 2017, 127, 57–62. [Google Scholar] [CrossRef] [PubMed]
  41. Yang, X.; Zhang, Y.; Luo, X.; Zhang, Y.; Zhu, L.; Xu, B.; Hopkins, D.L.; Liang, R. Influence of oxygen concentration on the fresh and internal cooked color of modified atmosphere packaged dark-cutting beef stored under chilled and superchilled conditions. Meat Sci. 2022, 188, 108773. [Google Scholar] [CrossRef] [PubMed]
  42. Danijela, Š.Z.; Vera, L.L.; Ljubinko, L.B.; Lato, P.L.; Vladimir, T.M.; Nevena, H.M. Effect of specific packaging conditions on myoglobin and meat color. Food Feed. Res. 2013, 40, 1–10. [Google Scholar]
  43. Carse, W.A.; Locker, R.H. A survey of pH values at the surface of beef and lamb carcasses, stored in a chiller. J. Sci. Food Agric. 1974, 25, 1529–1535. [Google Scholar] [CrossRef]
  44. Meat Standards Australia, Beef. Available online: https://www.mla.com.au/marketing-beef-and-lamb/meat-standards-australia/. (accessed on 13 September 2024).
  45. Feiner, G. The microbiology of specific bacteria. In Meat Products Handbook: Practical Science and Technology; Feiner, G., Ed.; Elsevier: Amsterdam, The Netherlands, 2006; pp. 595–615. [Google Scholar]
  46. Borch, E.; Kant-Muermans, M.L.; Blixt, Y. Bacterial spoilage of meat and cured meat products. Int. J. Food Microbiol. 1996, 33, 103–120. [Google Scholar] [CrossRef]
  47. Muhlisin; Panjono; Kim, D.S.; Song, Y.R.; Lee, S.J.; Lee, J.K.; Lee, S.K. Effects of gas composition in the modified atmosphere packaging on the shelf-life of Longissimus dorsi of Korean native black pigs-duroc crossbred during refrigerated storage. Asian-Australas. J. Anim. Sci. 2014, 27, 1157–1163. [Google Scholar]
  48. Gill, A.O.; Gill, C.O. Preservative packaging for fresh meats, poultry, and fin fish. In Innovations in Food Packaging; Han, J.H., Ed.; Academic Press: Cambridge, MA, USA, 2005; pp. 204–226. [Google Scholar]
  49. Wang, Q.; Chen, Q.; Xu, J.; Sun, F.; Liu, H.; Kong, B. Effects of modified atmosphere packaging with various CO2 concentrations on the bacterial community and shelf-life of smoked chicken Legs. Foods 2022, 11, 559. [Google Scholar] [CrossRef]
  50. Doulgeraki, A.I.; Paramithiotis, S.; Kagkli, D.M.; Nychas, G.J.E. Lactic acid bacteria population dynamics during minced beef storage under aerobic or modified atmosphere packaging conditions. Food Microbiol. 2010, 27, 1028–1034. [Google Scholar] [CrossRef]
  51. Jaberi, R.; Kaban, G.; Kaya, M. Effects of vacuum and high-oxygen modified atmosphere packaging on physico-chemical and microbiological properties of minced water buffalo meat. Asian-Australas. J. Anim. Sci. 2019, 32, 421–429. [Google Scholar] [CrossRef]
  52. Egan, A.F. Lactic acid bacteria of meat and meat products. Antonie Van Leeuwenhoek 1983, 49, 327–336. [Google Scholar] [CrossRef] [PubMed]
  53. Stanborough, T.; Fegan, N.; Powell, S.M.; Tamplin, M.; Chandry, P.S. Insight into the genome of Brochothrix thermosphacta, a problematic meat spoilage bacterium. Appl. Environ. Microbiol. 2017, 83, e02786-16. [Google Scholar] [CrossRef] [PubMed]
  54. Clemens, R.M.; Adam, K.H.; Brightwell, G. Contamination levels of Clostridium estertheticum spores that result in gaseous spoilage of vacuum-packaged chilled beef and lamb meat. Lett. Appl. Microbiol. 2010, 50, 591–596. [Google Scholar] [CrossRef] [PubMed]
  55. Broda, D.M.; Bell, R.G.; Boerema, J.A.; Musgrave, D.R. The abattoir source of culturable psychrophilic Clostridium spp. causing ‘blown pack’ spoilage of vacuum-packed chilled venison. J. Appl. Microbiol. 2002, 93, 817–824. [Google Scholar] [CrossRef]
  56. Gurunathan, K.; Tahseen, A.; Manyam, S. Effect of aerobic and modified atmosphere packaging on quality characteristics of chicken leg meat at refrigerated storage. Poult. Sci. 2022, 101, 102170. [Google Scholar] [CrossRef]
  57. Rodriguez-Aguilera, R.; Oliveira, J.C.; Montanez, J.C.; Mahajan, P.V. Gas exchange dynamics in modified atmosphere packaging of soft cheese. J. Food Eng. 2009, 95, 438–445. [Google Scholar] [CrossRef]
  58. Watanabe, G.; Motoyama, M.; Nakajima, I.; Sasaki, K. Relationship between water-holding capacity and intramuscular fat content in Japanese commercial pork loin. Asian-Australas. J. Anim. Sci. 2018, 31, 914–918. [Google Scholar] [CrossRef]
  59. Marcinkowska-Lesiak, M.; Zdanowska-Sąsiadek, Ż.; Stelmasiak, A.; Damaziak, K.; Michalczuk, M.; Poławska, E.; Wyrwisz, J.; Wierzbicka, A. Effect of packaging method and cold-storage time on chicken meat quality. CyTA-J. Food 2016, 14, 41–46. [Google Scholar] [CrossRef]
  60. Payne, S.R.; Durham, C.J.; Scott, S.M.; Devine, C.E. The effects of non-vacuum packaging systems on drip loss from chilled beef. Meat Sci. 1998, 49, 277–287. [Google Scholar] [CrossRef]
Figure 1. Illustration of the packaging treatments.
Foods 13 02913 g001
Figure 2. Headspace gas compositions of the packaged beef slices over 21 days of storage at 4 °C. P1, 1 VP pad/air as headspace; P2, 1 MA pad/air as headspace; P3, 2 MA pads/air as headspace; P4, 1 passive pad/air as headspace; P5, 1 passive pad/30% CO2: 20% O2: 50% N2 as headspace; P6, 1 passive pad/30% CO2: 70% O2 as headspace.
Foods 13 02913 g002
Figure 3. The a* values (red lines) and b* values (black lines) of top sides (solid lines) and pad sides (dashed lines) of meat samples under applied treatments. P1, 1 VP pad/air as headspace; P2, 1 MA pad/air as headspace; P3, 2 MA pads/air as headspace; P4, 1 passive pad/air as headspace; P5, 1 passive pad/30% CO2: 20% O2 as headspace; P6, 1 passive pad/30% CO2: 70% O2 as headspace.
Foods 13 02913 g003aFoods 13 02913 g003b
Figure 4. The rates of tray swelling/collapse ± SE (a) and the correlations between swelling/collapse percent and increase in the headspace CO2 (b). P1, 1 VP pad/air as headspace; P2, 1 MA pad/air as headspace; P3, 2 MA pads/air as headspace; P4, 1 passive pad/air as headspace; P5, 1 passive pad/30% CO2: 20% O2 as headspace; P6, 1 passive pad/30% CO2: 70% O2 as headspace.
Foods 13 02913 g004
Figure 5. Drip loss formation ± SE (a) and the correlation between drip loss % and increase in headspace CO2 (b). P1, 1 VP pad/air as headspace; P2, 1 MA pad/air as headspace; P3, 2 MA pads/air as headspace; P4, 1 passive pad/air as headspace; P5, 1 passive pad/30% CO2: 20% O2 as headspace; P6, 1 passive pad/30% CO2: 70% O2 as headspace.
Foods 13 02913 g005
Table 1. The pH values of both beef sample sides during 21 days of cold storage under different packaging conditions.
CodePackagingMeat SideStorage Time
(Headspace/Pad)Day 0Day 3Day 7Day 10Day 14Day 17Day 21
P1Air/1 VPTop5.3 ± 0.05.6 ± 0.05.7 ± 0.05.8 ± 0.15.8 ± 0.05.8 ± 0.05.7 ± 0.0
Down5.3 ± 0.05.6 ± 0.15.9 ± 0.05.9 ± 0.06.0 ± 0.15.9 ± 0.05.7 ± 0.0
P2Air/1 MATop5.3 ± 0.05.6 ± 0.05.7 ± 0.05.8 ± 0.05.8 ± 0.05.7 ± 0.05.7 ± 0.0
Down5.3 ± 0.05.6 ± 0.05.7 ± 0.05.9 ± 0.05.9 ± 0.05.8 ± 0.15.6 ± 0.0
P3Air/2 MATop5.3 ± 0.05.6 ± 0.05.7 ± 0.15.7 ± 0.15.8 ± 0.05.9 ± 0.05.7 ± 0.0
Down5.3 ± 0.05.7 ± 0.05.7 ± 0.05.9 ± 0.15.9 ± 0.05.9 ± 0.05.7 ± 0.0
P4Air/1 PPTop5.3 ± 0.05.6 ± 0.15.7 ± 0.15.6 ± 0.05.6 ± 0.15.6 ± 0.15.5 ± 0.0
Down5.3 ± 0.05.6 ± 0.05.7 ± 0.15.6 ± 0.05.6 ± 0.05.5 ± 0.15.5 ± 0.0
P530% CO2: 20% O2/1 PPTop5.3 ± 0.05.6 ± 0.05.6 ± 0.05.7 ± 0.05.7 ± 0.05.6 ± 0.05.5 ± 0.0
Down5.3 ± 0.05.6 ± 0.05.6 ± 0.05.7 ± 0.05.7 ± 0.15.6 ± 0.05.4 ± 0.0
P630% CO2: 70% O2/1 PPTop5.3 ± 0.05.5 ± 0.05.6 ± 0.05.6 ± 0.05.3 ± 0.05.3 ± 0.05.1 ± 0.0
Down5.3 ± 0.05.6 ± 0.05.6 ± 0.05.6 ± 0.15.3 ± 0.05.2 ± 0.05.1 ± 0.0
Table 2. Viable counts of different bacterial groups on meat surfaces (Log CFU/cm2 ± SE) during 21 days of cold storage under different packaging conditions.
CodePackaging (P)Storage Time (T)LSD
(Headspace/Pad) Day 0 Day 3Day 7Day 10Day 14Day 17Day 21(S × T)
Aerobic CountsP1Air/1 VP2.3 ± 0.22.7 ± 0.12.8 ± 0.23.9 ± 0.25.1 ± 0.25.4 ± 0.05.5 ± 0.10.63
P2Air/1 MA2.3 ± 0.23.0 ± 0.23.1 ± 0.54.2 ± 0.15.2 ± 0.15.8 ± 0.15.2 ± 0.5
P3Air/2 MA2.3 ± 0.22.4 ± 0.32.8 ± 0.33.6 ± 0.55.1 ± 0.15.6 ± 0.15.7 ± 0.4
P4Air/1 PP2.3 ± 0.24.3 ± 0.44.3 ± 0.24.6 ± 0.05.8 ± 0.15.9 ± 0.16.3 ± 0.1
P530% CO2: 20% O2/1 PP2.3 ± 0.22.5 ± 0.12.6 ± 0.13.6 ± 0.54.7 ± 0.15.5 ± 0.25.7 ± 0.3
P630% CO2: 70% O2/1 PP2.3 ± 0.23.5 ± 0.13.5 ± 0.24.3 ± 0.14.8 ± 0.46.4 ± 0.16.4 ± 0.1
Lactic acid bacteriaP1Air/1 VP1.8 ± 0.12.1 ± 0.23.8 ± 0.35.2 ± 0.25.9 ± 0.16.4 ± 0.06.8 ± 0.10.62
P2Air/1 MA1.8 ± 0.12.1 ± 0.13.7 ± 0.25.4 ± 0.35.5 ± 0.25.9 ± 0.26.6 ± 0.1
P3Air/2 MA1.8 ± 0.11.9 ± 0.33.5 ± 0.54.4 ± 0.55.3 ± 0.16.0 ± 0.16.5 ± 0.1
P4Air/1 PP1.8 ± 0.12.8 ± 0.44.3 ± 0.24.9 ± 0.25.5 ± 0.15.9 ± 0.16.3 ± 0.2
P530% CO2: 20% O2/1 PP1.8 ± 0.12.4 ± 0.43.5 ± 0.54.9 ± 0.25.5 ± 0.25.7 ± 0.26.1 ± 0.2
P630% CO2: 70% O2/1 PP1.7 ± 0.13.2 ± 0.05.0 ± 0.25.8 ± 0.16.1 ± 0.16.7 ± 0.17.1 ± 0.2
Brochothrix
thermosphacta
P1Air/1 VP0.0 ± 0.00.6 ± 0.11.7 ± 0.02.4 ± 0.22.5 ± 0.22.6 ± 0.12.3 ± 0.10.91
P2Air/1 MA0.0 ± 0.01.2 ± 0.62.3 ± 0.12.8 ± 0.02.7 ± 0.32.4 ± 0.12.0 ± 0.3
P3Air/2 MA0.0 ± 0.01.1 ± 0.51.6 ± 0.82.0 ± 0.22.4 ± 0.12.4 ± 0.12.4 ± 0.2
P4Air/1 PP0.0 ± 0.02.2 ± 0.53.4 ± 0.23.1 ± 0.13.0 ± 0.12.5 ± 0.22.1 ± 0.3
P530% CO2: 20% O2/1 PP0.0 ± 0.00.0 ± 0.00.0 ± 0.01.4 ± 0.72.1 ± 0.42.1 ± 0.32.0 ± 0.1
P630% CO2: 70% O2/1 PP0.0 ± 0.00.0 ± 0.00.0 ± 0.01.6 ± 0.81.9 ± 0.11.8 ± 0.01.9 ± 0.1
Pseudomonas spp.P1Air/1 VP1.7 ± 0.12.6 ± 0.02.4 ± 0.42.0 ± 0.12.2 ± 0.12.1 ± 0.12.1 ± 0.20.79
P2Air/1 MA1.7 ± 0.11.9 ± 0.92.3 ± 0.22.7 ± 0.22.2 ± 0.22.4 ± 0.31.7 ± 0.1
P3Air/2 MA1.7 ± 0.11.6 ± 0.82.1 ± 0.32.2 ± 0.22.6 ± 0.22.1 ± 0.02.1 ± 0.3
P4Air/1 PP1.7 ± 0.13.4 ± 0.24.0 ± 0.13.9 ± 0.03.9 ± 0.13.7 ± 0.13.6 ± 0.1
P530% CO2: 20% O2/1 PP1.7 ± 0.11.8 ± 0.01.9 ± 0.12.2 ± 0.32.4 ± 0.22.8 ± 0.12.4 ± 0.2
P630% CO2: 70% O2/1 PP1.7 ± 0.12.8 ± 0.03.2 ± 0.13.8 ± 0.33.7 ± 0.13.4 ± 0.13.3 ± 0.0
Disclaimer/Publisher’s Note: The statements, opinions and data contained in all publications are solely those of the individual author(s) and contributor(s) and not of MDPI and/or the editor(s). MDPI and/or the editor(s) disclaim responsibility for any injury to people or property resulting from any ideas, methods, instructions or products referred to in the content.

