
Carob (Ceratonia siliqua) Flour as Source of Bioactive Compounds: Production, Characterization and Nutraceutical Value


 , ,
, ,
Abstract
1. Introduction
2. Methods
2.1. CF Production
2.2. Galactomannan Quantification
2.3. Carbohydrate Determination by Gas Chromatography
2.4. Size-Exclusion High-Performance Liquid Chromatography (HPSEC)
2.5. Sodium Dodecyl Sulfate-Polyacrylamide Gel Electrophoresis (SDS-PAGE)
2.6. Protein Quantification
- (i)
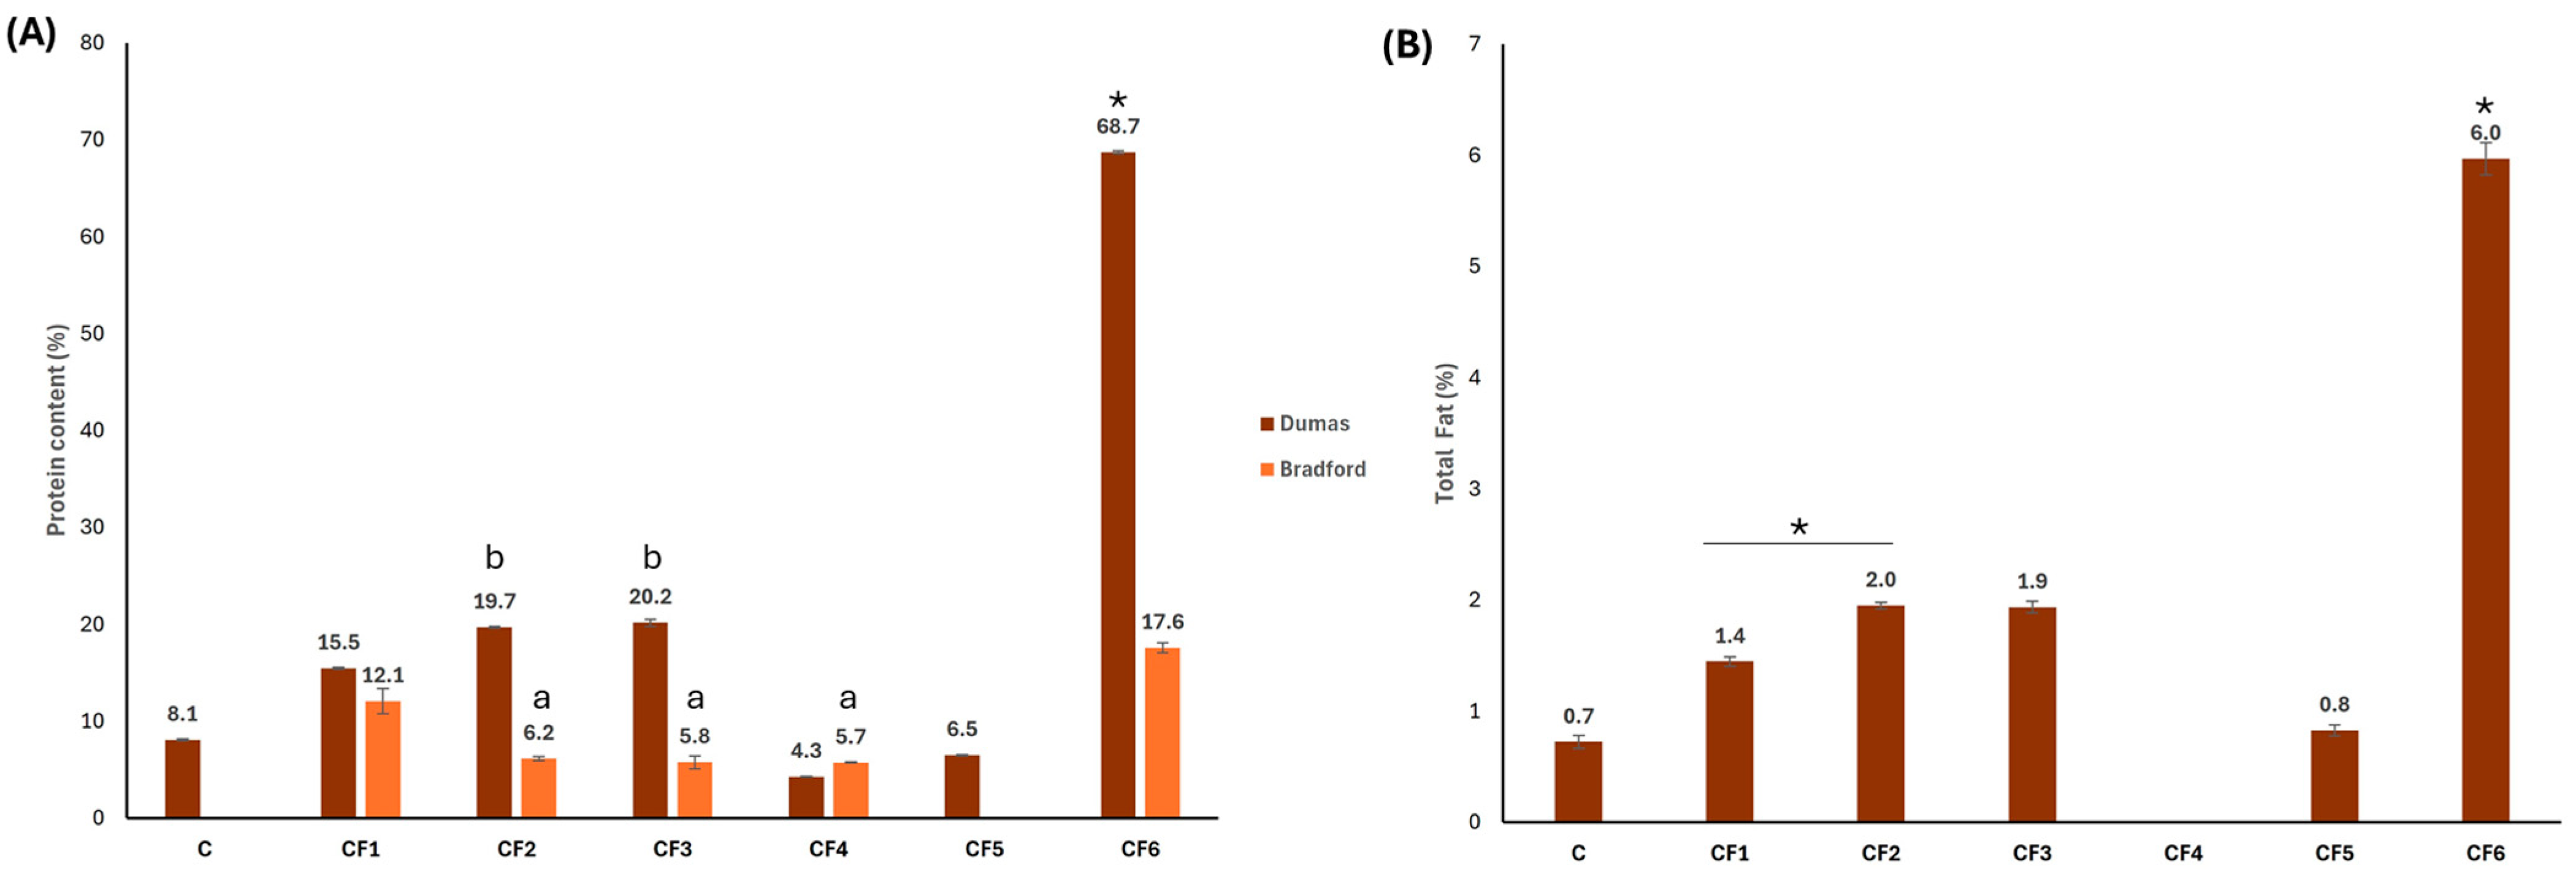
- Bradford was used to quantify soluble protein by dissolving the carob gum in water and centrifugated at 10,000 rpm for 5 min [28]. Then supernatants were mixed with Bradford reagent (Merck, Darmstadt, Germany) and incubated at room temperature for 5 min. The absorbance was measured at 595 nm using an Epoch™ spectrophotometer (Bioteck, Winooski, VT, USA) and bovine serum albumin (Merck, Darmstadt, Germany) was used as a standard to generate a calibration curve.
- (ii)
- DUMAS was used to assess total nitrogen content. This technique involved the combustion of the whole sample in an oxygen-rich, high-temperature chamber. The carbon dioxide (CO2), water and produced nitrogen passed through specialized columns that absorb CO2 and water. Subsequently, a column equipped with a thermal conductivity detector at the end was used to isolate the nitrogen from any remaining CO2 and water, allowing the measurement of the nitrogen content. The equipment used for the protein determination was Trumac 828 Series (Leco, St. Joseph, MO, USA).
2.7. Fatty Acid Methyl Ester (FAME) Analysis
2.8. Soxhlet Fat Extraction
2.9. β-Sitosterol Determination
2.10. Proteomics
2.10.1. Protein Digestion
2.10.2. Reverse Phase–Liquid Chromatography RP-LC-MS/MS Analysis (Dynamic Exclusion Mode)
2.10.3. Data Processing
2.11. Statistical Analysis
3. Results
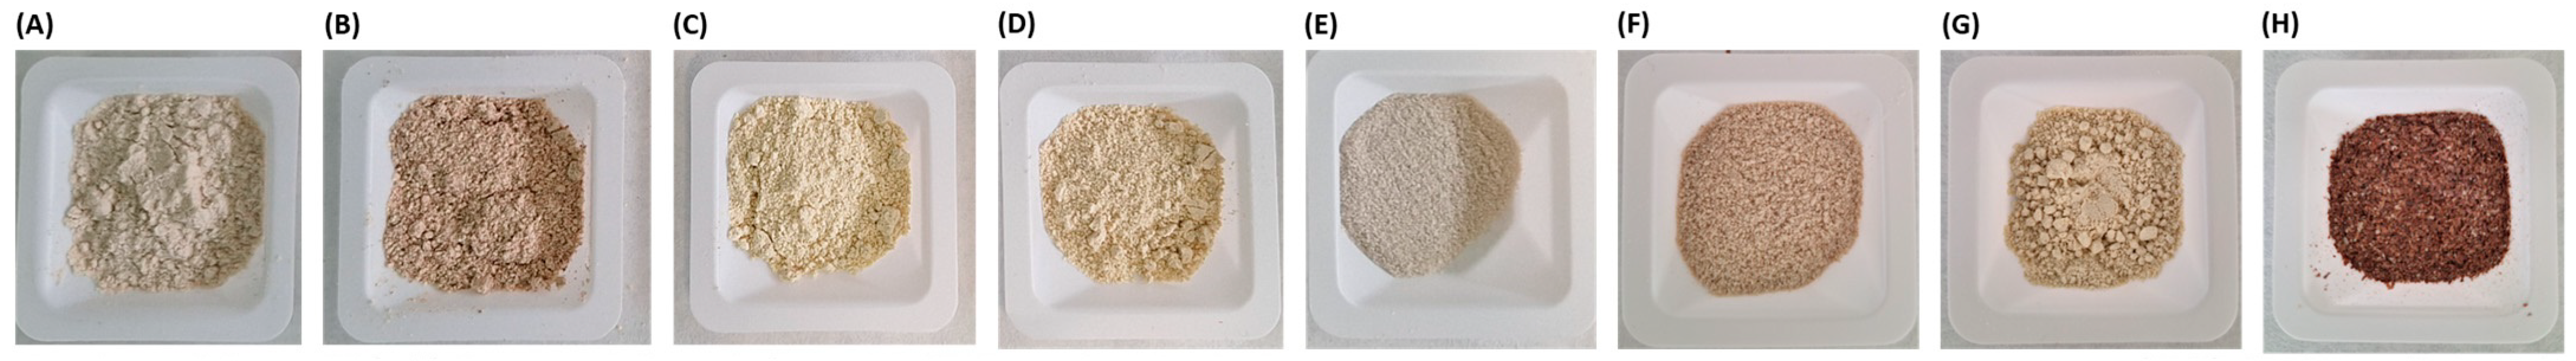
3.1. Carob Flours
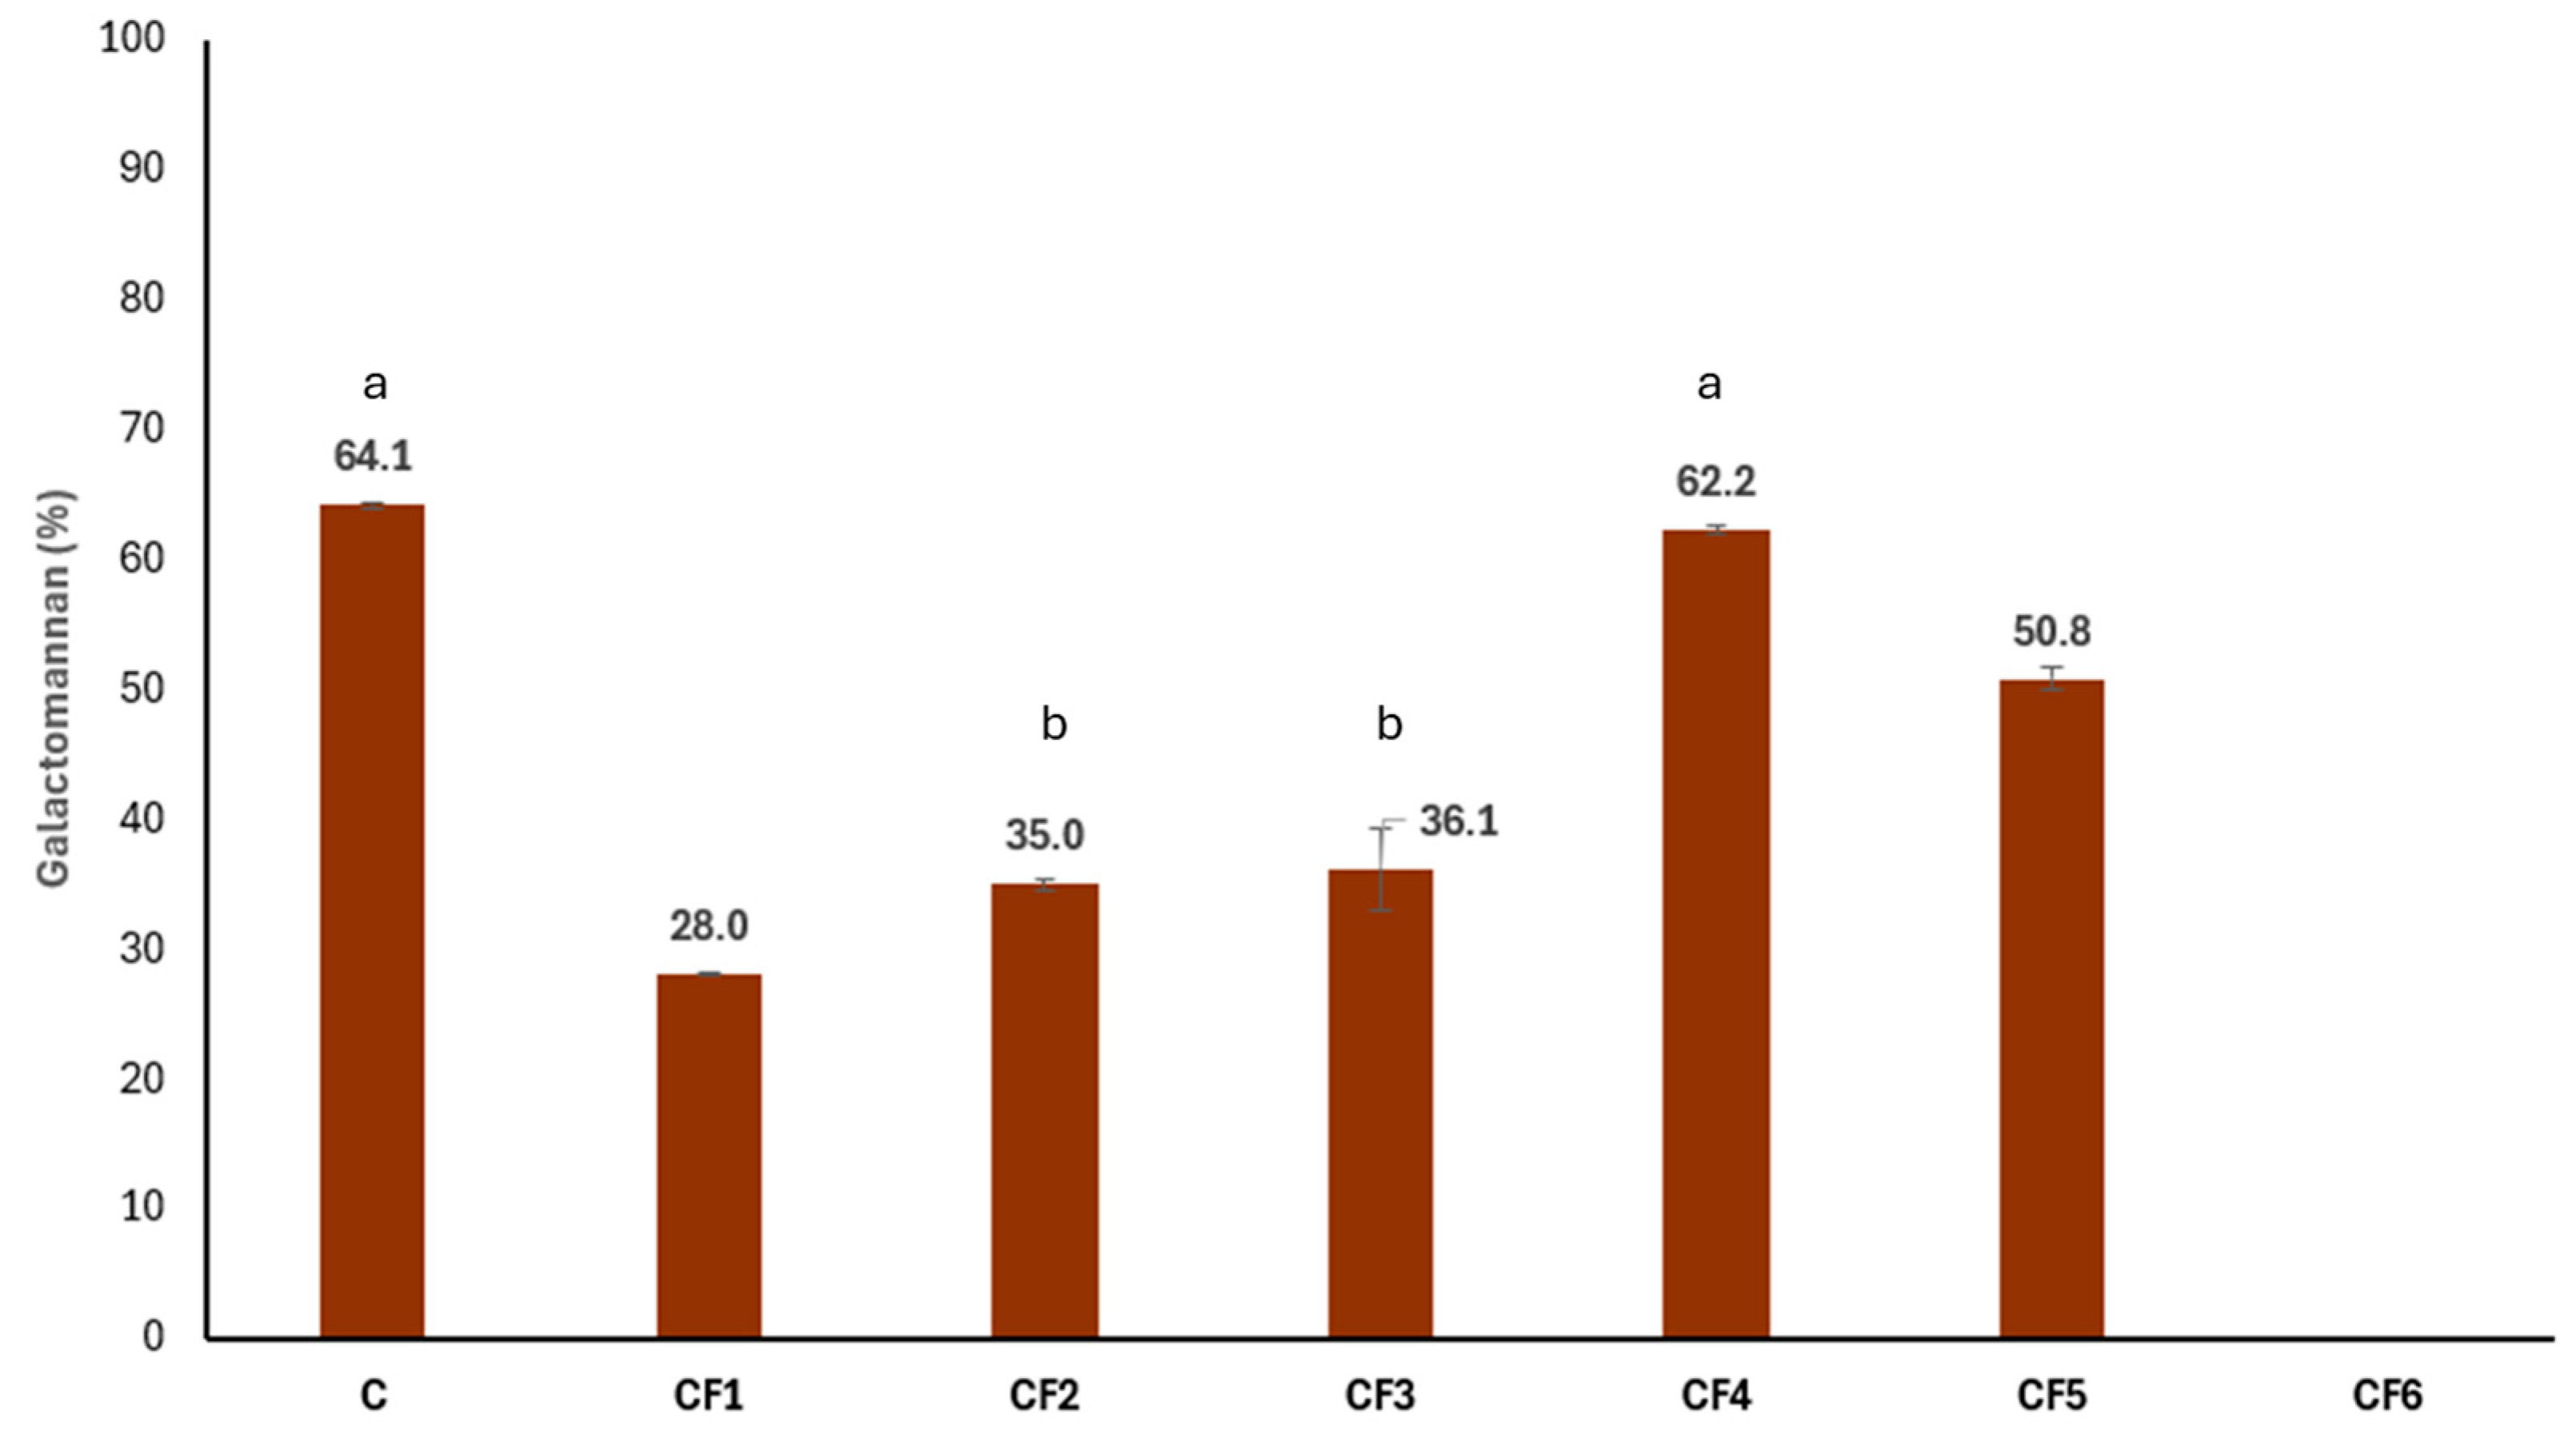
3.2. Galactomannan Content and Characterization
3.3. Total Protein and Lipid Contents
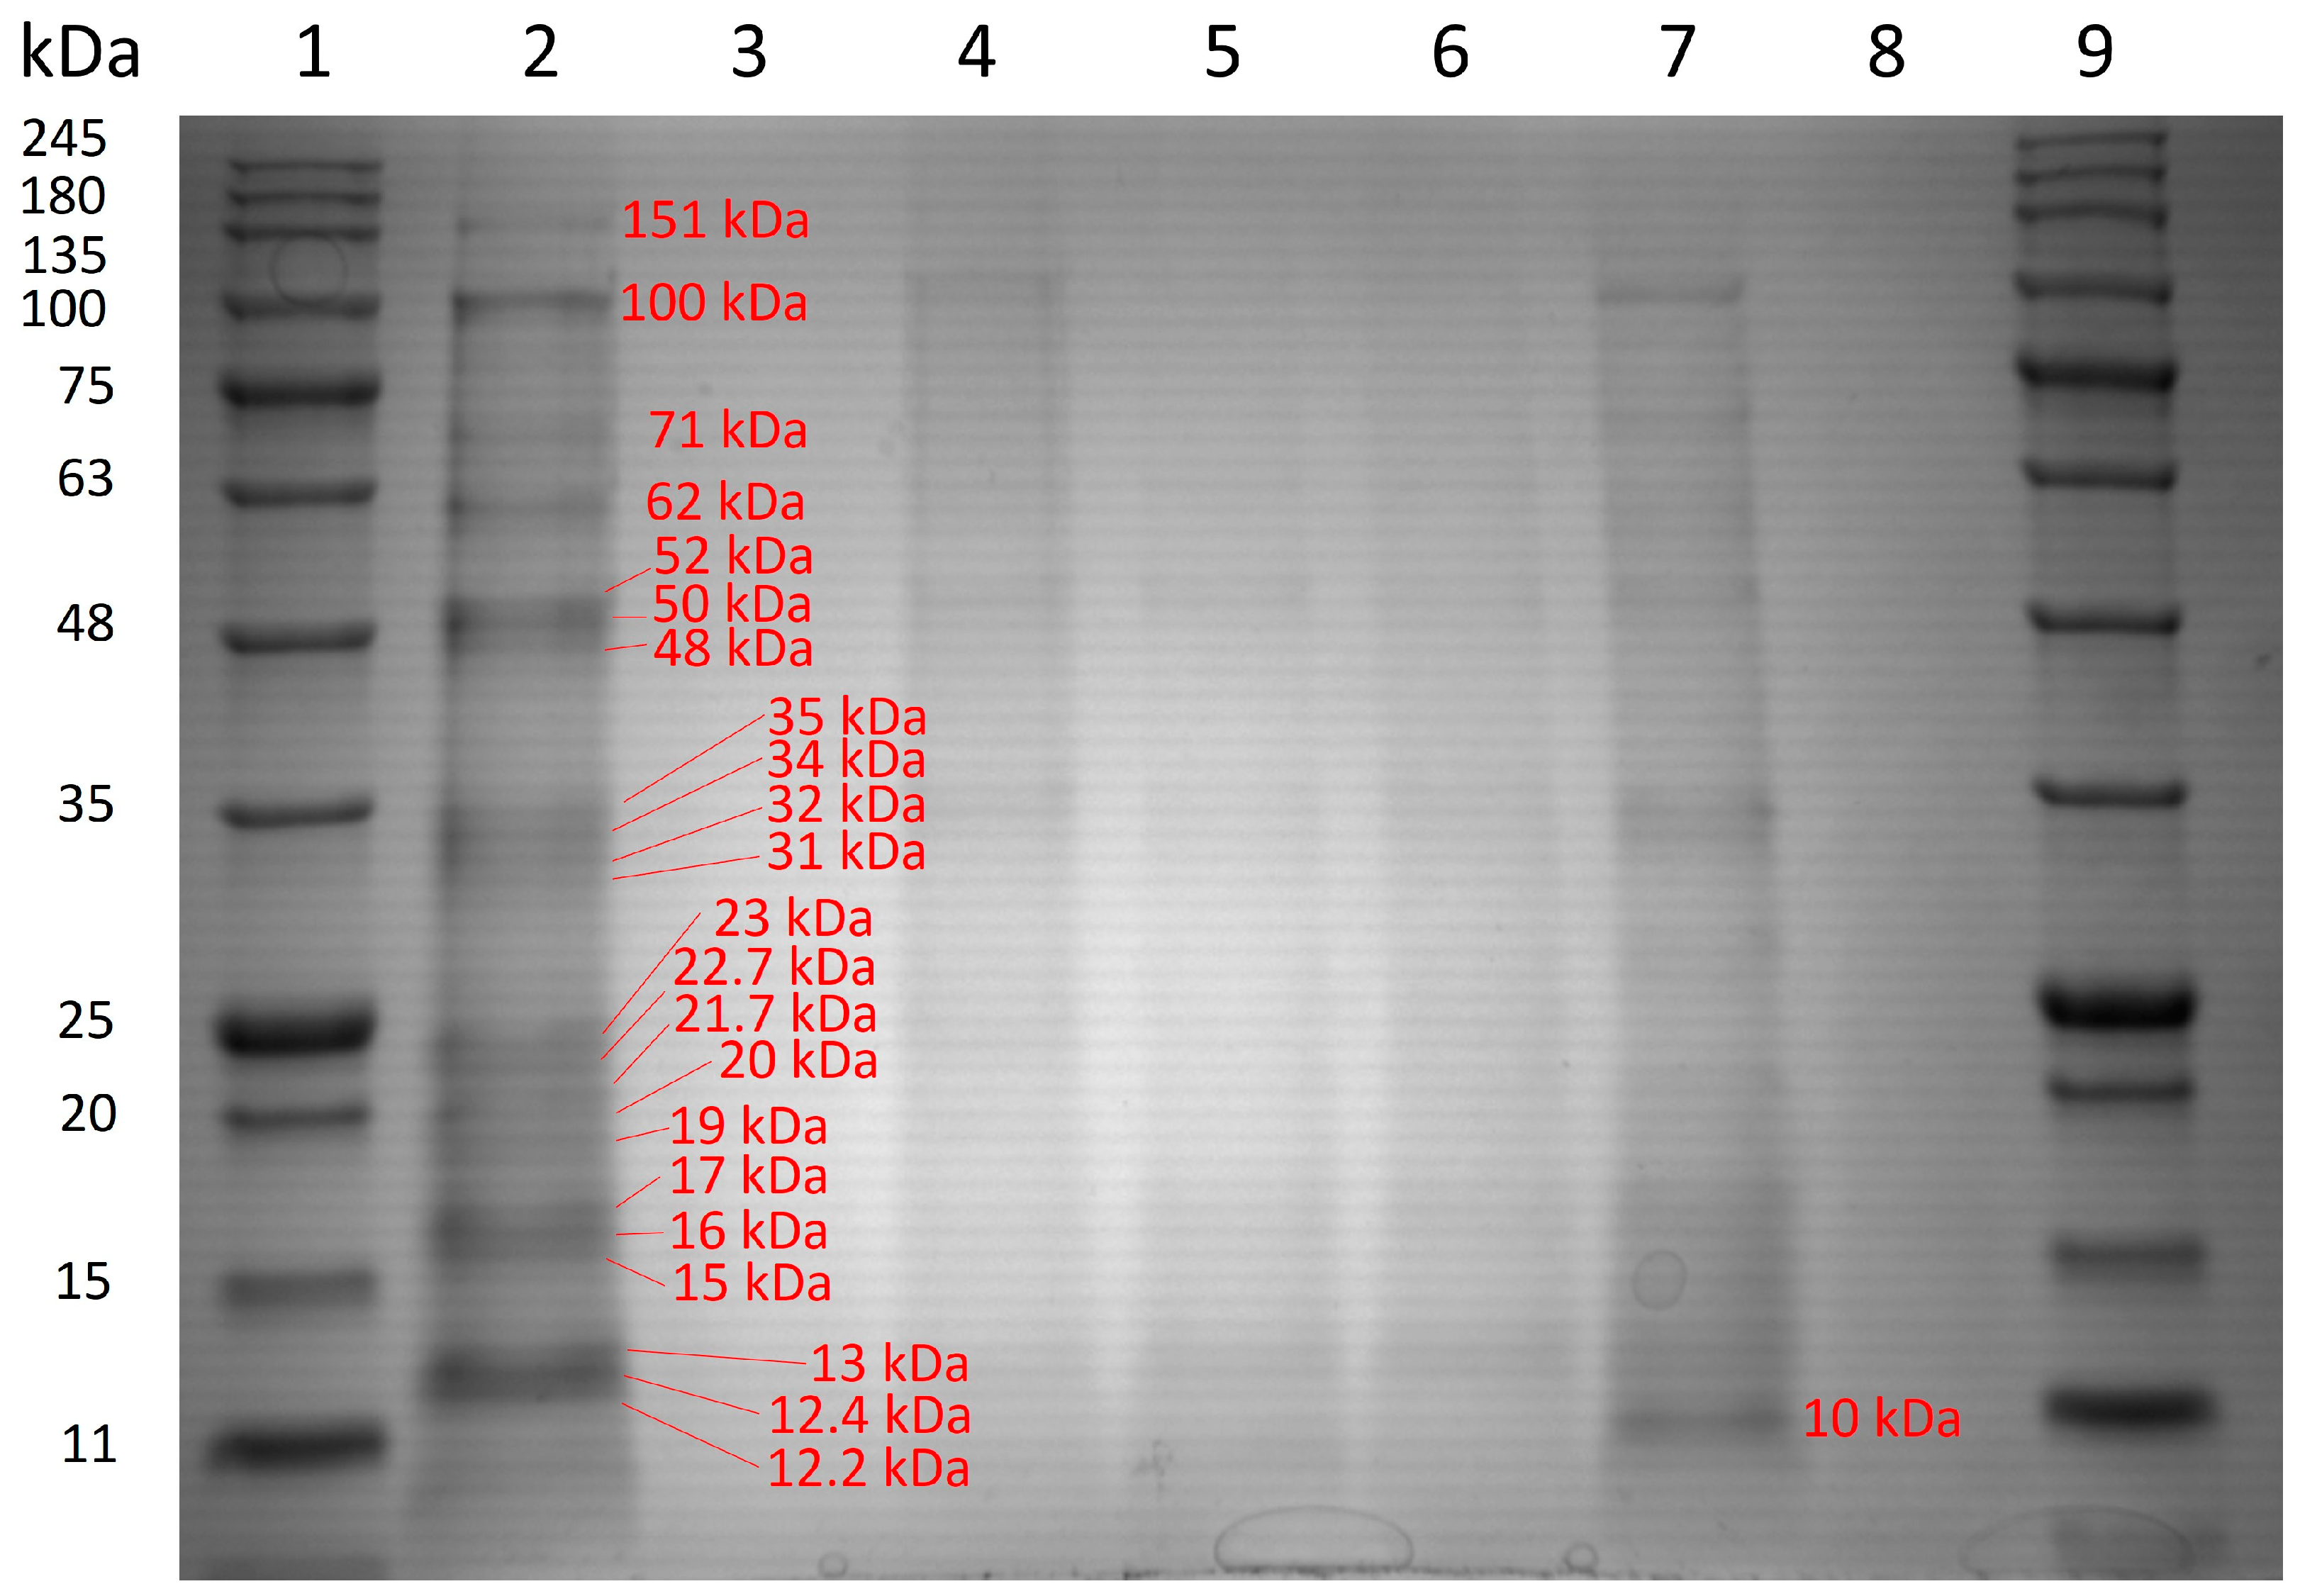
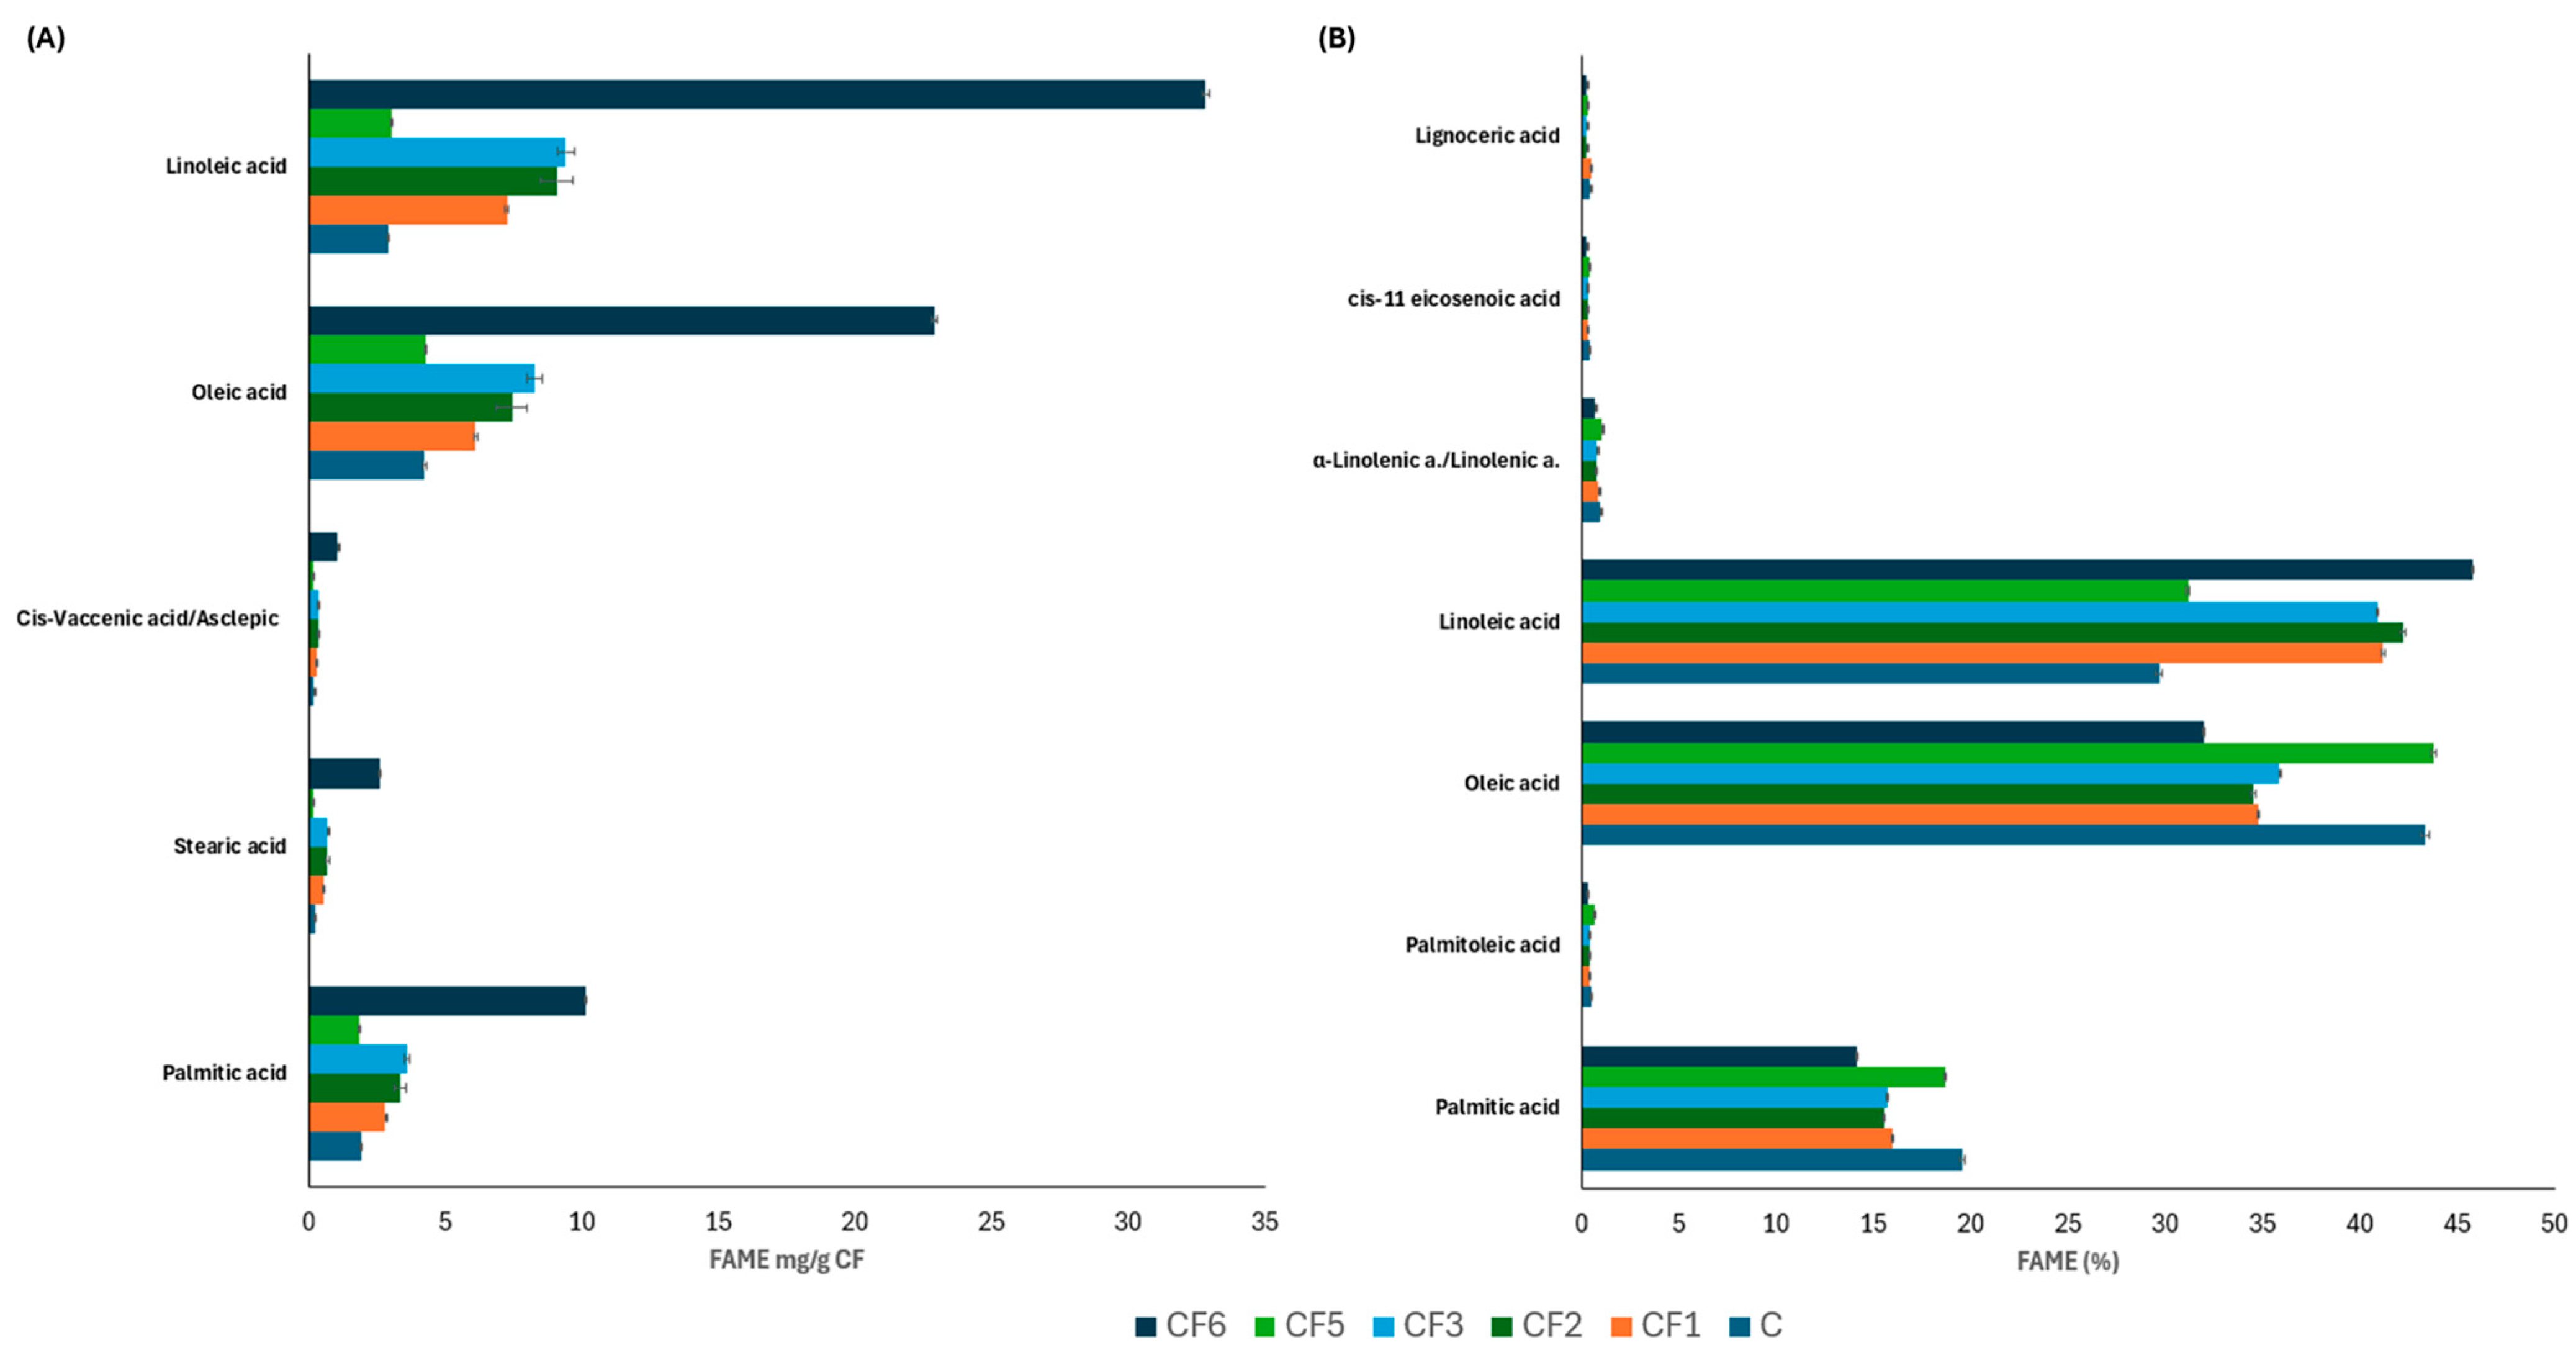
3.4. Protein and Lipid Profiles
4. Discussion
5. Conclusion
Supplementary Materials
Author Contributions
Funding
Data Availability Statement
Conflicts of Interest
References
- Zarezadeh, M.; Dehghani, A.; Faghfouri, A.H.; Radkhah, N.; Naemi Kermanshahi, M.; Hamedi Kalajahi, F.; Mohammadzadeh Honarvar, N.; Ghoreishi, Z.; Ostadrahimi, A.; Ebrahimi Mamaghani, M. Inositol Supplementation and Body Mass Index: A Systematic Review and Meta-analysis of Randomized Clinical Trials. Obes. Sci. Pract. 2022, 8, 387–397. [Google Scholar] [CrossRef]
- Gioxari, A.; Amerikanou, C.; Nestoridi, I.; Gourgari, E.; Pratsinis, H.; Kalogeropoulos, N.; Andrikopoulos, N.K.; Kaliora, A.C. Carob: A Sustainable Opportunity for Metabolic Health. Foods 2022, 11, 2154. [Google Scholar] [CrossRef] [PubMed]
- Goulas, V.; Stylos, E.; Chatziathanasiadou, M.; Mavromoustakos, T.; Tzakos, A. Functional Components of Carob Fruit: Linking the Chemical and Biological Space. Int. J. Mol. Sci. 2016, 17, 1875. [Google Scholar] [CrossRef] [PubMed]
- Bouzouita, N.; Khaldi, A.; Zgoulli, S.; Chebil, L.; Chekki, R.; Chaabouni, M.; Thonart, P. The Analysis of Crude and Purified Locust Bean Gum: A Comparison of Samples from Different Carob Tree Populations in Tunisia. Food Chem. 2007, 101, 1508–1515. [Google Scholar] [CrossRef]
- Watkins, O.C.; Yong, H.E.J.; Sharma, N.; Chan, S.-Y. A Review of the Role of Inositols in Conditions of Insulin Dysregulation and in Uncomplicated and Pathological Pregnancy. Crit. Rev. Food Sci. Nutr. 2022, 62, 1626–1673. [Google Scholar] [CrossRef]
- Azab, A. D-Pinitol—Active Natural Product from Carob with Notable Insulin Regulation. Nutrients 2022, 14, 1453. [Google Scholar] [CrossRef]
- Barak, S.; Mudgil, D. Locust Bean Gum: Processing, Properties and Food Applications—A Review. Int. J. Biol. Macromol. 2014, 66, 74–80. [Google Scholar] [CrossRef]
- Sharma, P.; Sharma, S.; Ramakrishna, G.; Srivastava, H.; Gaikwad, K. A Comprehensive Review on Leguminous Galactomannans: Structural Analysis, Functional Properties, Biosynthesis Process and Industrial Applications. Crit. Rev. Food Sci. Nutr. 2022, 62, 443–465. [Google Scholar] [CrossRef] [PubMed]
- Zhu, B.-J.; Zayed, M.Z.; Zhu, H.-X.; Zhao, J.; Li, S.-P. Functional Polysaccharides of Carob Fruit: A Review. Chin. Med. 2019, 14, 40. [Google Scholar] [CrossRef]
- Mikkonen, K.S.; Tenkanen, M.; Cooke, P.; Xu, C.; Rita, H.; Willför, S.; Holmbom, B.; Hicks, K.B.; Yadav, M.P. Mannans as Stabilizers of Oil-in-Water Beverage Emulsions. LWT-Food Sci. Technol. 2009, 42, 849–855. [Google Scholar] [CrossRef]
- Kontogiorgos, V. Galactomannans (Guar, Locust Bean, Fenugreek, Tara). In Encyclopedia of Food Chemistry; Elsevier: Amsterdam, The Netherlands, 2019; pp. 109–113. [Google Scholar]
- Prajapati, V.D.; Jani, G.K.; Moradiya, N.G.; Randeria, N.P.; Nagar, B.J.; Naikwadi, N.N.; Variya, B.C. Galactomannan: A Versatile Biodegradable Seed Polysaccharide. Int. J. Biol. Macromol. 2013, 60, 83–92. [Google Scholar] [CrossRef] [PubMed]
- Thombare, N.; Jha, U.; Mishra, S.; Siddiqui, M.Z. Guar Gum as a Promising Starting Material for Diverse Applications: A Review. Int. J. Biol. Macromol. 2016, 88, 361–372. [Google Scholar] [CrossRef] [PubMed]
- Dionísio, M.; Grenha, A. Locust Bean Gum: Exploring Its Potential for Biopharmaceutical Applications. J. Pharm. Bioallied. Sci. 2012, 4, 175. [Google Scholar] [CrossRef]
- Tripathy, S.; Das, M.K. Guar Gum: Present Status and Applications. J. Pharm. Sci. Innov. 2013, 4, 24–28. [Google Scholar] [CrossRef]
- Aydın, S.; Özdemir, Y. Development and Characterization of Carob Flour Based Functional Spread for Increasing Use as Nutritious Snack for Children. J. Food Qual. 2017, 2017, 5028150. [Google Scholar] [CrossRef]
- Papaefstathiou, E.; Agapiou, A.; Giannopoulos, S.; Kokkinofta, R. Nutritional Characterization of Carobs and Traditional Carob Products. Food Sci. Nutr. 2018, 6, 2151–2161. [Google Scholar] [CrossRef]
- Issaoui, M.; Flamini, G.; Delgado, A. Sustainability Opportunities for Mediterranean Food Products through New Formulations Based on Carob Flour (Ceratonia siliqua L.). Sustainability 2021, 13, 8026. [Google Scholar] [CrossRef]
- Bienenstock, M.; Csáki, L.; Sági, A.; Sági, E. Manufacture of Mill Products for Almentary Purposes and of Paste Goods and Baked Products from Such Mlled Products. U.S. Patent 2,025,705A, 31 December 1935. [Google Scholar]
- Nemet, M.; Vasilić, M.; Tomas, A. Lipid-Lowering Effects of Carob Extracts (Ceratonia siliqua): Proposed Mechanisms and Clinical Importance. Front. Pharmacol. 2022, 13, 921123. [Google Scholar] [CrossRef]
- Rašković, A.; Martić, N.; Tomas, A.; Andrejić-Višnjić, B.; Bosanac, M.; Atanasković, M.; Nemet, M.; Popović, R.; Krstić, M.; Vukmirović, S.; et al. Carob Extract (Ceratonia siliqua L.): Effects on Dyslipidemia and Obesity in a High-Fat Diet-Fed Rat Model. Pharmaceutics 2023, 15, 2611. [Google Scholar] [CrossRef]
- Fidan, H.; Stankov, S.; Petkova, N.; Petkova, Z.; Iliev, A.; Stoyanova, M.; Ivanova, T.; Zhelyazkov, N.; Ibrahim, S.; Stoyanova, A.; et al. Evaluation of Chemical Composition, Antioxidant Potential and Functional Properties of Carob (Ceratonia siliqua L.) Seeds. J. Food Sci. Technol. 2020, 57, 2404–2413. [Google Scholar] [CrossRef]
- Matthaus, B.; Özcan, M.M. Lipid Evaluation of Cultivated and Wild Carob (Ceratonia siliqua L.) Seed Oil Growing in Turkey. Sci. Hortic. 2011, 130, 181–184. [Google Scholar] [CrossRef]
- Cerqueira, M.A.; Pinheiro, A.C.; Souza, B.W.S.; Lima, Á.M.P.; Ribeiro, C.; Miranda, C.; Teixeira, J.A.; Moreira, R.A.; Coimbra, M.A.; Gonçalves, M.P.; et al. Extraction, Purification and Characterization of Galactomannans from Non-Traditional Sources. Carbohydr. Polym. 2009, 75, 408–414. [Google Scholar] [CrossRef]
- Ruiz-Matute, A.I.; Hernández-Hernández, O.; Rodríguez-Sánchez, S.; Sanz, M.L.; Martínez-Castro, I. Derivatization of Carbohydrates for GC and GC–MS Analyses. J. Chromatogr. B 2011, 879, 1226–1240. [Google Scholar] [CrossRef]
- Muñoz-Almagro, N.; Rico-Rodriguez, F.; Villamiel, M.; Montilla, A. Pectin Characterisation Using Size Exclusion Chromatography: A Comparison of ELS and RI Detection. Food Chem. 2018, 252, 271–276. [Google Scholar] [CrossRef]
- Pollard, M.A.; Eder, B.; Fischer, P.; Windhab, E.J. Characterization of Galactomannans Isolated from Legume Endosperms of Caesalpinioideae and Faboideae Subfamilies by Multidetection Aqueous SEC. Carbohydr. Polym. 2010, 79, 70–84. [Google Scholar] [CrossRef]
- Bradford, M.M. A Rapid and Sensitive Method for the Quantitation of Microgram Quantities of Protein Utilizing the Principle of Protein-Dye Binding. Anal. Biochem. 1976, 72, 248–254. [Google Scholar] [CrossRef]
- ISO 12228-2:2014. Available online: https://www.iso.org/standard/60249.html (accessed on 1 August 2024).
- Shevchenko, A.; Wilm, M.; Vorm, O.; Mann, M. Mass Spectrometric Sequencing of Proteins from Silver-Stained Polyacrylamide Gels. Anal. Chem. 1996, 68, 850–858. [Google Scholar] [CrossRef]
- Alonso, R.; Pisa, D.; Marina, A.I.; Morato, E.; Rábano, A.; Rodal, I.; Carrasco, L. Evidence for fungal infection in cerebrospinal fluid and brain tissue from patients with amyotrophic lateral sclerosis. Int. J. Biol. Sci. 2015, 11, 546–558. [Google Scholar] [CrossRef] [PubMed]
- Lopes da Silva, J.A.; Gonçalves, M.P. Studies on a Purification Method for Locust Bean Gum by Precipitation with Isopropanol. Food Hydrocoll. 1990, 4, 277–287. [Google Scholar] [CrossRef]
- Pollard, M.A.; Kelly, R.; Fischer, P.A.; Windhab, E.J.; Eder, B.; Amadò, R. Investigation of Molecular Weight Distribution of LBG Galactomannan for Flours Prepared from Individual Seeds, Mixtures, and Commercial Samples. Food Hydrocoll. 2008, 22, 1596–1606. [Google Scholar] [CrossRef]
- Cunha, P.L.R.; Castro, R.R.; Rocha, F.A.C.; de Paula, R.C.M.; Feitosa, J.P.A. Low Viscosity Hydrogel of Guar Gum: Preparation and Physicochemical Characterization. Int. J. Biol. Macromol. 2005, 37, 99–104. [Google Scholar] [CrossRef]
- Guo, R.; Li, X.; Ma, X.; Sun, X.; Kou, Y.; Zhang, J.; Li, D.; Liu, Y.; Zhang, H.; Wu, Y. Macromolecular and Thermokinetic Properties of a Galactomannan from Sophora Alopecuroides L. Seeds: A Study of Molecular Aggregation. Carbohydr. Polym. 2021, 262, 117890. [Google Scholar] [CrossRef] [PubMed]
- Mamone, G.; Sciammaro, L.; De Caro, S.; Di Stasio, L.; Siano, F.; Picariello, G.; Puppo, M.C. Comparative Analysis of Protein Composition and Digestibility of Ceratonia siliqua L. and Prosopis spp. Seed Germ Flour. Food Res. Int. 2019, 120, 188–195. [Google Scholar] [CrossRef] [PubMed]
- Capraro, J.; Magni, C.; Scarafoni, A.; Caramanico, R.; Rossi, F.; Morlacchini, M.; Duranti, M. Pasta Supplemented with Isolated Lupin Protein Fractions Reduces Body Weight Gain and Food Intake of Rats and Decreases Plasma Glucose Concentration upon Glucose Overload Trial. Food Funct. 2014, 5, 375–380. [Google Scholar] [CrossRef]
- Bettzieche, A.; Brandsch, C.; Schmidt, M.; Weiße, K.; Eder, K.; Stangl, G.I. Differing Effect of Protein Isolates from Different Cultivars of Blue Lupin on Plasma Lipoproteins of Hypercholesterolemic Rats. Biosci. Biotechnol. Biochem. 2008, 72, 3114–3121. [Google Scholar] [CrossRef] [PubMed]
- Guzmán, T.J.; Martínez-Ayala, A.L.; García-López, P.M.; Soto-Luna, I.C.; Gurrola-Díaz, C.M. Effect of the Acute and Chronic Administration of Lupinus Albus β-Conglutin on Glycaemia, Circulating Cholesterol, and Genes Potentially Involved. Biomed. Pharmacother. 2021, 133, 110969. [Google Scholar] [CrossRef] [PubMed]
- González-Montoya, M.; Hernández-Ledesma, B.; Mora-Escobedo, R.; Martínez-Villaluenga, C. Bioactive Peptides from Germinated Soybean with Anti-Diabetic Potential by Inhibition of Dipeptidyl Peptidase-IV, α-Amylase, and α-Glucosidase Enzymes. Int. J. Mol. Sci. 2018, 19, 2883. [Google Scholar] [CrossRef]
- Lammi, C.; Zanoni, C.; Arnoldi, A. Three Peptides from Soy Glycinin Modulate Glucose Metabolism in Human Hepatic HepG2 Cells. Int. J. Mol. Sci. 2015, 16, 27362–27370. [Google Scholar] [CrossRef]
- Lammi, C.; Zanoni, C.; Arnoldi, A. IAVPGEVA, IAVPTGVA, and LPYP, Three Peptides from Soy Glycinin, Modulate Cholesterol Metabolism in HepG2 Cells through the Activation of the LDLR-SREBP2 Pathway. J. Funct. Foods 2015, 14, 469–478. [Google Scholar] [CrossRef]
- Fassini, P.G.; Noda, R.W.; Ferreira, E.S.; Silva, M.A.; Neves, V.A.; Demonte, A. Soybean Glycinin Improves HDL-C and Suppresses the Effects of Rosuvastatin on Hypercholesterolemic Rats. Lipids Health Dis. 2011, 10, 165. [Google Scholar] [CrossRef]
- Moriyama, T.; Kishimoto, K.; Nagai, K.; Urade, R.; Ogawa, T.; Utsumi, S.; Maruyama, N.; Maebuchi, M. Soybean β-Conglycinin Diet Suppresses Serum Triglyceride Levels in Normal and Genetically Obese Mice by Induction of β-Oxidation, Downregulation of Fatty Acid Synthase, and Inhibition of Triglyceride Absorption. Biosci. Biotechnol. Biochem. 2004, 68, 352–359. [Google Scholar] [CrossRef] [PubMed]
- Rizzo, V.; Tomaselli, F.; Gentile, A.; La Malfa, S.; Maccarone, E. Rheological Properties and Sugar Composition of Locust Bean Gum from Different Carob Varieties (Ceratonia siliqua L.). J. Agric. Food Chem. 2004, 52, 7925–7930. [Google Scholar] [CrossRef]
- Wu, Y.; Li, W.; Cui, W.; Eskin, N.A.M.; Goff, H.D. A Molecular Modeling Approach to Understand Conformation–Functionality Relationships of Galactomannans with Different Mannose/Galactose Ratios. Food Hydrocoll. 2012, 26, 359–364. [Google Scholar] [CrossRef]
- Butt, M.S.; Shahzadi, N.; Sharif, M.K.; Nasir, M. Guar Gum: A Miracle Therapy for Hypercholesterolemia, Hyperglycemia and Obesity. Crit. Rev. Food Sci. Nutr. 2007, 47, 389–396. [Google Scholar] [CrossRef] [PubMed]
- Zavoral, J.; Hannan, P.; Fields, D.; Hanson, M.; Frantz, I.; Kuba, K.; Elmer, P.; Jacobs, D. The Hypolipidemic Effect of Locust Bean Gum Food Products in Familial Hypercholesterolemic Adults and Children. Am. J. Clin. Nutr. 1983, 38, 285–294. [Google Scholar] [CrossRef]
- Ershoff, B.H.; Wells, A.F. Effects of Gum Guar, Locust Bean Gum and Carrageenan on Liver Cholesterol of Cholesterol-Fed Rats. Exp. Biol. Med. 1962, 110, 580–582. [Google Scholar] [CrossRef]
- de la Fuente-Fernández, M.; González-Hedström, D.; Amor, S.; Tejera-Muñoz, A.; Fernández, N.; Monge, L.; Almodóvar, P.; Andrés-Delgado, L.; Santamaría, L.; Prodanov, M.; et al. Supplementation with a Carob (Ceratonia siliqua L.) Fruit Extract Attenuates the Cardiometabolic Alterations Associated with Metabolic Syndrome in Mice. Antioxidants 2020, 9, 339. [Google Scholar] [CrossRef]
- De la Fuente-Muñoz, M.; De la Fuente-Fernández, M.; Román-Carmena, M.; Amor, S.; Iglesias-de la Cruz, M.C.; García-Laínez, G.; Llopis, S.; Martorell, P.; Verdú, D.; Serna, E.; et al. Supplementation with a New Standardized Extract of Green and Black Tea Exerts Antiadipogenic Effects and Prevents Insulin Resistance in Mice with Metabolic Syndrome. Int. J. Mol. Sci. 2023, 24, 8521. [Google Scholar] [CrossRef]
- Li, X.; Yamada, H.; Morita, S.; Yamashita, Y.; Kim, Y.; Kometani, T.; Narang, N.; Furuta, T.; Kim, M. Effects of Free Linoleic Acid and Oleic Acid in Sesame Meal Extract as Pancreatic Lipase Inhibitors on Postprandial Triglyceridemia: A Randomized, Double-Blind, Placebo-Controlled, Crossover Study in Healthy Volunteers. Nutrients 2023, 15, 1748. [Google Scholar] [CrossRef]
- Solà, R.; La Ville, A.E.; Richard, J.L.; Motta, C.; Bargalló, M.T.; Girona, J.; Masana, L.; Jacotot, B. Oleic Acid Rich Diet Protects Against the Oxidative Modification of High Density Lipoprotein. Free Radic. Biol. Med. 1997, 22, 1037–1045. [Google Scholar] [CrossRef]
- Santa-María, C.; López-Enríquez, S.; Montserrat-de la Paz, S.; Geniz, I.; Reyes-Quiroz, M.E.; Moreno, M.; Palomares, F.; Sobrino, F.; Alba, G. Update on Anti-Inflammatory Molecular Mechanisms Induced by Oleic Acid. Nutrients 2023, 15, 224. [Google Scholar] [CrossRef] [PubMed]
- Palomer, X.; Pizarro-Delgado, J.; Barroso, E.; Vázquez-Carrera, M. Palmitic and Oleic Acid: The Yin and Yang of Fatty Acids in Type 2 Diabetes Mellitus. Trends Endocrinol. Metab. 2018, 29, 178–190. [Google Scholar] [CrossRef] [PubMed]
- Hidalgo, M.A.; Carretta, M.D.; Burgos, R.A. Long Chain Fatty Acids as Modulators of Immune Cells Function: Contribution of FFA1 and FFA4 Receptors. Front. Physiol. 2021, 12, 668330. [Google Scholar] [CrossRef] [PubMed]
- Froyen, E.; Burns-Whitmore, B. The Effects of Linoleic Acid Consumption on Lipid Risk Markers for Cardiovascular Disease in Healthy Individuals: A Review of Human Intervention Trials. Nutrients 2020, 12, 2329. [Google Scholar] [CrossRef]
- Zhang, P.; Liu, N.; Xue, M.; Zhang, M.; Xiao, Z.; Xu, C.; Fan, Y.; Qiu, J.; Zhang, Q.; Zhou, Y. β-Sitosterol Reduces the Content of Triglyceride and Cholesterol in a High-Fat Diet-Induced Non-Alcoholic Fatty Liver Disease Zebrafish (Danio rerio) Model. Animals 2024, 14, 1289. [Google Scholar] [CrossRef]
- Yuan, C.; Zhang, X.; Long, X.; Jin, J.; Jin, R. Effect of β-Sitosterol Self-Microemulsion and β-Sitosterol Ester with Linoleic Acid on Lipid-Lowering in Hyperlipidemic Mice. Lipids Health Dis. 2019, 18, 157. [Google Scholar] [CrossRef]
- Liu, R.; Hao, D.; Xu, W.; Li, J.; Li, X.; Shen, D.; Sheng, K.; Zhao, L.; Xu, W.; Gao, Z.; et al. β-Sitosterol Modulates Macrophage Polarization and Attenuates Rheumatoid Inflammation in Mice. Pharm. Biol. 2019, 57, 161–168. [Google Scholar] [CrossRef] [PubMed]
- Kurano, M.; Hasegawa, K.; Kunimi, M.; Hara, M.; Yatomi, Y.; Teramoto, T.; Tsukamoto, K. Sitosterol Prevents Obesity-Related Chronic Inflammation. Biochim. Biophys. Acta (BBA)-Mol. Cell Biol. Lipids 2018, 1863, 191–198. [Google Scholar] [CrossRef]
- Heinzl, G.C.; Tretola, M.; De Benedetti, S.; Silacci, P.; Scarafoni, A. Lupinus Albus γ-Conglutin: New Findings about Its Action at the Intestinal Barrier and a Critical Analysis of the State of the Art on Its Postprandial Glycaemic Regulating Activity. Nutrients 2022, 14, 3666. [Google Scholar] [CrossRef]
- Bertoglio, J.C.; Calvo, M.A.; Hancke, J.L.; Burgos, R.A.; Riva, A.; Morazzoni, P.; Ponzone, C.; Magni, C.; Duranti, M. Hypoglycemic Effect of Lupin Seed γ-Conglutin in Experimental Animals and Healthy Human Subjects. Fitoterapia 2011, 82, 933–938. [Google Scholar] [CrossRef]
- Terruzzi, I.; Senesi, P.; Magni, C.; Montesano, A.; Scarafoni, A.; Luzi, L.; Duranti, M. Insulin-Mimetic Action of Conglutin-γ, a Lupin Seed Protein, in Mouse Myoblasts. Nutr. Metab. Cardiovasc. Dis. 2011, 21, 197–205. [Google Scholar] [CrossRef] [PubMed]


| Sample | Code |
|---|---|
| Commercial carob flour | C |
| Grounded carob seed with husk | CF1 |
| Grounded carob seed without husk removed with water treatment | CF2 |
| Grounded seed without husk removed with acid treatment | CF3 |
| Purified carob seed galactomannan | CF4 |
| Grounded carob seed endosperm | CF5 |
| Grounded carob seed germ | CF6 |
| Carob Flour Sample | Mannose/Galactose Ratio | Standard Deviation |
|---|---|---|
| Galactomannan Standard a | 3.9 | 0.03 |
| C a | 3.0 | 0.07 |
| CF1 b | 3.4 | 0.16 |
| CF2 a | 3.4 | 0.29 |
| CF3 a | 3.3 | 0.05 |
| CF4 | 3.5 | 0.03 |
| CF5 a | 3.4 | 0.07 |
| Sample | HPLC Detector/Mobile Phase | Molecular Weight (Da) | SD |
|---|---|---|---|
| Standard a,b,c | ELSD/Ammonium acetate 0.01 M | 1.99 × 10⁶ | 2.01 × 10⁵ |
| C b | 3.38 × 10⁶ | 2.11 × 10⁵ | |
| CF1 a | 3.57 × 10⁶ | 3.87 × 10⁵ | |
| CF2 a,b | 2.51 × 10⁶ | 3.31 × 10⁴ | |
| CF3 c | 2.99 × 10⁶ | 2.27 × 10⁵ | |
| CF4 a,b | 2.52 × 10⁶ | 4.07 × 10⁴ | |
| CF5 a,b | 2.29 × 10⁶ | 4.79 × 10⁴ | |
| Standard | RID/NaNO3 0.1 M | 2.17 × 10⁶ | 1.89 × 10⁵ |
| C | 2.96 × 10⁶ | 4.02 × 10⁵ | |
| CF1 | 3.28 × 10⁶ | 8.50 × 10⁵ | |
| CF2 | 3.61 × 10⁶ | 3.84 × 10⁵ | |
| CF3 | 3.44 × 10⁶ | 1.48 × 10⁵ | |
| CF4 | 3.33 × 10⁶ | 3.22 × 10⁵ | |
| CF5 | 2.94 × 10⁶ | 1.26 × 10⁵ |
| Uniprot Entry | Identification | Theoretical MW (kDa) | Potential Bioactive Properties |
|---|---|---|---|
| F5B8V7|CONA2_LUPAN | Conglutin alpha 2 | 2A subunit (51.4)/2B subunit (19.1) | Satiety and weight loss [37] LDL and VLDL reduction [38] |
| F5B8W5|CONB7_LUPAN | Conglutin beta 7 | 68.3 | Satiety and weight loss [37] Antidiabetic effect and total serum cholesterol reduction [39] LDL and VLDL reduction [38] |
| P11828|GLYG3_SOYBN | Glycinin G3 | A1b subunit (31.5)/B2 subunit (19.9) | Potential antidiabetic effect through α-amylase, α-glucosidases inhibition and dipeptidyl peptidase IV inhibition [40] Glucose metabolism modulation [41] Cholesterol metabolism modulation [42] HDL increase and triglycerides reduction [43,44] |
| A0A445FHF7|A0A445FHF7_GLYSO | Glycinin G3 | 52.2 | |
| P04776|GLYG1_SOYBN | Glycinin G1 | A1a subunit (32.7)/Bx subunit (19.9) | |
| A0A834TBD1|A0A834TBD1_9FABA | Glycinin G3 | 58.7 | |
| A0A6P4DH65|A0A6P4DH65_ARADU | 11S globulin | 46.9 | N/A |
Disclaimer/Publisher’s Note: The statements, opinions and data contained in all publications are solely those of the individual author(s) and contributor(s) and not of MDPI and/or the editor(s). MDPI and/or the editor(s) disclaim responsibility for any injury to people or property resulting from any ideas, methods, instructions or products referred to in the content. |
© 2024 by the authors. Licensee MDPI, Basel, Switzerland. This article is an open access article distributed under the terms and conditions of the Creative Commons Attribution (CC BY) license (https://creativecommons.org/licenses/by/4.0/).
Share and Cite
Benito-Vázquez, I.; Garrido-Romero, M.; Hontoria-Caballo, G.; García-García, C.; Díez-Municio, M.; Moreno, F.J. Carob (Ceratonia siliqua) Flour as Source of Bioactive Compounds: Production, Characterization and Nutraceutical Value. Foods 2024, 13, 3024. https://doi.org/10.3390/foods13193024
Benito-Vázquez I, Garrido-Romero M, Hontoria-Caballo G, García-García C, Díez-Municio M, Moreno FJ. Carob (Ceratonia siliqua) Flour as Source of Bioactive Compounds: Production, Characterization and Nutraceutical Value. Foods. 2024; 13(19):3024. https://doi.org/10.3390/foods13193024
Chicago/Turabian StyleBenito-Vázquez, Iván, Manuel Garrido-Romero, Gema Hontoria-Caballo, Carlos García-García, Marina Díez-Municio, and F. Javier Moreno. 2024. "Carob (Ceratonia siliqua) Flour as Source of Bioactive Compounds: Production, Characterization and Nutraceutical Value" Foods 13, no. 19: 3024. https://doi.org/10.3390/foods13193024
APA StyleBenito-Vázquez, I., Garrido-Romero, M., Hontoria-Caballo, G., García-García, C., Díez-Municio, M., & Moreno, F. J. (2024). Carob (Ceratonia siliqua) Flour as Source of Bioactive Compounds: Production, Characterization and Nutraceutical Value. Foods, 13(19), 3024. https://doi.org/10.3390/foods13193024