Can Consumers Judge the Freshness of Fish from Visual Cues? A Case Study of Japanese Consumers
Abstract
1. Introduction
2. Materials and Methods
2.1. Animal Ethics and Confidentiality
2.2. Freshness Definition
2.3. Experimental Design
2.4. Extraction of Visual Information
2.5. Principal Component Analysis
2.6. Participant Grouping and Analysis of Variance
3. Results
3.1. Distribution of Correct Answers
3.2. Correlation
3.3. Participant Grouping and ANOVA
4. Discussion
4.1. Accuracy of Visual Judgment of Freshness of Participants
4.2. Correlations
4.3. Participant Grouping and ANOVA
5. Conclusions
Author Contributions
Funding
Institutional Review Board Statement
Informed Consent Statement
Data Availability Statement
Acknowledgments
Conflicts of Interest
References
- Ali, J.; Kapoor, S.; Moorthy, J. Buying behaviour of consumers for food products in an emerging economy. Br. Food J. 2010, 112, 109–124. [Google Scholar] [CrossRef]
- Sakai, Y.; Tada, T.; Nomura, T.; Yagi, N. The Welfare Value of Freshness: A Hedonic Price Analysis in the Retail Seafood Market in Japan. Mar. Resour. Econ. 2024, 39, 21–38. [Google Scholar] [CrossRef]
- Brunsø, K.; Verbeke, W.; Ottar Olsen, S.; Fruensgaard Jeppesen, L. Motives, barriers and quality evaluation in fish consumption situations. Br. Food J. 2009, 111, 699–716. [Google Scholar] [CrossRef]
- Benn, Y.; Webb, T.L.; Chang, B.P.; Reidy, J. What information do consumers consider, and how do they look for it, when shopping for groceries online? Appetite 2015, 89, 265–273. [Google Scholar] [CrossRef] [PubMed]
- Sakai, Y.; Kurokura, H.; Tada, T.; Nomura, T.; Yagi, N. Quality distribution of fresh fish and retailers’ sales strategies in special wards of Tokyo. Fish. Sci. 2023, 89, 137–146. [Google Scholar] [CrossRef]
- Cheng, J.; Sun, D.; Zeng, X.; Liu, D. Recent advances in methods and techniques for freshness quality determination and evaluation of fish and fish fillets: A review. Crit. Rev. Food Sci. Nutr. 2015, 55, 1012–1225. [Google Scholar] [CrossRef]
- Madhubhashini, M.N.; Liyanage, C.P.; Alahakoon, A.U.; Liyanage, R.P. Development of a comprehensive classification model for determining the storage day of frigate tuna (Auxis thazard) for freshness evaluation using a portable electronic nose. Int. J. Food Sci. Technol. 2024, 59, 4672–4679. [Google Scholar] [CrossRef]
- Hassoun, A.; Karoui, R. Quality evaluation of fish and other seafood by traditional and nondestructive instrumental methods: Advantages and limitations. Crit. Rev. Food Sci. Nutr. 2017, 57, 1976–1998. [Google Scholar] [CrossRef]
- Prabhakar, P.K.; Vatsa, S.; Srivastav, P.P.; Pathak, S.S. A comprehensive review on freshness of fish and assessment: Analytical methods and recent innovations. Food Res. Int. 2020, 133, 109157. [Google Scholar] [CrossRef]
- Yuan, P.; Wang, Y.; Miyazaki, R.; Liang, J.; Hirasaka, K.; Tachibana, K.; Taniyama, S. A convenient and nondestructive method using bio-impedance analysis to determine fish freshness during ice storage. Fish. Sci. 2018, 84, 1099–1108. [Google Scholar] [CrossRef]
- Nakamura, M.; Matsumoto, K.; Morimoto, E.; Ezoe, S.; Maeda, T.; Hirano, T. Model of auctioneer estimation of swordtip squid (Loligo edulis) quality. Kansei Eng. Int. J. 2011, 10, 99–107. [Google Scholar] [CrossRef][Green Version]
- Jarmin, R.; Khuan, L.Y.; Hashim, H.; Rahman, N.H.A. A comparison on fish freshness determination method. In Proceedings of the Paper Presented at the 2012 International Conference on System Engineering and Technology (ICSET), Bandung, Indonesia, 11–12 September 2012; pp. 1–6. [Google Scholar]
- Rocculi, P.; Cevoli, C.; Tappi, S.; Genovese, J.; Urbinati, E.; Picone, G.; Fabbri, A.; Capozzi, F.; Dalla Rosa, M. Freshness assessment of European hake (Merluccius merluccius) through the evaluation of eye chromatic and morphological characteristics. Food Res. Int. 2019, 115, 234–240. [Google Scholar] [CrossRef] [PubMed]
- Karoui, R.; Lefur, B.; Grondin, C.; Thomas, E.; Demeulemester, C.; Baerdemaeker, J.D.; Guillard, A. Mid-infrared spectroscopy as a new tool for the evaluation of fish freshness. Int. J. Food Sci. Technol. 2007, 42, 57–64. [Google Scholar] [CrossRef]
- Olafsdottir, G.; Nesvadba, P.; Di Natale, C.; Careche, M.; Oehlenschläger, J.; Tryggvadóttir, S.V.; Schubring, R.; Kroeger, M.; Heia, K.; Esaiassen, M.; et al. Multisensor for Fish Quality Determination; Elsevier Ltd.: Amsterdam, The Netherlands, 2004. [Google Scholar] [CrossRef]
- Hicks, D.; Pivarnik, L.; McDermott, R. Consumer perceptions about seafood—An Internet survey. J. Foodserv. 2008, 19, 213–226. [Google Scholar] [CrossRef]
- Murakoshi, T.; Masuda, T.; Utsumi, K.; Tsubota, K.; Wada, Y. Glossiness and Perishable Food Quality: Visual Freshness Judgment of Fish Eyes Based on Luminance Distribution. PLoS ONE 2013, 8, e58994. [Google Scholar] [CrossRef]
- Costa, C.; Antonucci, F.; Menesatti, P.; Pallottino, F.; Boglione, C.; Cataudella, S. An Advanced Colour Calibration Method for Fish Freshness Assessment: A Comparison Between Standard and Passive Refrigeration Modalities. Food Bioprocess Technol. 2013, 6, 2190–2195. [Google Scholar] [CrossRef]
- Ohta, K. Treatment for asthma with biological agents. Jpn. J. Clin. Immunol. 2004, 27, 34–39. [Google Scholar] [CrossRef]
- Sakai, Y.; Nakamura, A.; Yagi, N.; Suzuki, T.; Oishi, T.; Kurokura, H. Consumers’ attitude toward inspection methods and institutions for potential radioactive contamination: A choice-based conjoint analysis. J. Int. Fish. 2018, 16, 19–37. [Google Scholar]
- Botta, J.R. Evaluation of Seafood Freshness Quality; John Wiley & Sons: Hoboken, NJ, USA, 1996. [Google Scholar]
- Yamato Scale Co., Ltd. Fish Analyzer Operation Manual; Assurant Innovations. Available online: https://assurantinnovations.com/wp-content/uploads/2021/10/Fish-Analyzer-Operation-Manual.pdf (accessed on 27 September 2024).
- Ishihara, S.; Taketani, B.; Ioka, H.; Kiyokawa, T. Nondestructive Determination of Freshness of Roundnose Flounder by Impedance Analysis. Bull. Shimane Prefect. Fish. Technol. Res. Cent. 2018, 11, 1–9. [Google Scholar]
- Fan, X.; Lin, X.; Wu, C.; Zhang, N.; Cheng, Q.; Qi, H.; Konno, K.; Dong, X. Estimating freshness of ice storage rainbow trout using bioelectrical impedance analysis. Food Sci. Nutr. 2021, 9, 154–163. [Google Scholar] [CrossRef]
- Okabe, S.; Shoichi, M. Technical Explanation and Application Examples of Fish Analyzer. Teichi 2019, 136, 1–11. (In Japanese) [Google Scholar]
- Koseki, S.; Kitakami, S.; Kato, N.; Arai, K. Rigor mortis of fish and shellfish and evaluation of freshness of their muscles as K value. J. Sch. Mar. Sci. Technol. Tokai Univ. 2006, 4, 31–46. (In Japanese) [Google Scholar]
- Ministry of Agriculture, Forestry and Fisheries (MAFF). Efforts Based on the Basic Plan for the Promotion of Food Education. Available online: https://www.maff.go.jp/chushi/syokuiku/katudou/torikumi/attach/pdf/r02-6.pdf (accessed on 20 September 2024). (In Japanese)
- Wang, F.; Zang, Y.; Wo, Q.; Zou, C.; Wang, N.; Wang, X.; Li, D. Fish freshness rapid detection based on fish-eye image. In Proceedings of the Paper Presented at the PIAGENG 2013: Image Processing and Photonics for Agricultural Engineering 2013, Sanya, China, 27–28 January 2013; Volume 8761, pp. 52–56. [Google Scholar]
- Iwata, H.; Ukai, Y. SHAPE: A computer program package for quantitative evaluation of biological shapes based on elliptic Fourier descriptors. J. Hered. 2002, 93, 384–385. [Google Scholar] [CrossRef]
- Bro, R.; Smilde, A.K. Principal component analysis. Anal. Methods 2014, 6, 2812–2831. [Google Scholar] [CrossRef]
- Shlens, J. A tutorial on principal component analysis. arXiv 2014, arXiv:1404.1100. [Google Scholar]
- Wu, T.; Yang, L.; Zhou, J.; Lai, D.C.; Zhong, N. An improved nondestructive measurement method for salmon freshness based on spectral and image information fusion. Comput. Electron. Agric. 2019, 158, 11–19. [Google Scholar] [CrossRef]
- Weatherall, I.L.; Coombs, B.D. Skin color measurements in terms of CIELAB color space values. J. Investig. Dermatol. 1992, 99, 468–473. [Google Scholar] [CrossRef]
- St, L.; Wold, S. Analysis of variance (ANOVA). Chemom. Intell. Lab. Syst. 1989, 6, 259–272. [Google Scholar]
- Agresti, A. Categorical Data Analysis; John Wiley & Sons: Hoboken, NJ, USA, 2012. [Google Scholar]
- McHugh, M.L. The chi-square test of independence. Biochem. Medica 2013, 23, 143–149. [Google Scholar] [CrossRef]
- Gvili, Y.; Tal, A.; Amar, M.; Wansink, B. Moving up in taste: Enhanced projected taste and freshness of moving food products. Psychol. Mark. 2017, 34, 671–683. [Google Scholar] [CrossRef]
- Makowski, D.; Ben-Shachar, M.S.; Patil, I.; Lüdecke, D. Methods and algorithms for correlation analysis in R. J. Open Source Softw. 2020, 5, 2306. [Google Scholar] [CrossRef]
- Hirose, A.; Yoshitake, M.; Onodera, J.; Ooba, K.; Sakakibara, T.; Ito, A.; Ashida, S.; Shiina, Y. Measurement of fat content of cultured Pacific bluefin tuna Thunnus orientalis by near-infrared spectroscopy. Nippon. Suisan Gakkaishi 2016, 82, 753–762. [Google Scholar] [CrossRef][Green Version]
- Hua, L.; Shen, J.; Chen, Y.; Lan, Q.; Liu, J. Wipe-on and durable self-cleaning coating for glass facade. Thin Solid Film. 2020, 697, 137813. [Google Scholar] [CrossRef]
- Vermeir, I. How Visuals Affect Food Choice. Foods 2020, 9, 1835. [Google Scholar] [CrossRef]


| Principal Component | Description |
|---|---|
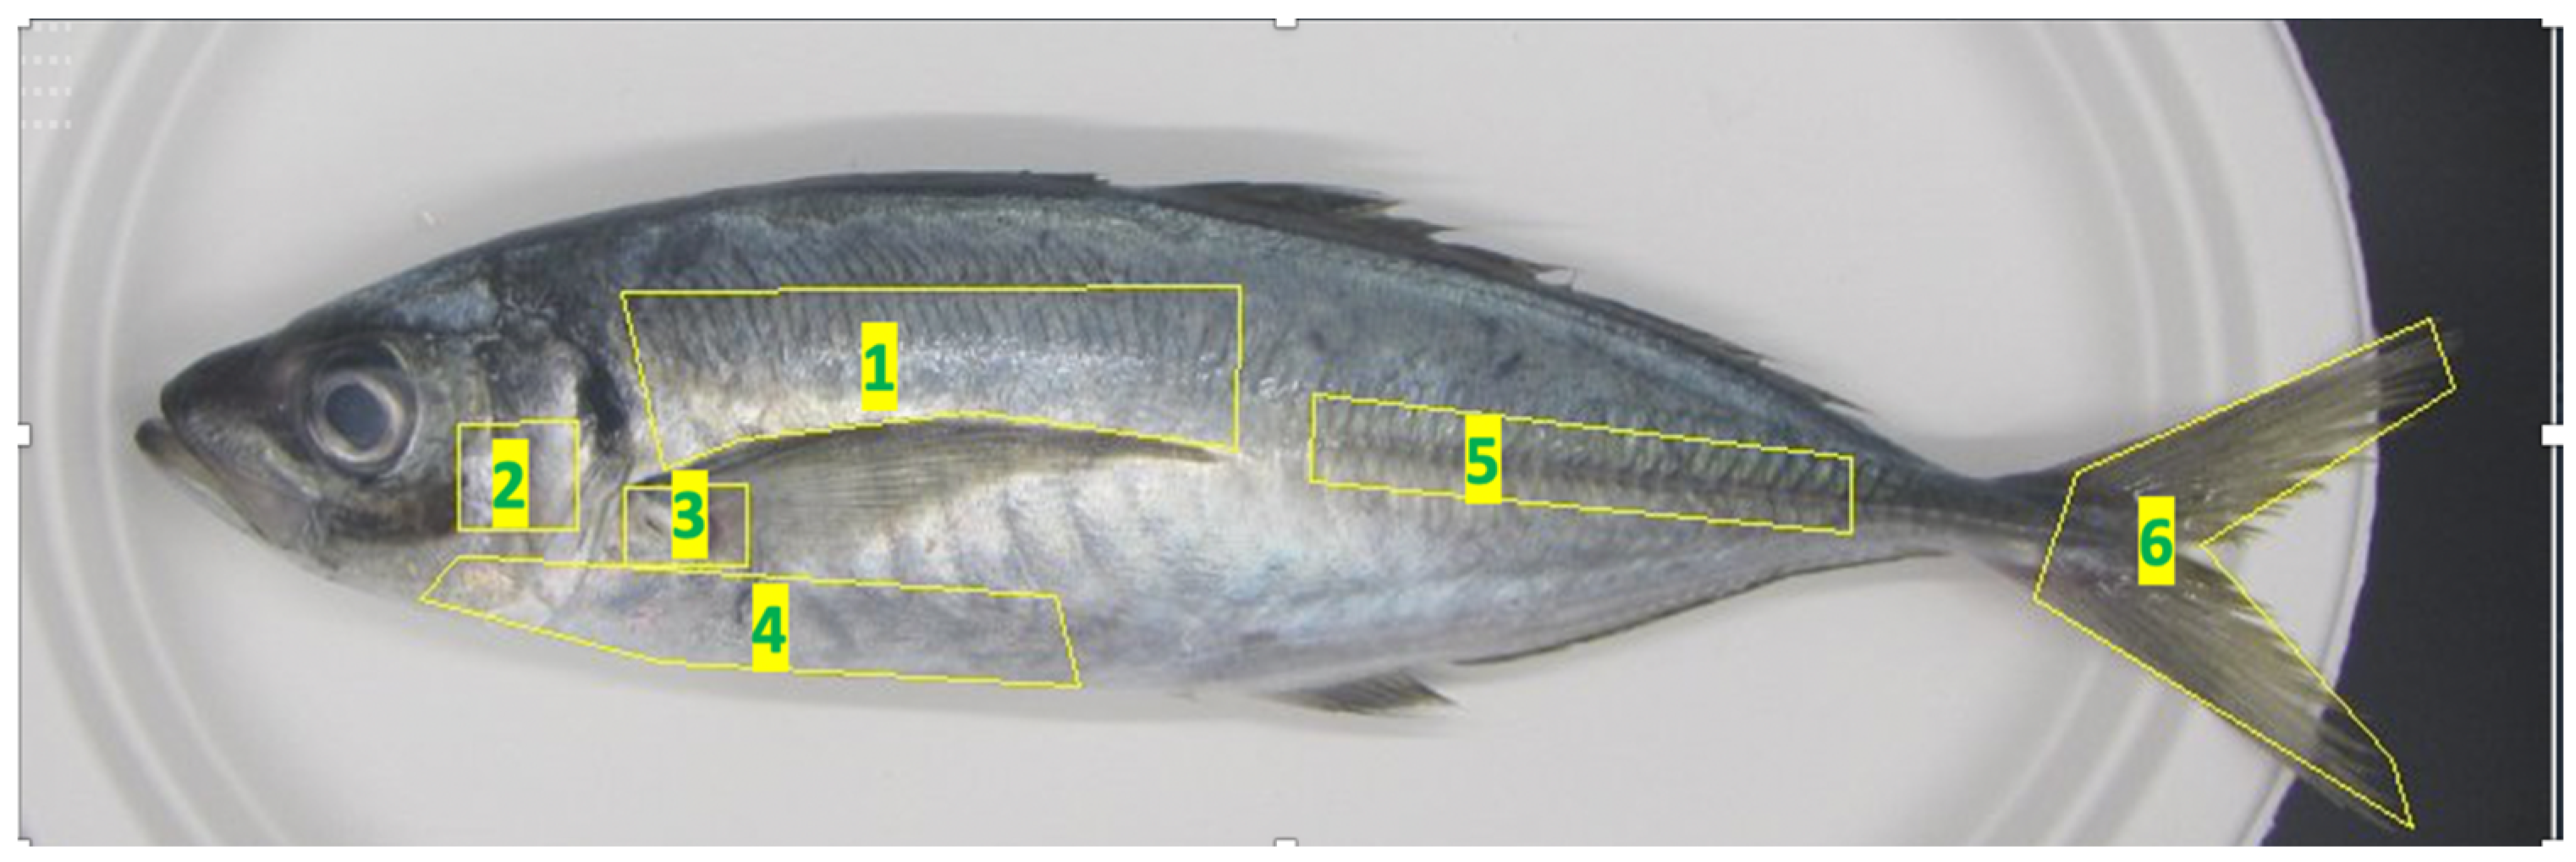
| PC1_C | As the PC1 value increases, the colors in parts P1, P3, P5, and P6 become more yellow. |
| PC2_C | As the PC2 value increases, the luminance in part P1 decreases, while the redness in part P3 increases. |
| PC3_C | As the PC3 value increases, the green in part P2 increases, along with its luminance. |
| PC4_C | As the PC4 value increases, the luminance in parts P2 and P3 increases, while parts P1 and P6 shift towards red. |
| PC5_C | As the PC5 value increases, the luminance in parts P1 and P6 increases. |
| PC6_C | As the PC6 value increases, the luminance in part P4 increases, with a shift towards blue. |
| PC7_C | As the PC7 value increases, the luminance in part P5 increases, and part P2 shifts towards blue. |
| PC8_C | As the PC8 value increases, the luminance in part P6 increases, and part P4 shifts towards yellow. |
| PC9_C | As the PC9 value increases, the luminance in part P4 increases, the redness in parts P1 and P4 increases, and the greenness in parts P2 and P6 increases. |
| PC10_C | As the PC10 value increases, the redness in part P3 increases. |
| Principal Component | Description |
|---|---|
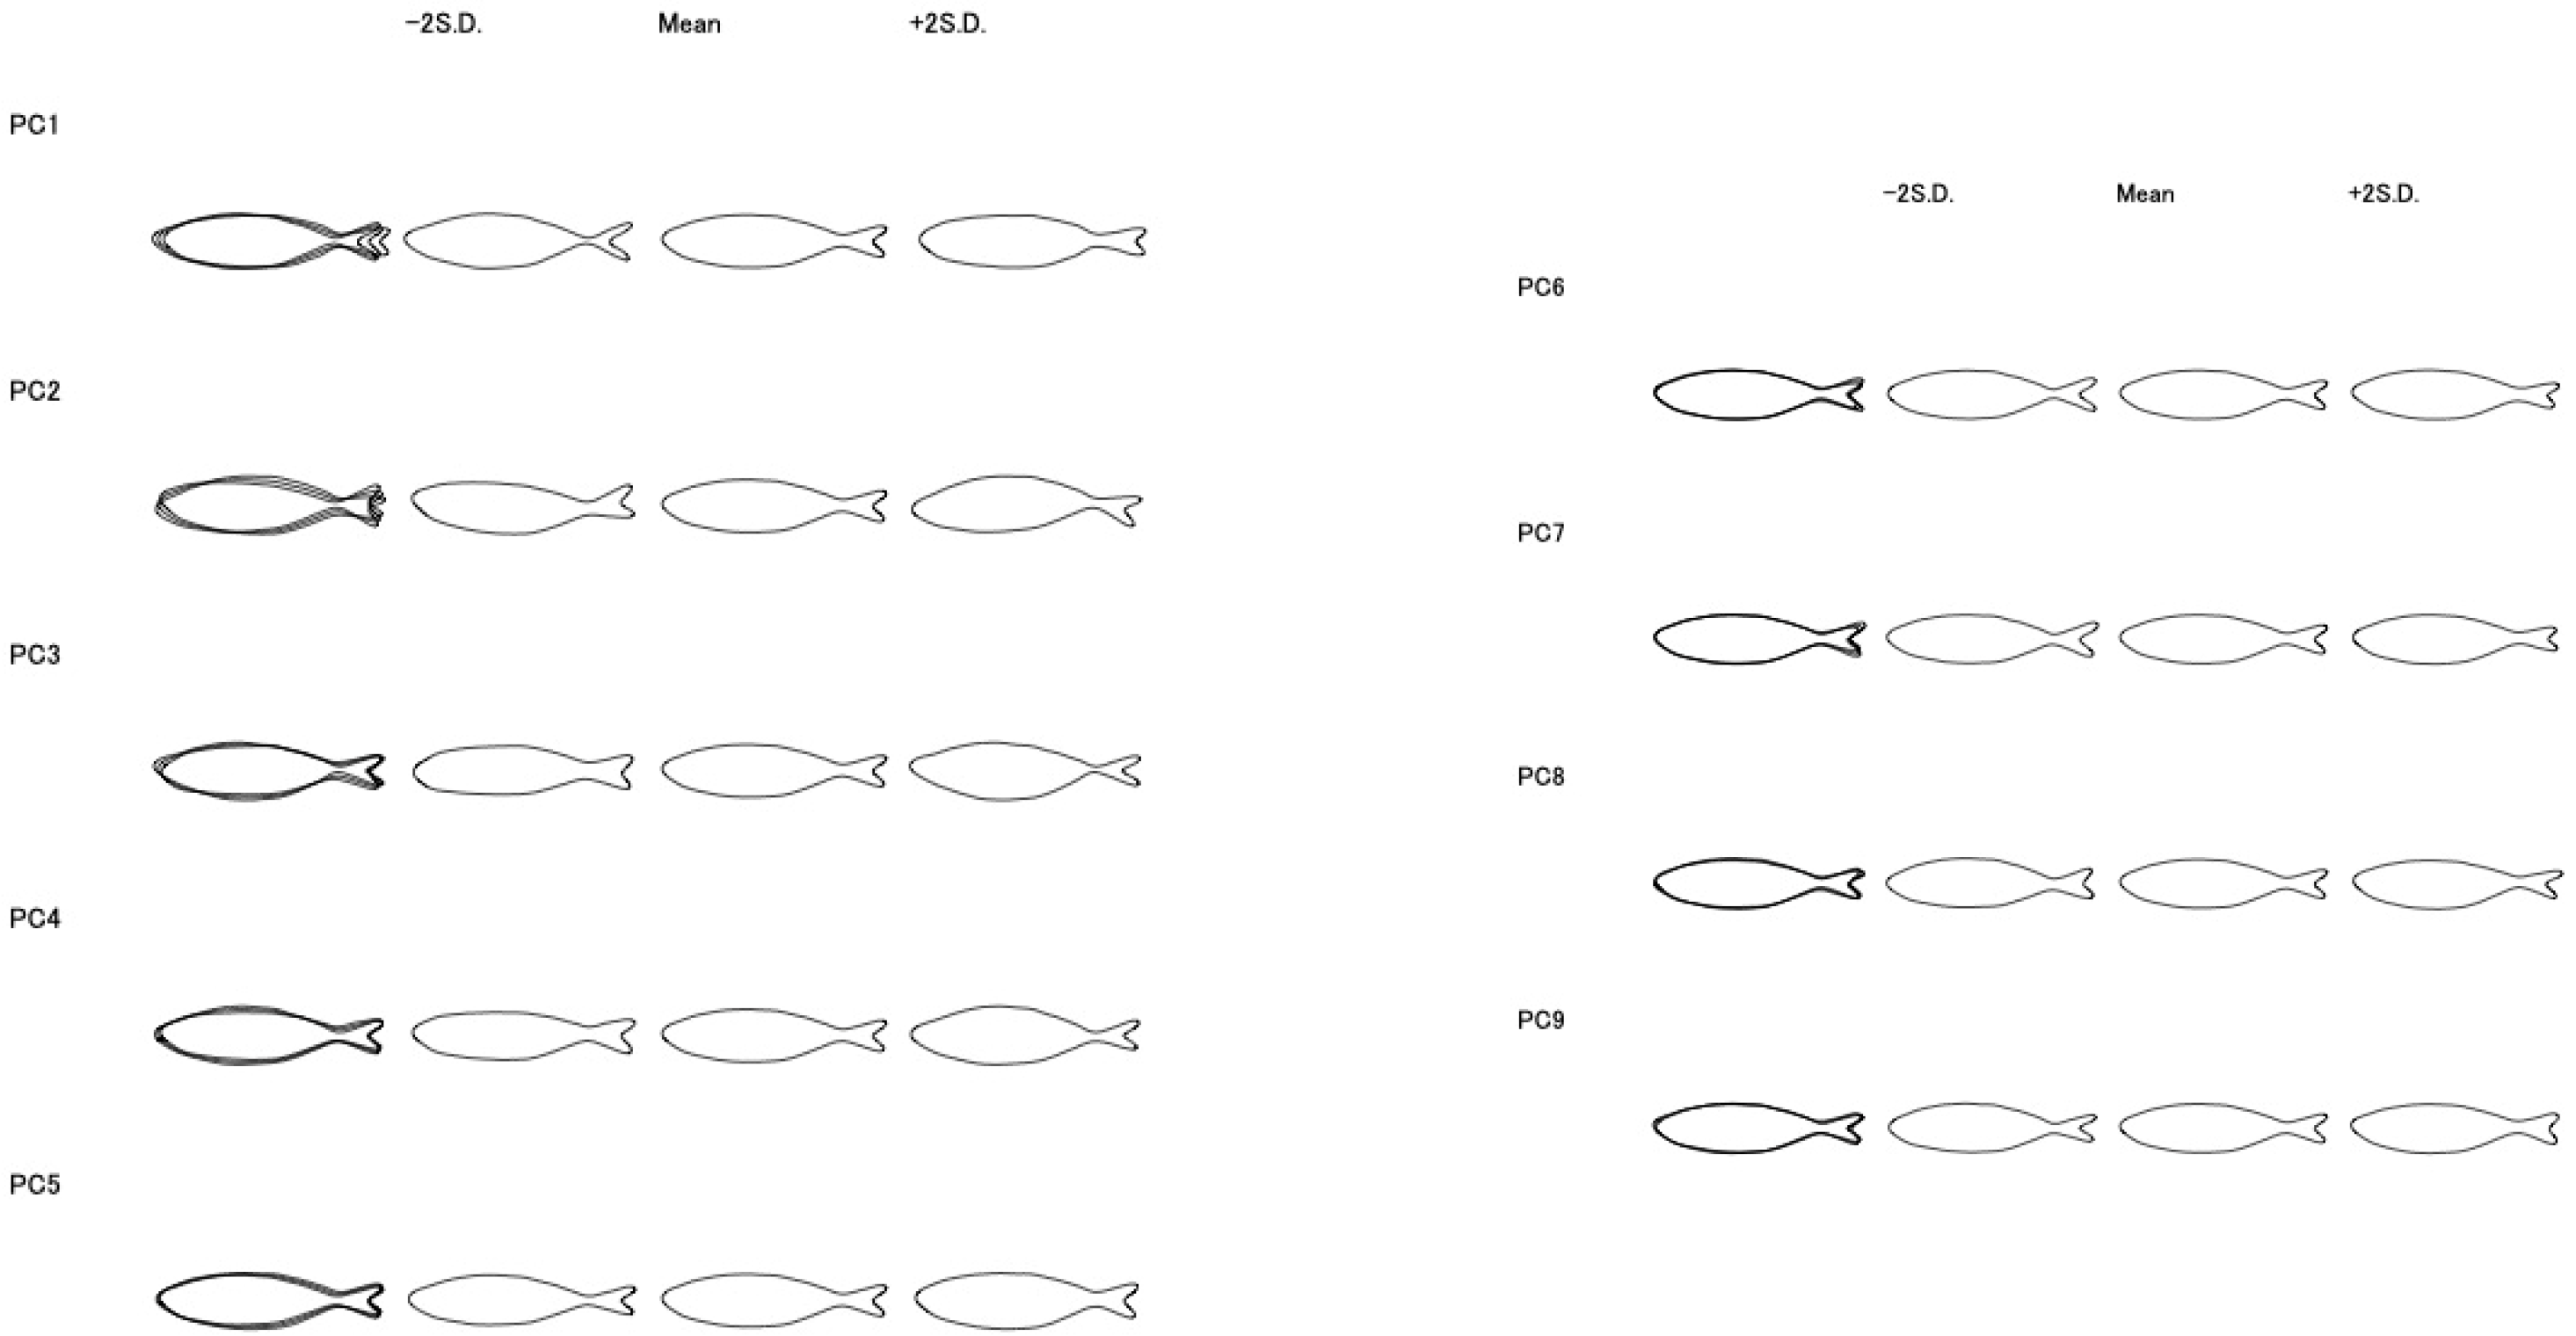
| PC1_S | Reflects the size and spread of the caudal fin relative to the body. Lower PC1 values indicate a larger and more spread-out caudal fin. |
| PC2_S | Reflects the orientation of the caudal fin relative to the body axis. Changes in PC2 values are associated with the direction of the caudal fin. |
| PC3_S | Reflects the size difference in the caudal fin relative to the body. Changes in PC3 values indicate the size difference between the caudal fin and the body. |
| PC4_S | Reflects the thickness of the caudal peduncle relative to the body. Changes in PC4 values indicate differences in the thickness of the caudal peduncle and body size. |
| PC5_S | Reflects the ratio of overall length to body height. Changes in PC5 values indicate the proportion difference between total body length and body height. |
| PC6_S | Reflects the variation in the spread of the caudal fin. Changes in PC6 values indicate different ways the caudal fin spreads. |
| PC7_S, PC8_S, PC9_S | Mainly reflect the shape of the caudal fin. PC8, in particular, shows the feature of the upper part of the caudal fin s extending upwards. |
| Score | Con_Fre | |
|---|---|---|
| Con_fre | 0.8 | |
| gloss | 0.05 | 0.3 ** |
| lipid contents | 0.08 | −0.12 |
| length | 0.05 | 0.25 ** |
| weight | 0.06 | 0.1 |
| Score | Con_Fre | |
|---|---|---|
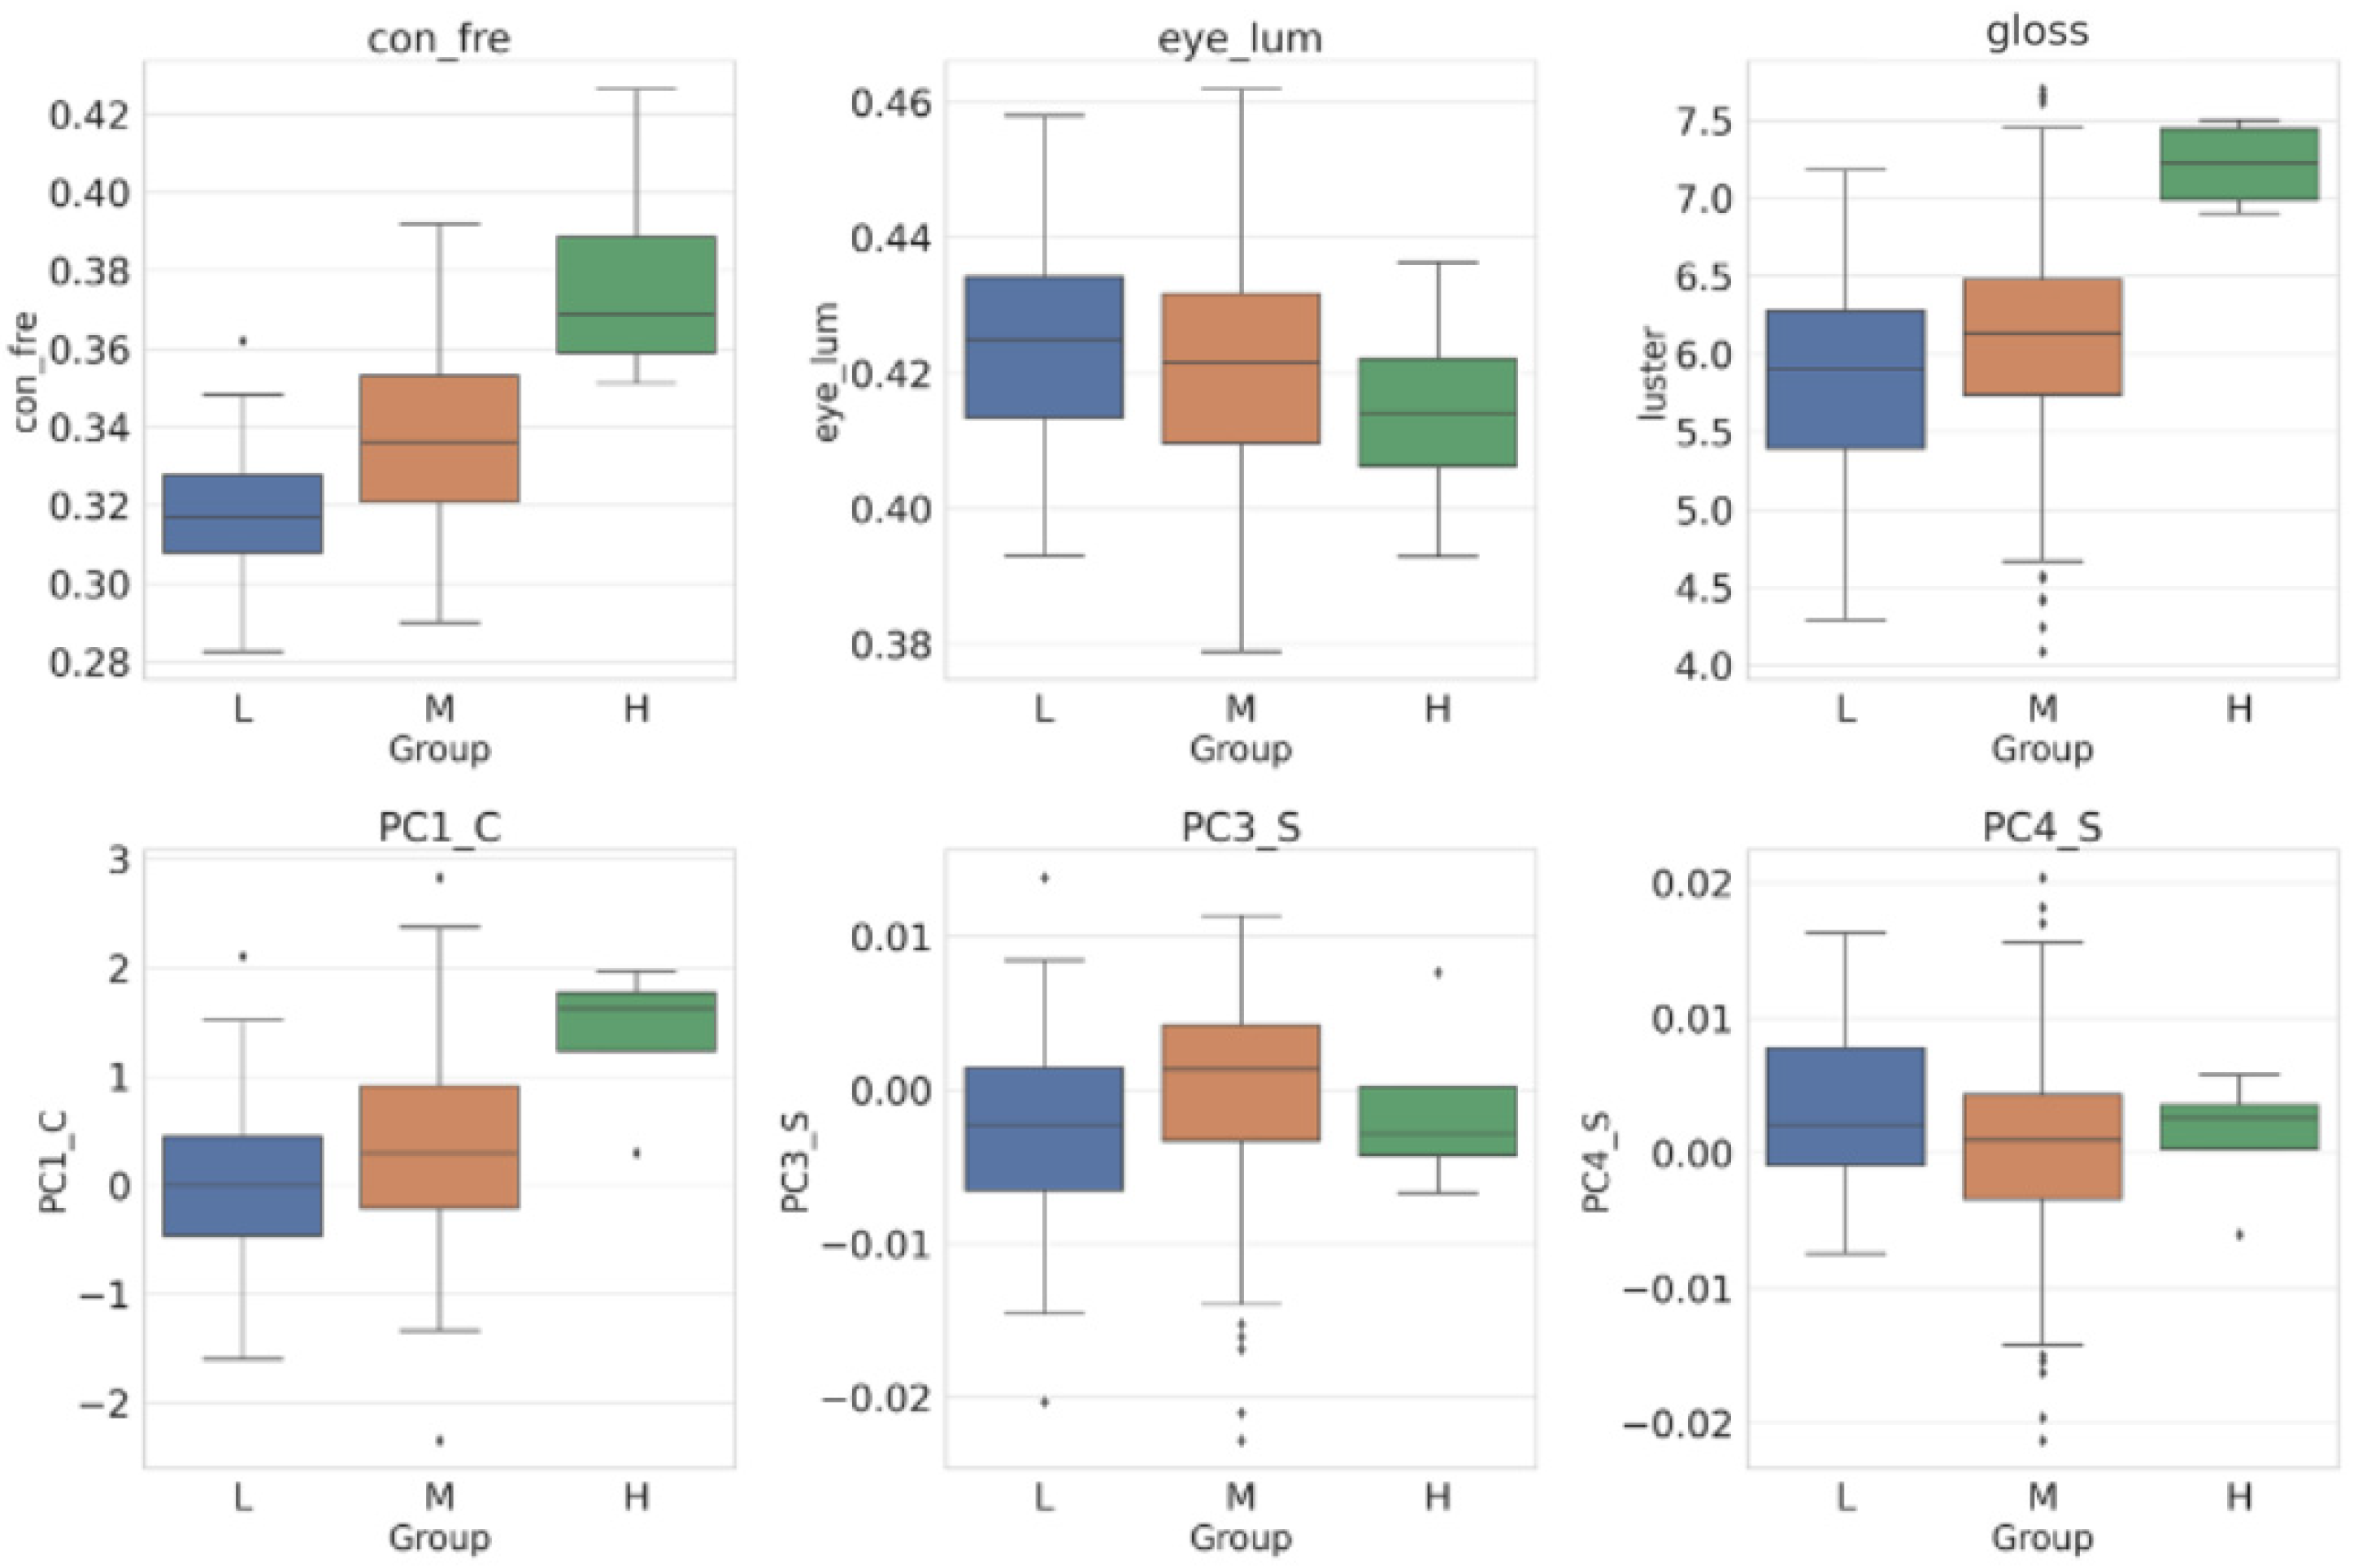
| eye_lum | 0.59 ** | −0.17 * |
| PC1_C | 0.17 * | 0.51 ** |
| PC2_C | −0.36 ** | 0.1 |
| PC3_C | −0.18 ** | 0.23 ** |
| PC4_C | 0.02 | 0.01 |
| PC5_C | −0.07 | 0.03 |
| PC6_C | 0.11 | 0.15 * |
| PC7_C | 0.04 | −0.17 * |
| PC8_C | 0.02 | −0.04 |
| PC9_C | −0.02 | 0.06 |
| Score | Con_Fre | |
|---|---|---|
| PC1_S | −0.1 | −0.05 |
| PC2_S | −0.04 | −0.2 ** |
| PC3_S | 0.01 | −0.03 |
| PC4_S | 0.13 | −0.12 |
| PC5_S | −0.01 | −0.26 ** |
| PC6_S | −0.09 | −0.19 ** |
| PC7_S | −0.06 | −0.02 |
| PC8_S | 0 | 0.14 * |
| PC9_S | 0.02 | 0.04 |
Disclaimer/Publisher’s Note: The statements, opinions and data contained in all publications are solely those of the individual author(s) and contributor(s) and not of MDPI and/or the editor(s). MDPI and/or the editor(s) disclaim responsibility for any injury to people or property resulting from any ideas, methods, instructions or products referred to in the content. |
© 2024 by the authors. Licensee MDPI, Basel, Switzerland. This article is an open access article distributed under the terms and conditions of the Creative Commons Attribution (CC BY) license (https://creativecommons.org/licenses/by/4.0/).
Share and Cite
Li, P.; Sakai, Y.; Kurokura, H.; Yagi, N. Can Consumers Judge the Freshness of Fish from Visual Cues? A Case Study of Japanese Consumers. Foods 2024, 13, 3191. https://doi.org/10.3390/foods13193191
Li P, Sakai Y, Kurokura H, Yagi N. Can Consumers Judge the Freshness of Fish from Visual Cues? A Case Study of Japanese Consumers. Foods. 2024; 13(19):3191. https://doi.org/10.3390/foods13193191
Chicago/Turabian StyleLi, Penglong, Yutaro Sakai, Hisashi Kurokura, and Nobuyuki Yagi. 2024. "Can Consumers Judge the Freshness of Fish from Visual Cues? A Case Study of Japanese Consumers" Foods 13, no. 19: 3191. https://doi.org/10.3390/foods13193191
APA StyleLi, P., Sakai, Y., Kurokura, H., & Yagi, N. (2024). Can Consumers Judge the Freshness of Fish from Visual Cues? A Case Study of Japanese Consumers. Foods, 13(19), 3191. https://doi.org/10.3390/foods13193191


