Effect of Freeze–Thaw Cycles on the Freshness of Prepackaged Penaeus vannamei

Abstract
:
1. Introduction
2. Materials and Methods
2.1. Materials
2.2. Sample Preparation
2.3. Determination of Physicochemical Properties
2.3.1. Sensory Evaluation
2.3.2. Total Plate Count (TPC)
2.3.3. pH and Total Volatile Basic Nitrogen (TVB-N) Measurement
2.3.4. Texture Property Analysis (TPA)
2.4. Extraction of Myofibrillar Protein (MP)
2.5. Sodium Dodecyl Sulfate-Polyacrylamide Gel Electrophoresis (SDS-PAGE)
2.6. Moisture Measurement
2.6.1. Moisture Content
2.6.2. Water Holding Capacity (WHC)
2.6.3. LF-NMR and MRI
2.7. Electronic Nose
2.8. Statistical Analysis
3. Results and Discussion
3.1. Sensory Evaluation
3.2. Physicochemical Analysis
3.2.1. TPC
3.2.2. TVB-N
3.2.3. pH
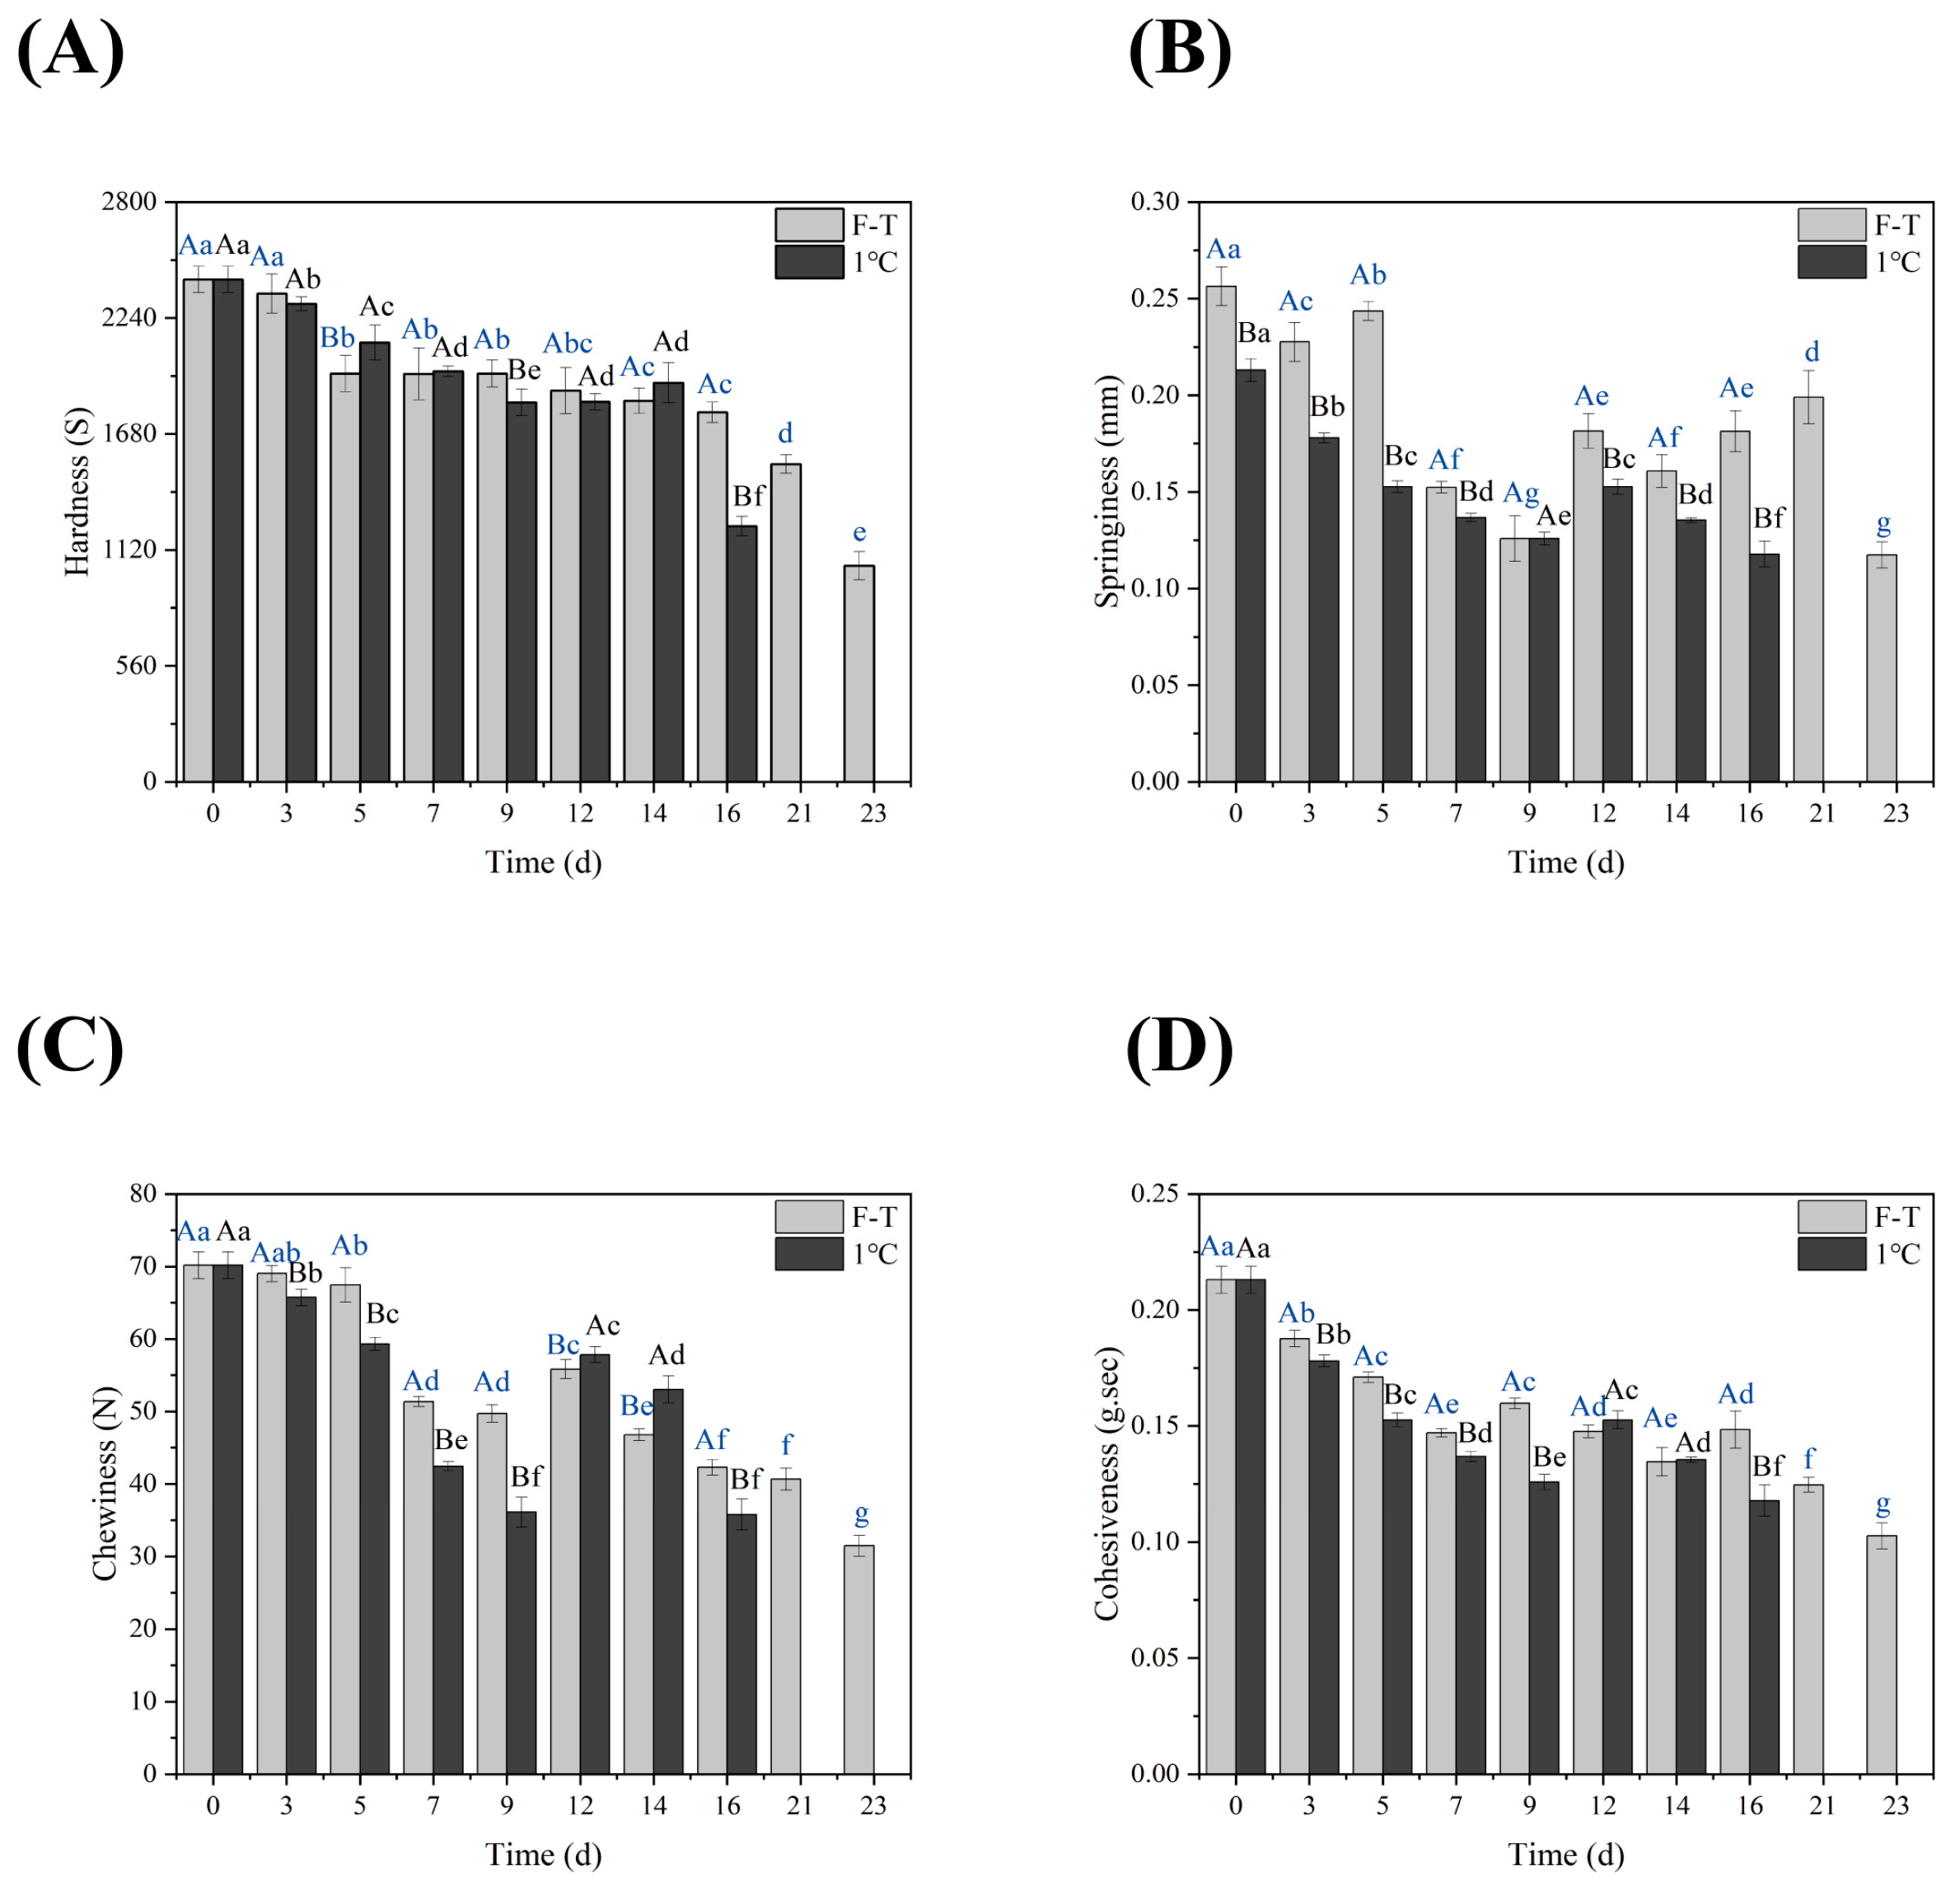
3.3. TPA
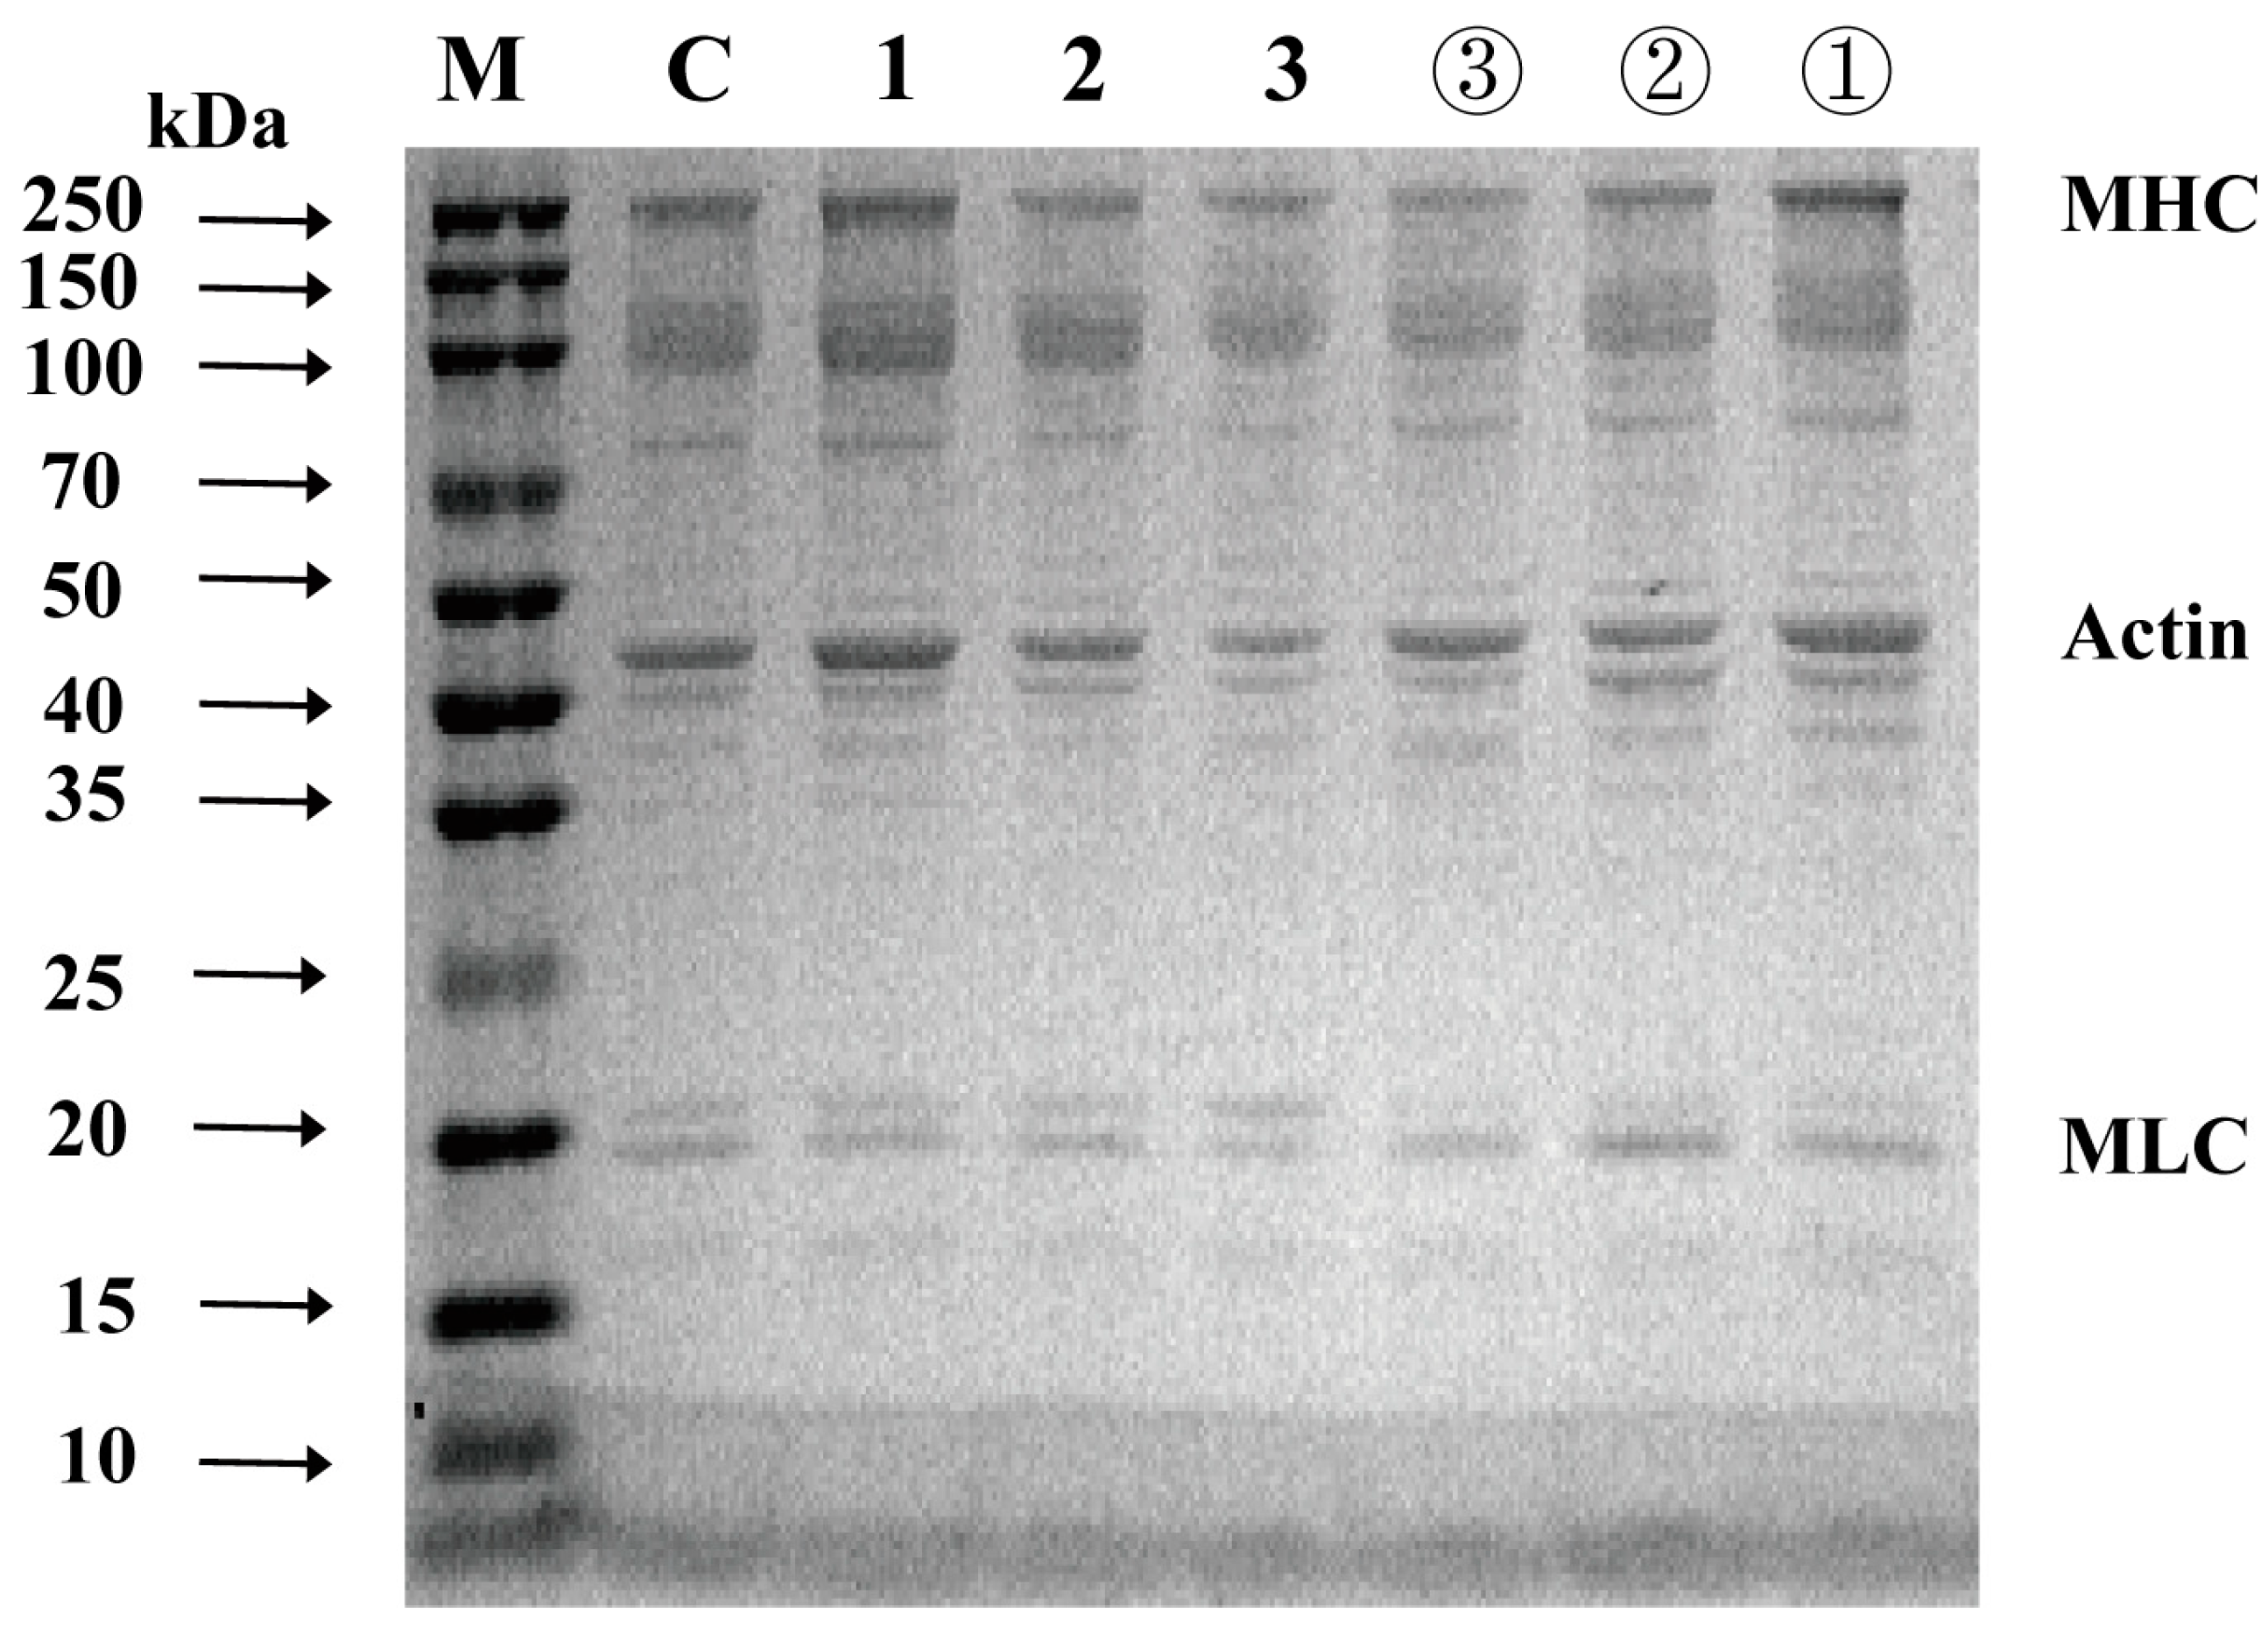
3.4. SDS-PAGE
3.5. Moisture Variation
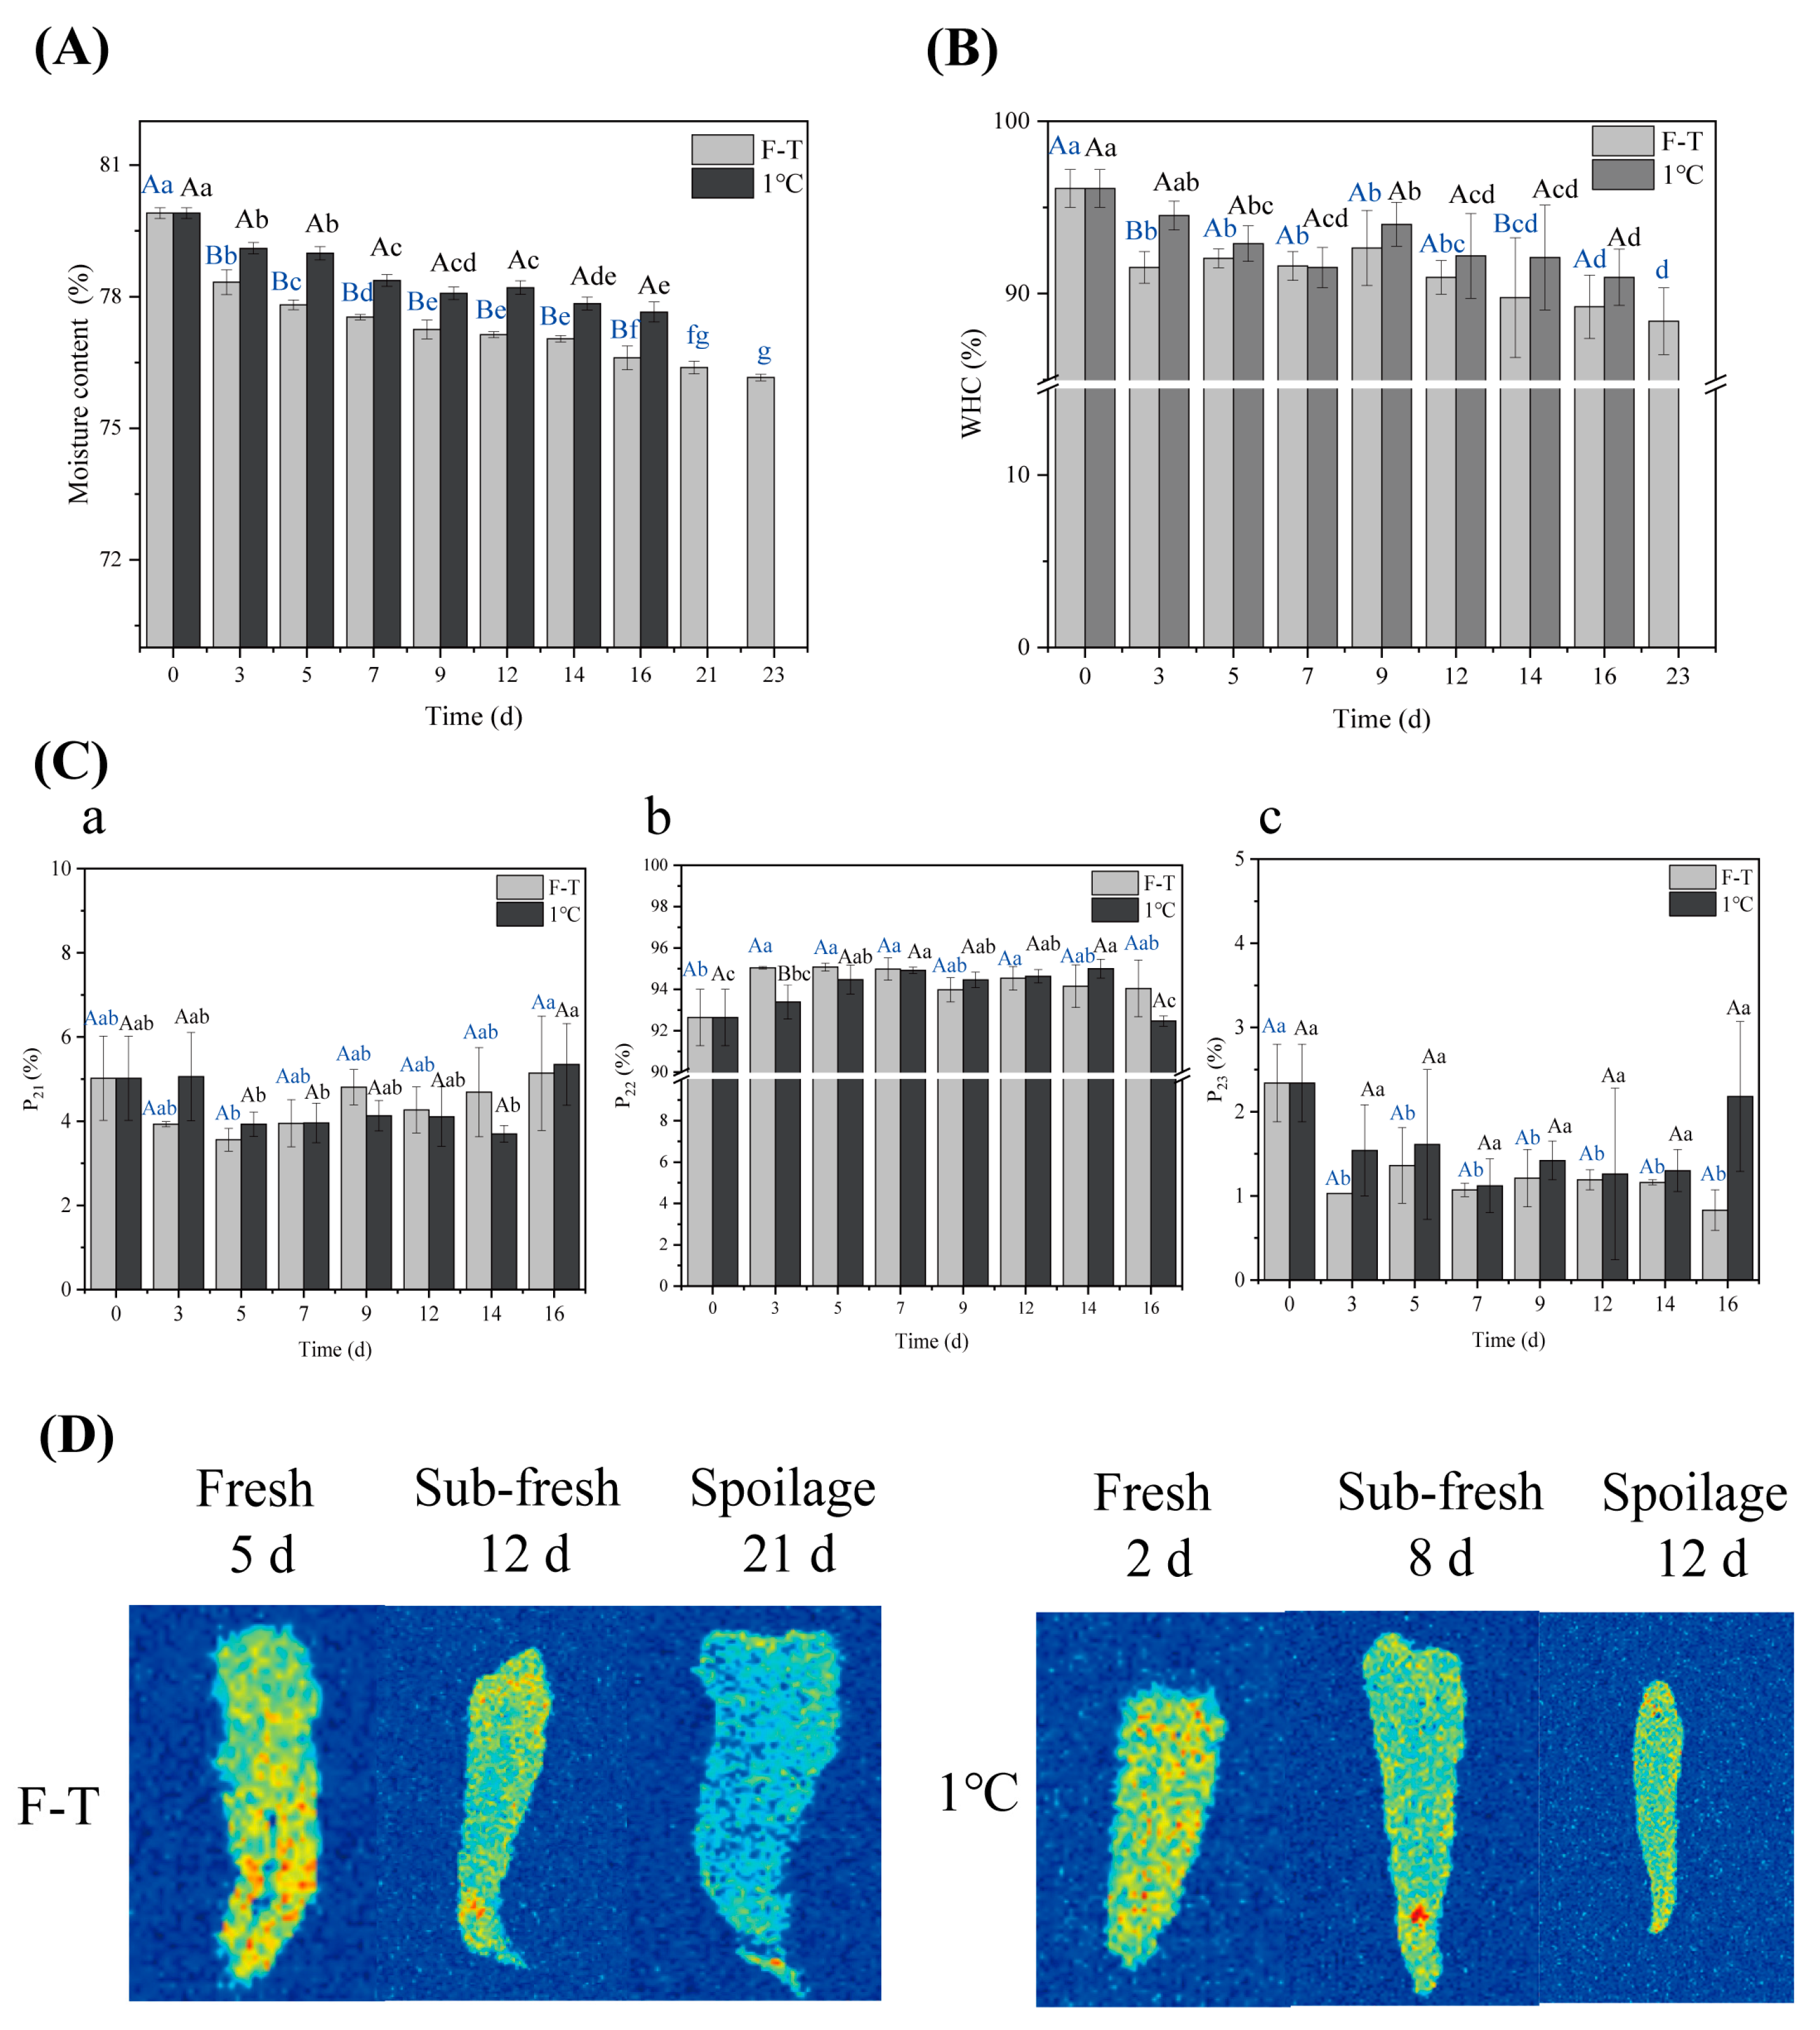
3.5.1. Moisture Content and WHC
3.5.2. LF-NMR and MRI
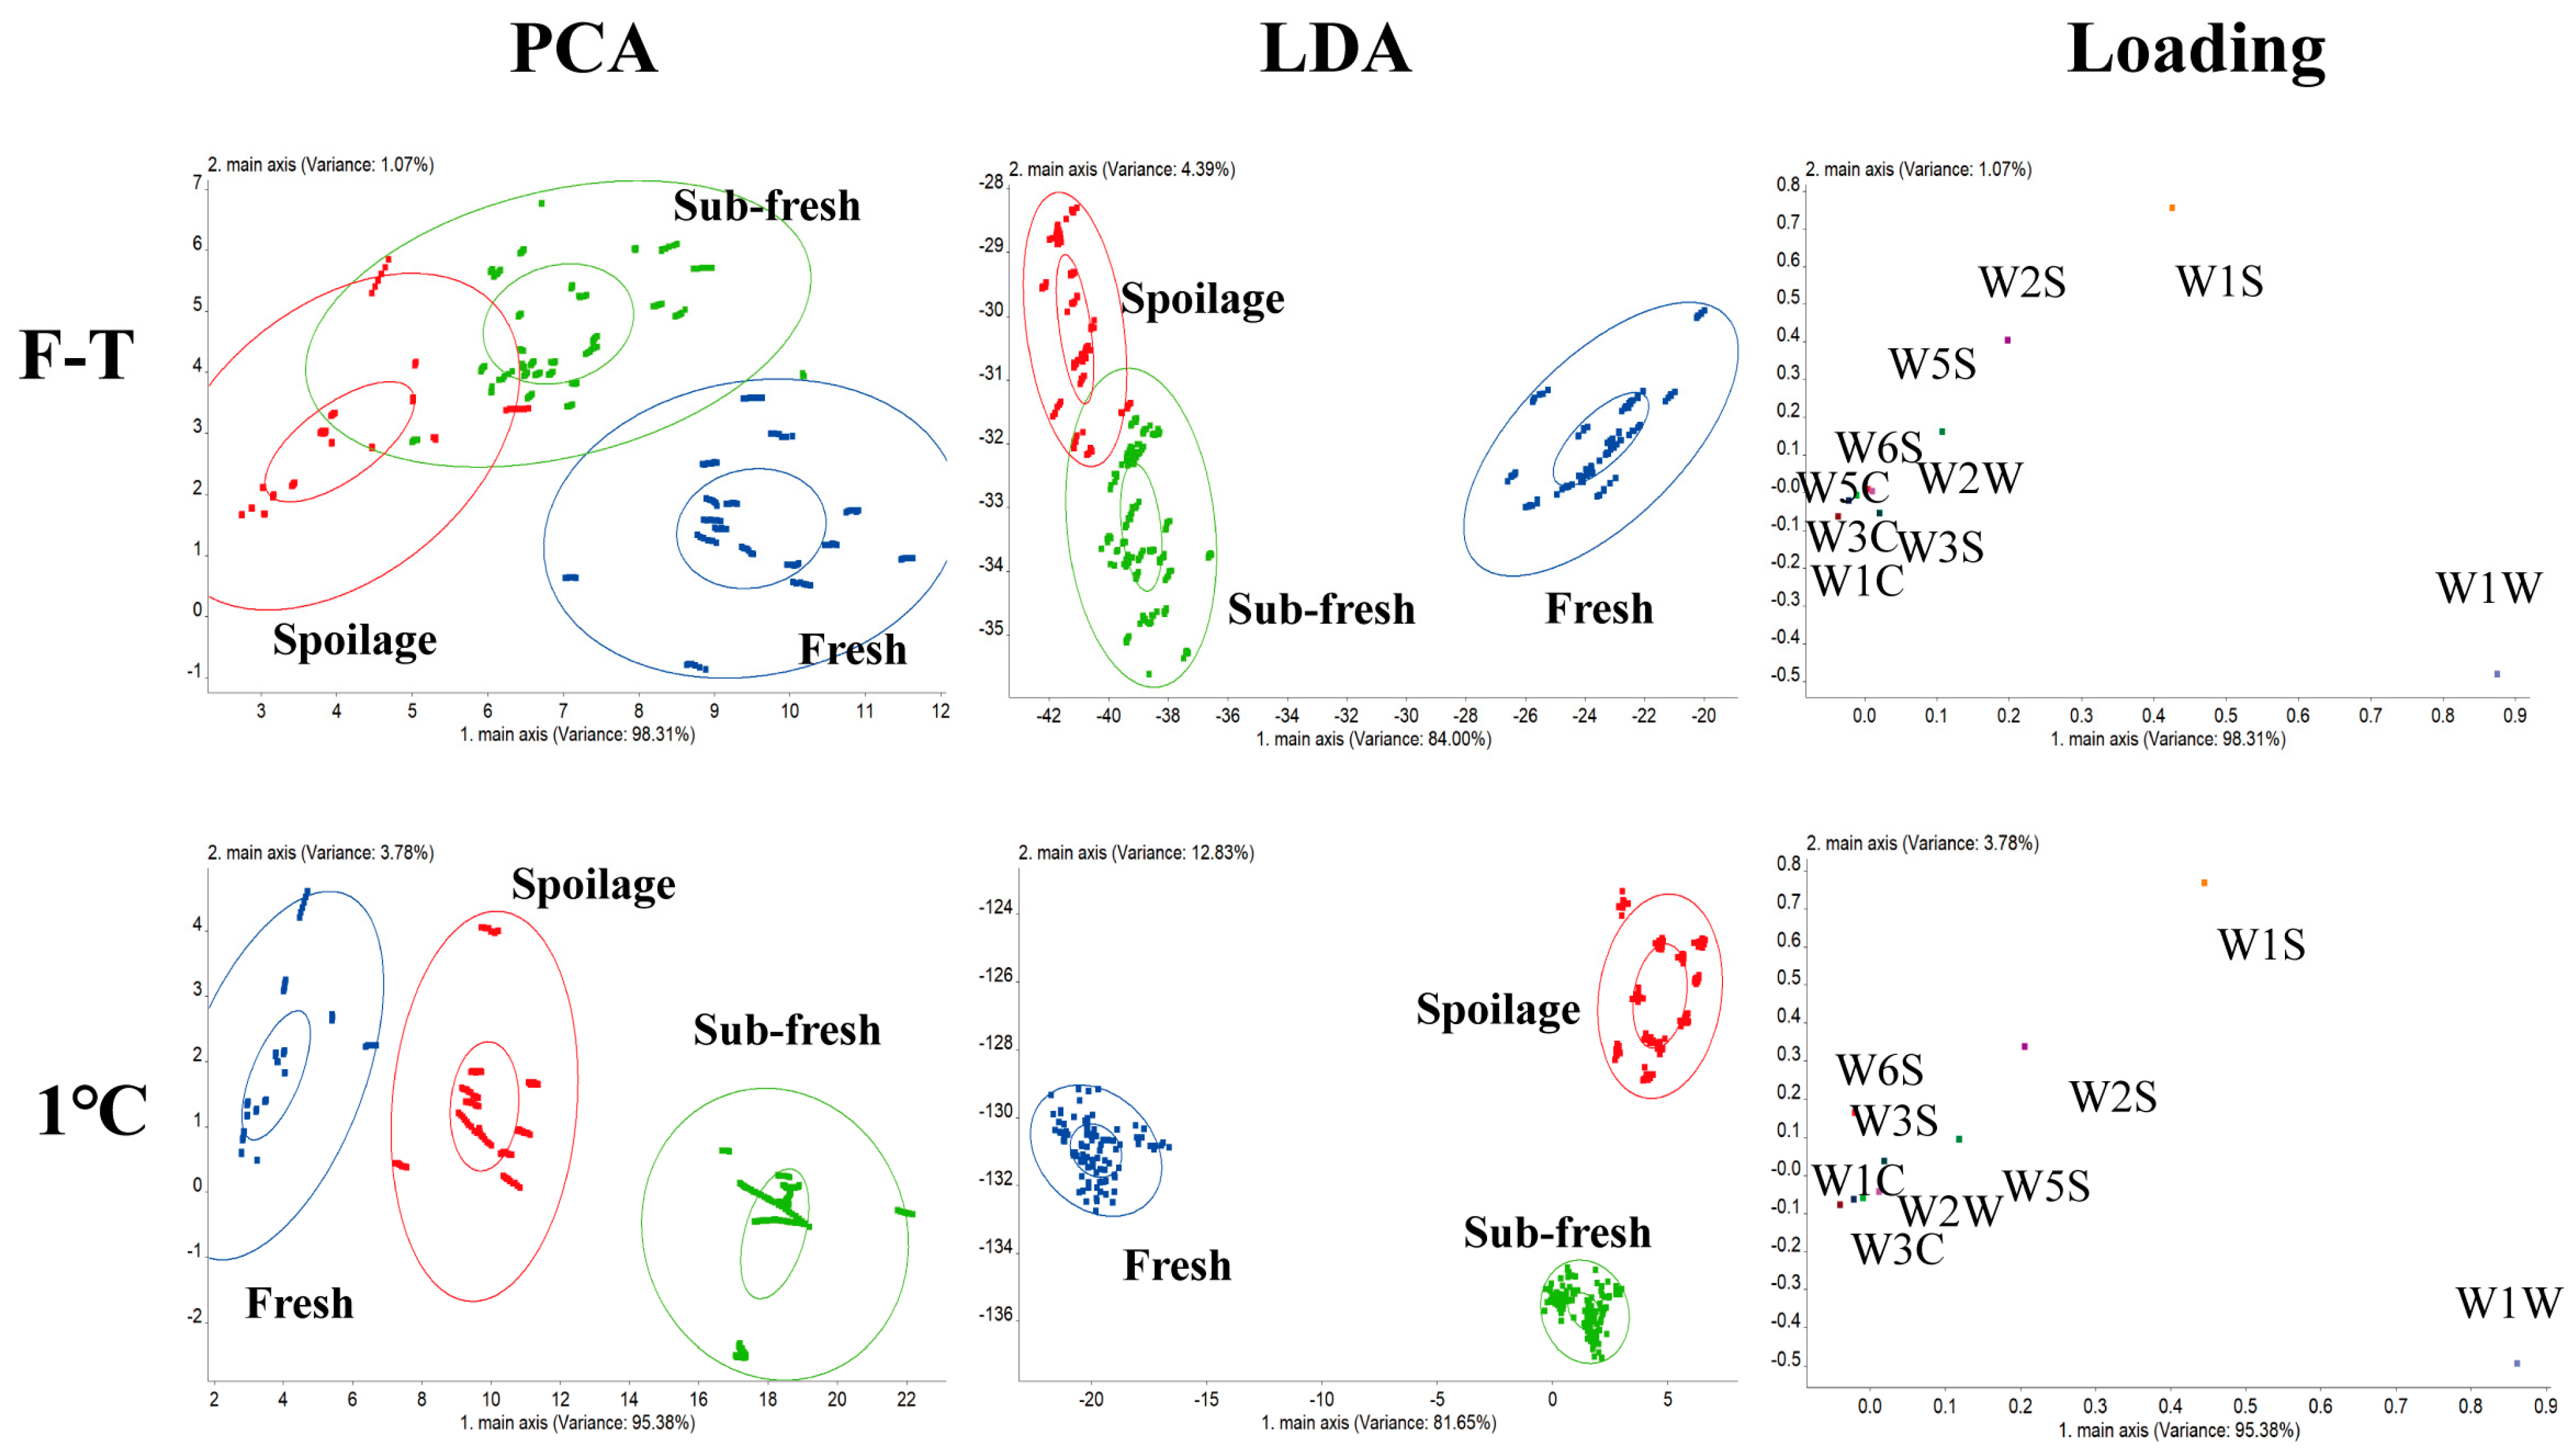
3.6. Analysis of Shrimp Freshness Model
3.6.1. The Freshness of Different Odors
3.6.2. Sensor Discrimination Model for Different TPC Contents
3.6.3. Sensor Discrimination Model for Different TVB-N Contents
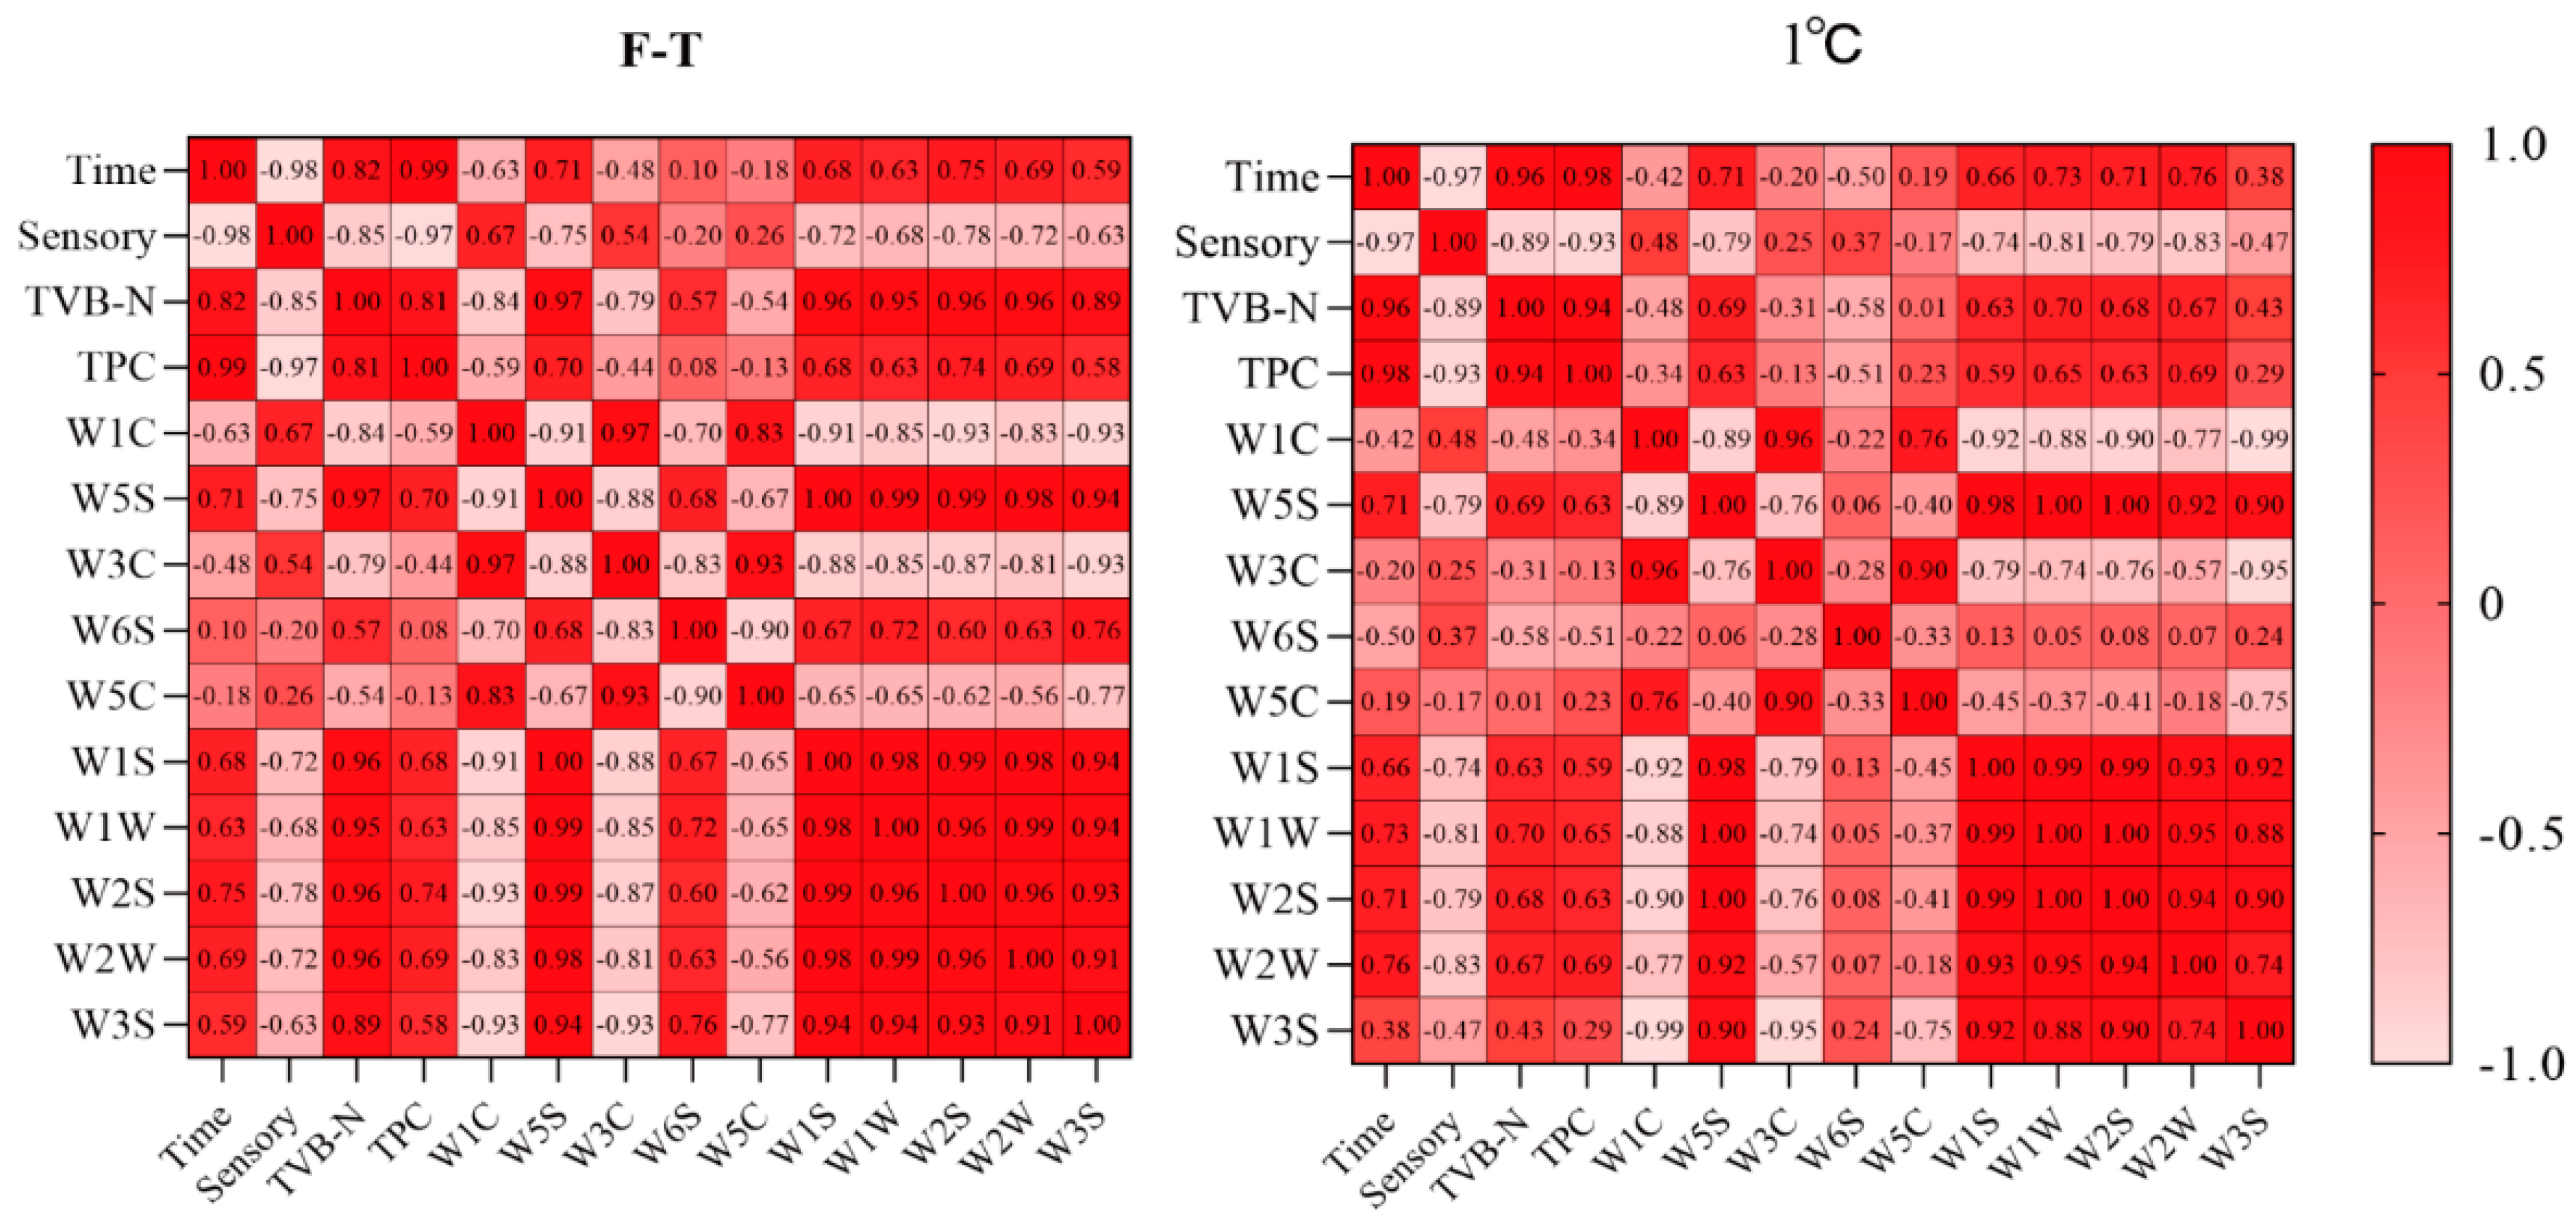
3.6.4. Correlation Analysis
4. Conclusions
Supplementary Materials
Author Contributions
Funding
Institutional Review Board Statement
Informed Consent Statement
Data Availability Statement
Conflicts of Interest
References
- Qiao, X.; Yang, L.; Gao, Q.; Yang, S.; Li, Z.; Xu, J.; Xue, C. Oxidation evaluation of free astaxanthin and astaxanthin esters in Pacific white shrimp during iced storage and frozen storage. J. Sci. Food Agric. 2019, 99, 2226–2235. [Google Scholar] [CrossRef]
- Pan, C.; Chen, S.; Hao, S.; Yang, X. Effect of low-temperature preservation on quality changes in Pacific white shrimp, Litopenaeus vannamei: A review. J. Sci. Food Agric. 2019, 99, 6121–6128. [Google Scholar] [CrossRef]
- Bono, G.; Okpala, C.O.R.; Alberio, G.R.; Messina, C.M.; Santulli, A.; Giacalone, G.; Spagna, G. Toward shrimp consumption without chemicals: Combined effects of freezing and modified atmosphere packaging (MAP) on some quality characteristics of Giant Red Shrimp (Aristaeomorpha foliacea) during storage. Food Chem. 2016, 197, 581–588. [Google Scholar] [CrossRef]
- Alparslan, Y.; Baygar, T. Effect of chitosan film coating combined with orange peel essential oil on the shelf life of deepwater pink shrimp. Food Bioprocess Technol. 2017, 10, 842–853. [Google Scholar] [CrossRef]
- Mahto, R.; Ghosh, S.; Das, M.K.; Das, M. Effect of gamma irradiation and frozen storage on the quality of fresh water prawn (Macrobrachium rosenbergii) and tiger prawn (Penaeus monodon). LWT-Food Sci. Technol. 2015, 61, 573–582. [Google Scholar] [CrossRef]
- Zheng, Y.; Zhou, F.; Zhang, L.; Wang, H.; Wang, X. Effect of different extent of protein oxidation on the frozen storage stability of muscle protein in obscure pufferfish (Takifugu obscurus). LWT-Food Sci. Technol. 2021, 137, 110416. [Google Scholar] [CrossRef]
- Zhang, B.; Fang, C.; Hao, G.; Zhang, Y. Effect of kappa-carrageenan oligosaccharides on myofibrillar protein oxidation in peeled shrimp (Litopenaeus vannamei) during long-term frozen storage. Food Chem. 2018, 245, 254–261. [Google Scholar] [CrossRef]
- Bak, L.S.; Andersen, A.B.; Andersen, E.M.; Bertelsen, G. Effect of modified atmosphere packaging on oxidative changes in frozen stored cold water shrimp (Pandalus borealis). Food Chem. 1999, 64, 169–175. [Google Scholar] [CrossRef]
- Wachirasiri, K.; Wanlapa, S.; Uttapap, D.; Rungsardthong, V. Use of amino acids as a phosphate alternative and their effects on quality of frozen white shrimps (Penaeus vanamei). LWT-Food Sci. Technol. 2016, 69, 303–311. [Google Scholar] [CrossRef]
- GB/T 31080-2014; Specification for Cold Chain Logistics Services for Aquatic Products. National Standardization Administration: Beijing, China, 2014.
- Moureh, J.; Derens, E. Numerical modelling of the temperature increase in frozen food packaged in pallets in the distribution chain. Int. J. Refrig.-Rev. Int. Froid 2000, 23, 540–552. [Google Scholar] [CrossRef]
- Zhang, B.; Cao, H.; Lin, H.; Deng, S.; Wu, H. Insights into ice-growth inhibition by trehalose and alginate oligosaccharides in peeled Pacific white shrimp (Litopenaeus vannamei) during frozen storage. Food Chem. 2019, 278, 482–490. [Google Scholar] [CrossRef] [PubMed]
- Remya, S.; Basu, S.; Venkateshwarlu, G.; Mohan, C.O. Quality of shrimp analogue product as affected by addition of modified potato starch. J. Food Sci. Technol.-Mysore 2015, 52, 4432–4440. [Google Scholar] [CrossRef]
- Dang, H.T.T.; Gudjónsdóttir, M.; Tómasson, T.; Nguyen, M.V.; Karlsdóttir, M.G.; Arason, S. Influence of processing additives, packaging and storage conditions on the physicochemical stability of frozen Tra catfish (Pangasius hypophthalmus) fillets. J. Food Eng. 2018, 238, 148–155. [Google Scholar] [CrossRef]
- Zhu, J.Y.; Li, S.S.; Yang, L.; Zhao, Z.R.; Xia, J.L.; Zhu, Y.Y.; Li, C.B. Effect of multiple freeze-thaw cycles on water migration, protein conformation and quality attributes of beef longissimus dorsi muscle by real-time low field nuclear magnetic resonance and Raman spectroscopy. Food Res. Int. 2023, 166, 112644. [Google Scholar] [CrossRef] [PubMed]
- Ma, L.; Zhang, B.; Deng, S.; Xie, C. Comparison of the cryoprotective effects of trehalose, alginate, and its oligosaccharides on peeled shrimp (Litopenaeus vannamei) during frozen storage. J. Food Sci. 2015, 80, C540–C546. [Google Scholar]
- Cheng, S.; Wang, X.; Li, R.; Yang, H.; Wang, H.; Wang, H.; Tan, M. Influence of multiple freeze-thaw cycles on quality characteristics of beef semimembranous muscle: With emphasis on water status and distribution by LF-NMR and MRI. Meat Sci. 2019, 147, 44–52. [Google Scholar]
- Boonsumrej, S.; Chaiwanichsiri, S.; Tantratian, S.; Suzuki, T.; Takai, R. Effects of freezing and thawing on the quality changes of tiger shrimp (Penaeus monodon) frozen by air-blast and cryogenic freezing. J. Food Eng. 2007, 80, 292–299. [Google Scholar] [CrossRef]
- Sriket, P.; Benjakul, S.; Visessanguan, W.; Kijroongrojana, K. Comparative studies on the effect of the freeze–thawing process on the physicochemical properties and microstructures of black tiger shrimp (Penaeus monodon) and white shrimp (Penaeus vannamei) muscle. Food Chem. 2007, 104, 113–121. [Google Scholar] [CrossRef]
- Thanonkaew, A.; Benjakul, S.; Visessanguan, W.; Decker, E.A. The effect of metal ions on lipid oxidation, colour and physicochemical properties of cuttlefish (Sepia pharaonis) subjected to multiple freeze–thaw cycles. Food Chem. 2006, 95, 591–599. [Google Scholar]
- Rahman, M.; Yasmin, L.; Kamal, M.; Islam, M.; Ahmed, S.; Mazid, M. Studies on the post-mortem changes in shrimp and prawn during ice storage. Pt. 1. Organoleptic and physical changes. Bangladesh J. Fish. Res. 2000, 4, 83–89. [Google Scholar]
- GB 4789.2-2022; National Standard for Food Safety Microbiological Examination of Food Determination of Total Colonies. The National Health Commission, the State Administration of Market Supervision and Administration: Beijing, China, 2022.
- GB 5009.228-2016; National Standard for Food Safety Determination of Volatile Salt Nitrogen in Foods. National Health and Family Planning Commission: Beijing, China, 2016.
- Peng, X.; Liu, C.; Wang, B.; Kong, L.; Wen, R.; Zhang, H.; Yu, X.; Bai, Y.; Jang, A. Hygroscopic properties of whey protein hydrolysates and their effects on water retention in pork patties during repeated freeze–thaw cycles. LWT-Food Sci. Technol. 2023, 114984, 114984. [Google Scholar] [CrossRef]
- Lan, W.; Hu, X.; Sun, X.; Zhang, X.; Xie, J. Effect of the number of freeze-thaw cycles number on the quality of Pacific white shrimp (Litopenaeus vannamei): An emphasis on moisture migration and microstructure by LF-NMR and SEM. Aquac. Fish. 2020, 5, 193–200. [Google Scholar] [CrossRef]
- Bertram, H.C.; Andersen, H.J.; Karlsson, A.H. Comparative study of low-field NMR relaxation measurements and two traditional methods in the determination of water holding capacity of pork. Meat Sci. 2001, 57, 125–132. [Google Scholar] [CrossRef]
- Wang, H.; Wang, R.; Song, Y.; Kamal, T.; Lv, Y.; Zhu, B.; Tao, X.; Tan, M. A fast and non-destructive LF-NMR and MRI method to discriminate adulterated shrimp. J. Food Meas. Charact. 2018, 12, 1340–1349. [Google Scholar]
- Cheng, X.; Zhang, M.; Adhikari, B.; Islam, M.N. Effect of power ultrasound and pulsed vacuum treatments on the dehydration kinetics, distribution, and status of water in osmotically dehydrated strawberry: A combined NMR and DSC study. Food Bioprocess Technol. 2014, 7, 2782–2792. [Google Scholar] [CrossRef]
- Li, Y.; Yuan, L.; Liu, H.; Liu, H.; Zhou, Y.; Li, M.; Gao, R. Analysis of the changes of volatile flavor compounds in a traditional Chinese shrimp paste during fermentation based on electronic nose, SPME-GC-MS and HS-GC-IMS. Food Sci. Hum. Wellness 2023, 12, 173–182. [Google Scholar] [CrossRef]
- Lin, D.; Sun, L.; Chen, Y.; Liu, G.; Miao, S.; Cao, M. Shrimp spoilage mechanisms and functional films/coatings used to maintain and monitor its quality during storage. Trends Food Sci. Technol. 2022, 129, 25–37. [Google Scholar] [CrossRef]
- Li, H.; Chen, Q.; Zhao, J.; Wu, M. Nondestructive detection of total volatile basic nitrogen (TVB-N) content in pork meat by integrating hyperspectral imaging and colorimetric sensor combined with a nonlinear data fusion. LWT-Food Sci. Technol. 2015, 63, 268–274. [Google Scholar]
- Liu, J.; Wang, H.; Guo, M.; Li, L.; Chen, M.; Jiang, S.; Li, X.; Jiang, S. Extract from Lycium ruthenicum Murr. Incorporating κ-carrageenan colorimetric film with a wide pH–sensing range for food freshness monitoring. Food Hydrocoll. 2019, 94, 1–10. [Google Scholar] [CrossRef]
- Yang, Z.; Tong, F.; Peng, Z.; Wang, L.; Zhu, L.; Jiang, W.; Xiong, G.; Zheng, M.; Zhou, Y.; Liu, Y. Development of colorimetric/Fluorescent two-channel intelligent response labels to monitor shrimp freshness. Food Hydrocoll. 2023, 135, 108125. [Google Scholar] [CrossRef]
- Yang, S.; Xie, J.; Qian, Y. Determination of spoilage microbiota of Pacific white shrimp during ambient and cold storage using next-generation sequencing and culture-dependent method. J. Food Sci. 2017, 82, 1178–1183. [Google Scholar]
- Liao, X.; Su, Y.; Liu, D.; Chen, S.; Hu, Y.; Ye, X.; Wang, J.; Ding, T. Application of atmospheric cold plasma-activated water (PAW) ice for preservation of shrimps (Metapenaeus ensis). Food Control 2018, 94, 307–314. [Google Scholar] [CrossRef]
- Manju, S.; Jose, L.; Gopal, T.S.; Ravishankar, C.; Lalitha, K. Effects of sodium acetate dip treatment and vacuum-packaging on chemical, microbiological, textural and sensory changes of Pearlspot (Etroplus suratensis) during chill storage. Food Chem. 2007, 102, 27–35. [Google Scholar]
- Liu, Z.; Liu, Q.; Wei, S.; Sun, Q.; Xia, Q.; Zhang, D.; Shi, W.; Ji, H.; Liu, S. Quality and volatile compound analysis of shrimp heads during different temperature storage. Food Chem. X 2021, 12, 100156. [Google Scholar] [CrossRef]
- Annamalai, J.; Sasikala, R.; Debbarma, J.; Chandragiri Nagarajarao, R.; Abubacker Aliyamveetil, Z.; Ninan, G.; Ronda, V.; Kuttanapilly Velayudhanelayadom, L. Effect of delayed icing on the quality of white shrimp (Litopenaeus vannamei) during chilled storage. J. Food Process. Preserv. 2015, 39, 2878–2885. [Google Scholar] [CrossRef]
- Pornrat, S.; Sumate, T.; Rommanee, S.; Sumolaya, K.; Kerr, W. Changes in the ultrastructure and texture of prawn muscle (Macrobrachuim rosenbergii) during cold storage. LWT-Food Sci. Technol. 2007, 40, 1747–1754. [Google Scholar]
- Cao, Y.; Zhao, L.; Huang, Q.; Xiong, S.; Yin, T.; Liu, Z. Water migration, ice crystal formation, and freeze-thaw stability of silver carp surimi as affected by inulin under different additive amounts and polymerization degrees. Food Hydrocoll. 2022, 124, 107267. [Google Scholar] [CrossRef]
- Cai, L.; Wu, X.; Li, X.; Zhong, K.; Li, Y.; Li, J. Effects of different freezing treatments on physicochemical responses and microbial characteristics of Japanese sea bass (Lateolabrax japonicas) fillets during refrigerated storage. LWT-Food Sci. Technol. 2014, 59, 122–129. [Google Scholar] [CrossRef]
- Liu, H.; Zhang, H.; Liu, Q.; Chen, Q.; Kong, B. Filamentous myosin in low-ionic strength meat protein processing media: Assembly mechanism, impact on protein functionality, and inhibition strategies. Trends Food Sci. Technol. 2021, 112, 25–35. [Google Scholar] [CrossRef]
- Chen, Q.; Xie, Y.; Xi, J.; Guo, Y.; Qian, H.; Cheng, Y.; Chen, Y.; Yao, W. Characterization of lipid oxidation process of beef during repeated freeze-thaw by electron spin resonance technology and Raman spectroscopy. Food Chem. 2018, 243, 58–64. [Google Scholar] [CrossRef]
- Oliveira, M.E.D.; Gonçalves, A.A. The effect of different food grade additives on the quality of Pacific white shrimp (Litopenaeus vannamei) after two freeze-thaw cycles. LWT 2019, 113, 108301. [Google Scholar]
- Teuteberg, V.; Kluth, I.K.; Ploetz, M.; Krischek, C. Effects of duration and temperature of frozen storage on the quality and food safety characteristics of pork after thawing and after storage under modified atmosphere. Meat Sci. 2021, 174, 108419. [Google Scholar] [CrossRef] [PubMed]
- Zhang, Y.; Kim, Y.; Puolanne, E.; Ertbjerg, P. Role of freezing-induced myofibrillar protein denaturation in the generation of thaw loss: A review. Meat Sci. 2022, 190, 108841. [Google Scholar] [CrossRef] [PubMed]
- Qian, S.; Hu, F.; Mehmood, W.; Li, X.; Zhang, C.; Blecker, C. The rise of thawing drip: Freezing rate effects on ice crystallization and myowater dynamics changes. Food Chem. 2022, 373, 131461. [Google Scholar] [CrossRef]
- Kong, L.R.; Liu, C.Y.; Tang, H.X.; Yu, P.J.; Wen, R.X.; Peng, X.Y.; Xu, X.L.; Yu, X.B. Hygroscopicity and antioxidant activity of whey protein hydrolysate and its ability to improve the water holding capacity of pork patties during freeze-thaw cycles. LWT-Food Sci. Technol. 2023, 182, 114784. [Google Scholar] [CrossRef]
- Jiang, Q.; Nakazawa, N.; Hu, Y.; Osako, K.; Okazaki, E. Microstructural modification and its effect on the quality attributes of frozen-thawed bigeye tuna (Thunnus obesus) meat during salting. LWT-Food Sci. Technol. 2019, 100, 213–219. [Google Scholar]
- Zhou, K.; Zhang, J.; Xie, Y.; Wang, Z.; Wu, X.; Li, C.; Wang, W.; Zhou, H.; Xu, B. Hemin from porcine blood effectively stabilized color appearance and odor of prepared pork chops upon repeated freeze-thaw cycles. Meat Sci. 2021, 175, 108432. [Google Scholar] [CrossRef]
- Ghasemi-Varnamkhasti, M.; Mohtasebi, S.S.; Rodriguez-Mendez, M.L.; Lozano, J.; Razavi, S.H.; Ahmadi, H.; Apetrei, C. Classification of non-alcoholic beer based on aftertaste sensory evaluation by chemometric tools. Expert Syst. Appl. 2012, 39, 4315–4327. [Google Scholar]

Disclaimer/Publisher’s Note: The statements, opinions and data contained in all publications are solely those of the individual author(s) and contributor(s) and not of MDPI and/or the editor(s). MDPI and/or the editor(s) disclaim responsibility for any injury to people or property resulting from any ideas, methods, instructions or products referred to in the content. |
© 2024 by the authors. Licensee MDPI, Basel, Switzerland. This article is an open access article distributed under the terms and conditions of the Creative Commons Attribution (CC BY) license (https://creativecommons.org/licenses/by/4.0/).
Share and Cite
Liu, S.; Zhang, L.; Chen, J.; Li, Z.; Liu, M.; Hong, P.; Zhong, S.; Li, H. Effect of Freeze–Thaw Cycles on the Freshness of Prepackaged Penaeus vannamei. Foods 2024, 13, 305. https://doi.org/10.3390/foods13020305
Liu S, Zhang L, Chen J, Li Z, Liu M, Hong P, Zhong S, Li H. Effect of Freeze–Thaw Cycles on the Freshness of Prepackaged Penaeus vannamei. Foods. 2024; 13(2):305. https://doi.org/10.3390/foods13020305
Chicago/Turabian StyleLiu, Shouchun, Luyao Zhang, Jing Chen, Zhuyi Li, Meijiao Liu, Pengzhi Hong, Saiyi Zhong, and Haifeng Li. 2024. "Effect of Freeze–Thaw Cycles on the Freshness of Prepackaged Penaeus vannamei" Foods 13, no. 2: 305. https://doi.org/10.3390/foods13020305