Abstract
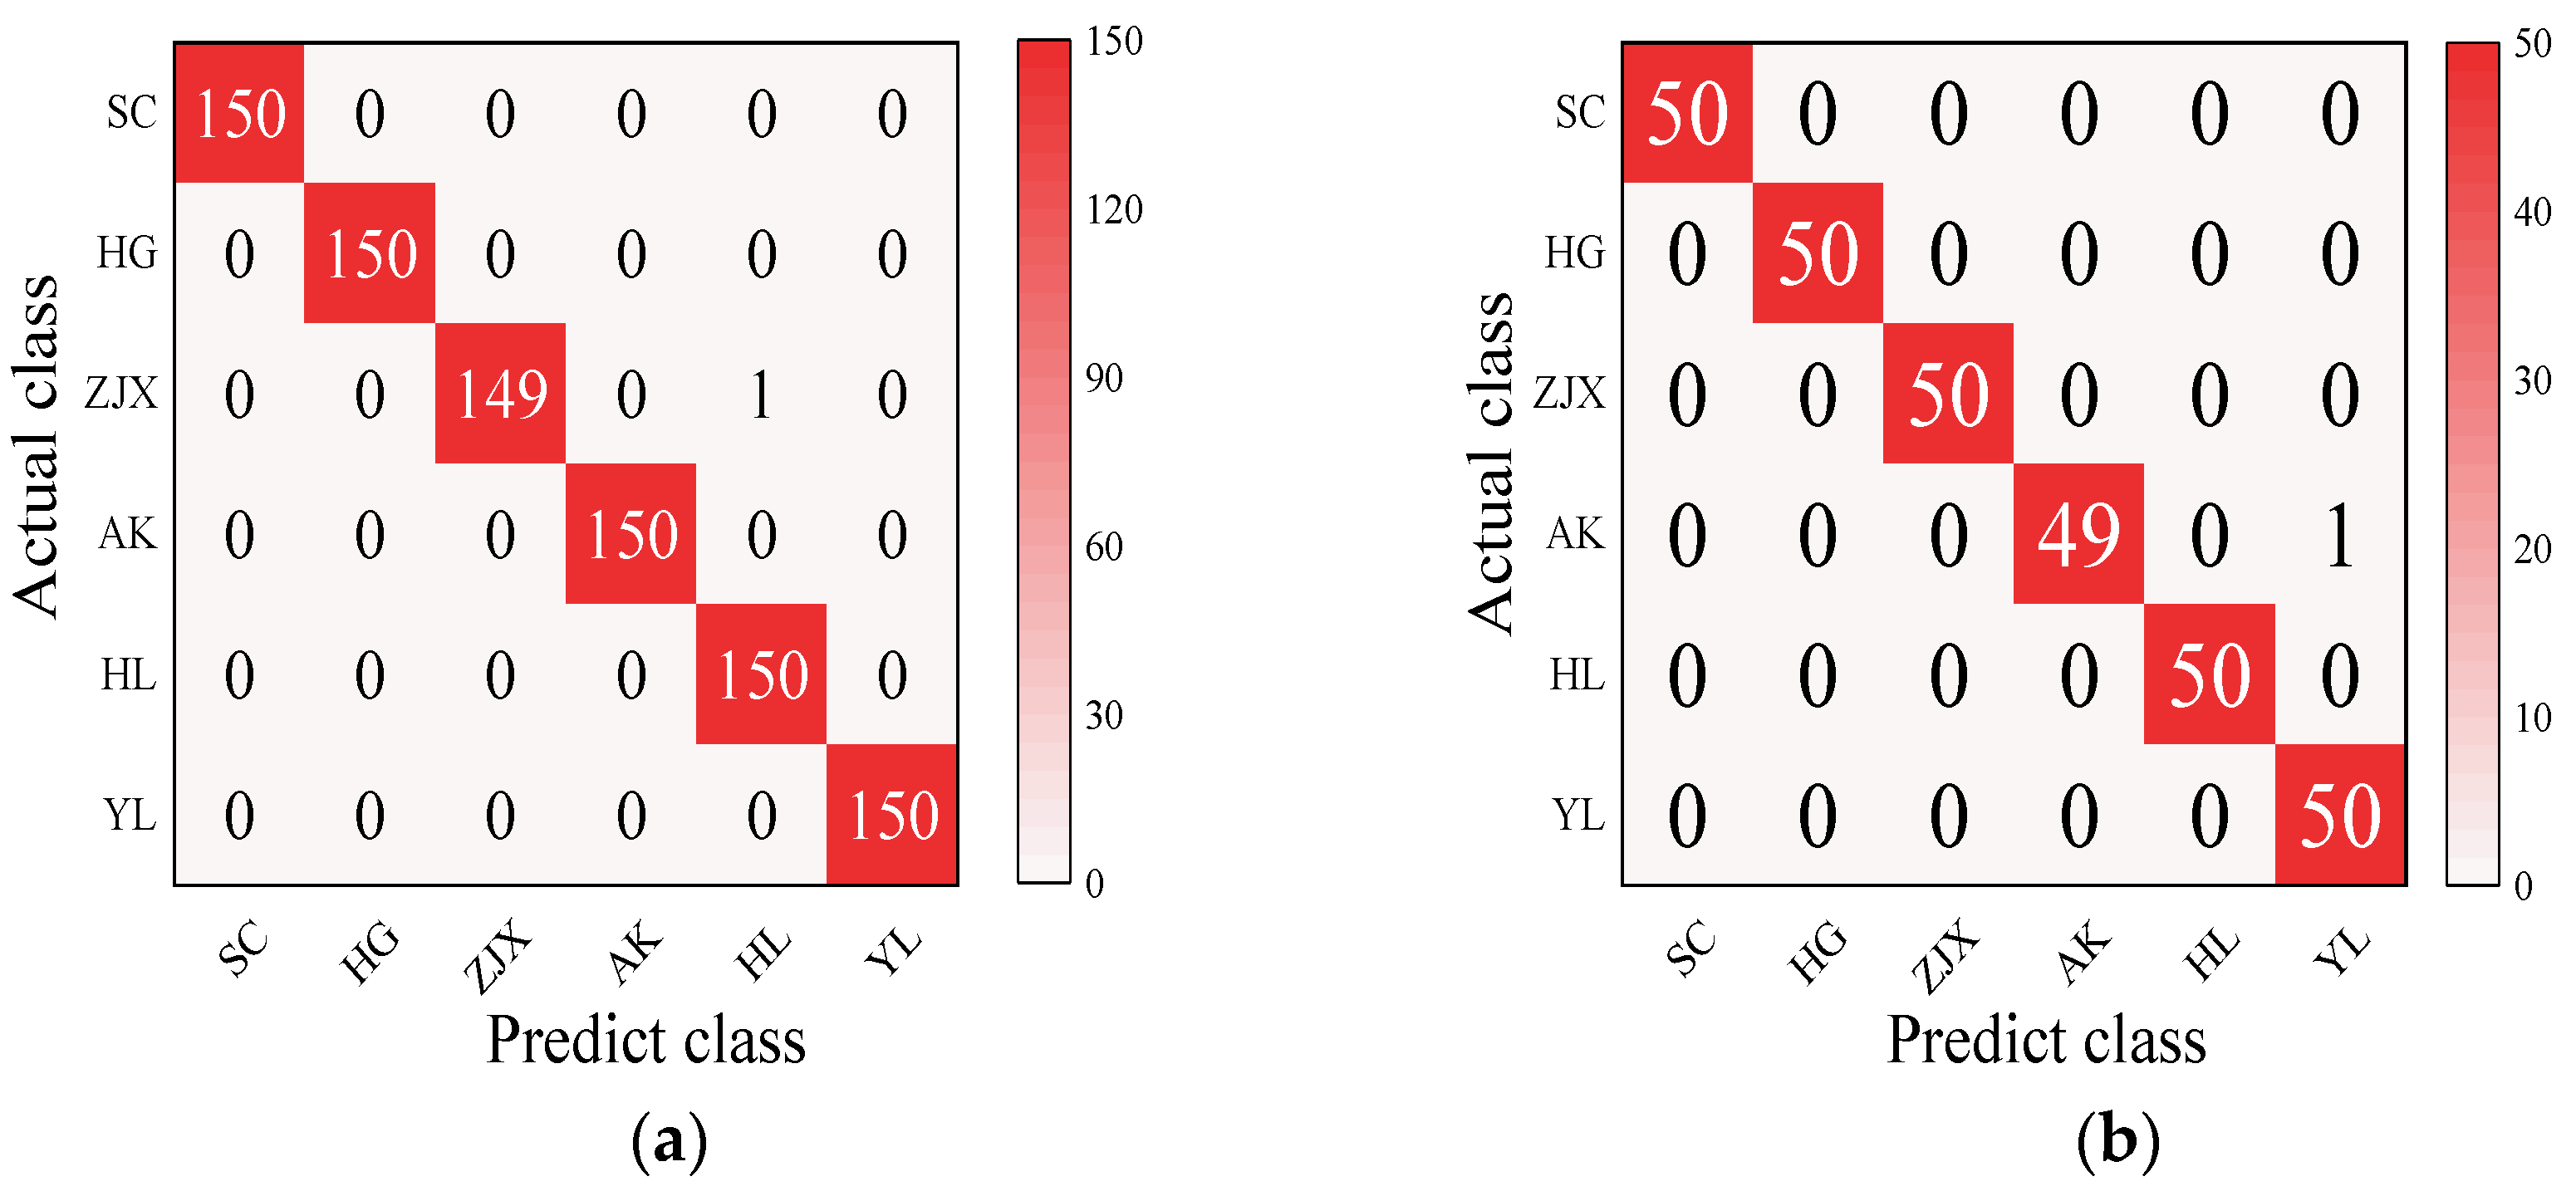
The non-destructive detection of fruit quality is indispensable in the agricultural and food industries. This study aimed to explore the application of hyperspectral imaging (HSI) technology, combined with machine learning, for a quality assessment of pears, so as to provide an efficient technical method. Six varieties of pears were used for inspection, including ‘Sucui No.1’, ‘Zaojinxiang’, ‘Huangguan’, ‘Akizuki’, ‘Yali’, and ‘Hongli No.1’. Spectral data within the 398~1004 nm wavelength range were analyzed to compare the predictive performance of the Least Squares Support Vector Machine (LS-SVM) models on various quality parameters, using different preprocessing methods and the selected feature wavelengths. The results indicated that the combination of Fast Detrend-Standard Normal Variate (FD-SNV) preprocessing and Competitive Adaptive Reweighted Sampling (CARS)-selected feature wavelengths yielded the best improvement in model predictive ability for forecasting key quality parameters such as firmness, soluble solids content (SSC), pH, color, and maturity degree. They could enhance the predictive capability and reduce computational complexity. Furthermore, in order to construct a quality prediction model, integrating hyperspectral data from six pear varieties resulted in an RPD (Ratio of Performance to Deviation) exceeding 2.0 for all the quality parameters, indicating that increasing the fruit sample size and variety number further strengthened the robustness of the model. The Backpropagation Neural Network (BPNN) model could accurately distinguish six distinct pear varieties, achieving prediction accuracies of above 99% for both the calibration and test sets. In summary, the combination of HSI and machine learning models enabled an efficient, rapid, and non-destructive detection of pear quality and provided a practical value for quality control and the commercial processing of pears.
1. Introduction
Fruit quality is a critical factor influencing market value and consumer satisfaction, and it occupies a vital role in global agriculture and the food industry [1]. To ensure fruit quality and safety, there is an increasing demand for rapid and accurate detection technologies. Traditionally, fruit quality assessment relies on precise but destructive, time-consuming, and complex physical and chemical methods that are ill-suited for rapid testing and large-scale applications [2]. As a result, conventional methods struggle to meet the modern demands of fruit quality monitoring.
With advancements in detection technology, hyperspectral imaging (HSI) has emerged as an effective tool for assessing fruit quality due to its non-destructive nature and being extremely precise [3]. HSI allows for the simultaneous detection of various fruit quality parameters, including color, sugar content, and acidity. It can make measurements more precise and also captures subtle variations within samples, making it particularly suitable for complex and heterogeneous fruit samples [4,5,6]. Furthermore, HSI leverages multi-wavelength spectral data in combination with advanced machine learning algorithms to provide superior predictive accuracy and a more comprehensive chemical composition analysis. This enables the holistic and real-time assessment of fruit quality [7]. Weng et al. utilized HSI to predict the quality of strawberries at different storage durations. Their results indicated that partial least squares regression (PLSR) provided the highest predictive accuracy for soluble solids content (SSC) and vitamin C (Vc), while local weighted regression (LWR) was the most effective for predicting the pH [8]. Gao et al. applied HSI to predict the SSC of grapes, and after performing dimensionality reduction using principal component analysis (PCA), the PLSR model demonstrated outstanding results. The calibration and prediction correlation coefficients (Rc and Rp) reached values of 0.977 and 0.976, respectively, indicating a superior performance [9]. Che et al. employed near-infrared spectroscopy in conjunction with machine learning methods to predict the internal quality of Korla pears. The study demonstrated the feasibility of integrating near-infrared spectroscopy with machine learning techniques for the non-destructive assessment of Korla pears [10]. Zhang et al. demonstrated that HSI technology facilitates accurate and non-destructive detection of the sugar content in ‘Dangshan’ pears [11]. Liu et al. successfully classified lychee varieties, achieving great accuracy, particularly with a support vector machine (SVM) model, which reached 100% accuracy in the calibration set and 87.81% in the prediction set [12].
Machine learning is a computational approach that involves the use of algorithms to analyze large datasets and build predictive models [13]. During the modeling process, the data needed to be preprocessed and feature wavelength selection to improve the accuracy and robustness of the model prediction [14]. Khort et al. combined hyperspectral imaging with machine learning to efficiently detect and classify apple disease lesions, significantly enhancing the precision and efficiency of automated fruit sorting systems [15]. Apostolopoulos et al. developed a machine learning model based on Vision Transformers (VIT) to assess fruit quality by analyzing deep image features, achieving great accuracy in classifying various fruit types [16].
To systematically investigate the effectiveness of HSI in predicting multiple quality indicators of different pear varieties, this work focused on six varieties of pears to apply HSI technology to non-invasive testing to assess the potential in evaluating the quality of the pears. The study employed the LS-SVM model based on 398~1004 nm spectra to examine the detection accuracy by selecting a preprocessing method and feature wavelength. Additionally, the fruit sample size and the number of pear varieties were expanded to boost the accuracy and generalization of the model. A classification model is developed to classify six varieties of pears, exploring the feasibility of using HSI for quality evaluation.
2. Materials and Methods
2.1. Sample Preparation
The materials included six varieties of pears: ‘Sucui No.1’, ‘Huangguan,’ ‘Zaojinxiang’, ‘Akizuki’, ‘Yali’, and ‘Hongli No.1’. In this experiment, HSI data under 398~1004 nm from 200 fruit from each variety were collected, totaling 1200 samples. The relevant information is presented in Table 1 below:

Table 1.
Material information.
2.2. Hyperspectral Imaging System
The spectral imaging system consisted of a hyperspectral camera (SPECIM FX 10, Spectral Imaging Ltd., Oulu, Finland) and a spectral imaging workstation (Lab scanner 40 × 20, Spectral Imaging Ltd., Oulu, Finland) with a spatial resolution of 1024 pixels (pixel size of 8 × 8 nm) and a spectral resolution of 448 bands, covering a spectral range of 398~1004 nm. In addition, the system was equipped with a computer featuring dedicated software that allows setting all system parameters according to experimental needs (Figure S1). The acquisition speed for full-band imaging was 330 fps, and the spectral resolution was 5.5 nm. The illumination system used a dual-lighting scheme of six 20 W halogen lamps to reduce interference from external light during image acquisition.
2.3. Image Acquisition and Correction
To ensure the stable operation of the hyperspectral camera, the light source must be opened for the 30 min warm-up period before the experiment. The system parameters were set as follows: the HSI system was used to collect spectral data from the surface of the pears. The distance between the pear surface and the camera lens was 200 mm, the stage movement speed was 7.35 mm/s, and the camera exposure time was 8.50 ms to complete the hyperspectral image acquisition. The camera used a two-dimensional detector to capture the spectral data reflected by the sample through line-scanning, resulting in a collection of hyperspectral images with dimensions (x, y, λ), where x and y represent spatial dimensions (i.e., the number of rows and columns of pixels), representing the number of spectral bands. Due to a dark current and uneven illumination, the acquired hyperspectral images could not be directly used for subsequent data analysis. Therefore, black-and-white calibration had to be performed before the data acquisition. The Formula (1) for the black-and-white calibration was as follows:
where F represents the corrected hyperspectral image, F0 denotes the original hyperspectral image, Fw is the white image obtained using a standard white reference panel, and Fb is the dark image. The corrected hyperspectral photos were used for subsequent spectral information extraction.
2.4. Quality Index Measurement
The firmness was evaluated with the fruit hardness tester (GY-4, Top Instrument, Hangzhou, China). The SSC was measured using the portable refractometer (PAL-1, Atago, Tokyo, Japan). The pH was determined with the pH meter (S210, Mettler-Toledo, Shanghai, China). The color difference (L*, a*, b*) of the fruit peel was evaluated using the colorimeter (CR-400, Konica Minolta, Japan). Additionally, the fruit maturity degree was assessed by measuring the index of absorbance difference (IAD) on the peel using a DA-Meter (University of Bologna, Italy).
2.5. Data Analysis
2.5.1. Spectral Extraction
This experiment collected hyperspectral images of six pear varieties, each with 200 fruit samples, totaling 1200 images. ENVI 5.0 software was used to extract Regions of Interest (ROI) from the hyperspectral images of each sample. The average spectra of all pixels within the ROI were calculated to characterize the spectral information of each sample. Subsequently, these average spectra were used as input data for various spectral preprocessing methods and modeling techniques.
2.5.2. Data Preprocessing
The hyperspectral camera was subject to light scattering and baseline drift during the data acquisition, necessitating the original spectral reflectance data preprocessing. In this study, we employed several preprocessing techniques: Standard Normal Variate (SNV) [17], Multiplicative Scatter Correction (MSC) [18], First Derivative (FD), and Second Derivative (SD) [19], as well as various combinations of these methods (SNV-FD, SNV-SD, FD-SNV, SD-SNV, MSC-FD, MSC-SD, FD-MSC, SD-MSC, FD-SD, SNV-MSC, and MSC-SNV) to preprocess the acquired raw spectral data. The spectral preprocessing was conducted using MATLAB 2012a (The Mathworks Inc., Natick, MA, USA) [20].
2.5.3. Wavelength Selection
The successive projections algorithm (SPA) and competitive adaptive reweighted sampling (CARS) were employed to extract feature wavelengths from the spectral data, aiming to reduce the input variables and improve both the efficiency and predictive accuracy. SPA is a forward variable selection technique that iteratively selects variables based on their projection onto a hyperplane, minimizing multicollinearity by choosing those with minimal redundancy. This technique ensures that only the most relevant variables are retained, improving the model stability [21]. CARS, based on Monte Carlo sampling and partial least squares regression (PLSR), works by adaptively selecting variables with significant regression coefficients. It then refines the variable set through a reweighting process and selects the final subset using cross-validation error to optimize predictive performance. Both methods are designed to improve the robustness and accuracy of the model by reducing overfitting and enhancing the feature selection [22].
2.5.4. Model Establishment and Evaluation
The data were randomly divided into training and prediction sets with a ratio of 3:1; this random division helps to improve the model’s generalization ability, enhances the reliability of the evaluation results, and contributes to the stability and accuracy of the model [23]. The LS-SVM is known for its strong generalization and robust regression capabilities, making it well-suited for this study [24]. The model performance was evaluated using Rc (Calibration Correlation Coefficient), Rp (Prediction Correlation Coefficient), RMSEC (Root Mean Square Error of Calibration), RMSEP (Root Mean Square Error of Prediction), and RPD (Ratio of Performance to Deviation). A correlation coefficient (R) close to 1, along with lower RMSEC and RMSEP values, indicates a well-fitting model and greater accuracy. An RPD value above 2.0 suggests predictive solid ability, while values between 1.5 and 2.0 are acceptable, and those below 1.5 indicate unsuitability for quantitative analysis [25].
In this study, four classification models were used to classify different varieties of pears, including Extreme Learning Machine (ELM) [26], Back Propagation Neural Network (BPNN) [27], Support Vector Machine (SVM) [28], and Random Forest (RF) [29]. The purpose of using these four models was to perform a comparative analysis in order to identify the most effective model for this classification task. By evaluating the performance of each model, we aimed to select the one that offered the highest classification accuracy.
3. Results and Discussion
3.1. Quality Parameters Analysis
Table 2 indicates notable differences in firmness, sugar content (SSC), pH values, color metrics (L*, a*, b*), and IAD among six pear varieties. Significant disparities in firmness among various varieties provided a wealth of data variability, enriching the construction of a firmness regression model and enhancing the generalization capabilities of the model. The SSC was relatively uniform and stable across the varieties, allowing the model to converge more easily during training and generalize well. The peel color parameters, particularly the a* values, showed significant differences among the varieties. For instance, the a* values of the red pears ranged from 3.14 to 40.40, whereas other varieties, such as ‘Sucui No.1’ exhibited less variation. This was associated with the variations in the fruit appearance between different varieties. The color variations offered strong spectral responses in hyperspectral data. The IAD had a wide numerical range that distinctly indicated variations in the degree of fruit maturity. However, the pH analysis of different pear varieties revealed a relatively narrow range.

Table 2.
Quality parameters of six pear varieties.
3.2. Spectral Characteristics
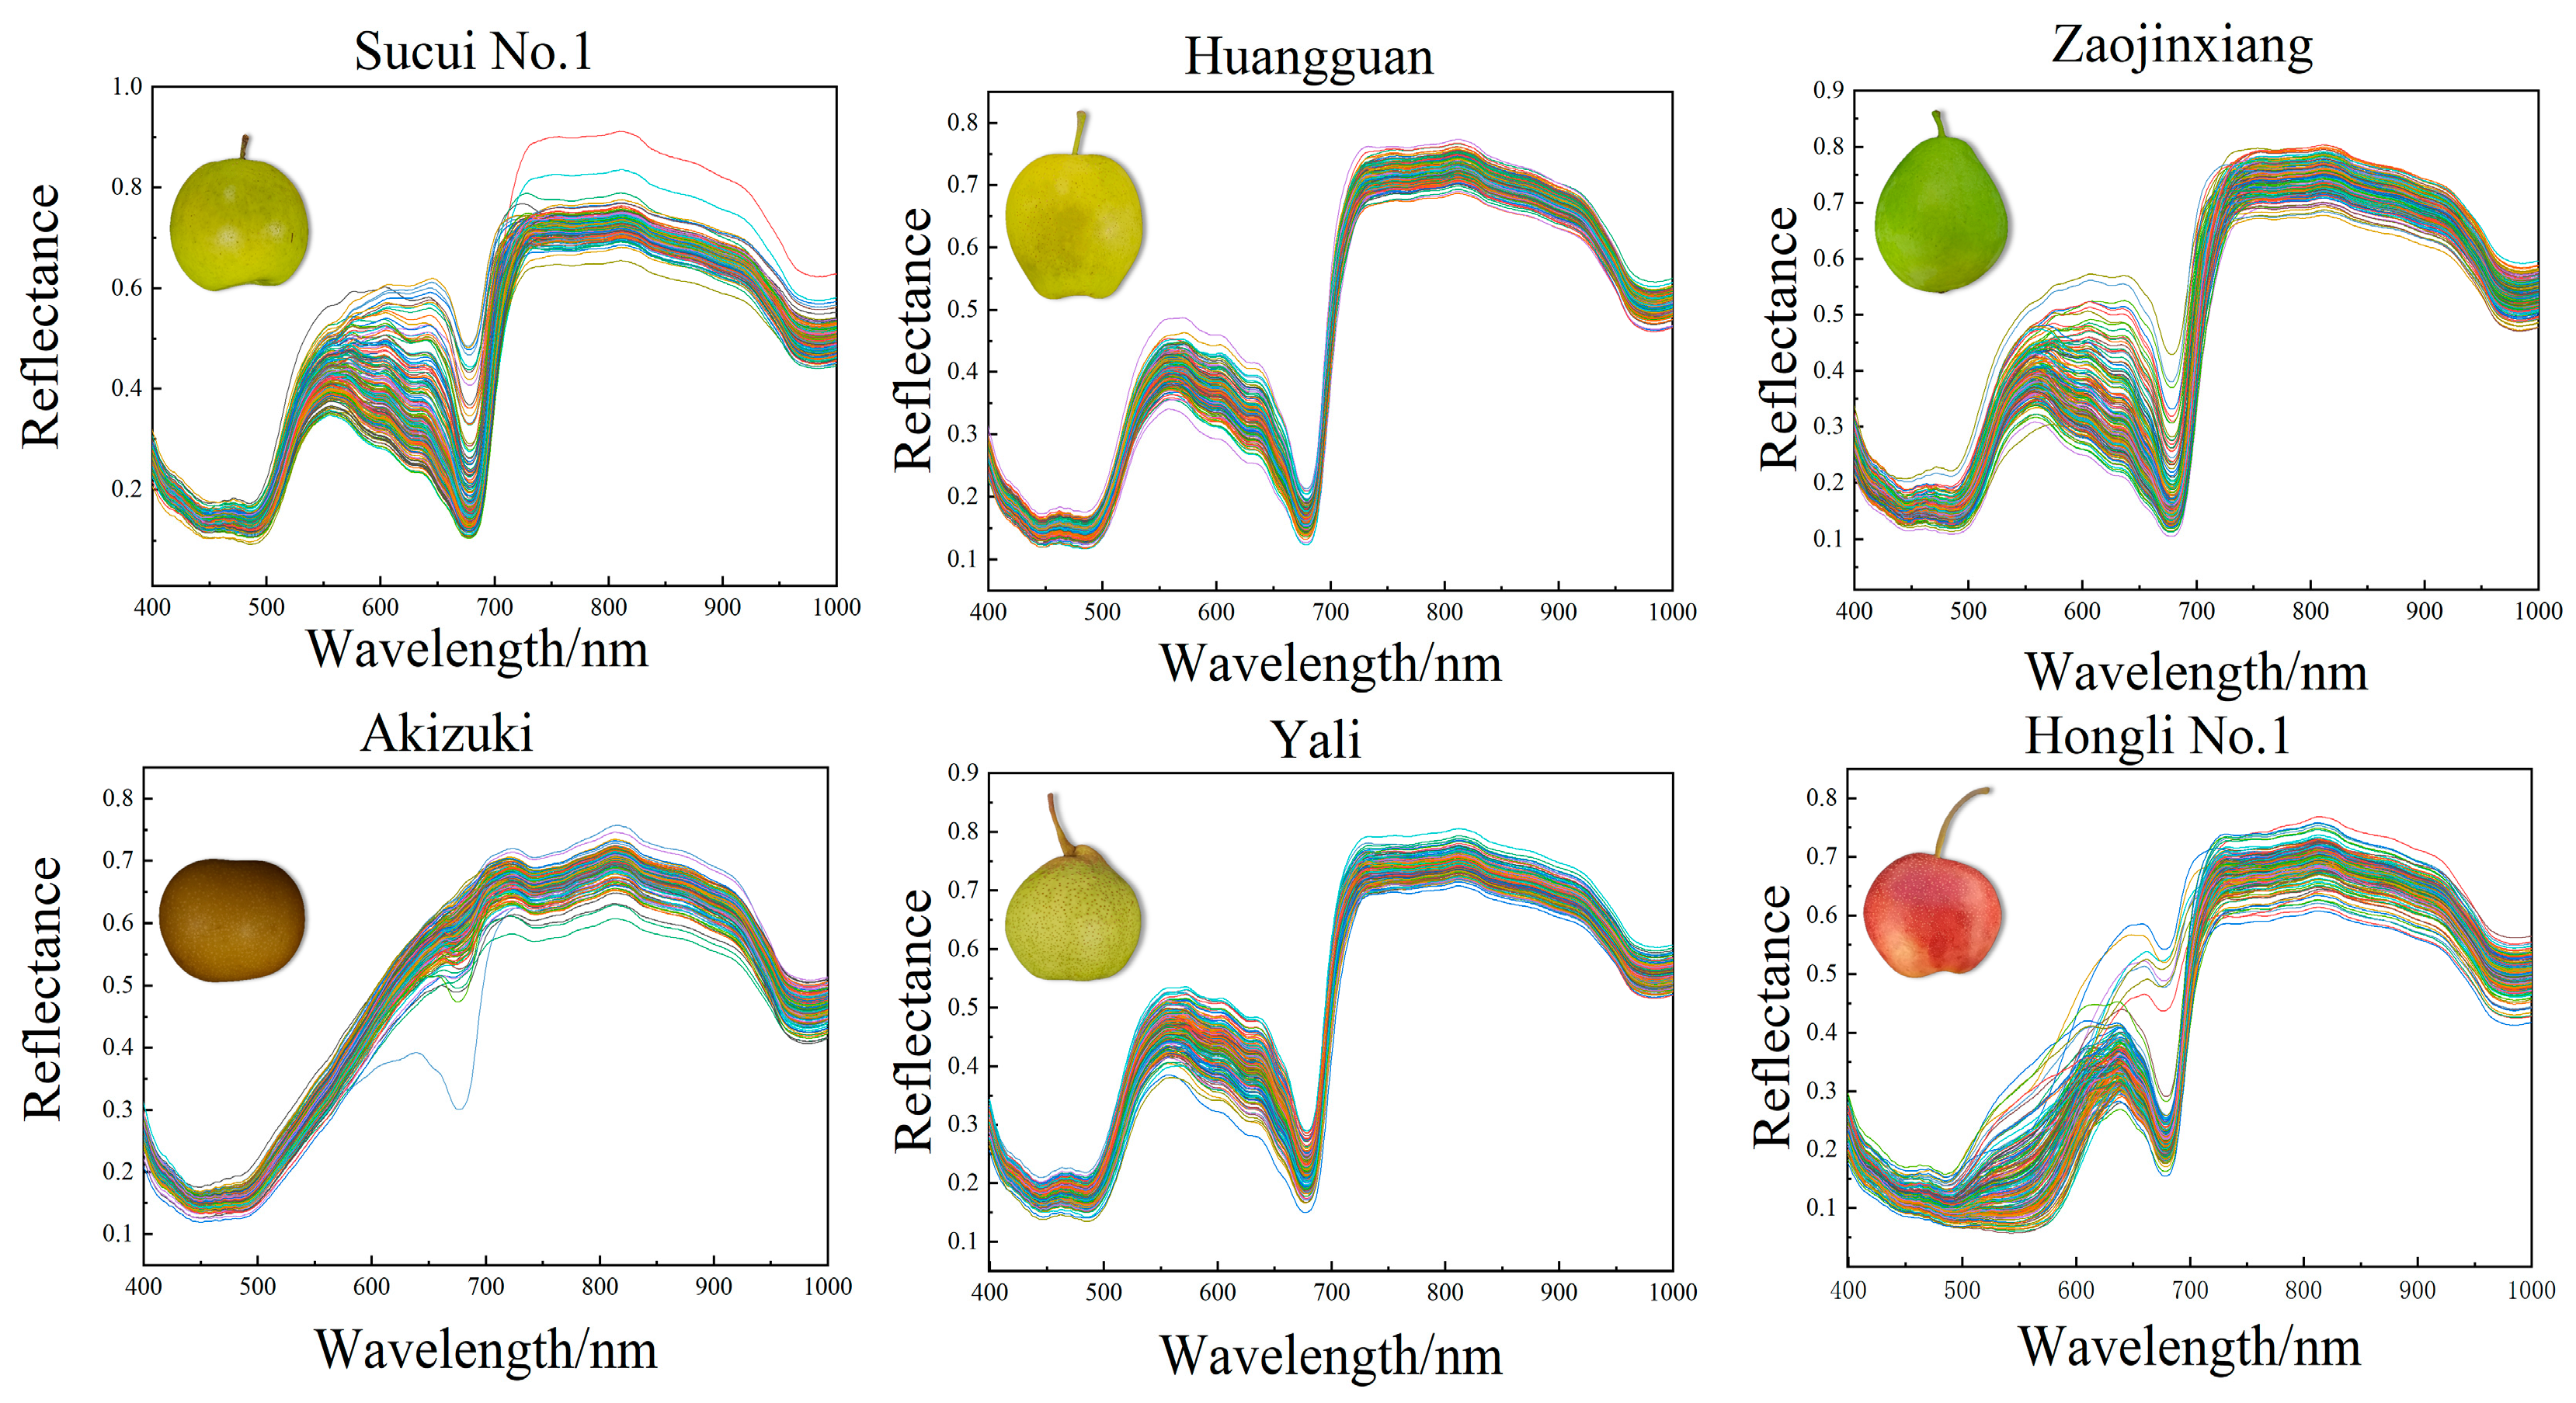
The range of the spectra from 398 nm to 1004 nm was considered valid data in this study. It showed that the reflectance of the six pear varieties was similar in the visible and near-infrared spectral regions. Within the range of visible wavelength (from 500 nm to 600 nm), the reflectance of the six pear varieties showed a notable increase as the wavelength enlarged. The absorption peak at 680 nm was attributed to the presence of chlorophyll in the peel of the pear [30], while the peak variation at 920 nm was associated with water absorption [31]. All the pear varieties maintained high reflectance levels in the near-infrared region, but the extent of the changes exhibited differences. These differences provided the basis for pear variety identification, maturity degree assessment, and quality inspection (Figure 1).
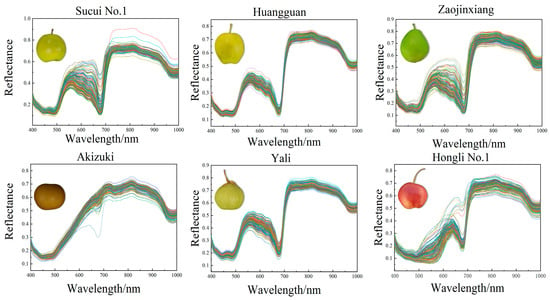
Figure 1.
The reflectance spectra of the six different pear varieties.
3.3. Establishment of LS-SVM Model for Quality and Color Indicators
3.3.1. Spectral Preprocessing
Using the example of predicting SSC for the Sucui No. 1 variety, the effective spectral range of 398–1004 nm was employed. Various preprocessing methods were applied, including FD, SD, SNV, MSC, and combinations of these techniques. These methods effectively reduced the spectral noise arising from the environmental factors, temperature fluctuations, and instrument errors, thereby enhancing the model robustness and reducing complexity. The results demonstrated that FD-SNV was the most effective preprocessing method (Figure S2 and Table S1). A comparative analysis was conducted among the models utilizing different preprocessing techniques, and a model was also established using the original spectra. FD-SNV emerged as the superior preprocessing method, with the most significant enhancement in prediction accuracy observed in the prediction set model. Following the FD-SNV preprocessing, the model values for Rc, Rp, and RPD showed a marked improvement. Notably, the RPD exceeded 2.5, indicating that the model possesses a strong predictive capability.
The quality analysis of the six pear varieties using the LS-SVM model (Table 2) showed that the sample range notably impacts the model’s predictive performance. For instance, the ‘Zaojinxiang’ and ‘Hongli No.1’ exhibited a broad hardness range with substantial differences between the highest and lowest values in hardness prediction. This enables the model to leverage variations among different hardness levels effectively (RPD value > 2.5), demonstrating high predictive accuracy (Table 3). In addition, the prediction accuracy for other parameters like SSC, pH, L*, a*, b*, and IAD was likewise significantly influenced by the sample range. From the SSC analysis, ‘Sucui No.1’, ‘Huangguan’, and ‘Yali’ showed high prediction accuracy in SSC with the RPD values exceeding 2. The RPD value of the ‘Huangguan’ was 5.4, suggesting that the model had an excellent predictive capability for this parameter. This could be due to the wide range of SSC values that enabled the model to capture the precise correlation between the spectral variations and SSC. It has been proposed that the more significant the sample variability, the more effectively the model could capture critical features related to quality parameters through hyperspectral data, thus enhancing the prediction accuracy [32].

Table 3.
Prediction of different quality parameters of six varieties of pears.
The prediction of the pH was generally inaccurate in the six pear varieties, with the RPD values mostly ranging from 0.7 to 1.0. It might be that HSI obtained characteristics through physical changes of the surface’s reflectance and absorption, while the pH value was more affected by internal components, so these changes were very weak in the spectral reflectance characteristics and it was difficult to form effective discriminant signals. According to previous studies, the near-infrared spectroscopy had limitations in predicting the acidity of the fruits and vegetables. In most fruits and vegetables, the acid concentrations were typically much lower than the sugar concentrations and might be too low to influence the near-infrared spectroscopy significantly [33].
Regarding the color of the fruit (L*, a*, b*), ‘Zaojinxiang’ exhibited the best predictive performance, and the RPD values of L* and a* were 2.9 and 3.0, respectively. This suggested that for the sample range and different color degrees, using the LS-SVM model could mean a better relationship between the spectra and color. This finding was similar to the result that the color prediction by HSI was closely related to the range of color differences among the samples, with more extensive ranges contributing to enhance the prediction accuracy [34].
Regarding the IAD prediction, the RPD values of all the pear varieties exceeded 2.0, indicating that the LS-SVM model could accurately predict the IAD. This result could also be ascribed to the wide range of IAD values [35].
3.3.2. Feature Wavelength Selection Results
To identify the method for selecting the feature wavelength, the initial spectra were individually processed with FD-SNV, and then were screened using CARS and SPA. Subsequently, the filtered characteristic spectra as the input data, and the measured SSC of ‘Sucui No.1’ as the output data were used to establish the LS-SVM prediction model, and the results were comparatively analyzed.
Based on the predicted result for the SSC of ‘Sucui No.1’, the CARS significantly reduced the redundancy data and effectively enhanced the prediction accuracy of the model (Figure S3 and Table S1). Following the CARS screening, the number of variables was reduced from 448 to 44. Compared to the models without a variable selection, the CARS model’s RPD value on the prediction set increased from 2.8 to 2.9, and the correlation coefficient was slightly improved, while the RMSEP decreased. Although the CARS efficiently reduced the redundancy data and simplified the model, the degree of improvement was relatively limited. It might be the result of the complexity of the hyperspectral data, which caused the CARS to be unable to comprehensively obtain all the information strongly related to the target quality parameters. It was similar to the sweet potato study [36].
3.3.3. Modeling Analysis Based on Feature Wavelength
Following the optimal data preprocessing method FD-SNV, CARS was employed to select the wavelengths, which served as input data to establish the LS-SVM models for predicting various parameters of the six pear varieties (Table 4).

Table 4.
The prediction results for the quality parameters of the six pear varieties by LS-SVM model.
By applying the FD-SNV preprocessing to the initial spectral data and integrating it with the CARS wavelength selection, the IAD prediction performance for the ‘Sucui No.1’ increased from the RPD value from 3.5 to 3.9. The RPD value for the hardness prediction of the ‘Zaojinxiang’ improved from 2.8 to 3.1, the RPD value for the color prediction of b* was enhanced from 1.6 to 2.3, and the RPD value for the IAD prediction improved from 3.4 to 4.0. The RPD value for the SSC prediction of the ‘Akizuki’ improved from 1.9 to 2.0. In the ‘Yali’, the RPD value for the SSC increased from 2.8 to 3.3, and L* from 1.9 to 2.1. All of the parameter predictions affected for the ‘Hongli No.1’ were enhanced.
In summary, the model has been optimized by the data preprocessing and wavelength screening, but it was limited. Although the screening of the feature wavelengths reduced the number of variables and simplified the model, in certain instances, such as predicting L*, a*, and b*, the RPD values did not significantly increase. Further analysis showed that the influence of the sample range on the model accuracy was more pronounced. The number of samples and data diversity constrained the model prediction accuracy for single-variety samples. To improve the stability of the model and the predictive accuracy, it was necessary to further integrate the sample data from the six pear varieties.
3.3.4. Development of a Joint Model to Predict Different Indicators for the Six Pear Varieties
To enhance the generalization capacity of the model, the data of the six pear varieties were consolidated in this work. Considering that FD-SNV and CARS could effectively improve the RPD value, the consolidated data of the six pear varieties were preprocessed with FD-SNV firstly (output data), selecting characteristic wavelengths via CARS as input data, and then the LS-SVM model was reestablished.
The RPD value for firmness increased to 3.4 by reestablishing the LS-SVM model. This might be the result of the increased data and variability of samples. Although the RPD values for SSC (Table 5) decreased comparing to the result in the single pear variety (Table 4), it was above 2.0. Therefore, the model still worked well. Different from SSC, the RPD value for pH, L*, a*, b*, and IAD value significantly increased by reestablishing the LS-SVM model (Table 5), demonstrating a notable enhancement in the model’s predictive performance. Moreover, the reestablished LS-SVM showing higher Rc and Rp values but lower RMSEC and RMSEP values, indicated that it enhanced the prediction accuracy and generalization capabilities. These results were consistent with those of previous studies that sample diversity enhanced the model stability, making it more effective in practical applications [37]. Many studies have been focused on the quality detection of a single fruit variety, while this work significantly improved the stability and applicability of the model by expanding the sample diversity and quantity.

Table 5.
Prediction results of quality parameters of six varieties of pear by LS-SVM model.
3.3.5. The Development of a Classification Model for the Six Pear Varieties
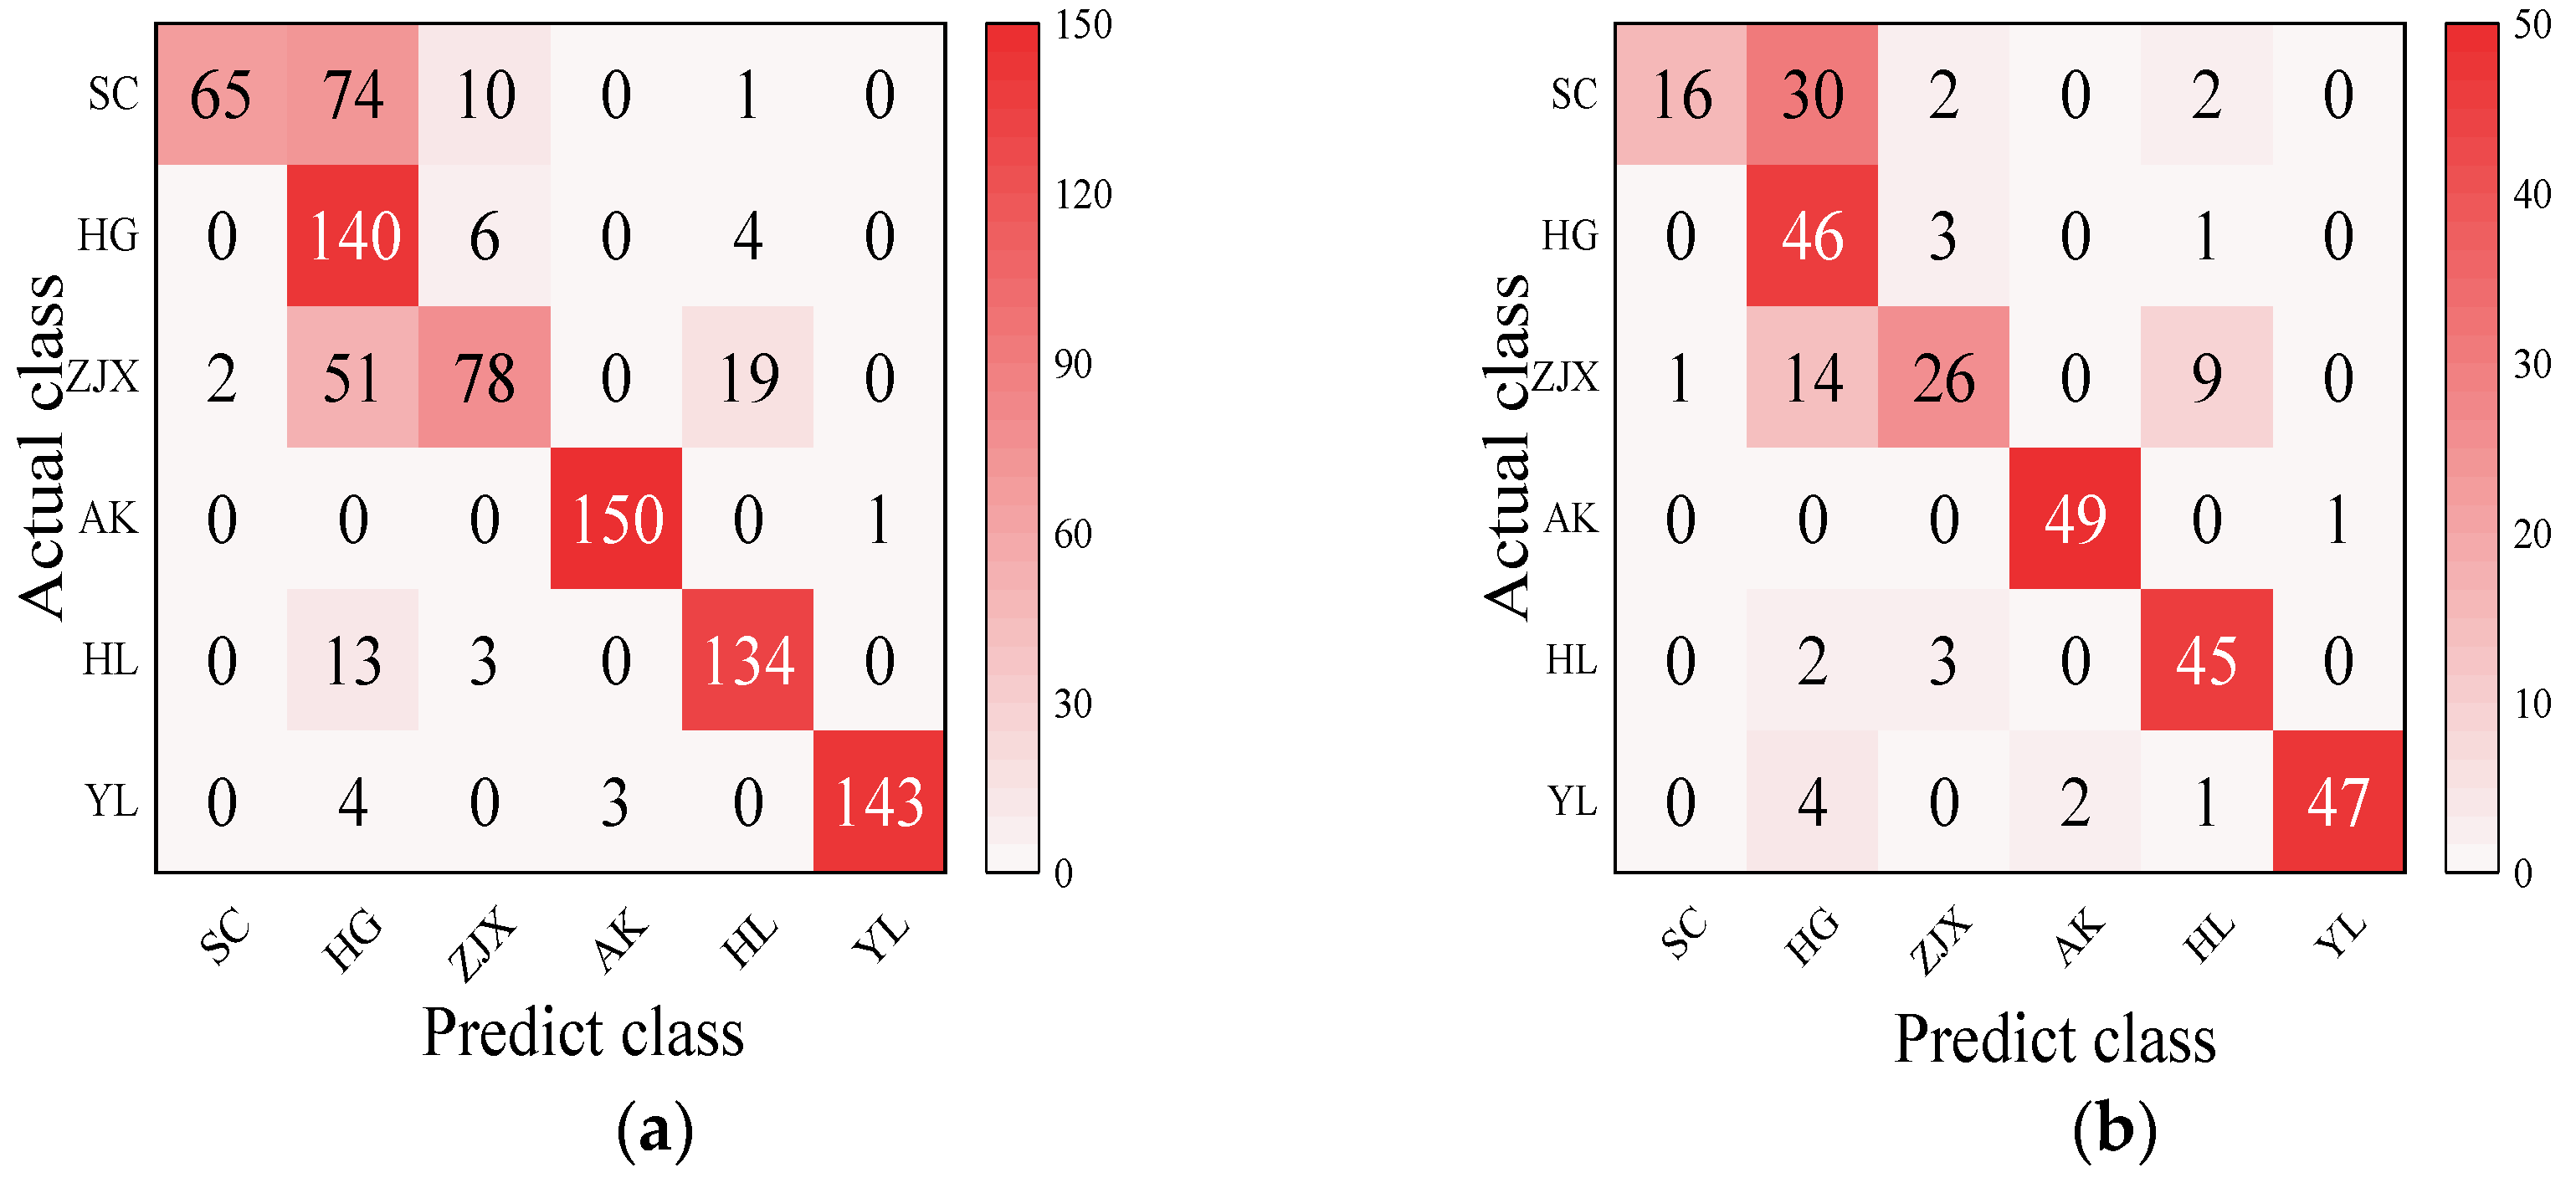
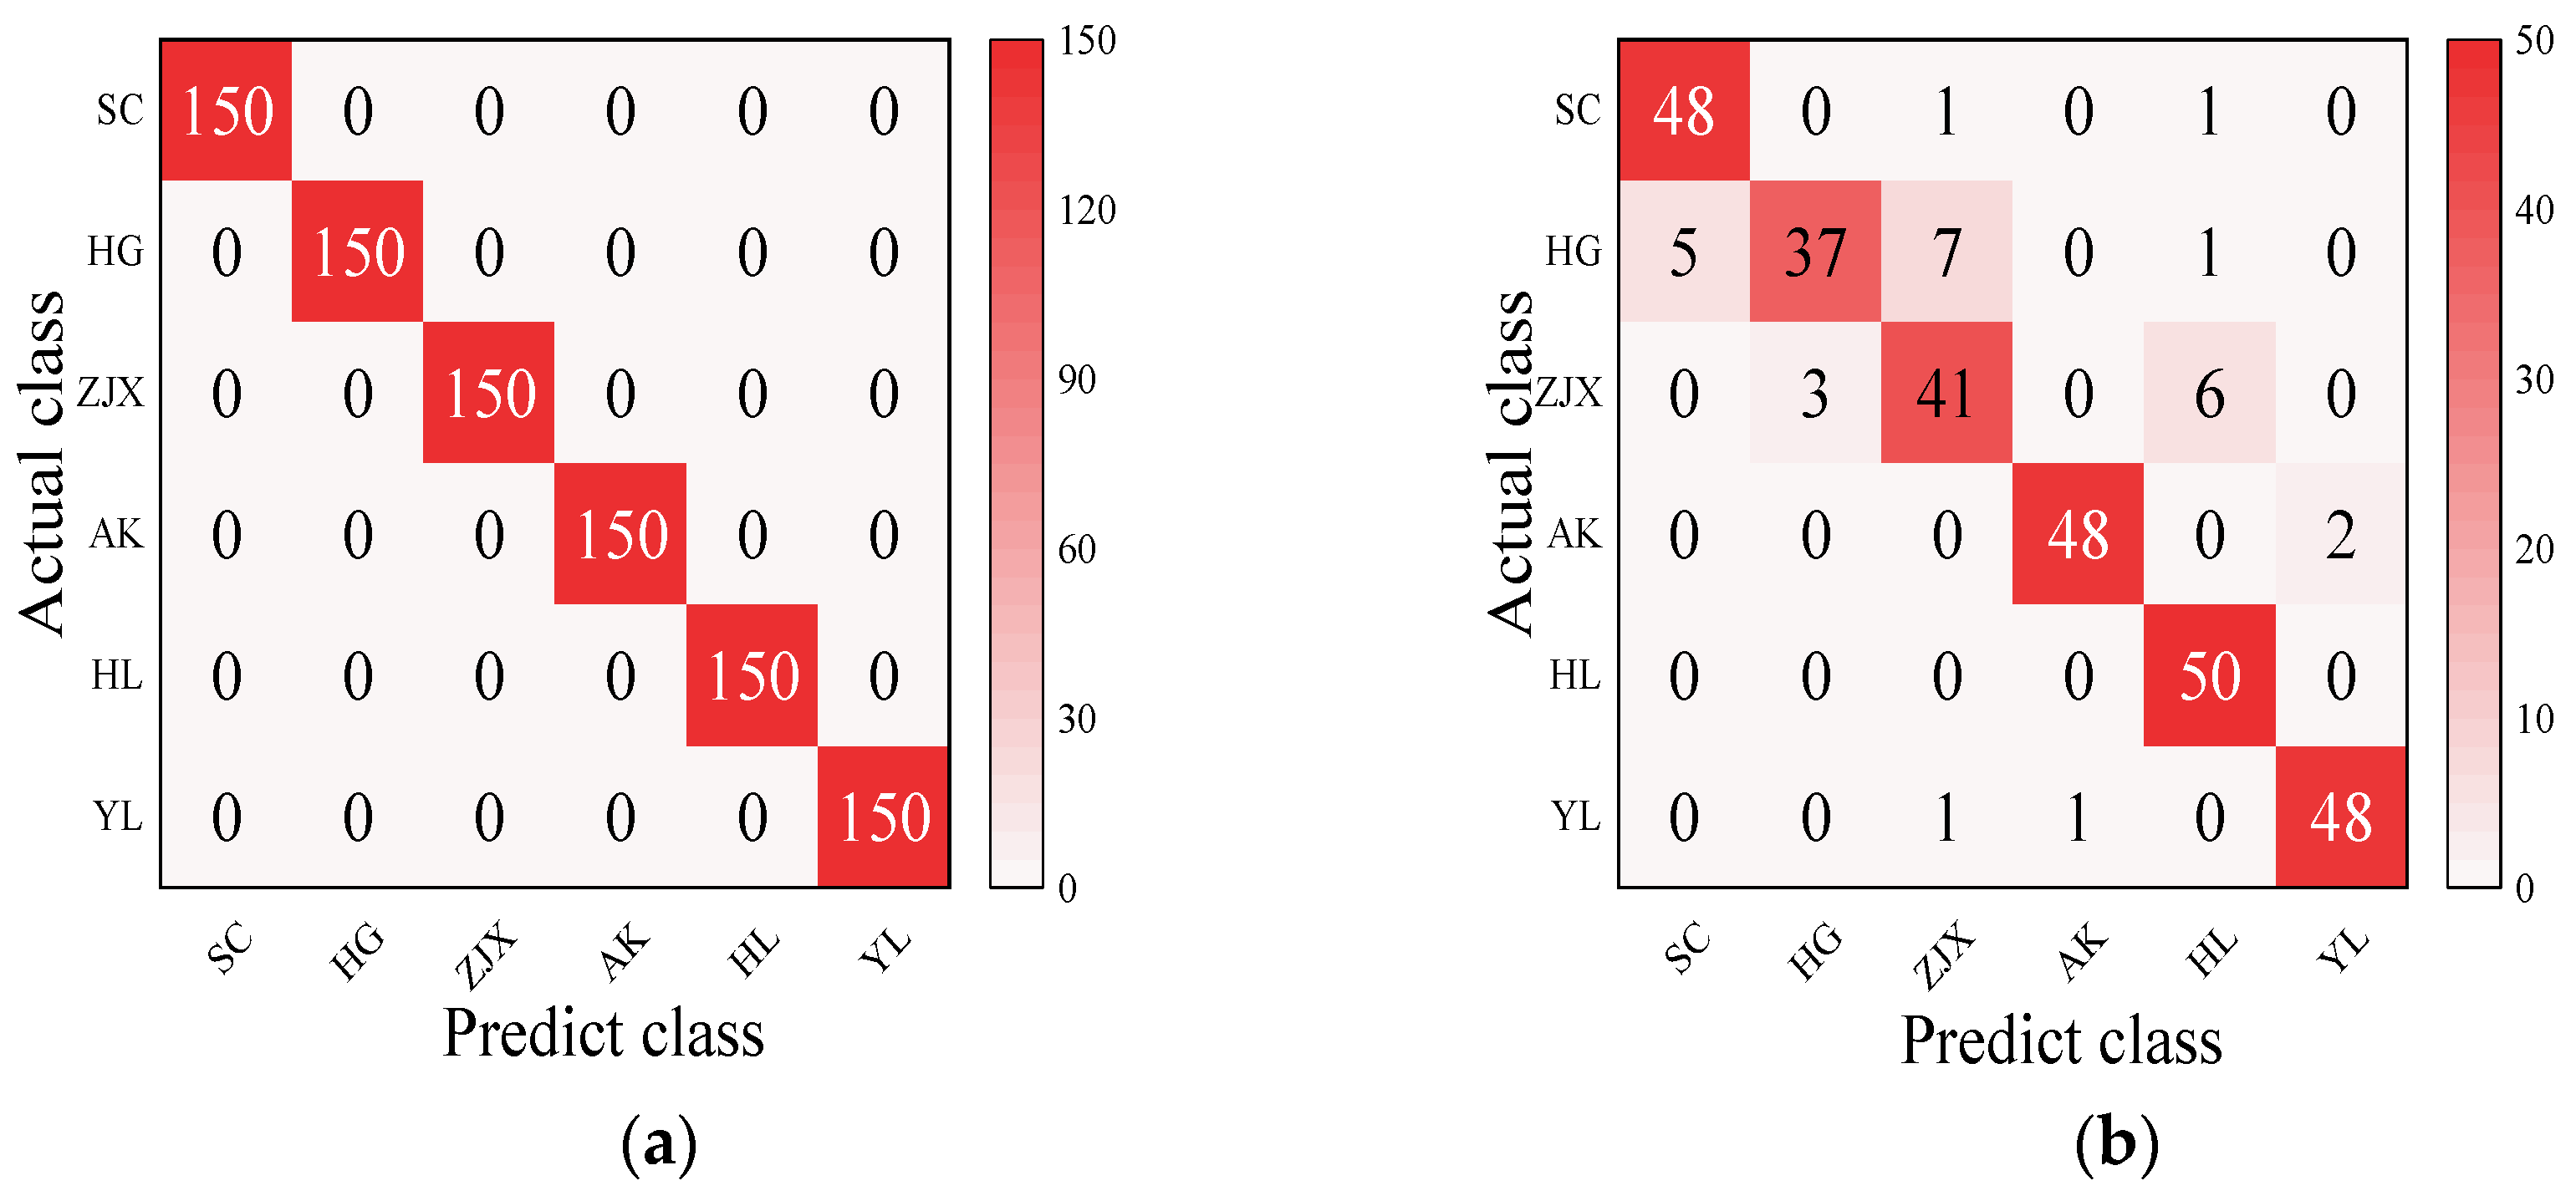
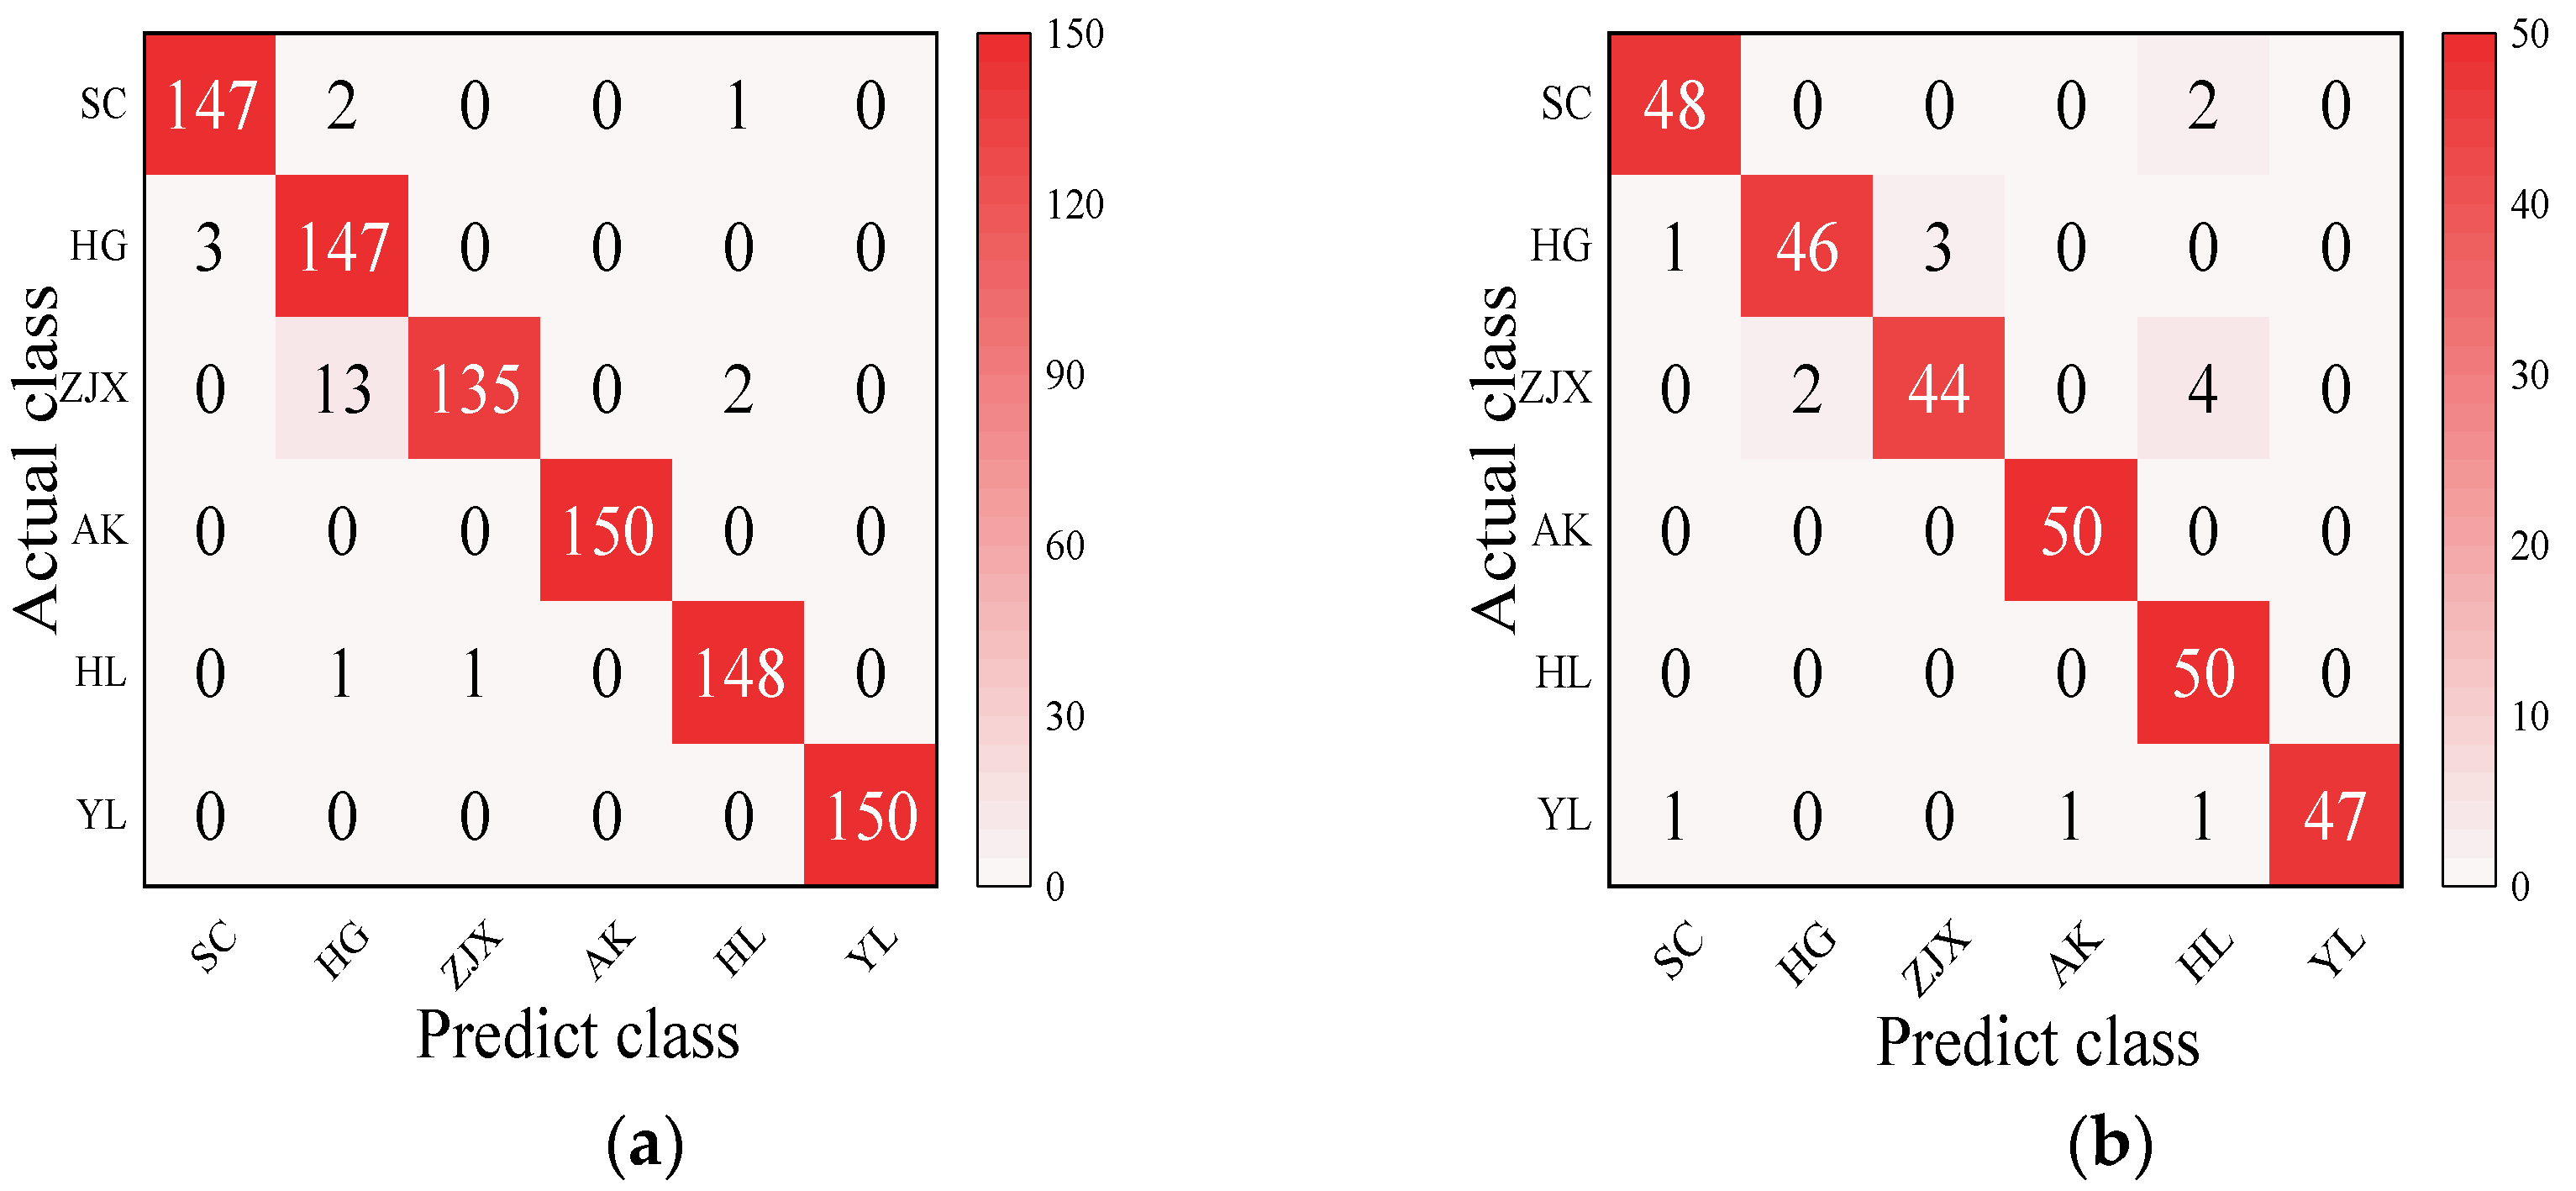
Four models—BP neural network, SVM, RF, and ELM—were evaluated in the classification model analysis of the six pear varieties (Table 6). The BP neural network performed exceptionally well on all the varieties, with the prediction accuracy rates close to 100%, suggesting its strong ability to handle nonlinear relationships in spectral data [38] (Figure 2). SVM performed well on the pear varieties like ‘Hongli No.1’ (97.9%) and ‘Akizuki’ (96.1%), but its accuracy was only 50% for the ‘Huangguan’ variety, indicating some limitations in the classification. It may struggle with complex classification tasks and is highly dependent on parameter tuning [39] (Figure 3). The RF model also performed well on most varieties, with the prediction accuracy reaching 100% for some. However, its performance slightly declined for the ‘Sucui No.1’ and ‘Huangguan’, which may be related to the random generation of trees in the random forest model, leading to a poorer performance in varieties with a significant feature overlap [40] (Figure 4). The ELM performed well overall, but its prediction accuracy for the ‘Yali’ variety was only 87.7%. This may be due to the random initialization of weights in ELM, which affects its generalization ability when dealing with noisy or imbalanced data [41] (Figure 5).

Table 6.
Classification model for different pear varieties.
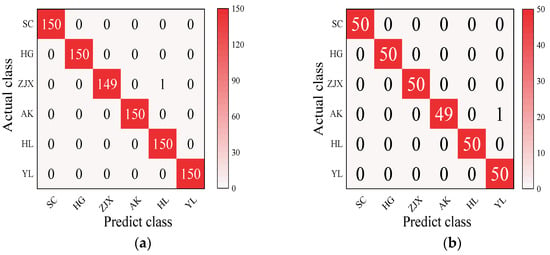
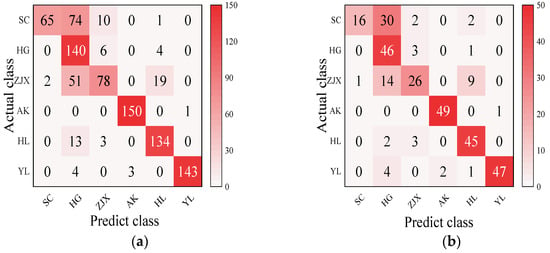
Figure 3.
SVM classification model: (a) Calibration set; (b) Prediction set.
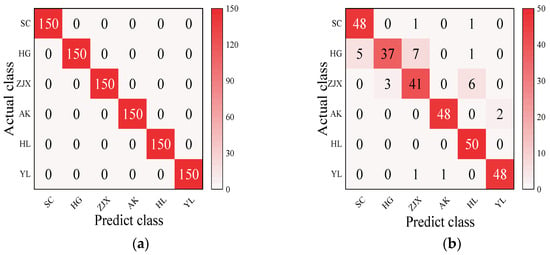
Figure 4.
RF classification model: (a) Calibration set; (b) Prediction set.
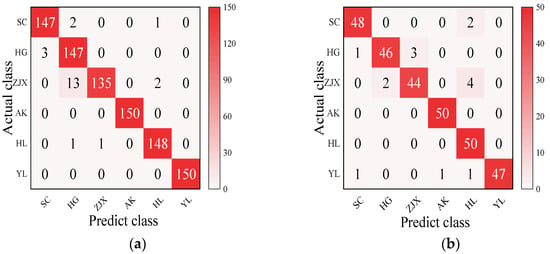
Figure 5.
ELM classification model: (a) Calibration set; (b) Prediction set.
In summary, the BP neural networks and random forests had more excellent stability in the classification performance. At the same time, the SVM and ELM models could require further optimization or feature engineering to improve their classification effectiveness.
4. Conclusions
This study integrated HSI technology with machine learning models to perform a non-destructive quality assessment of six pear varieties, confirming the effectiveness and potential application in fruit quality detection. The results indicated that applying suitable spectral preprocessing FD-SNV and feature wavelength selection CARS greatly improved the prediction accuracy and robustness of the model. Integrating data from multiple pear varieties further increased the model’s generalization capability. The model showed extreme precision and stability, particularly on predicting the SSC and maturity degree. This offers a practical approach for achieving rapid and precise evaluation of pear quality.
On this basis, future research could focus on expanding the model to include a wider variety of fruits and explore the use of more advanced machine learning techniques, such as deep learning, to improve prediction accuracy. Additionally, developing real-time, on-field quality evaluation systems could further enhance the practicality of this approach.
Supplementary Materials
The following supporting information can be downloaded at: https://www.mdpi.com/article/10.3390/foods13233956/s1. Figure S1: Vis‐NIR hyperspectral imaging system; Figure S2: The reflectance spectra of Sucui No.1 (a) raw spectrum; (b) FD-SNV; Figure S3: The reflectance spectra of Sucui No.1 (a) CARS (b) SPA; Figure S4: Six pear quality regression models; Figure S5: The ROI figure of Akizuki; Table S1: Performance of LS-SVM models for SSC of ‘Sucui No.1’; Table S2: The prediction results of SSC of SuCui by LS-SVM models developed by using the influential variables.
Author Contributions
Conceptualization, J.G. and W.G.; methodology, Z.Z., Y.C., and M.C.; software, Z.Z.; validation, Z.Z.; formal analysis, Z.Z.; investigation, J.G.; resources, J.G., Y.C., and H.C.; data curation, Z.Z. and H.C.; writing—original draft preparation, Z.Z.; writing—review and editing, J.G. and L.Z.; visualization, Z.Z.; supervision, W.G. and J.G.; project administration, J.G. and H.C.; funding acquisition, J.G. and H.C. All authors have read and agreed to the published version of the manuscript.
Funding
This work was supported by the Ministry of Finance, Ministry of Agriculture and Rural Affairs, and Modern Agricultural Industry (Pear) Technology System Project (CARS-28-23), and National Natural Science Foundation of China (22303024), and Key R & D plan of Hebei province (22327505D), and the HAAFS Agriculture Science and Technology Innovation Project (2022KJCXZX-SSS-3), the Basic Research Funds of Hebei Academy of Agriculture and Forestry Sciences (2024110207).
Data Availability Statement
The original contributions presented in the study are included in the article/Supplementary Materials, further inquiries can be directed to the corresponding authors.
Conflicts of Interest
The authors declare no conflicts of interest.
References
- Yang, S.; Panjaitan, B.; Ujiie, K.; Wann, J.; Chen, D. Comparison of food values for consumers’ preferences on imported fruits and vegetables within Japan, Taiwan, and Indonesia. Food Qual. Prefer. 2021, 87, 104042. [Google Scholar] [CrossRef]
- Wang, T.T.; Li, G.H.; Dai, C.L. Soluble Solids Content prediction for Korla fragrant pears using hyperspectral imaging and GsMIA. Infrared Phys. Technol. 2022, 123, 104119. [Google Scholar] [CrossRef]
- XU, M.; Sun, J.; Cheng, J.H.; Yao, K.N.; Wu, X.H.; Zhou, X. Non-destructive prediction of total soluble solids and titratable acidity in Kyoho grape using hyperspectral imaging and deep learning algorithm. Int. J Food Sci. Tech. 2023, 58, 9–21. [Google Scholar] [CrossRef]
- Shao, Y.Y.; Ji, S.H.; Xuan, G.; Wang, K.L.; Xu, L.Q.; Shao, J. Soluble solids content monitoring and shelf life analysis of winter jujube at different maturity stages by Vis-NIR hyperspectral imaging. Postharvest Biol. Technol. 2024, 210, 112773. [Google Scholar] [CrossRef]
- Kim, M.J.; Yu, W.H.; Song, D.-J.; Chun, S.-W.; Kim, M.S.; Lee, A.; Kim, G.; Shin, B.-S.; Mo, C. Prediction of soluble-solid content in citrus fruit using visible–near-infrared hyperspectral imaging based on effective-wavelength selection algorithm. Sensors 2024, 24, 1512. [Google Scholar] [CrossRef] [PubMed]
- Zhao, J.; Hu, Q.; Li, B.; Xie, Y.; Lu, H.; Xu, S. Research on an improved non-destructive detection method for the Soluble Solids Content in Bunch-Harvested grapes nased on deep learning and hyperspectral imaging. Appl. Sci. 2023, 13, 6776. [Google Scholar] [CrossRef]
- Tahmasbian, I.; Morgan, N.K.; Hosseini Bai, S.; Dunlop, M.W.; Moss, A.F. Comparison of Hyperspectral Imaging and Near-Infrared Spectroscopy to Determine Nitrogen and Carbon Concentrations in Wheat. Remote Sens. 2021, 13, 1128. [Google Scholar] [CrossRef]
- Weng, S.; Yu, S.; Guo, B.Q.; Tang, P.; Liang, D. Non-destructive detection of strawberry quality using multi-features of hyperspectral imaging and multivariate methods. Sensors 2020, 20, 3074. [Google Scholar] [CrossRef]
- Gao, S.; Xu, J. Hyperspectral image information fusion-based detection of soluble solids content in red globe grapes. Comput. Electron. Agric. 2022, 196, 106822. [Google Scholar] [CrossRef]
- Che, J.; Liang, Q.; Xia, Y.; Liu, Y.; Li, H.; Hu, N.; Cheng, W.; Zhang, H.; Zhang, H.; Lan, H. The study on nondestructive detection methods for internal quality of Korla fragrant pears based on Near-Infrared Spectroscopy and Machine Learning. Foods 2024, 13, 3522. [Google Scholar] [CrossRef]
- Zhang, D.; Xu, L.; Liang, D.; Xu, C.; Jin, X.; Weng, S. Fast prediction of sugar content in Dangshan pear (Pyrus spp.) using hyper-spectral imagery data. Food Anal. Methods 2018, 11, 2336–2345. [Google Scholar] [CrossRef]
- Liu, D.; Wang, L.; Sun, D.; Zeng, X.; Qu, J.; Ma, J. Lychee variety discrimination by hyperspectral imaging coupled with multivariate classification. Food Anal. Methods 2014, 7, 1848–1857. [Google Scholar] [CrossRef]
- Sarker, I.H. Machine learning: Algorithms, real-world applications and research directions. SN Comput Sci. 2021, 2, 160. [Google Scholar] [CrossRef] [PubMed]
- Dhiman, B.; Kumar, Y.; Kumar, M. Fruit quality evaluation using machine learning techniques: Review, motivation and future perspectives. Multimed. Tools Appl. 2022, 81, 16255–16277. [Google Scholar] [CrossRef]
- Khort, D.O.; Kutyrev, A.; Smirnov, I.; Andriyanov, N.; Filippov, R.; Chilikin, A.; Astashev, M.E.; Molkova, E.A.; Sarimov, R.M.; Matveeva, T.A.; et al. Enhancing sustainable automated fruit sorting: Hyperspectral analysis and machine learning algorithms. Sustainability 2024, 16, 10084. [Google Scholar] [CrossRef]
- Apostolopoulos, I.D.; Tzani, M.; Aznaouridis, S.I. A General machine learning model for assessing fruit quality using deep image features. AI 2023, 4, 812–830. [Google Scholar] [CrossRef]
- Vali Zade, S.; Kia, R. Determination of moisture content in corn samples: A critical evaluation of standard normal variate preprocessing for NIR spectral data. Hum. Health Halal Metr. 2024, 5, 17–33. [Google Scholar] [CrossRef]
- Mishra, P.; Biancolillo, A.; Roger, J.M.; Marini, F.; Rutledge, D.N. New data preprocessing trends based on ensemble of multiple preprocessing techniques. TrAC Trends Anal. Chem. 2020, 132, 116045. [Google Scholar] [CrossRef]
- Yu, M.; Bai, X.; Bao, J.; Wang, Z.; Tang, Z.; Zheng, Q.; Zhi, J. The prediction model of total nitrogen content in leaves of Korla fragrant pear was established based on near infrared spectroscopy. Agronomy 2024, 14, 1284. [Google Scholar] [CrossRef]
- Cheng, H.; Zhang, Z.; Cheng, Y.; Guan, J. Potential of hyperspectral imaging for nondestructive determination of α-farnesene and conjugated trienol content in ‘Yali’ pear. Spectrochim Acta A Mol Biomol Spectrosc. 2024, 321, 124688. [Google Scholar] [CrossRef]
- Li, Y.; Yang, X. Quantitative analysis of near infrared spectroscopic data based on dual-band transformation and competitive adaptive reweighted sampling. Spectrochim. Acta Part A Mol. Biomol. Spectrosc. 2023, 285, 121924. [Google Scholar] [CrossRef] [PubMed]
- Kamruzzaman, M.; Kalita, D.; Ahmed, M.T.; ElMasry, G.; Makino, Y. Effect of variable selection algorithms on model performance for predicting moisture content in biological materials using spectral data. Anal. Chim. Acta 2022, 1202, 339390. [Google Scholar] [CrossRef] [PubMed]
- Galvão, R.K.; Araujo, M.C.; José, G.E.; Pontes, M.J.; Silva, E.C.; Saldanha, T.C. A method for calibration and validation subset partitioning. Talanta 2005, 67, 736–740. [Google Scholar] [CrossRef] [PubMed]
- Zeng, J.; Tan, Z.-H.; Matsunaga, T.; Shirai, T. Generalization of parameter selection of SVM and LS-SVM for regression. Mach. Learn. Knowl. Extr. 2019, 1, 745–755. [Google Scholar] [CrossRef]
- Cao, Z.; Kühn, P.; He, J.-S.; Bauhus, J.; Guan, Z.-H.; Scholten, T. Calibration of near-infrared spectra for phosphorus fractions in grassland soils on the Tibetan plateau. Agronomy 2022, 12, 783. [Google Scholar] [CrossRef]
- Wang, J.; Lu, S.; Wang, S.H.; Zhang, Y.D. A review on extreme learning machine. Multimed. Tools Appl. 2022, 81, 41611–41660. [Google Scholar] [CrossRef]
- Zhu, J.; Wu, A.; Wang, X.; Zhang, H. Identification of grape diseases using image analysis and BP neural networks. Multimed. Tools Appl. 2020, 79, 14539–14551. [Google Scholar] [CrossRef]
- Demidova, L.A. Two-Stage Hybrid Data Classifiers Based on SVM and KNN Algorithms. Symmetry 2021, 13, 615. [Google Scholar] [CrossRef]
- Becker, T.; Rousseau, A.J.; Geubbelmans, M.; Burzykowski, T.; Valkenborg, D. Decision trees and random forests. American J. Orthod. Dentofac. Orthop. 2023, 164, 894–897. [Google Scholar] [CrossRef]
- Shi, Q.; Li, Y.; Zhang, F.; Ma, Q.; Sun, J.; Liu, Y.; Mu, J.; Wang, W.; Tang, Y. Whale optimization algorithm-based multi-task convolutional neural network for predicting quality traits of multi-variety pears using near-infrared spectroscopy. Postharvest Biol. Technol. 2024, 215, 113018. [Google Scholar] [CrossRef]
- Wang, X.; Xu, H.; Zhou, J.; Fang, X.; Shuai, S.; Yang, X. Analysis of vegetation canopy spectral features and species discrimination in reclamation mining area using in situ hyperspectral data. Remote Sens. 2024, 16, 2372. [Google Scholar] [CrossRef]
- Jin, H.; Peng, J.; Bi, R.; Tian, H.; Zhu, H.; Ding, H. Comparing laboratory and satellite hyperspectral predictions of soil organic carbon in farmland. Agronomy 2024, 14, 175. [Google Scholar] [CrossRef]
- Mancini, M.; Mazzoni, L.; Leoni, E.; Tonanni, V.; Gagliardi, F.; Qaderi, R.; Capocasa, F.; Toscano, G.; Mezzetti, B. Application of near infrared spectroscopy for the rapid assessment of nutritional quality of different strawberry cultivars. Foods 2023, 12, 3253. [Google Scholar] [CrossRef] [PubMed]
- Chen, S.; Gao, J.; Lou, F.; Tuo, Y.; Tan, S.; Shan, Y.; Luo, L.; Xu, Z.; Zhang, Z.; Huang, X. Rapid estimation of soil water content based on hyperspectral reflectance combined with continuous wavelet transform, feature extraction, and extreme learning machine. Peer J. 2024, 12, e17954. [Google Scholar] [CrossRef]
- Falcioni, R.; Oliveira, R.B.d.; Chicati, M.L.; Antunes, W.C.; Demattê, J.A.M.; Nanni, M.R. Fluorescence and hyperspectral sensors for nondestructive analysis and prediction of biophysical compounds in the green and purple leaves of Tradescantia plants. Sensors 2024, 24, 6490. [Google Scholar] [CrossRef]
- Shao, Y.; Liu, Y.; Xuan, G.; Wang, Y.; Gao, Z.; Hu, Z.; Han, X.; Gao, C.; Wang, K. Application of hyperspectral imaging for spatial prediction of soluble solid content in sweet potato. RSC Adv. 2020, 10, 33148–33154. [Google Scholar] [CrossRef]
- Zhang, X.; Dong, C.; Liu, H.; Meng, X.; Luo, C.; Han, Y.; Ai, H. Methodology for regional soil organic matter prediction with spectroscopy: Optimal sample grouping, input variables, and prediction model. Remote Sens. 2024, 16, 565. [Google Scholar] [CrossRef]
- Zhu, W.D.; Kong, Y.X.; He, N.-Y.; Qiu, Z.-G.; Lu, Z.-G. Prediction and analysis of chlorophyll a concentration in the western waters of Hong Kong based on BP neural network. Sustainability 2023, 15, 10441. [Google Scholar] [CrossRef]
- Yang, Y.; Yang, W.; Zhang, H.; Xu, J.; Jin, X.; Zhang, X.; Ye, Z.; Tang, X.; Liu, L.; Heng, W.; et al. Nondestructive detection of corky disease in symptomless ‘Akizuki’ pears via Raman spectroscopy. Sensors 2024, 24, 6324. [Google Scholar] [CrossRef]
- Boateng, E.Y.; Otoo, J.; Abaye, D.A. Basic tenets of classification algorithms K-nearest-neighbor, support vector machine, random forest and neural network: A review. J. Data Anal. Inf. Process. 2020, 8, 341–357. [Google Scholar] [CrossRef]
- Rajput, B.S.; Roy, P.; Soni, S.; Raghuwanshi, B.S. ELM-Based Imbalanced Data Classification—A Review. Informatica 2024, 48, 185–204. [Google Scholar] [CrossRef]
Disclaimer/Publisher’s Note: The statements, opinions and data contained in all publications are solely those of the individual author(s) and contributor(s) and not of MDPI and/or the editor(s). MDPI and/or the editor(s) disclaim responsibility for any injury to people or property resulting from any ideas, methods, instructions or products referred to in the content. |
© 2024 by the authors. Licensee MDPI, Basel, Switzerland. This article is an open access article distributed under the terms and conditions of the Creative Commons Attribution (CC BY) license (https://creativecommons.org/licenses/by/4.0/).

