

Influence of Different Drying Processes on the Chemical and Texture Profile of Cucurbita maxima Pulp
 , , ,
, , ,
Abstract
:1. Introduction
2. Materials and Methods
2.1. Chemicals and Reagents
2.2. Material Preparation
2.3. Drying Process
2.3.1. Hot Air Drying
2.3.2. Vacuum Drying
2.3.3. Conduction Drying
2.4. Chemical Analysis
2.5. Protein and Sugar Extraction
2.6. Protein Analysis
2.7. Sugar Analysis
2.8. Texture Analysis
2.9. Statistical Analysis
3. Results and Discussion
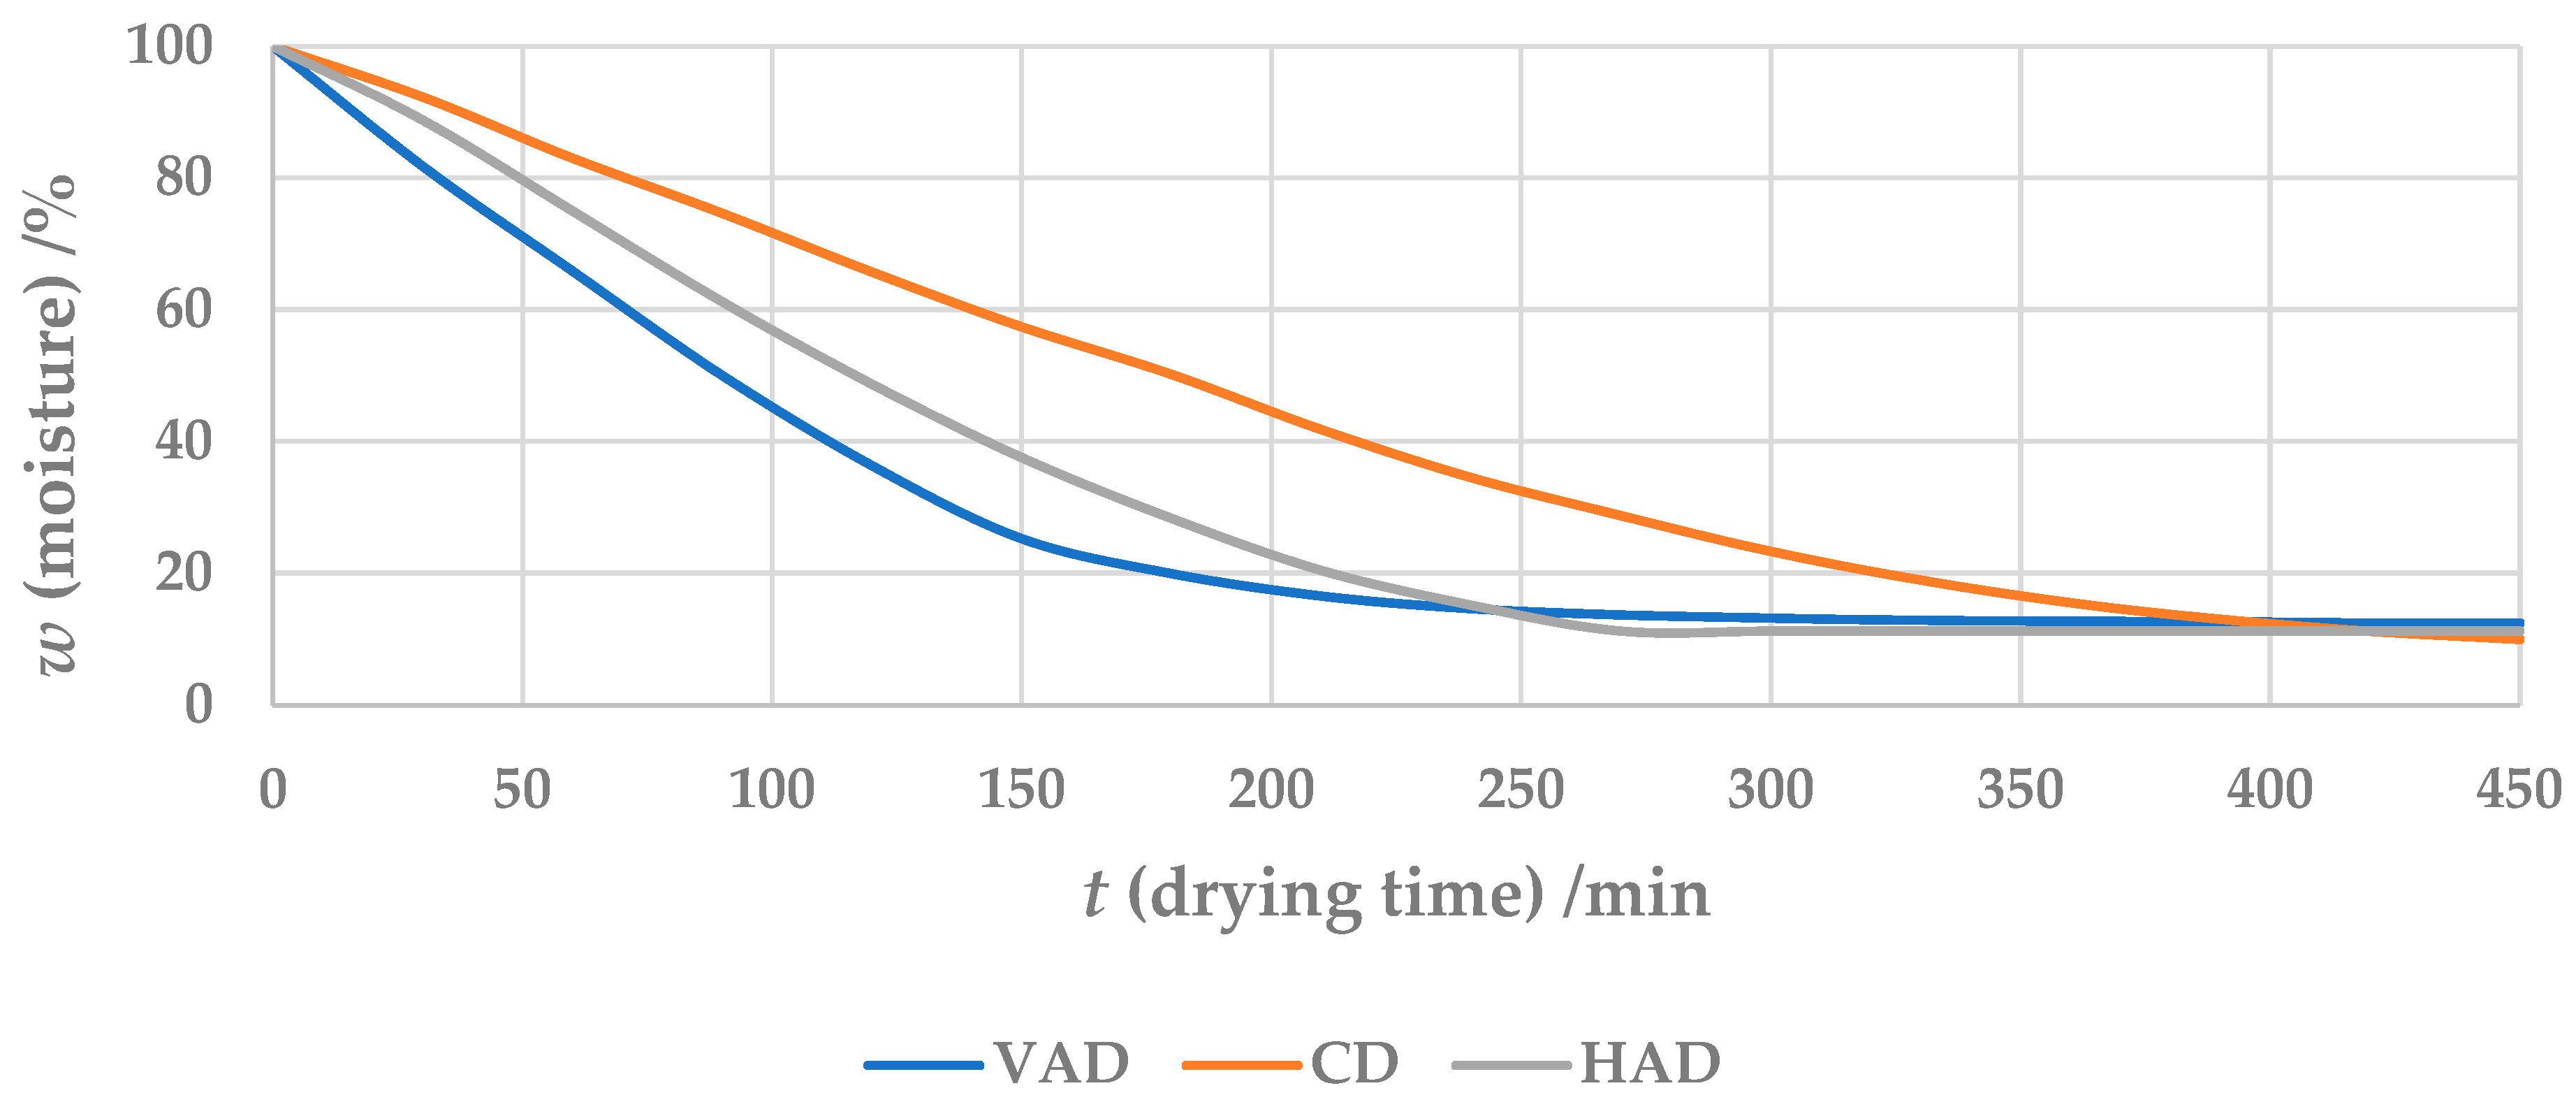
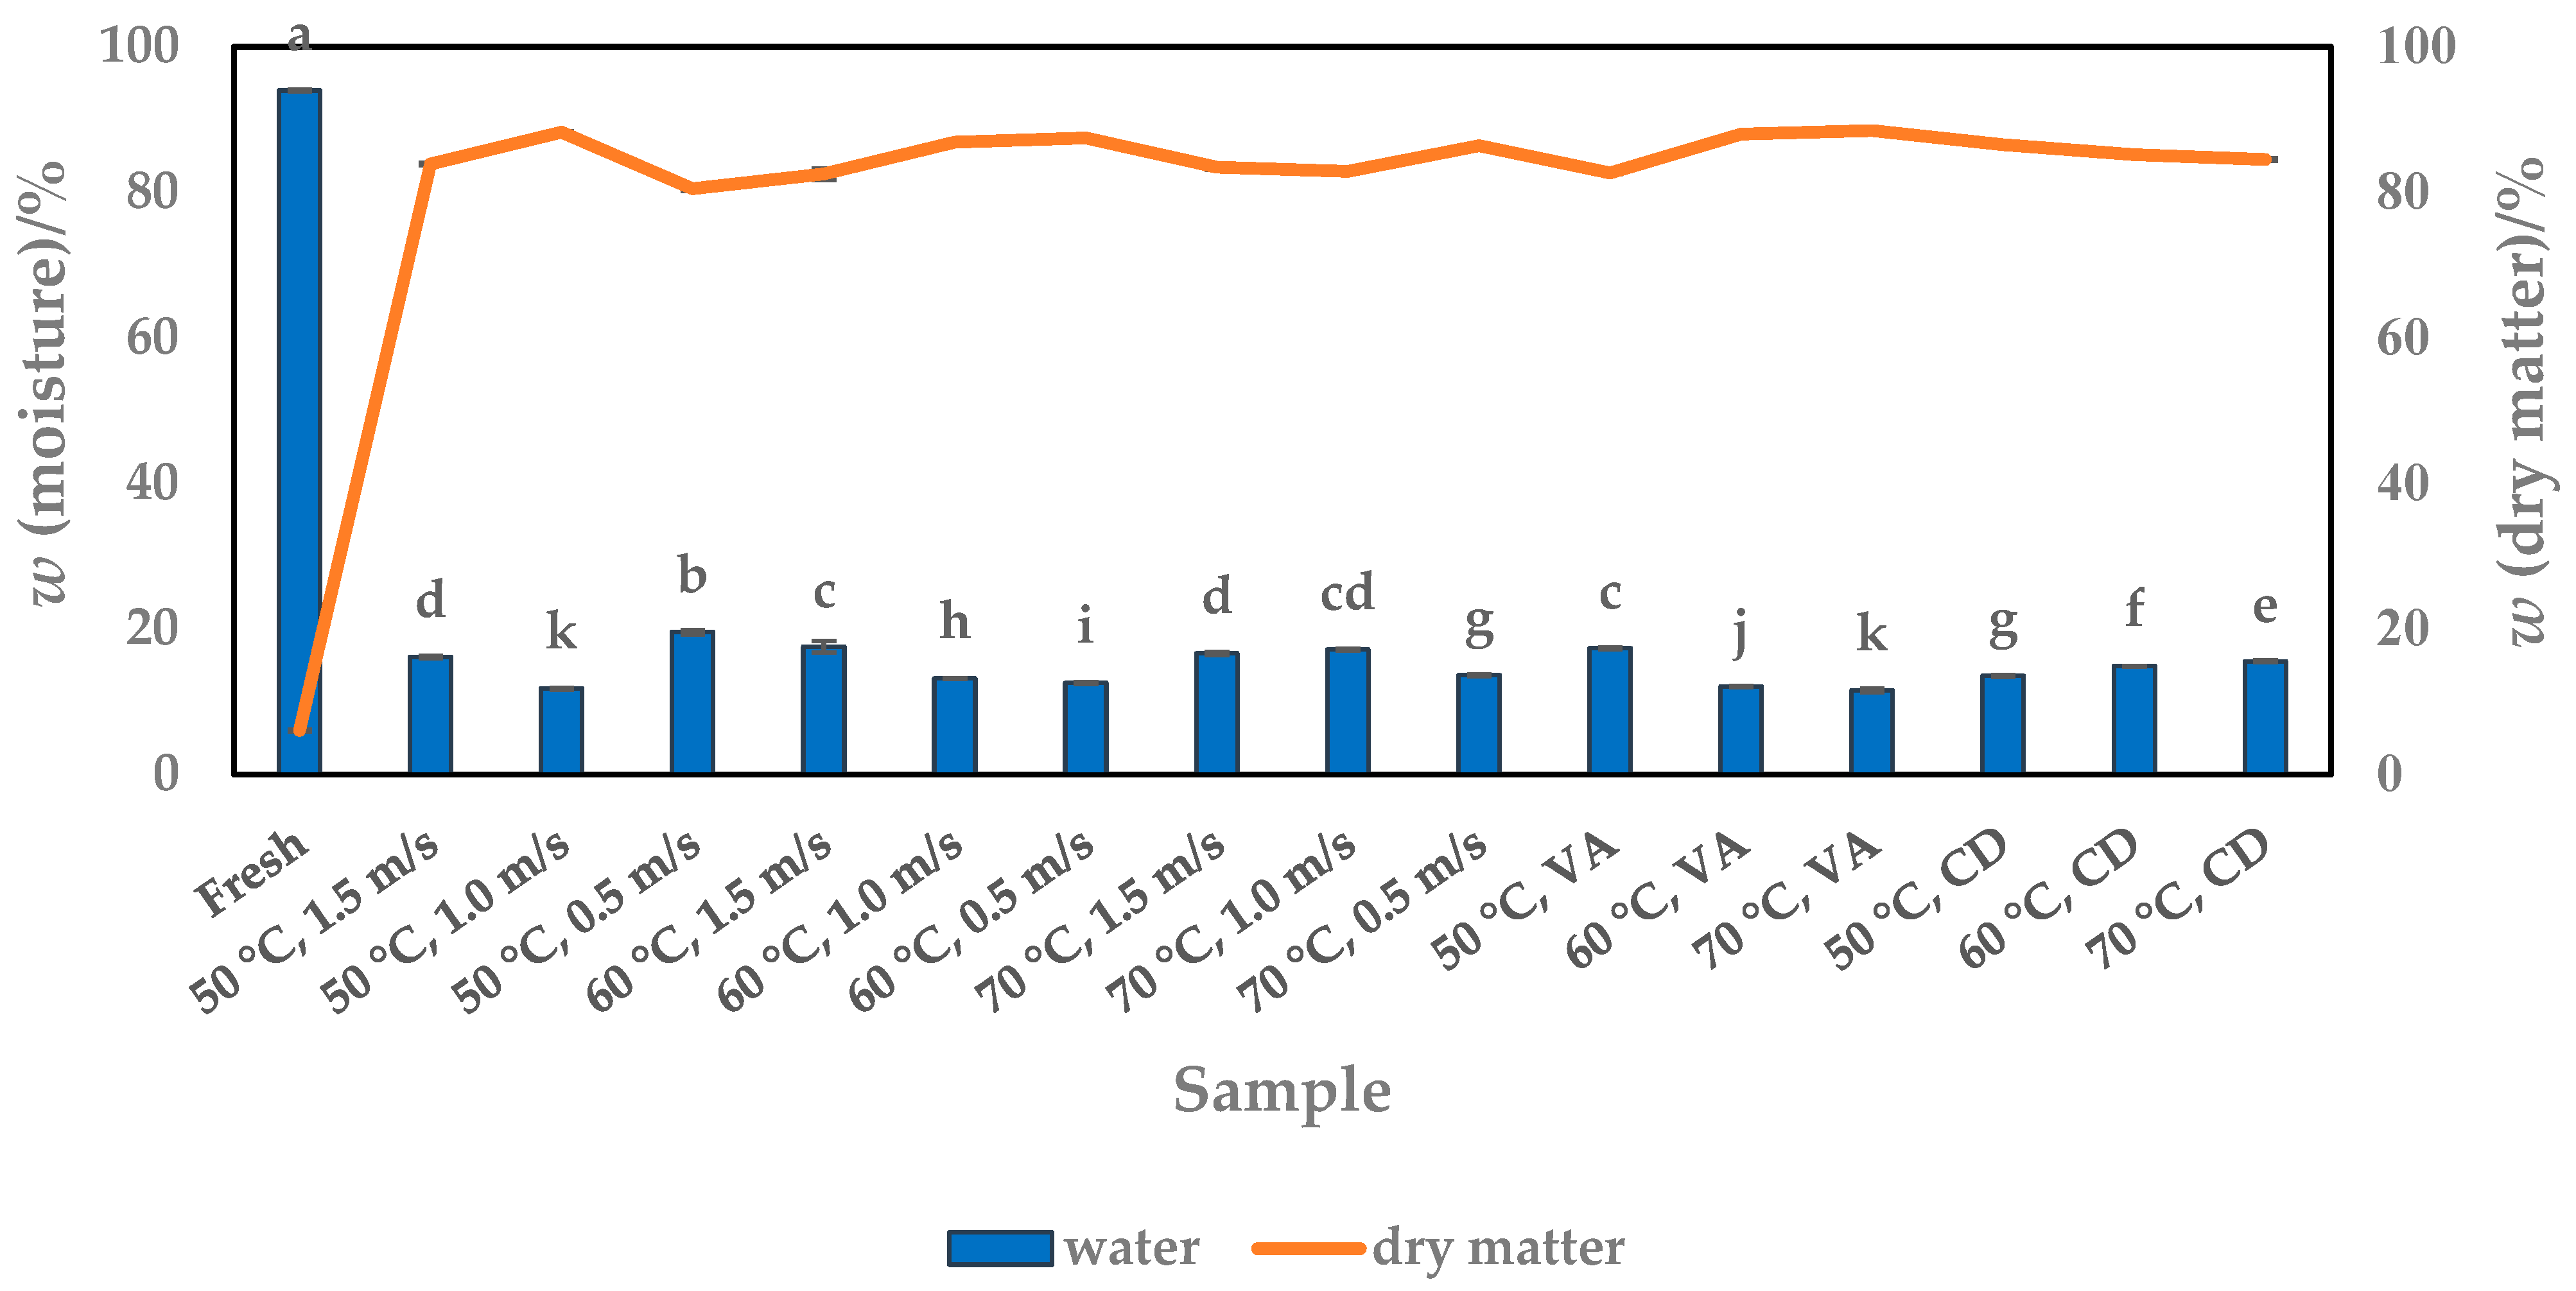
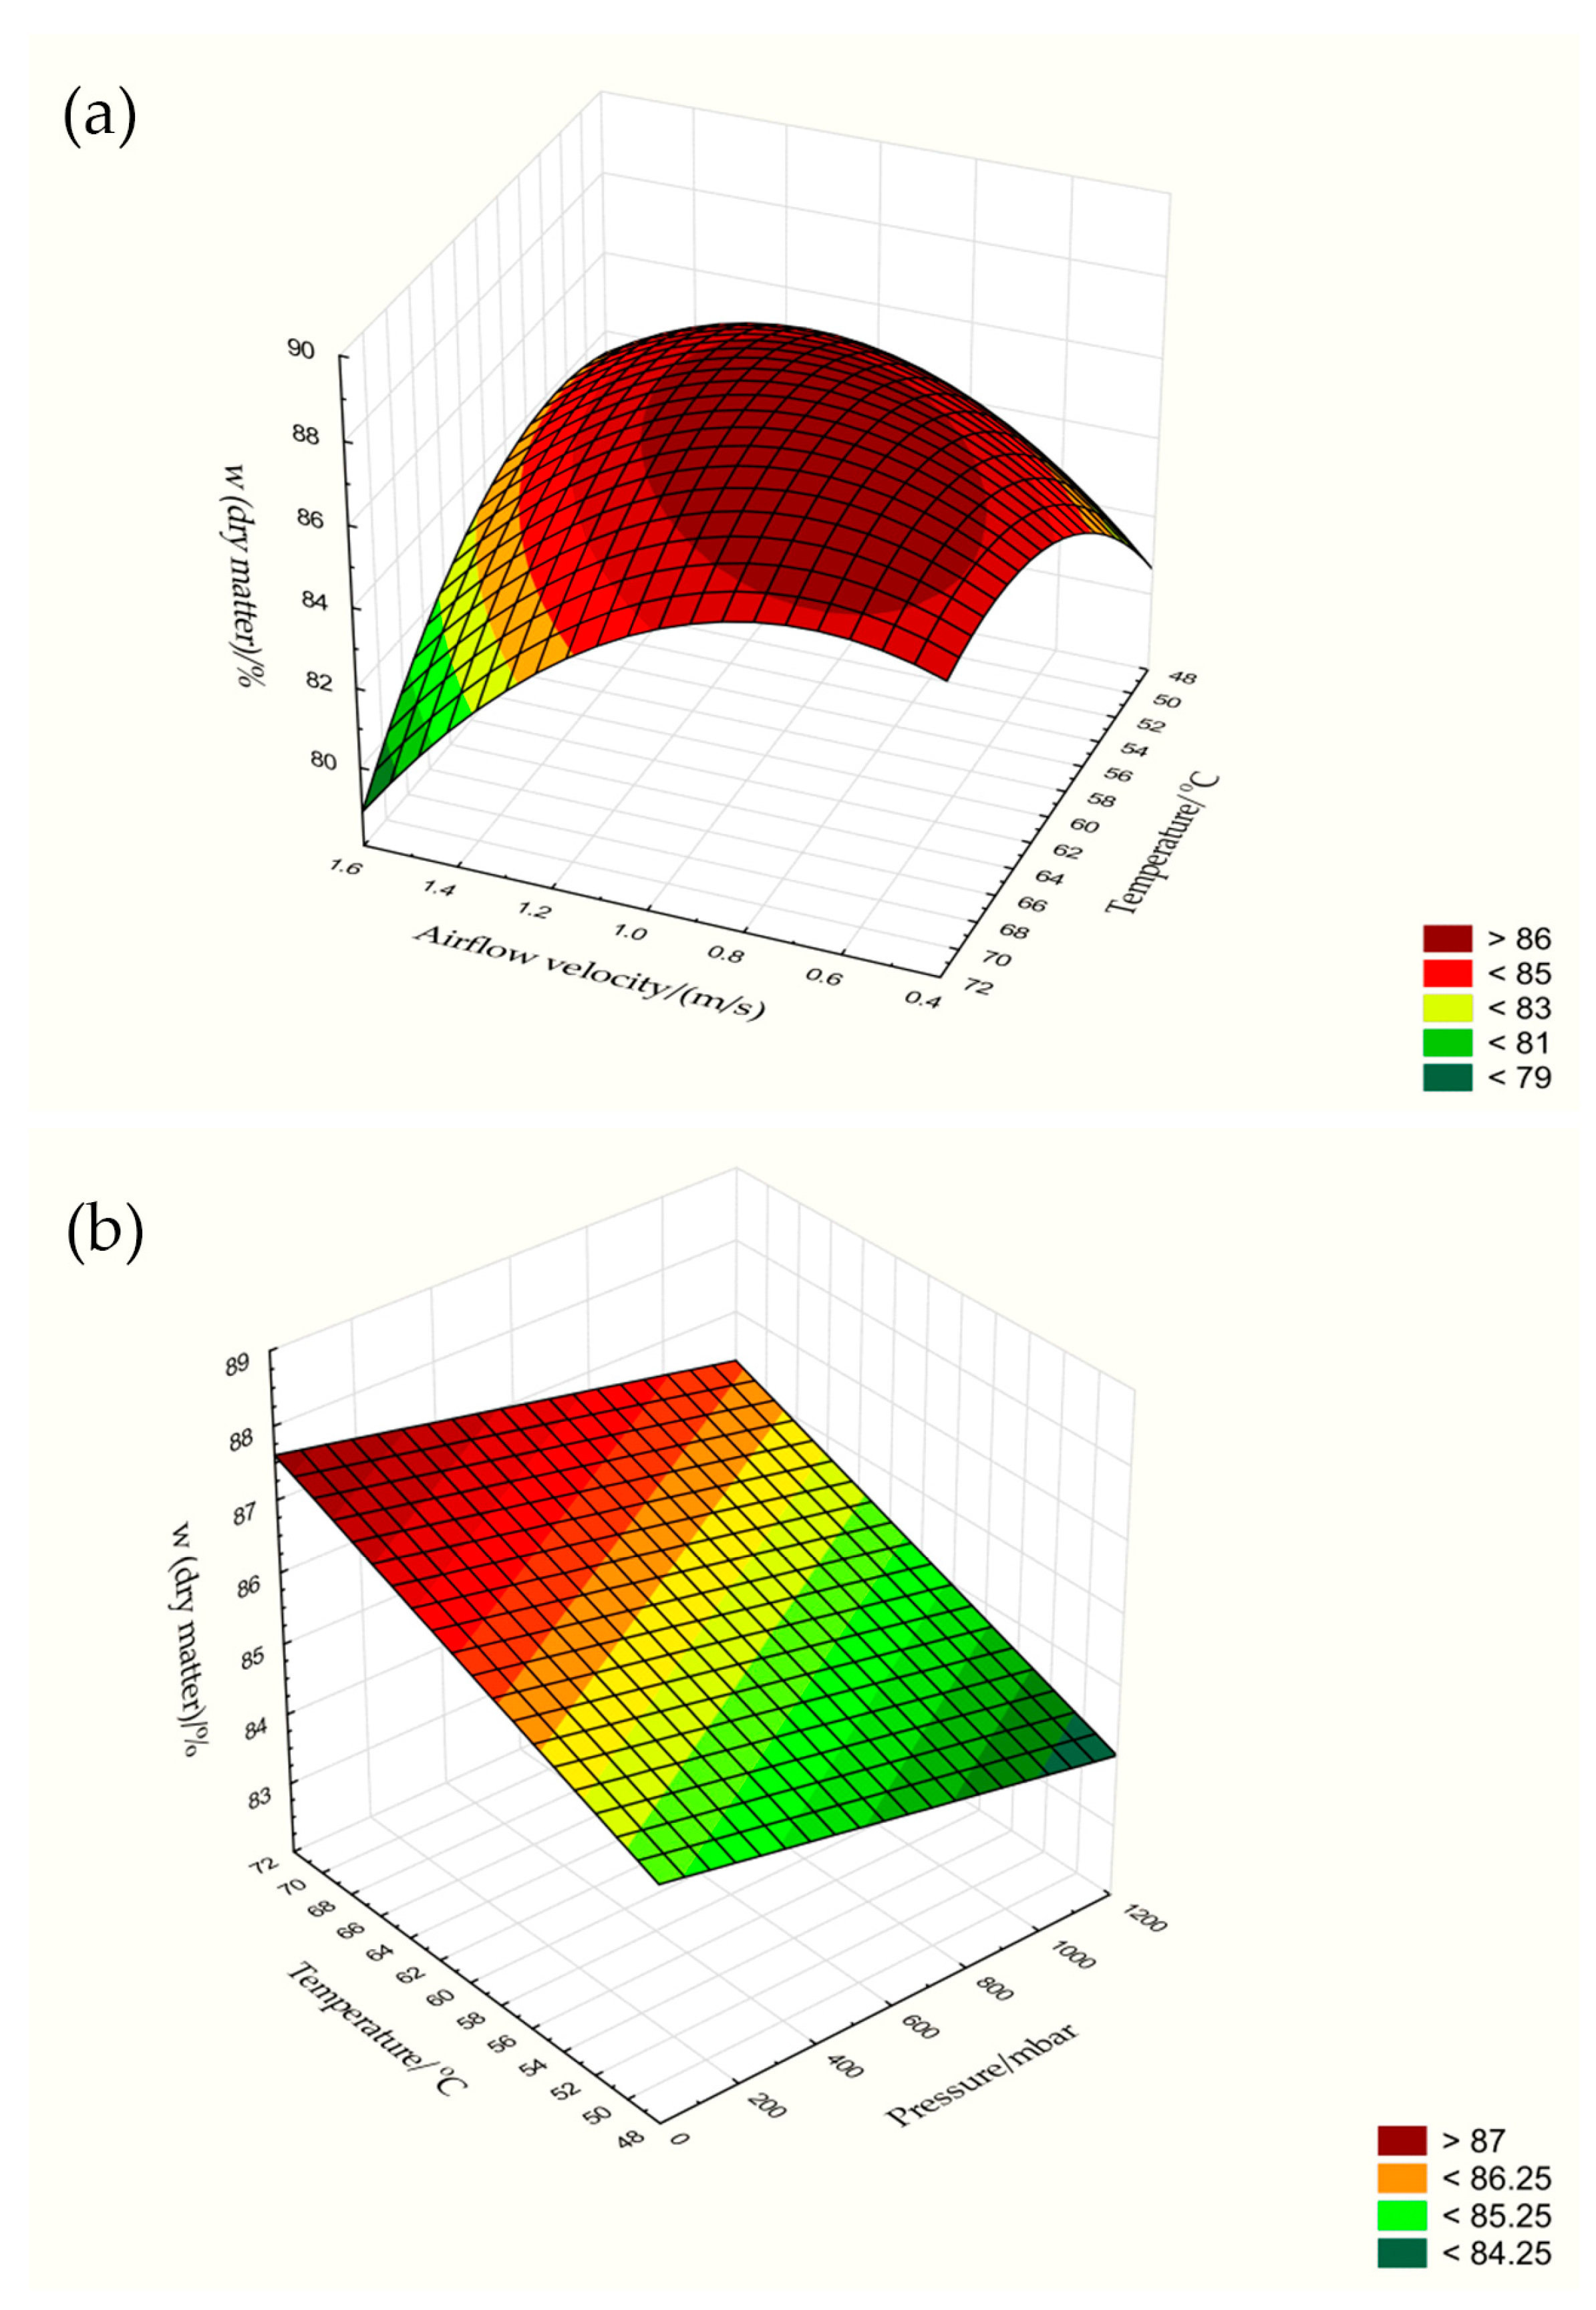
3.1. Moisture Content
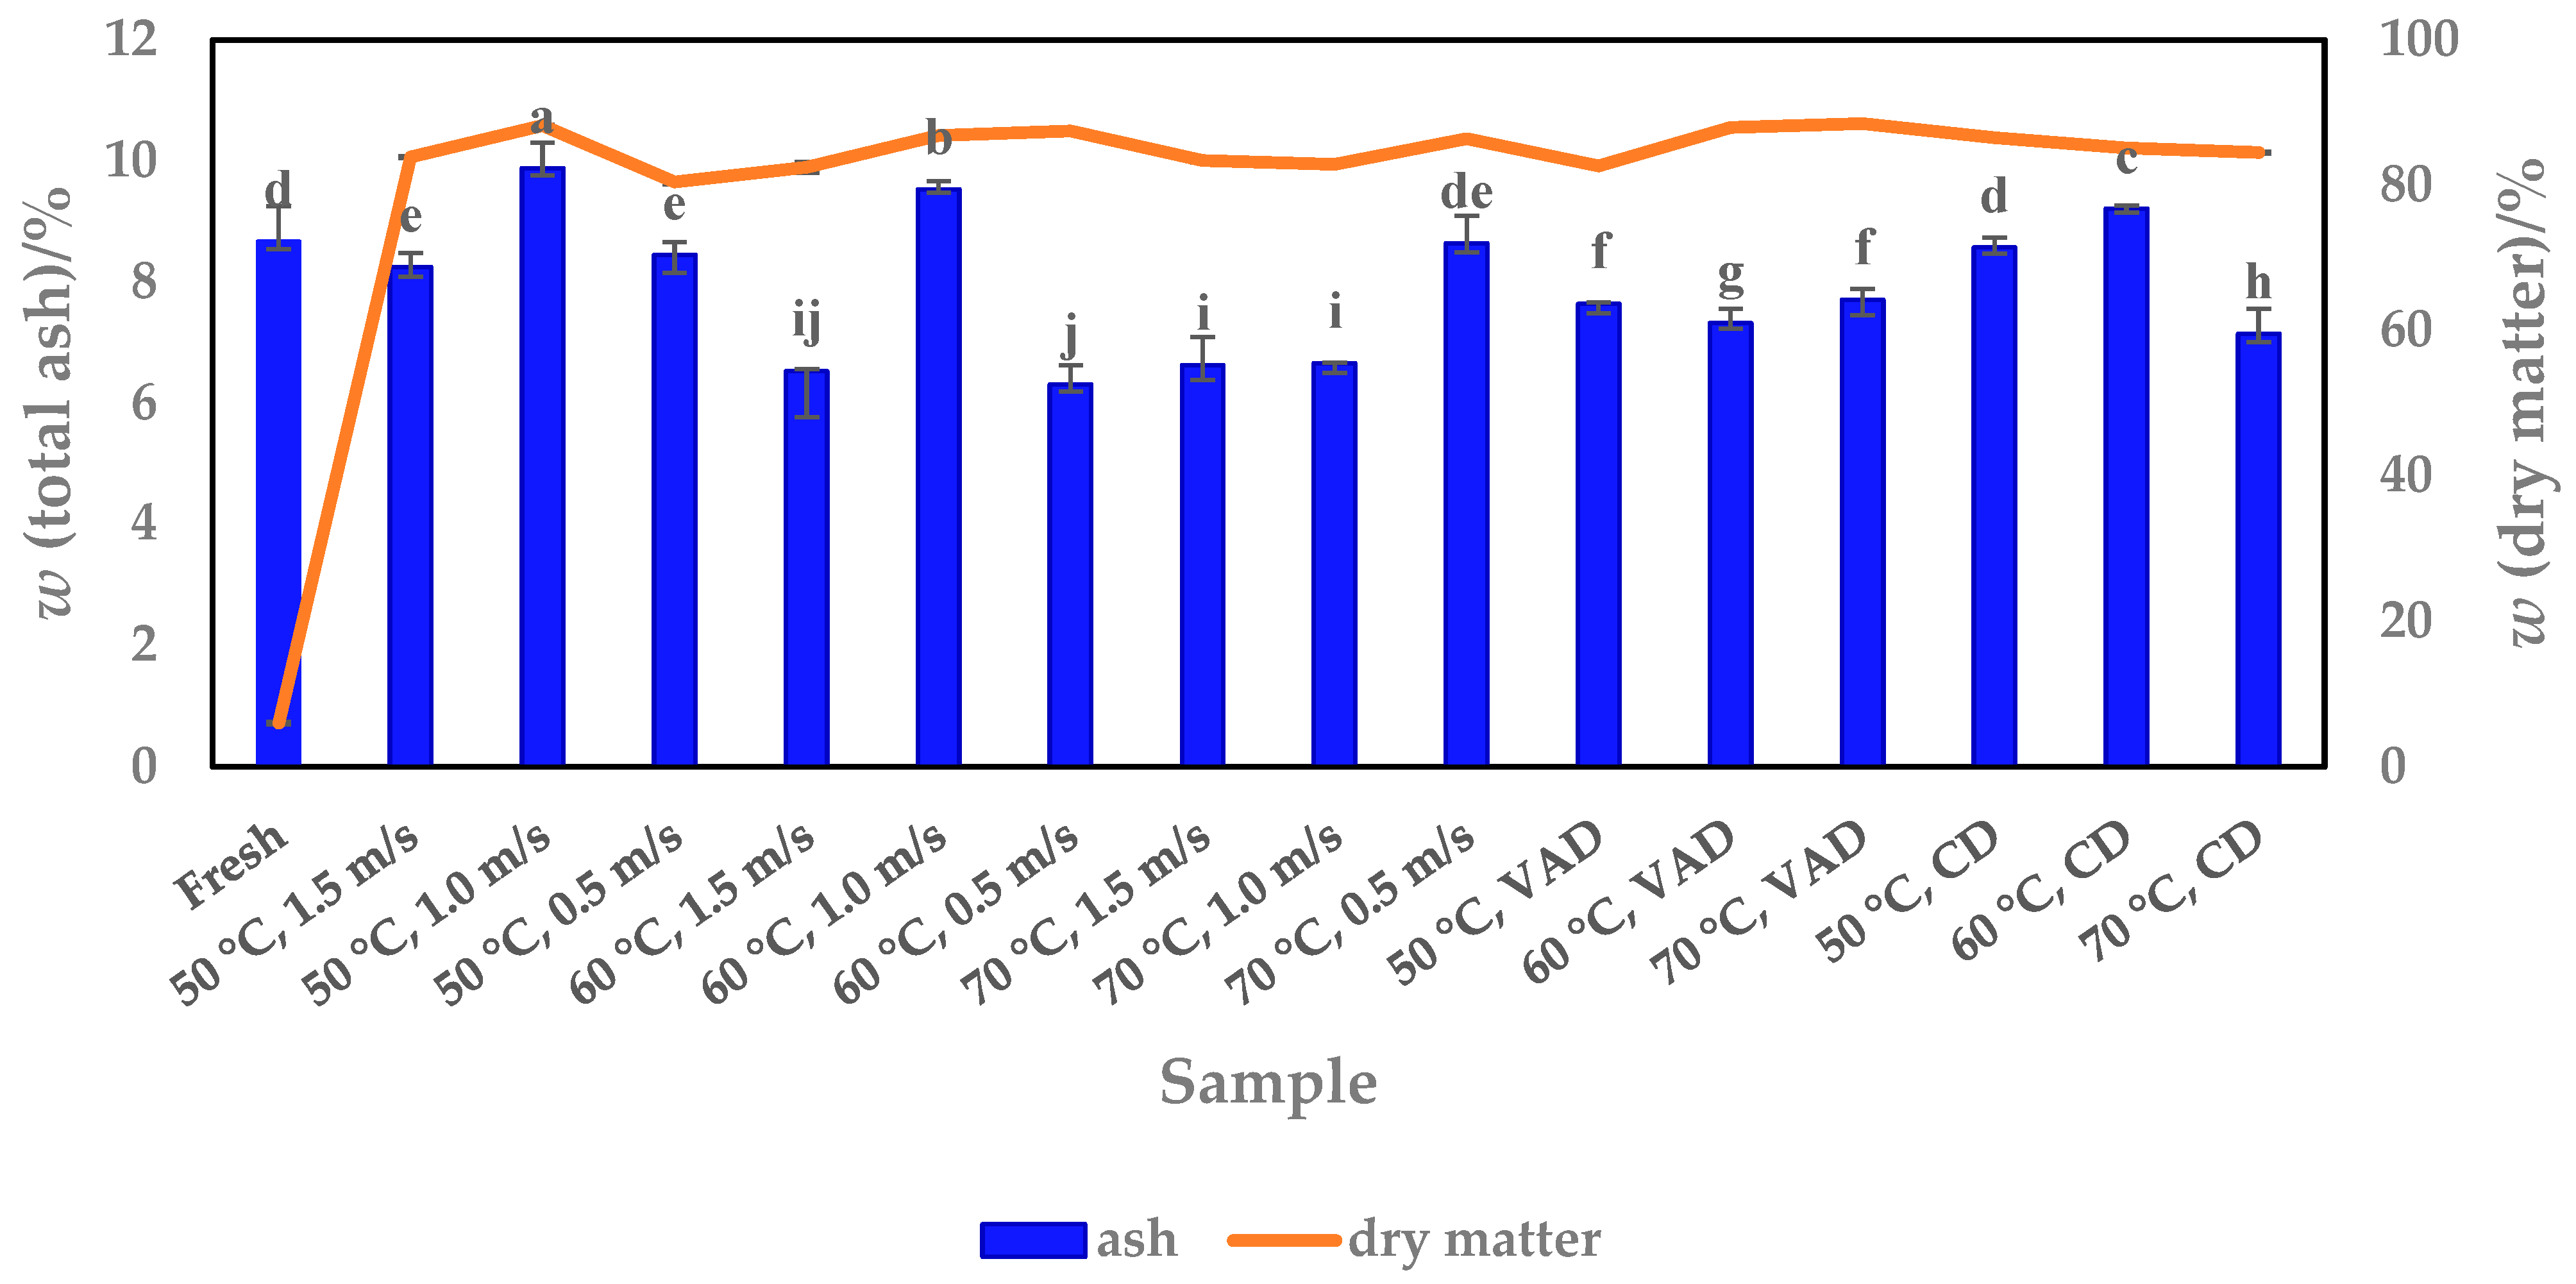
3.2. Ash Content
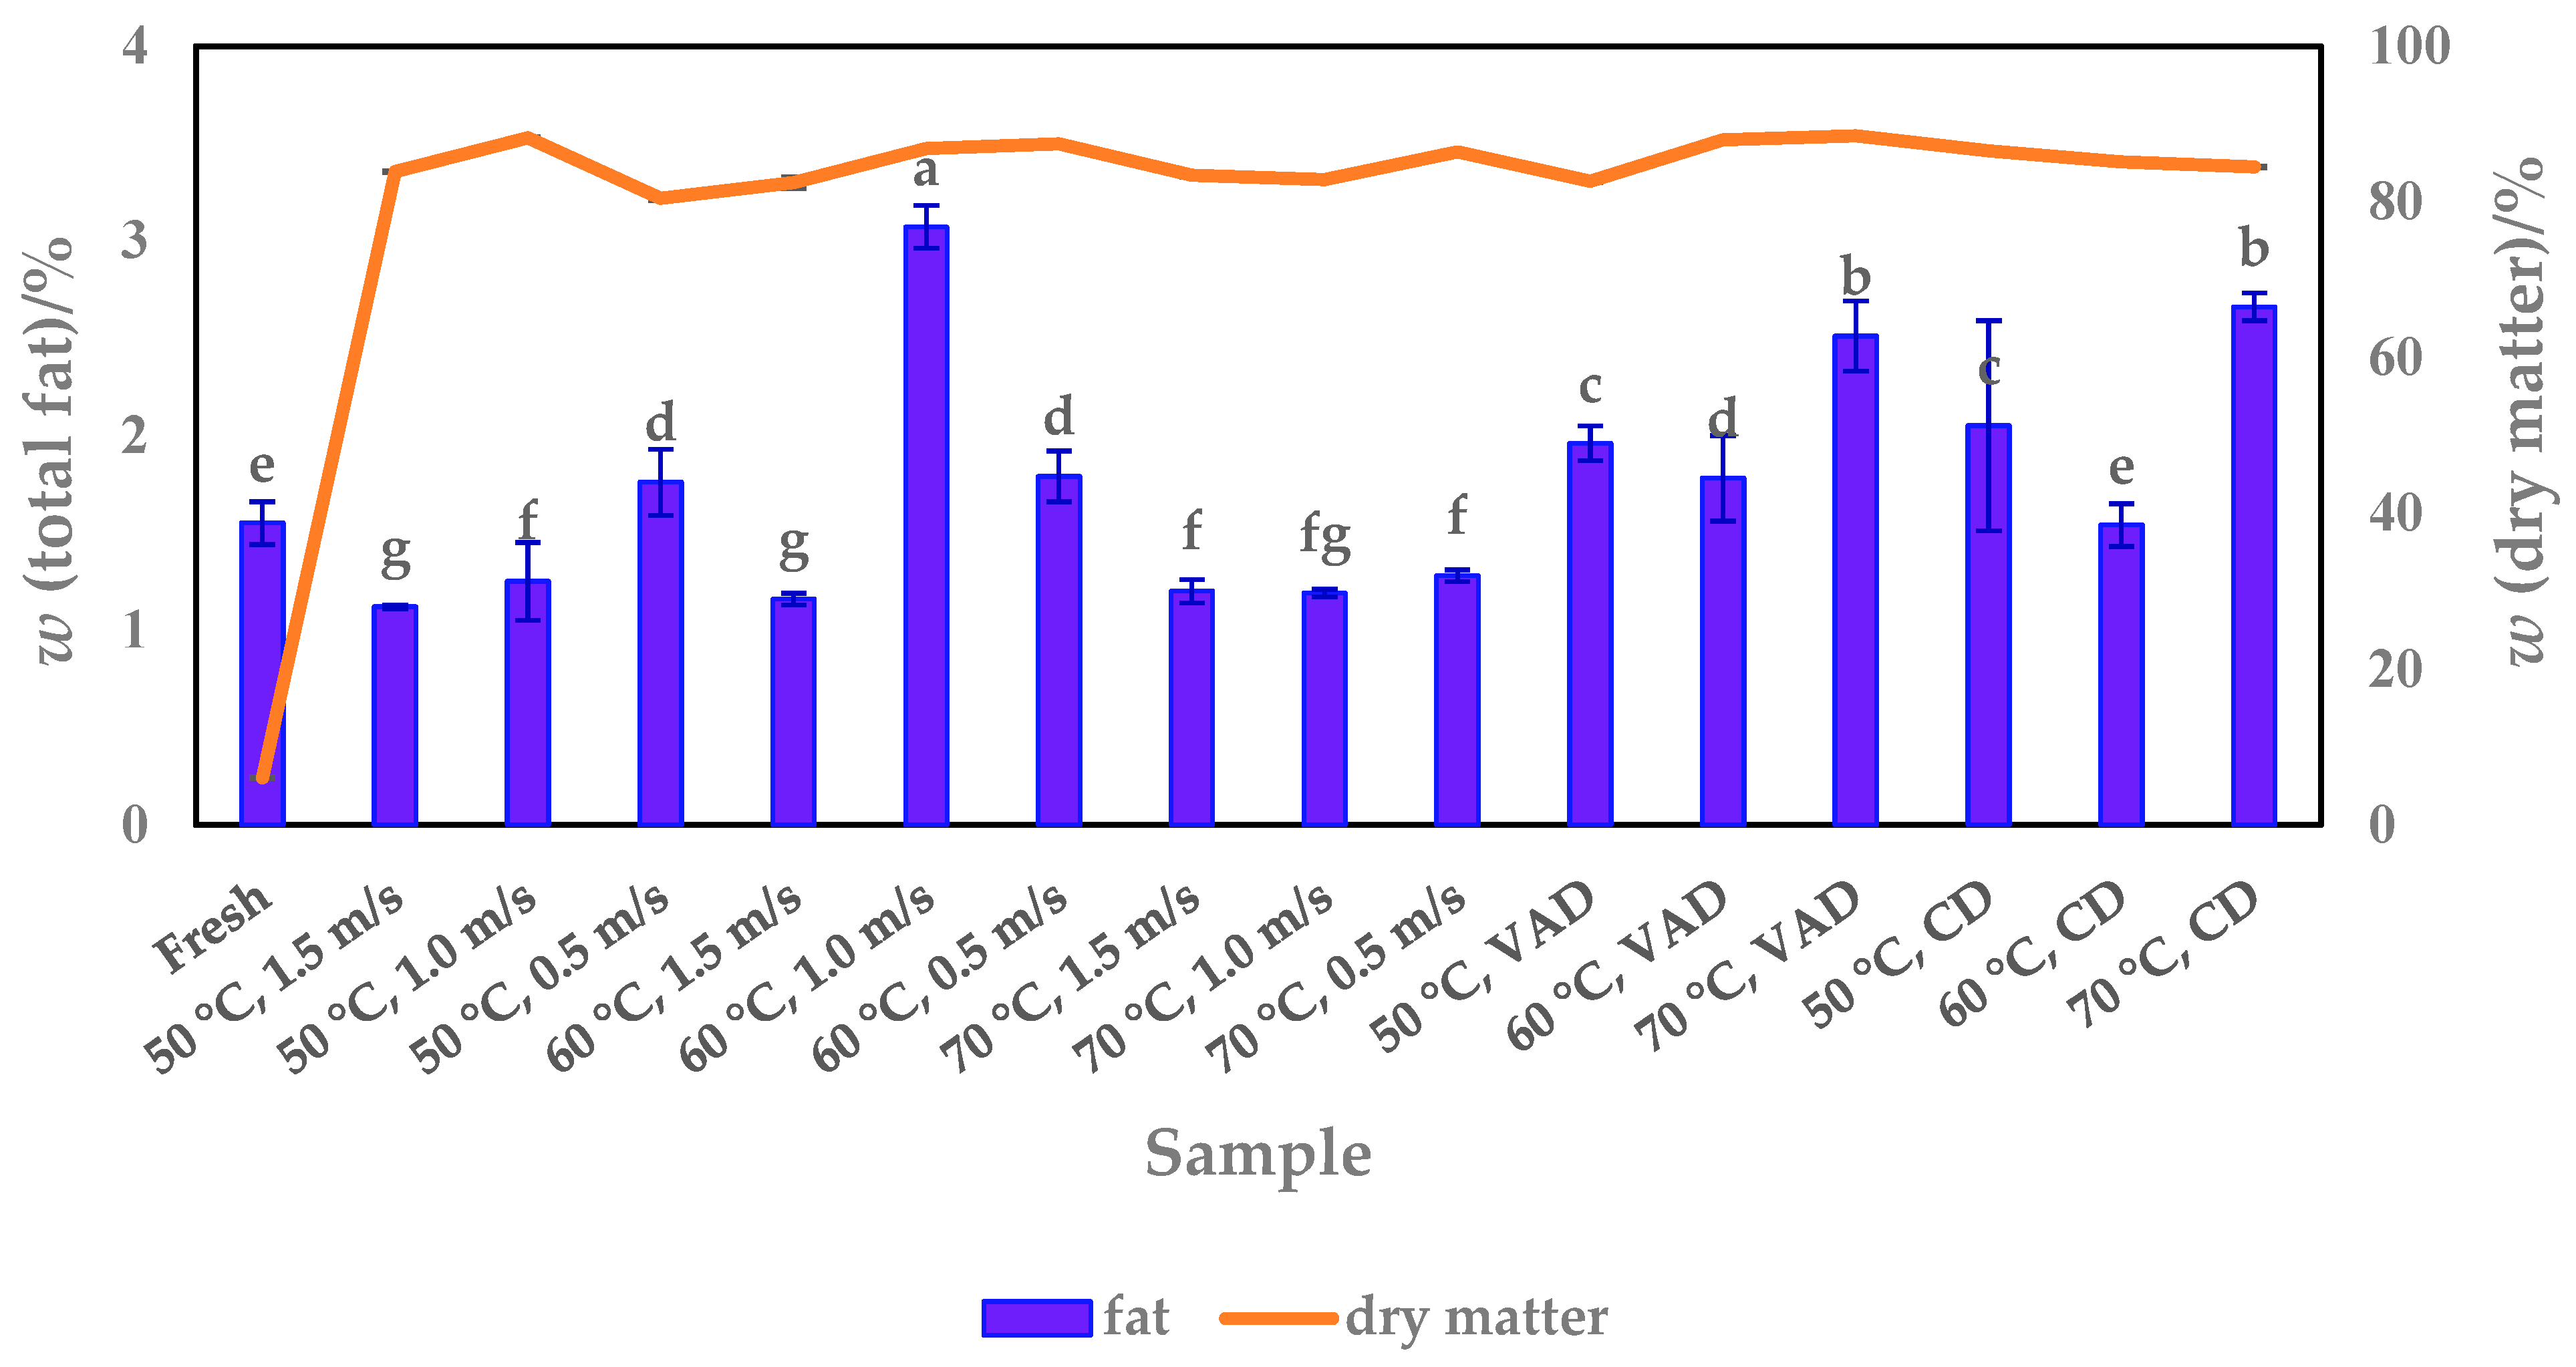
3.3. Fat Content
3.4. Fibre Content
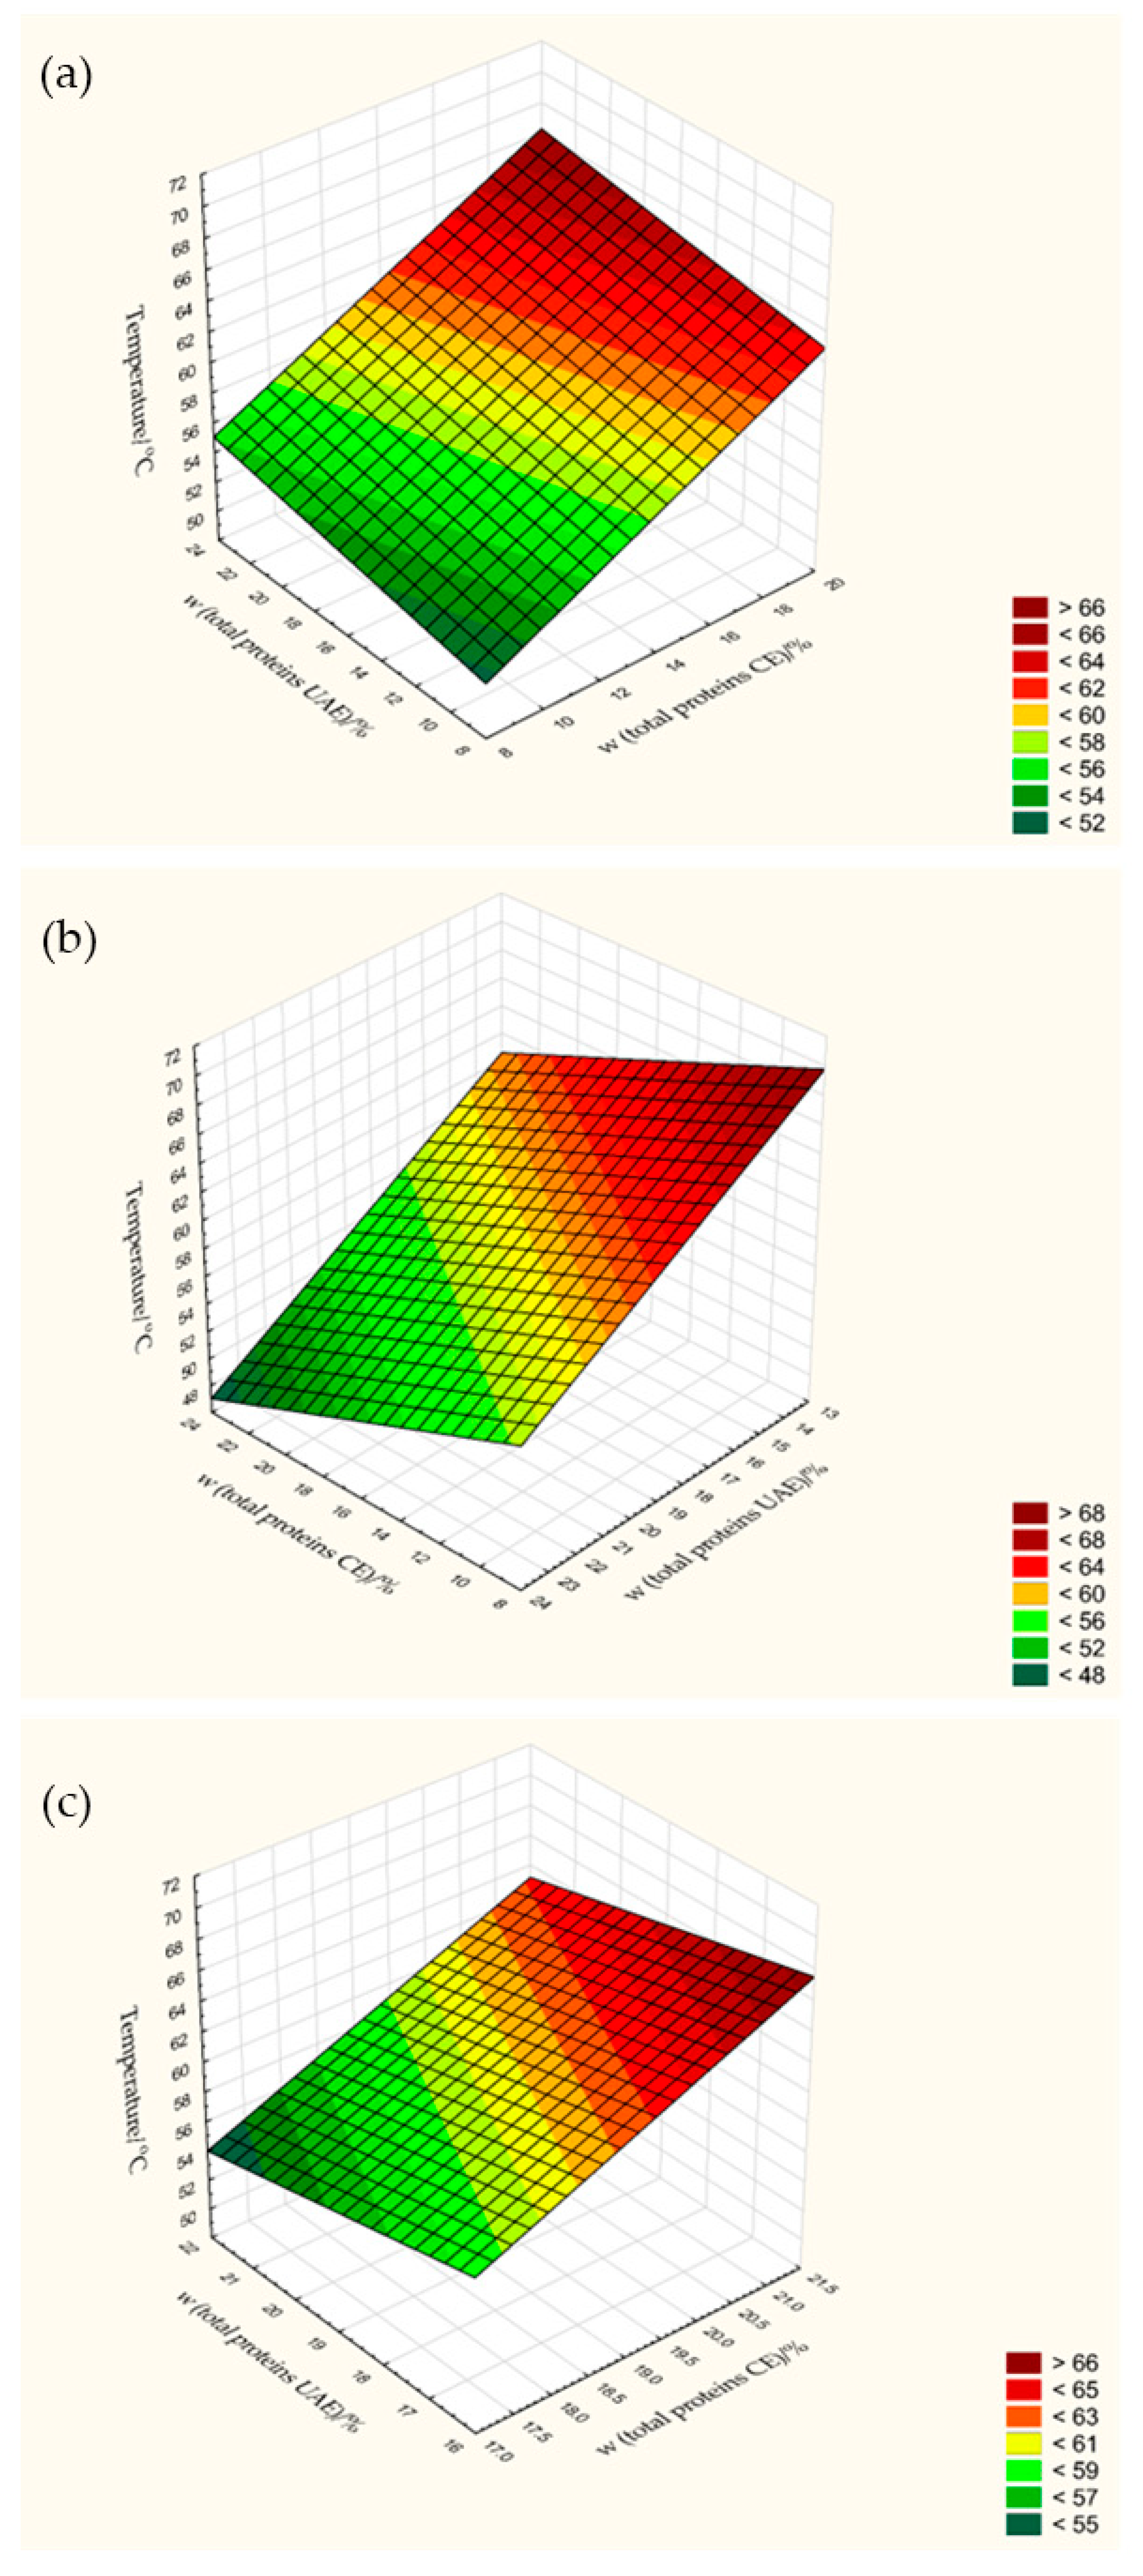
3.5. Total Protein Content
3.6. Total Sugar Content
3.7. Texture Profile
4. Conclusions
Supplementary Materials
Author Contributions
Funding
Institutional Review Board Statement
Informed Consent Statement
Data Availability Statement
Conflicts of Interest
Abbreviations
References
- Salehi, B.; Capanoglu, E.; Adrar, N.; Catalkaya, G.; Shaheen, S.; Jaffer, M.; Giri, L.; Suyal, R.; Jugran, A.K.; Calina, D.; et al. Cucurbits plants: A key emphasis to its pharmacological potential. Molecules 2019, 24, 1854. [Google Scholar] [CrossRef] [PubMed]
- Rolnik, A.; Olas, B. Vegetables from the Cucurbitaceae family and their products: Positive effect on human health. Nutrition 2020, 78, 110788. [Google Scholar] [CrossRef] [PubMed]
- Hussain, A.; Kausar, T.; Sehar, S.; Sarwar, A.; Ashraf, A.H.; Jamil, M.A.; Noreen, S.; Rafique, A.; Iftikhar, K.; Quddoos, M.Y.; et al. A Comprehensive review of functional ingredients, especially bioactive compounds present in pumpkin peel, flesh and seeds, and their health benefits. Food Chem. Adv. 2022, 1, 100067. [Google Scholar] [CrossRef]
- Kulczyński, B.; Gramza-Michałowska, A. The profile of carotenoids and other bioactive molecules in various pumpkin fruits (Cucurbita maxima Duchesne) cultivars. Molecules 2019, 24, 3212. [Google Scholar] [CrossRef] [PubMed]
- Salehi, B.; Sharifi-Rad, J.; Capanoglu, E.; Adrar, N.; Catalkaya, G.; Shaheen, S.; Jaffer, M.; Giri, L.; Suyal, R.; Jugran, A.K.; et al. Cucurbita plants: From farm to industry. Appl. Sci. 2019, 9, 3387. [Google Scholar] [CrossRef]
- Dong, X.J.; Chen, J.Y.; Chen, S.F.; Li, Y.; Zhao, J. The composition and anti.inflamatory properties of pumpkin seeds. J. Food Meas. Charact. 2021, 15, 1834–1842. [Google Scholar] [CrossRef]
- Cvetković, D.; Stanojević, L.; Zvezdanović, J.; Stanojević, J.; Savić, D.; Karabegović, I.; Danilović, B. Pumpkin fruit (Cucurbita pepo L.) as a source of phytochemicals useful in food and pharmaceutical industries. J. Food Meas. Charact. 2021, 15, 4596–4607. [Google Scholar] [CrossRef]
- Ninčević Grassino, A.; Rimac Brnčić, S.; Badanjak Sabolović, M.; Šic Žlabur, J.; Marović, R.; Brnčić, M. Carotenoid content and profiles of pumpkin products and by-products. Molecules 2023, 28, 858. [Google Scholar] [CrossRef]
- FAOSTAT. Available online: https://www.fao.org/faostat/en/#home (accessed on 23 October 2022).
- Indiarto, R.; Hodizah Asyifaa, A.; Angiputri Adiningsih, F.C.; Aulia, G.A.; Rahmalia Achmad, S. Conventional and advanced food drying technology: A current review. Int. J. Sci. Tech. Res. 2021, 10, 99–107. [Google Scholar]
- Radojčin, M.; Pavkov, I.; Bursać Kovačević, D.; Putnik, P.; Wiktor, A.; Stamenković, Z.; Kešelj, K.; Gere, A. Effect of selected drying methods and emerging drying intensification technologies on the quality of dried fruit: A review. Processes 2021, 9, 132. [Google Scholar] [CrossRef]
- Ježek, D.; Tripalo, B.; Brnčić, M.; Karlović, D.; Rimac Brnčić, S.; Vikić-Topić, D.; Karlović, S. Dehydration of celery by infrared drying. Croat. Chem. Acta 2008, 81, 325–331. [Google Scholar]
- Szadzińska, J.; Łechtańska, J.; Pashminehazar, R.; Kharaghani, A.; Tsotsas, E. Microwave- and ultrasound-assisted convective drying of raspberries: Drying kinetics and microstructural changes. Dry. Technol. 2018, 37, 1–12. [Google Scholar] [CrossRef]
- Roongruangsri, M.; Bronlund, J.E. Effect of air-drying temperature on physico-chemical, powder properties and sorption characteristics of pumpkin powders. Int. Food Res. J. 2016, 23, 962–972. [Google Scholar]
- Chao, E.; Tian, J.; Fan, L.; Zhang, T. Drying methods influence the physicochemical and functional properties of seed-used pumpkin. Food Chem. 2022, 369, 130937. [Google Scholar] [CrossRef]
- Chikpah, S.K.; Korese, J.K.; Sturm, B.; Hensel, O. Colour change kinetics of pumpkin (Cucurbita moschata) slices during convective air drying and bioactive compounds of the dried products. J. Agric. Food Res. 2022, 10, 100409. [Google Scholar] [CrossRef]
- Hussain, A.; Kausar, T.; Sehar, S.; Sarwar, A.; Sarwar, A.; Ashraf, A.H.; Jamil, M.A.; Noreen, S.; Rafique, A.; Iftikhar, K.; et al. Utilization of pumpkin, pumpkin powders, extracts, isolates, purified bioactives and pumpkin based functional food products: A key strategy to improve health in current post COVID 19 period: An updated review. Appl. Food Res. 2022, 2, 100241. [Google Scholar] [CrossRef]
- Brnčić, M.; Bosiljkov, T.; Ukrainczyk, M.; Tripalo, B.; Rimac, B.S.; Karlović, S.; Karlović, D.; Ježek, D.; Vikić, T.D. Influence of whey protein addition and feed moisture content on chosen physicochemical properties of directly expanded corn extrudates. Food Bioprocess Technol. 2011, 4, 1296–1306. [Google Scholar] [CrossRef]
- Brnčić, M.; Ježek, D.; Rimac Brnčić, S.; Bosiljkov, T.; Tripalo, B. Influence of whey protein concentrate addition on textural properties of corn flour extrudates. Mljekarstvo 2008, 58, 131–149. [Google Scholar]
- Köprüalan, O.; Altay, O.; Bodruk, A.; Kaymak-Ertekin, F. Effect of hybrid drying method on physical, textural and antioxidant properties of pumpkin chips. J. Food Meas. Charact. 2021, 15, 2995–3004. [Google Scholar] [CrossRef]
- Brnčić, M.; Karlović, S.; Rimac Brnčić, S.; Penava, A.; Bosiljkov, T.; Ježek, D.; Tripalo, B. Textural properties of infra red dried apple slices as affected by high power ultrasound pre-treatment. Afr. J. Biotechnol. 2010, 9, 6907–6915. [Google Scholar]
- Jeličić, I.; Božanić, R.; Brnčić, M.; Tripalo, B. Influence and comparison of thermal, ultrasonic and thermo-sonic treatments on microbiological quality and sensory properties of rennet cheese whey. Mljekarstvo 2012, 62, 165–178. [Google Scholar]
- Herceg, Z.; Brnčić, M.; Jambrak Režek, A.; Rimac Brnčić, S.; Badanjak, M.; Sokolić, I. Possibility of application high intensity ultrasound in milk industry. Mljekarstvo 2009, 59, 65–69. [Google Scholar]
- Šic Žlabur, J.; Zutic, I.; Radman, S.; Plesa, M.; Brnčić, M.; Barba, J.F.; Rochetti, G.; Lucini, L.; Lorenzo, J.M.; Brnčić, S.R.; et al. Effect of different green extraction methods and solvents on bioactive components of Chamomile (Matricaria chamomilla L.) Flowers. Molecules 2020, 25, 810. [Google Scholar] [CrossRef]
- Salehi, F.; Aghajanzadeh, S. T Effect of dried fruits and vegetables powder on cakes quality: A review. Trends Food Sci. Technol. 2020, 95, 162–172. [Google Scholar] [CrossRef]
- Sharma, S.; Rao, R. Nutritional quality characteristics of pumpkin fruit as revealed by its biochemical analysis. Int. Food Res. J. 2013, 20, 2309–2316. [Google Scholar]
- Sojak, M.J.; Jaros, M.; Głowacki, S. Analysis of giant pumpkin (Cucurbita maxima) quality parameters in various technologies of convective drying after long-term storage. Dry. Technol. 2014, 32, 106–116. [Google Scholar] [CrossRef]
- Umuhozariho, M.G.; Hagenimana, T.; Nsabimana, P.; Sirimu, C.; Uwobasa, N.; Uwinez, A.P. Effect of oven and freeze drying on nutritional composition of pumpkin (Cucurbita maxima) processed flour. Rwanda J. Agric. Sci. 2020, 2, 33–39. [Google Scholar]
- Montesano, D.; Blasi, F.; Simonetti, M.S.; Santini, A.; Cossignani, L. Chemical and nutritional characterisation of seed oil from Cucurbita maxima L. (var Berrettina) pumpkin. Foods 2019, 7, 30. [Google Scholar] [CrossRef]
- Guine, R.P.F.; Pinho, S.; Barroca, M.J. Study of the convective drying of pumpkin (Cucurbita maxima). Food Bioprod. Process. 2011, 89, 422–428. [Google Scholar] [CrossRef]
- Amin, M.Z.; Islam, T.; Uddin, M.R.; Uddin, M.J.; Rahman, M.M.; Satter, M.A. Comparative study on nutrient contents in the different parts of indigenous and hybrid varieties of pumpkin (Cucurbita maxima Linn.). Heliyon 2019, 5, e02462. [Google Scholar] [CrossRef]
- Márquez-Cardozo, C.; Caballero-Gutiérez, B.L.; Velázquez, C.H.J.; Restrepo-Molina, D.A. Efect of pretreatment and temperature on the drying kinetics and physicochemical and techno-functional characteristics of pumpkin (Cucurbita maxima). Heliyon 2021, 7, e06802. [Google Scholar] [CrossRef]
- Promsakha, P.; Nakhon, S.; Jangchud, K.; Jangchud, A. Comparison of physicochemical properties and antioxidant activities among pumpkin (Cucurbita moshata L.) flour and isolated starches from fresh pumpkin or flour. Int. J. Food Sci. 2017, 52, 2436–2444. [Google Scholar] [CrossRef]
- Calishan, G.; Dirim, S.N. Drying characteristics of pumpkin (Cucurbita moschata) slices in convective and freeze dryer. Heat Mass Transf. 2017, 53, 2129–2141. [Google Scholar] [CrossRef]
- Armesto, J.; Rocchetti, G.; Senizza, B.; Pateiro, M.; Barba, F.J.; Domínguez, R.; Lucini, L.; Lorenzo, J.M. Nutritional characterization of Butternut squash (Cucurbita moschata D.): Effect of variety (Ariel vs. Pluto) and farming type (conventional vs. organic). Food Res. Int. 2020, 132, 109052. [Google Scholar] [CrossRef]
- Bemfeito, C.M.; Carneiro, J.D.S.; Carvalho, E.E.N.; Coli, P.C.; Pereira, R.C.; Vilas Boas, E.V.B. Nutritional and functional potential of pumpkin (Cucurbita moschata) pulp and pequi (Caryocar brasiliense Camb.) peel flours. J. Food Sci. Technol. 2020, 57, 3920–3925. [Google Scholar] [CrossRef]
- Karlović, S.; Dujmić, F.; Brnčić, S.R.; Sabolović, M.B.; Ninčević Grassino, A.; Škegro, M.; Šimić, M.A.; Brnčić, M. Mathematical modeling and optimization of ultrasonic pre-treatment for drying of pumpkin (Cucurbita moschata). Processes 2023, 11, 469. [Google Scholar] [CrossRef]
- AOAC. Official Methods of Analysis, 18th ed.; Association of Official Analytical Chemists: Washington, DC, USA, 2010. [Google Scholar]
- Keppy, N.K.; Allen, M.W. The Biuret Method for the Determination of Total Protein Using an Evolution Array 8-Position Cell Changer; Thermo Fisher Scientific: Madison, WI, USA, 2009. [Google Scholar]
- Zouambia, Y.; Ettoumi, K.Y.; Krea, M.; Moulai-Mostefa, N. A new approach for pectin extraction: Electromagnetic induction heating. Arab. J. Chem. 2017, 10, 408–487. [Google Scholar] [CrossRef]
- Ngamwonglumlert, L.; Devahastin, S. Microstructure and Its Relationship with Quality and Storage Stability of Dried Foods, 1st ed.; Woodhead Publishing: Cambridge, UK, 2018; pp. 139–159. [Google Scholar]
- Rezig, L.; Chouaibi, M.; Meddeb, W.; Msaada, K.; Hamdi, S. Chemical composition and bioactive compounds of Cucurbitaceae seeds: Potential sources for new trends of plant oils. Process Saf. Envirom. Prot. 2019, 127, 73–81. [Google Scholar] [CrossRef]
- Yao, Y.; Xu, B. New insights into chemical compositions and health promoting effects of edible oils from new resources. Food Chem. 2021, 364, 130363. [Google Scholar] [CrossRef] [PubMed]
- Li, Y.; Yuan, F.; Wu, Y.; Zhang, Y.; Gao, B.; Yu, L. Triacylglycerols and fatty acid compositions of cucumber, tomato, pumpkin, and carrot seed oils by ultra-performance convergence chromatography combined with quadrupole time-of-flight mass spectrometry. Foods 2020, 9, 970. [Google Scholar] [CrossRef] [PubMed]
- Prommaban, A.; Kuanchoom, R.; Seepuan, N.; Chaiyana, W. Evaluation of fatty acid compositions, antioxidant, and pharmacological activities of pumpkin (Cucurbita moschata) seed oil from aqueous enzymatic extraction. Plants 2021, 10, 1582. [Google Scholar] [CrossRef]
- Barber, T.M.; Kabisch, S.; Pfeiffer, A.F.H.; Weickert, M.O. The health benefits of dietary fibre. Nutrients 2020, 12, 3209. [Google Scholar] [CrossRef]
- Ninčević Grassino, A.; Brnčić, M.; Vikić-Topić, D.; Roca, S.; Dent, M.; Rimac Brnčić, S. Ultrasound assisted extraction and characterization of pectin from tomato waste. Food Chem. 2016, 198, 93–100. [Google Scholar] [CrossRef]
- Ninčević Grassino, A.; Ostojić, J.; Miletić, V.; Djaković, S.; Bosiljkov, T.; Zorić, Z.; Ježek, D.; Rimac Brnčić, S.; Brnčić, M. Application of high hydrostatic pressure and ultrasound-assisted extractions as a novel approach for pectin and polyphenols recovery from tomato peel waste. Innov. Food Sci. Emerg. Technol. 2020, 64, 102424. [Google Scholar] [CrossRef]
- Hu, A.; Jiao, S.; Zheng, J.; Li, L.; Fan, Y.; Chen, L.; Zhang, Z. Ultrasonic frequency effect on corn starch and its cavitation. LWT—Food Sci. Technol. 2015, 60, 941–947. [Google Scholar] [CrossRef]
- Mahfuzur, M.R.; Lamsal, B.P.P. Ultrasound-assisted extraction and modification of plant-based proteins: Impact on physicochemical, functional, and nutritional properties. Compr. Rev. Food Sci. Food Saf. 2021, 20, 1457–1480. [Google Scholar]
- Mahmoodpoor, A.; Medghalchi, M.; Nazemiyeh, H.; Asgharian, K.; Shadvar, K.; Hamishehkar, H. Effect of Cucurbita Maxima on control of blood glucose in diabetic critically Ill atients. Adv. Pharm. Bull. 2018, 8, 347–351. [Google Scholar] [CrossRef] [PubMed]
- Guiné, R.P.F.; Barroca, M.J. Effect of drying treatments on texture and color of vegetables (pumpkin and green pepper). Food Bioprod. Process. 2012, 90, 58–63. [Google Scholar] [CrossRef]
- Monteiro, R.L.; Link, J.V.; Tribuzi, G.; Carciofia, B.A.M.; Laurindo, J.B. Effect of multi-flash drying and microwave vacuum drying on the microstructure and texture of pumpkin slices. LWT—Food Sci. Technol. 2018, 96, 612–619. [Google Scholar] [CrossRef]
- Henriques, F.; Guiné, R.P.F.; Barroca, M.J. Influence of Drying Treatment on Physical Properties of Pumpkin. Croat. J. Food Sci. Technol. 2012, 7, 53–58. [Google Scholar]


| Drying Method | Process Parameters | Sample Code | ||
|---|---|---|---|---|
| Temperature | Airflow Velocity | Pressure | ||
| (°C) | (m/s) | (mbar) | ||
| HAD | 50 | 1.5 | 1000 | 50 °C, 1.5 m/s |
| 1.0 | 50 °C, 1.0 m/s | |||
| 0.5 | 50 °C, 0.5 m/s | |||
| 60 | 1.5 | 60 °C, 1.5 m/s | ||
| 1.0 | 60 °C, 1.0 m/s | |||
| 0.5 | 60 °C, 0.5 m/s | |||
| 70 | 1.5 | 70 °C, 1.5 m/s | ||
| 1.0 | 70 °C, 1.0 m/s | |||
| 0.5 | 70 °C, 0.5 m/s | |||
| VAD | 50 | 0.0 | 100 | 50 °C, VAD |
| 60 | 60 °C, VAD | |||
| 70 | 70 °C, VAD | |||
| CD | 50 | 0.0 | 1000 | 50 °C, CD |
| 60 | 60 °C, CD | |||
| 70 | 70 °C, CD | |||
| Pulp | Moisture (%) | Ash (%) | Fat (%) | Fibre (%) | Protein (%) | Sugars (%) | Reference |
|---|---|---|---|---|---|---|---|
| C. maxima | |||||||
| Fresh | 82.10–84.09 (wb) | - | - | - | - | - | [13] |
| - | - | - | - | 0.49–0.76 (wb) | 8.9–10.7 (wb) | [24] | |
| 19.66 (wb) | 11.62 (wb) | [25] | |||||
| 85.33 * | 3.21 * | - | - | 1.19 * | - | [26] | |
| 82.50% (wb) | 0.84 (wb) | 0.08 (wb) | - | 1.28 (wb) | 4.90 (wb) | [27] | |
| 91.9 (wb) | 1.1 (wb) | 0.2 (wb) | 1.0 (wb) | 1.6 (wb) | 4.7 (wb) | [28] | |
| - | 13.99 (db) | 2.04 (db) | 12.24 (db) | 17.3 (db) | 52.84 (db) | ||
| Dried | 5.47–10.21 (db) | - | - | - | - | - | [13] |
| 91.15–93.45 (wb) | 31.20–89.52 (db) | [25] | |||||
| 7.62 * | 6.25 * | - | - | 1.81* | - | [26] | |
| 2.7–4.6 (wb) | 17.75–18.62 (db) | 1.24–2.06 (db) | 7.85–9.69 (db) | 15.83–16.68 (db) | 17.09–18.66 (db) | [28] | |
| 9.16–9.25 * | 0.36–0.55 * | 0.14–0.19 * | 0.16–0.35 * | 1.05–1.06 * | 0.35–1.05 * | [29] | |
| 7.10–8.31 (wb) | 8.06–8.14 (wb) | 2.17–2.19 (wb) | 25.12–25.45 (wb) | 8.53–8.64 (wb) | 48.29–48.83 (wb) | [30] | |
| C. moshata | |||||||
| Fresh | 87.78 (wb) | 6.16 (wb) | 8.77 (wb) | 12.02 (wb) | - | [31] | |
| 92.34 (wb) | [32] | ||||||
| 88.90–91.58 * | 1.03–1.31 * | 0.12–0.17 * | 2.20–2.97 * | 0.12–0.17 * | 2.15–2.90 * | [33] | |
| Dried | 9.69 (db) | 5.91 (db) | 9.03 (db) | 10.88 (db) | - | [31] | |
| 10.81 (wb) | [32] | ||||||
| 7.06 (wb) | 6.37 (db) | 1.88 (db) | 21.95 (db) | 11.08 (db) | 51.88 (db) | [34] | |
| Sample Code | w (Total Protein)/% | |||||||||
|---|---|---|---|---|---|---|---|---|---|---|
| CE | UAE | |||||||||
| t (Extraction)/min | ||||||||||
| 20 | 40 | 10 | 20 | 40 | ||||||
| Fresh | 15.22 ± 1.27 cD | (0.92) | 14.70 ± 0.02 dDE | (0.89) | 17.09 ± 0.95 cdC | (1.03) | 19.44 ± 2.34 bBC | (1.17) | 38.20 ± 5.05 aA | (2.30) |
| 50 °C, 1.5 m/s | 20.34 ± 2.13 aA | (17.06) | 20.57 ± 0.58 aA | (17.25) | 11.67 ± 1.05 hD | (9.79) | 16.44 ± 0.33 eB | (13.79) | 12.54 ± 1.41 ijC | (10.51) |
| 50 °C, 1.0 m/s | 13.49 ± 0.65 cD | (11.90) | 13.19 ± 0.65 efDE | (11.64) | 15.39 ± 0.57 eB | (13.58) | 16.99 ± 0.49 deA | (14.99) | 15.23 ± 0.53 hBC | (13.44) |
| 50 °C, 0.5 m/s | 15.95 ± 1.38 bA | (12.83) | 14.17 ± 0.34 eC | (11.40) | 14.34 ± 0.95 eB | (11.53) | 11.09 ± 0.44 iD | (8.92) | 9.72 ± 0.16 lE | (7.80) |
| 60 °C, 1.5 m/s | 15.23 ± 0.17 cE | (12.56) | 16.73 ± 0.19 cD | (13.80) | 18.41 ± 0.17 bB | (15.18) | 17.30 ± 0.19 cdC | (14.27) | 19.23 ± 0.18 dA | (15.86) |
| 60 °C, 1.0 m/s | 11.73 ± 0.96 deC | (10.19) | 11.43 ± 0.93 gCD | (9.93) | 10.85 ± 0.59 hD | (9.42) | 15.44 ± 0.39 fA | (13.41) | 14.21 ± 0.41 hiB | (12.34) |
| 60 °C, 0.5 m/s | 12.94 ± 0.56 cdA | (11.32) | 13.07 ± 0.88 fAB | (11.43) | 12.48 ± 0.15 ghB | (10.92) | 14.51 ± 1.91 ghA | (12.69) | 11.09 ± 0.39 kC | (9.69) |
| 70 °C, 1.5 m/s | 15.60 ± 0.84 bcE | (13.01) | 16.47 ± 0.16 cdD | (13.74) | 18.25 ± 0.18 bB | (15.22) | 17.59 ± 0.53 cdC | (14.53) | 18.56 ± 0.18 eA | (15.48) |
| 70 °C, 1.0 m/s | 14.81 ± 1.21 cD | (12.27) | 16.88 ± 0.16 cBC | (13.99) | 18.40 ± 0.18 bA | (15.25) | 16.56 ± 0.35 deC | (13.72) | 17.27 ± 0.36 fB | (14.31) |
| 70 °C, 0.5 m/s | 17.53 ± 0.39 bB | (15.14) | 20.05 ± 0.49 aA | (17.28) | 14.32 ± 0.16 eCD | (12.37) | 14.00 ± 0.33 hD | (12.09) | 11.92 ± 0.64 jE | (10.30) |
| 50 °C, VAD | 19.94 ± 0.72 aD | (16.47) | 19.93 ± 0.97 aD | (16.46) | 21.22 ± 1.40 aBC | (17.54) | 22.03 ± 0.43 aB | (18.20) | 22.35 ± 0.37 bA | (18.47) |
| 60 °C, VAD | 11.63 ± 1.11 eCD | (10.23) | 10.88 ± 0.78 gC | (9.57) | 12.91 ± 0.53 gB | (11.35) | 14.77 ± 0.36 gA | (12.99) | 14.85 ± 0.46 hA | (13.06) |
| 70 °C, VAD | 12.75 ± 0.55 dD | (11.28) | 13.30 ± 0.80 eC | (11.76) | 13.94 ± 0.46 fBC | (12.33) | 16.42 ± 0.46 eA | (14.53) | 16.33 ± 0.46 gA | (14.45) |
| 50 °C, CD | 19.35 ± 1.40 aB | (16.74) | 18.85 ± 0.46 bC | (16.30) | 18.48 ± 0.44 bC | (15.99) | 19.25 ± 0.59 bB | (16.65) | 21.22 ± 0.60 cA | (18.35) |
| 60 °C, CD | 18.16 ± 0.81 abC | (15.46) | 19.12 ± 0.28 bA | (16.28) | 16.78 ± 0.53 dD | (14.29) | 17.78 ± 0.70 cCD | (15.14) | 18.72 ± 0.38 eB | (15.94) |
| 70 °C, CD | 19.32 ± 0.65 aB | (16.32) | 19.69 ± 0.82 abAB | (16.63) | 17.68 ± 0.46 bcC | (14.93) | 19.79 ± 0.73 bAB | (16.72) | 20.39 ± 1.06 cdA | (17.23) |
| Sample Code | w (Total Sugar)/% | |||||||||
|---|---|---|---|---|---|---|---|---|---|---|
| CE | UAE | |||||||||
| t (Extraction)/min | ||||||||||
| 20 | 40 | 10 | 20 | 40 | ||||||
| Fresh | 43.30 ± 9.95 eD | (2.73) | 44.04 ± 4.21 eD | (2.61) | 49.51 ± 8.47 cC | (2.96) | 61.35 ± 4.02 bB | (3.70) | 94.13 ± 6.66 aA | (5.67) |
| 50 °C, 1.5 m/s | 35.23 ± 5.29 fgD | (29.54) | 38.11 ± 4.80 fBC | (31.97) | 35.84 ± 1.95 eD | (30.06) | 38.83 ± 0.79 hB | (32.57) | 45.31 ± 2.41 hA | (38.00) |
| 50 °C, 1.0 m/s | 45.74 ± 5.62 eE | (40.35) | 52.57 ± 6.23 cdD | (46.38) | 52.97 ± 4.38 cCD | (46.73) | 53.75 ± 3.56 dB | (47.42) | 57.35 ± 4.18 fA | (50.59) |
| 50 °C, 0.5 m/s | 52.03 ± 6.92 cC | (41.86) | 66.07 ± 14.21 aA | (53.15) | 50.02 ± 3.90 cD | (40.24) | 50.99 ± 4.01 eD | (41.02) | 61.39 ± 3.74 eB | (49.39) |
| 60 °C, 1.5 m/s | 62.16 ± 3.35 bB | (51.26) | 65.46 ± 5.40 abA | (53.99) | 62.42 ± 2.47 bB | (51.48) | 64.11 ± 7.18 abA | (52.87) | 62.30 ± 2.67 eB | (51.38) |
| 60 °C, 1.0 m/s | 40.15 ± 6.14 efC | (34.87) | 56.13 ± 6.17 bA | (48.74) | 48.62 ± 3.56 cB | (42.22) | 41.46 ± 2.94 gC | (36.00) | 52.05 ± 6.85 gAB | (45.20) |
| 60 °C, 0.5 m/s | 59.59 ± 7.25 bA | (52.12) | 48.77 ± 5.65 dB | (42.65) | 40.72 ± 3.34 eC | (35.61) | 46.21 ± 1.56 fB | (40.41) | 56.83 ± 4.59 fA | (49.70) |
| 70 °C, 1.5 m/s | 79.22 ± 2.03 aB | (66.07) | 70.86 ± 3.22 aD | (59.10) | 75.30 ± 4.82 aC | (62.80) | 63.05 ± 6.52 abE | (52.58) | 83.23 ± 4.58 bA | (69.42) |
| 70 °C, 1.0 m/s | 70.11 ± 5.55 bA | (58.10) | 68.53 ± 3.61 aA | (56.78) | 70.69 ± 8.84 aA | (58.57) | 70.29 ± 3.43 aA | (58.25) | 69.98 ± 2.26 cdA | (57.98) |
| 70 °C, 0.5 m/s | 38.73 ± 8.79 fB | (33.45) | 34.07 ± 10.89 fBC | (29.43) | 29.03 ± 2.76 eC | (25.08) | 52.55 ± 7.63 deA | (45.39) | 57.24 ± 6.32 fA | (49.44) |
| 50 °C, VAD | 58.86 ± 5.83 bB | (48.64) | 58.41 ± 3.47 bcB | (48.27) | 61.39 ± 4.34 bB | (50.73) | 58.68 ± 3.36 cB | (48.49) | 65.79 ± 8.02 dA | (54.36) |
| 60 °C, VAD | 57.84 ± 6.60 bcB | (50.87) | 60.89 ± 3.53 bcA | (53.55) | 61.02 ± 4.96 bcA | (53.67) | 61.25 ± 3.23 bA | (53.87) | 61.02 ± 5.63 efA | (53.67) |
| 70 °C, VAD | 49.24 ± 3.13 eD | (43.57) | 60.95 ± 6.18 bB | (53.93) | 60.26 ± 5.39 bcC | (53.32) | 67.54 ± 6.34 abA | (59.76) | 51.57 ± 6.54 gD | (45.63) |
| 50 °C, CD | 23.41 ± 2.44 hD | (20.25) | 21.12 ± 0.91 fD | (18.27) | 45.77 ± 1.22 dC | (39.60) | 47.84 ± 2.84 fB | (41.39) | 61.19 ± 5.42 efA | (52.93) |
| 60 °C, CD | 28.72 ± 0.54 hD | (24.45) | 28.79 ± 1.77 fD | (24.51) | 35.70 ± 3.08 eBC | (30.39) | 34.58 ± 4.24 hC | (29.44) | 44.17 ± 4.08 hA | (37.60) |
| 70 °C, CD | 49.86 ± 1.89 deC | (42.12) | 55.98 ± 7.61 cBC | (47.29) | 49.39 ± 1.14 cC | (41.72) | 62.41 ± 6.96 bA | (52.72) | 57.38 ± 0.87 fB | (48.46) |
| Sample Code | Hardness/(N) | Elasticity/(mm) | Work/(mJ) |
|---|---|---|---|
| Fresh | 27.74 ± 4.12 a | 3.47 ± 0.26 a | 46.77 ± 6.11 a |
| 50 °C, 1.5 m/s | 12.18 ± 0.64 f | 1.90 ± 0.10 g | 9.45 ± 1.08 e |
| 50 °C, 1.0 m/s | 12.21 ± 0.87 f | 1.93 ± 0.10 f | 9.52 ± 1.12 e |
| 50 °C, 0.5 m/s | 13.16 ± 1.25 ef | 1.96 ± 0.07 f | 9.76 ± 1.75 e |
| 60 °C, 1.5 m/s | 12.35 ± 2.11 f | 3.20 ± 0.57 ab | 11.80 ± 3.33 c |
| 60 °C, 1.0 m/s | 13.28 ± 1.17 e | 2.10 ± 0.09 e | 11.11 ± 0.61 e |
| 60 °C, 0.5 m/s | 13.37 ± 2.41 de | 2.14 ± 0.12 e | 11.43 ± 0.86 de |
| 70 °C, 1.5 m/s | 11.48 ± 2.50 f | 3.99 ± 1.29 a | 10.95 ± 2.06 e |
| 70 °C, 1.0 m/s | 11.29 ± 4.92 g | 3.07 ± 0.86 bc | 8.54 ± 2.84 f |
| 70 °C, 0.5 m/s | 14.29 ± 1.83 d | 1.62 ± 0.19 i | 12.02 ± 1.19 d |
| 50 °C, VAD | 14.90 ± 2.97 d | 1.81 ± 0.33 h | 9.77 ± 0.87 e |
| 60 °C, VAD | 17.24 ± 1.52 b | 2.68 ± 0.60 cd | 14.98 ± 0.73 c |
| 70 °C, VAD | 15.97 ± 2.09 c | 1.75 ± 0.52 h | 11.57 ± 2.59 d |
| 50 °C, CD | 15.48 ± 4.42 cd | 2.49 ± 0.16 d | 9.78 ± 4.22 e |
| 60 °C, CD | 16.31 ± 0.66 c | 1.21 ± 0.42 j | 13.43 ± 0.86 c |
| 70 °C, CD | 18.72 ± 1.29 b | 1.38 ± 0.45 j | 15.55 ± 0.36 b |
Disclaimer/Publisher’s Note: The statements, opinions and data contained in all publications are solely those of the individual author(s) and contributor(s) and not of MDPI and/or the editor(s). MDPI and/or the editor(s) disclaim responsibility for any injury to people or property resulting from any ideas, methods, instructions or products referred to in the content. |
© 2024 by the authors. Licensee MDPI, Basel, Switzerland. This article is an open access article distributed under the terms and conditions of the Creative Commons Attribution (CC BY) license (https://creativecommons.org/licenses/by/4.0/).
Share and Cite
Grassino, A.N.; Karlović, S.; Šošo, L.; Dujmić, F.; Sabolović, M.B.; Marelja, M.; Brnčić, M. Influence of Different Drying Processes on the Chemical and Texture Profile of Cucurbita maxima Pulp. Foods 2024, 13, 520. https://doi.org/10.3390/foods13040520
Grassino AN, Karlović S, Šošo L, Dujmić F, Sabolović MB, Marelja M, Brnčić M. Influence of Different Drying Processes on the Chemical and Texture Profile of Cucurbita maxima Pulp. Foods. 2024; 13(4):520. https://doi.org/10.3390/foods13040520
Chicago/Turabian StyleGrassino, Antonela Ninčević, Sven Karlović, Lea Šošo, Filip Dujmić, Marija Badanjak Sabolović, Marko Marelja, and Mladen Brnčić. 2024. "Influence of Different Drying Processes on the Chemical and Texture Profile of Cucurbita maxima Pulp" Foods 13, no. 4: 520. https://doi.org/10.3390/foods13040520