Iron Content of Wheat and Rice in Australia: A Scoping Review

 , , and
Abstract
:1. Introduction
2. Materials and Methods
2.1. Eligibility Criteria
2.2. Information Sources and Search Strategy
2.3. Study Selection
2.4. Data Charting
2.5. Data Synthesis
3. Results
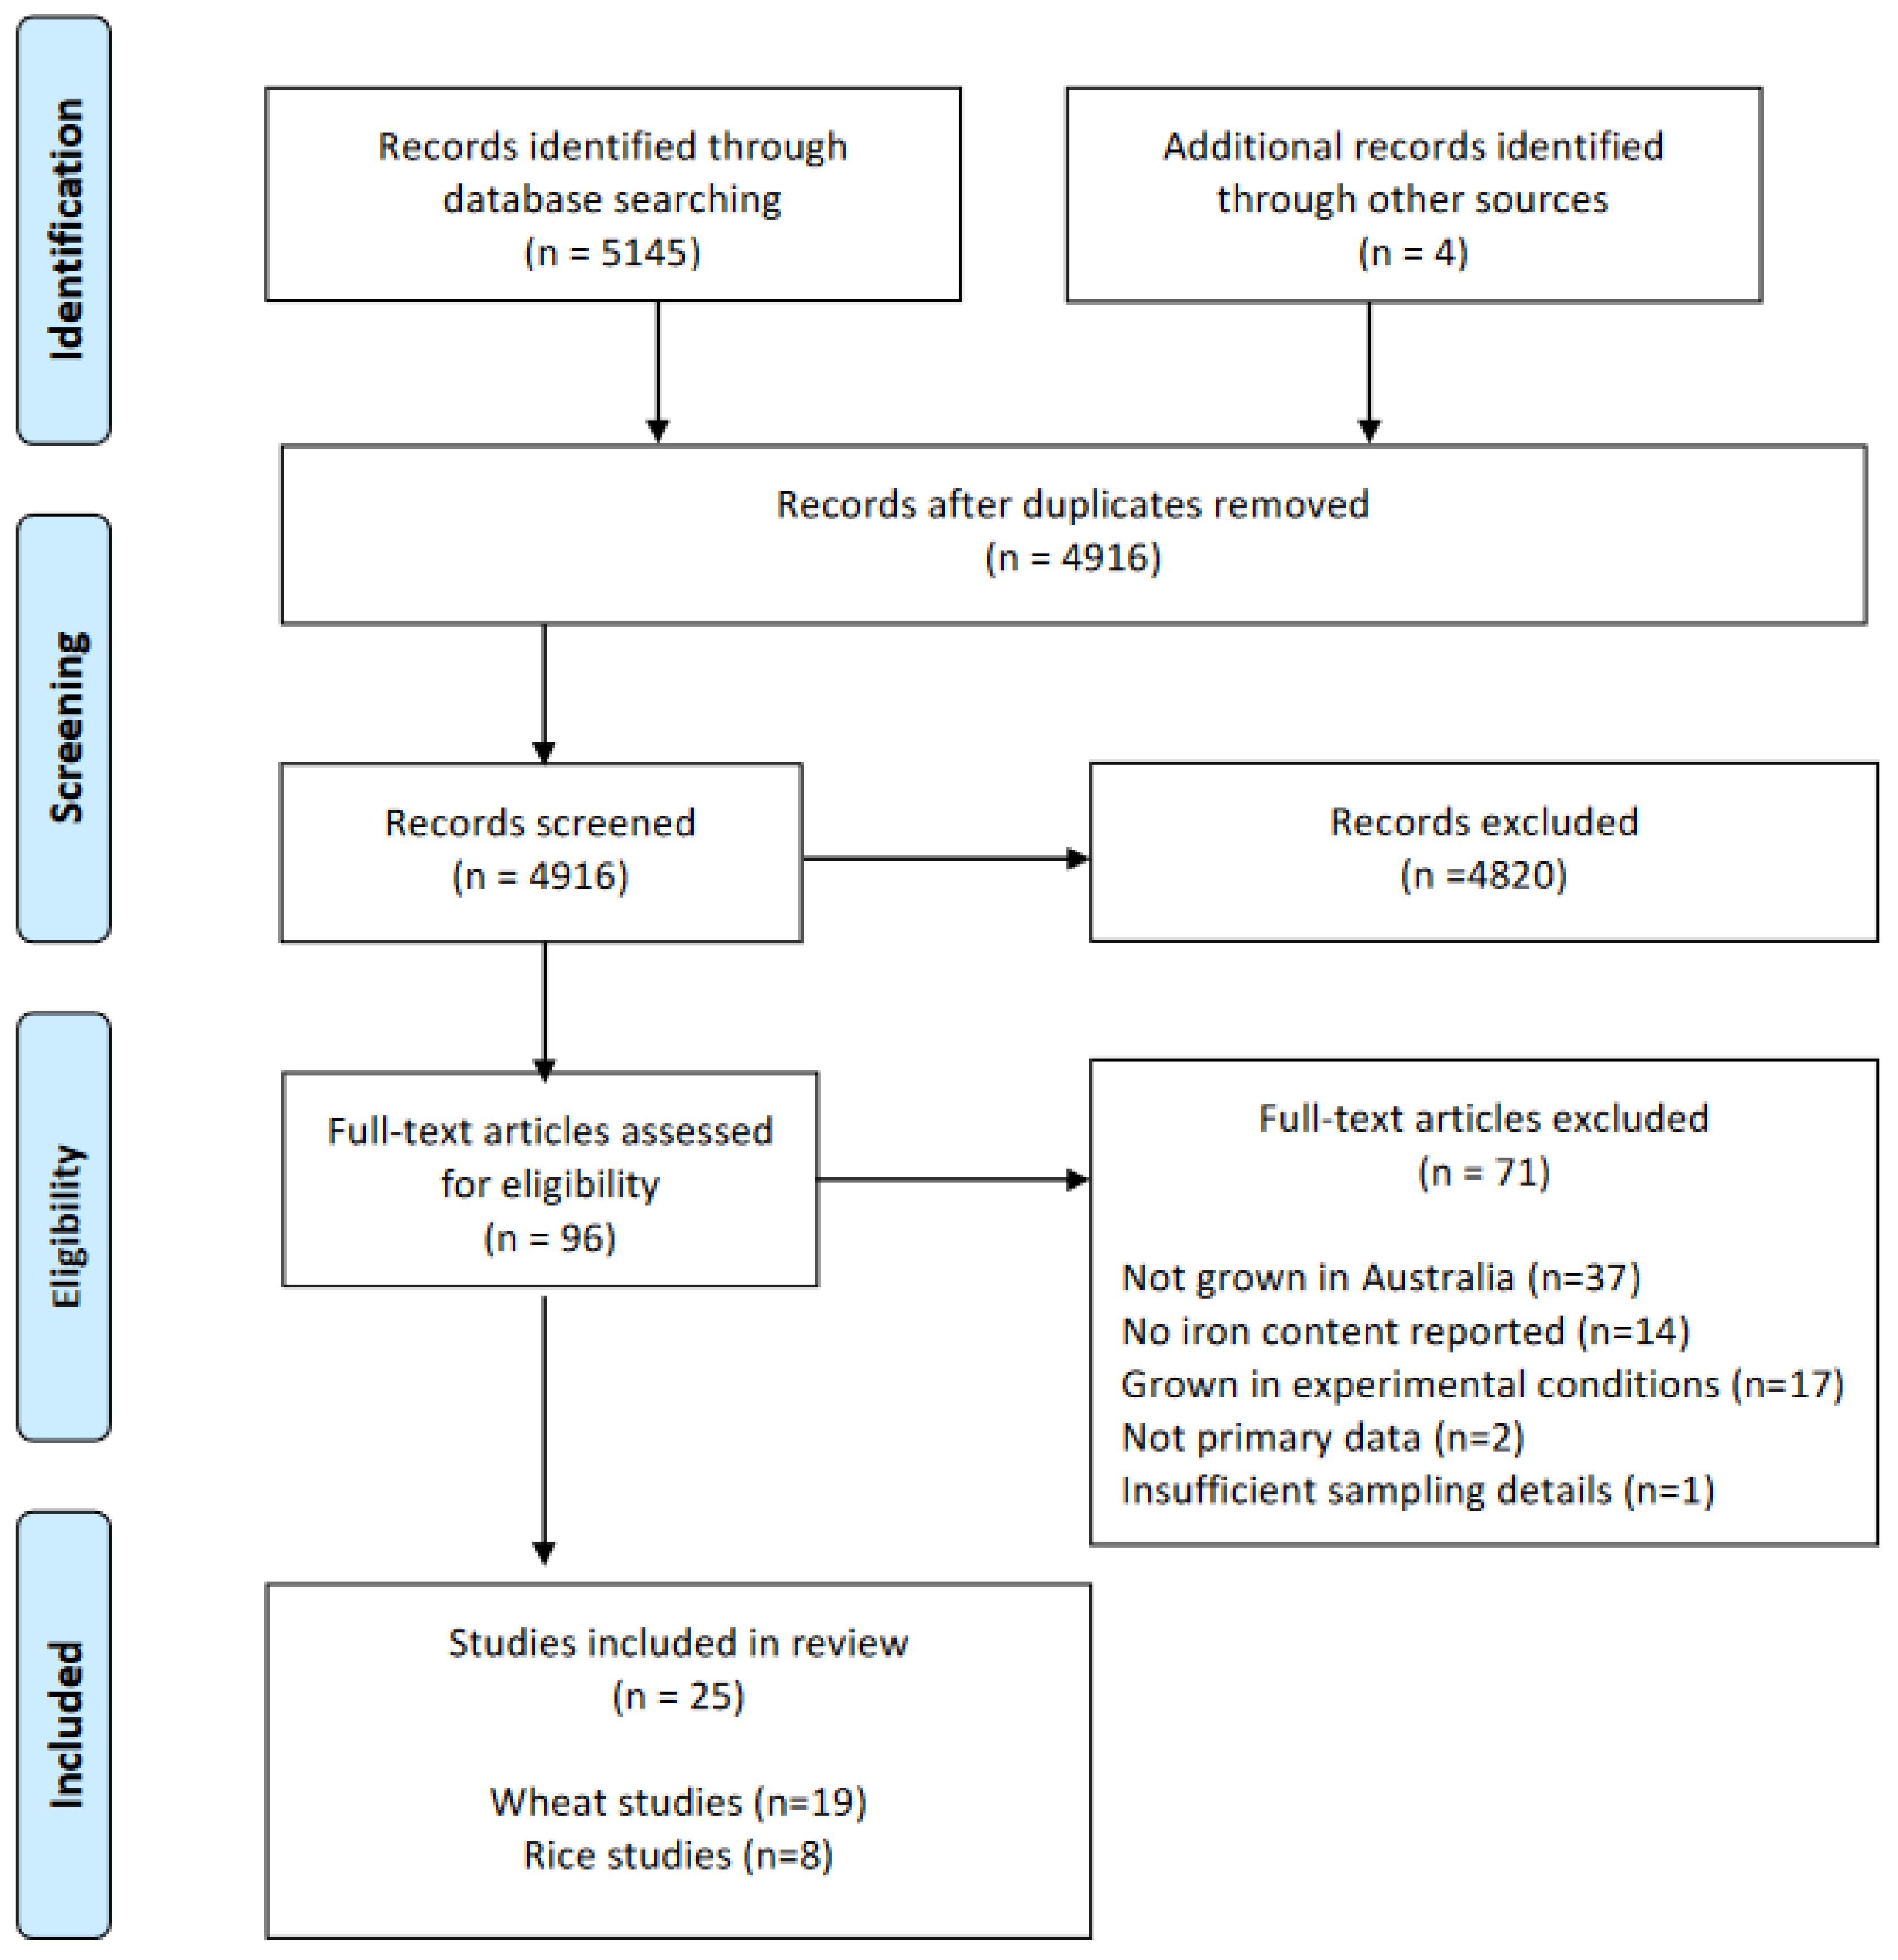
3.1. Study Selection
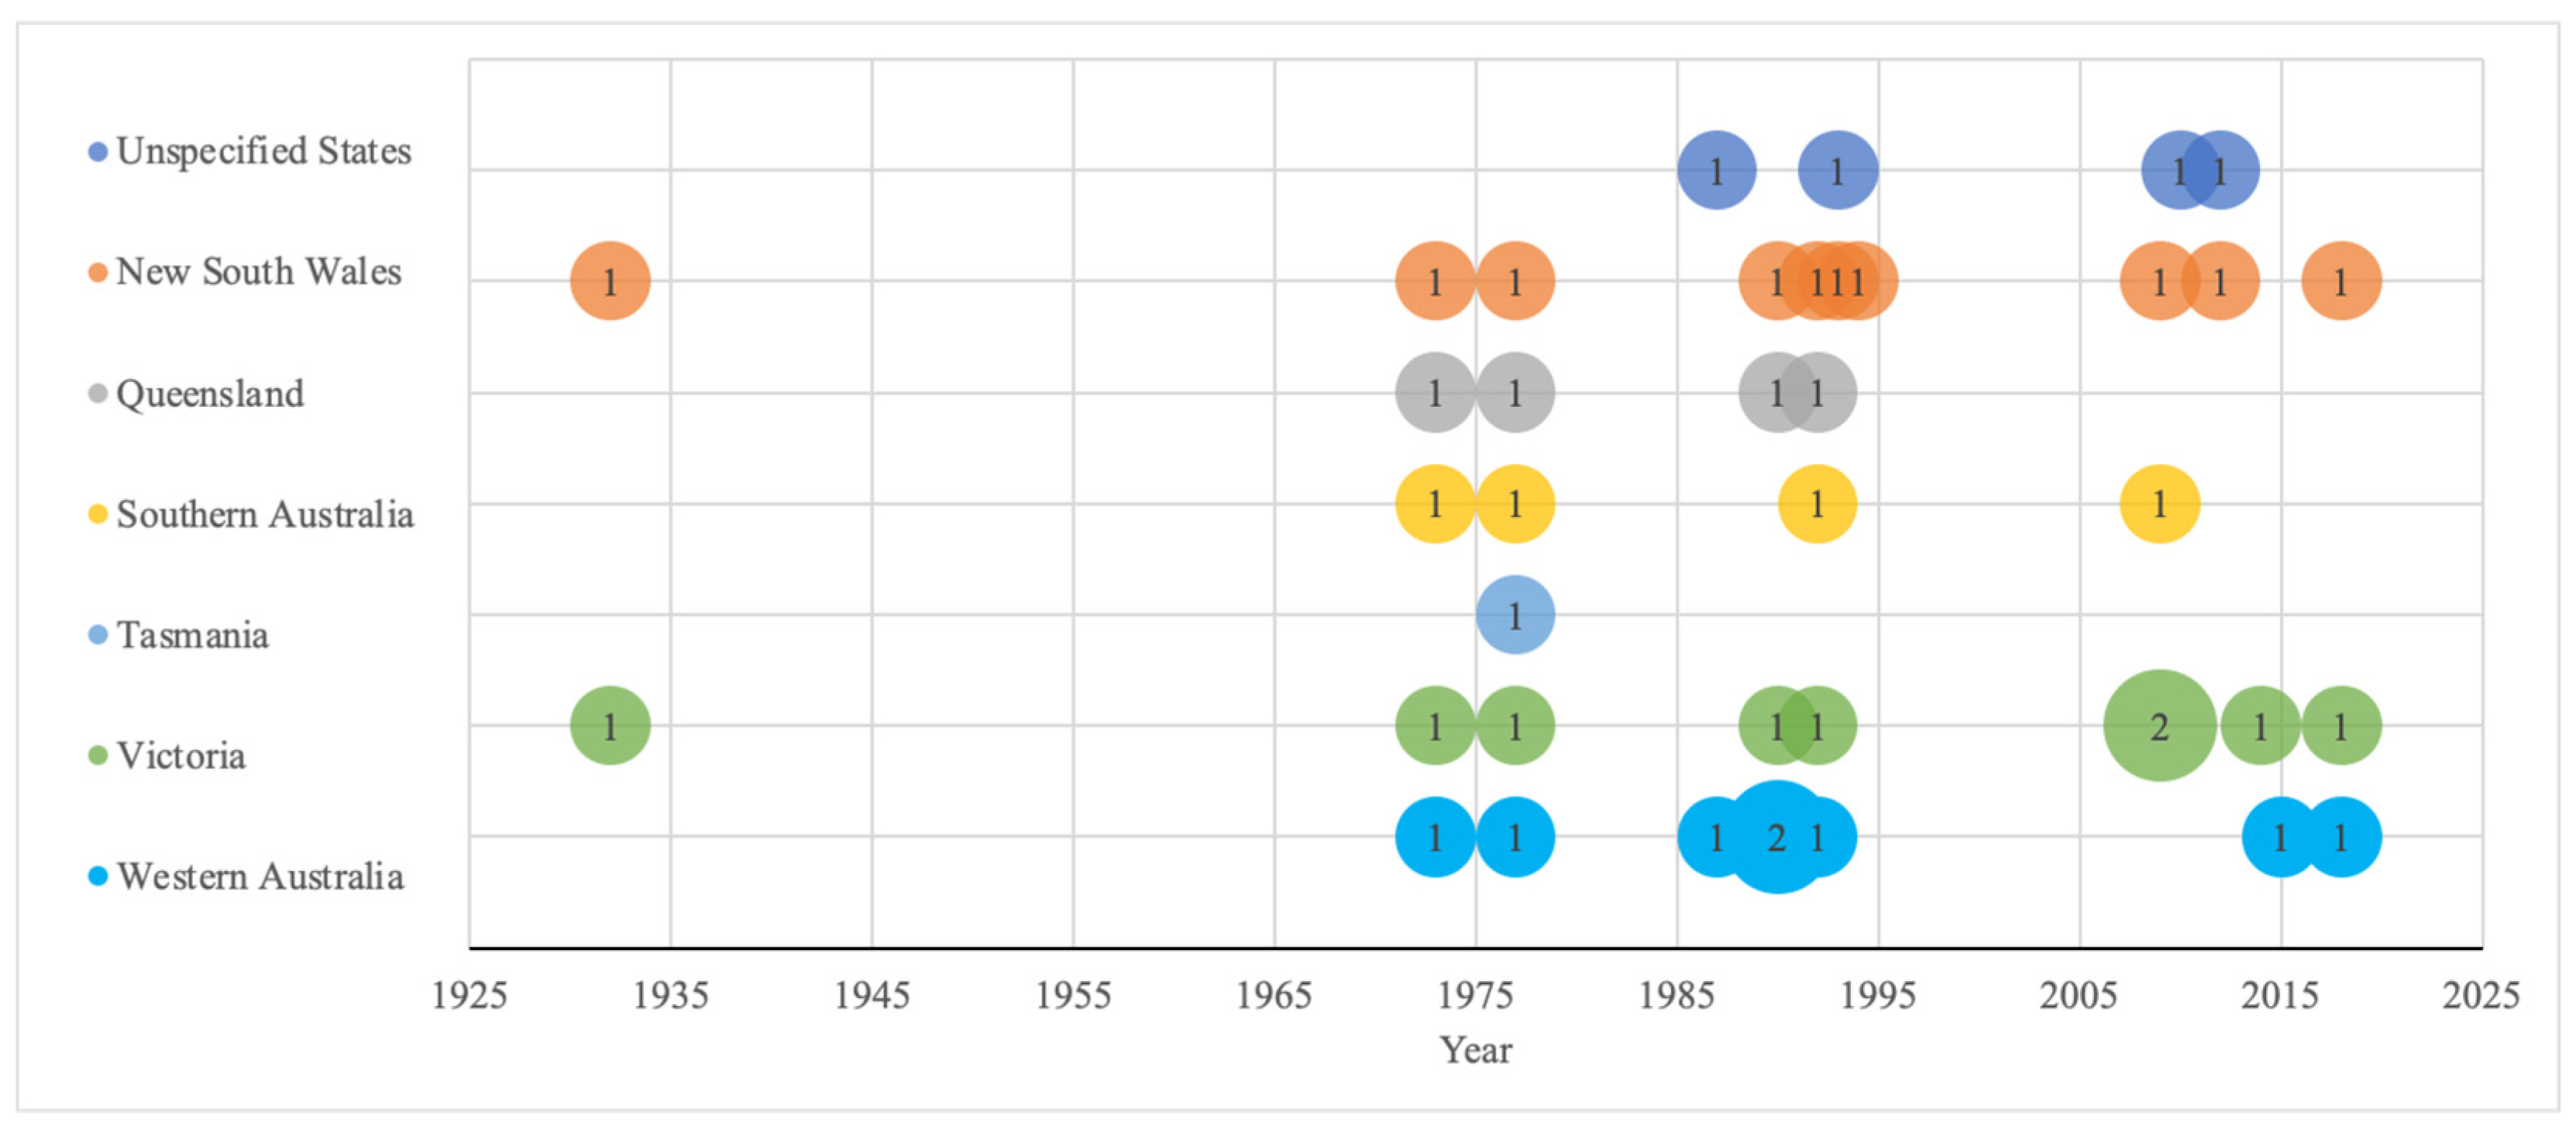
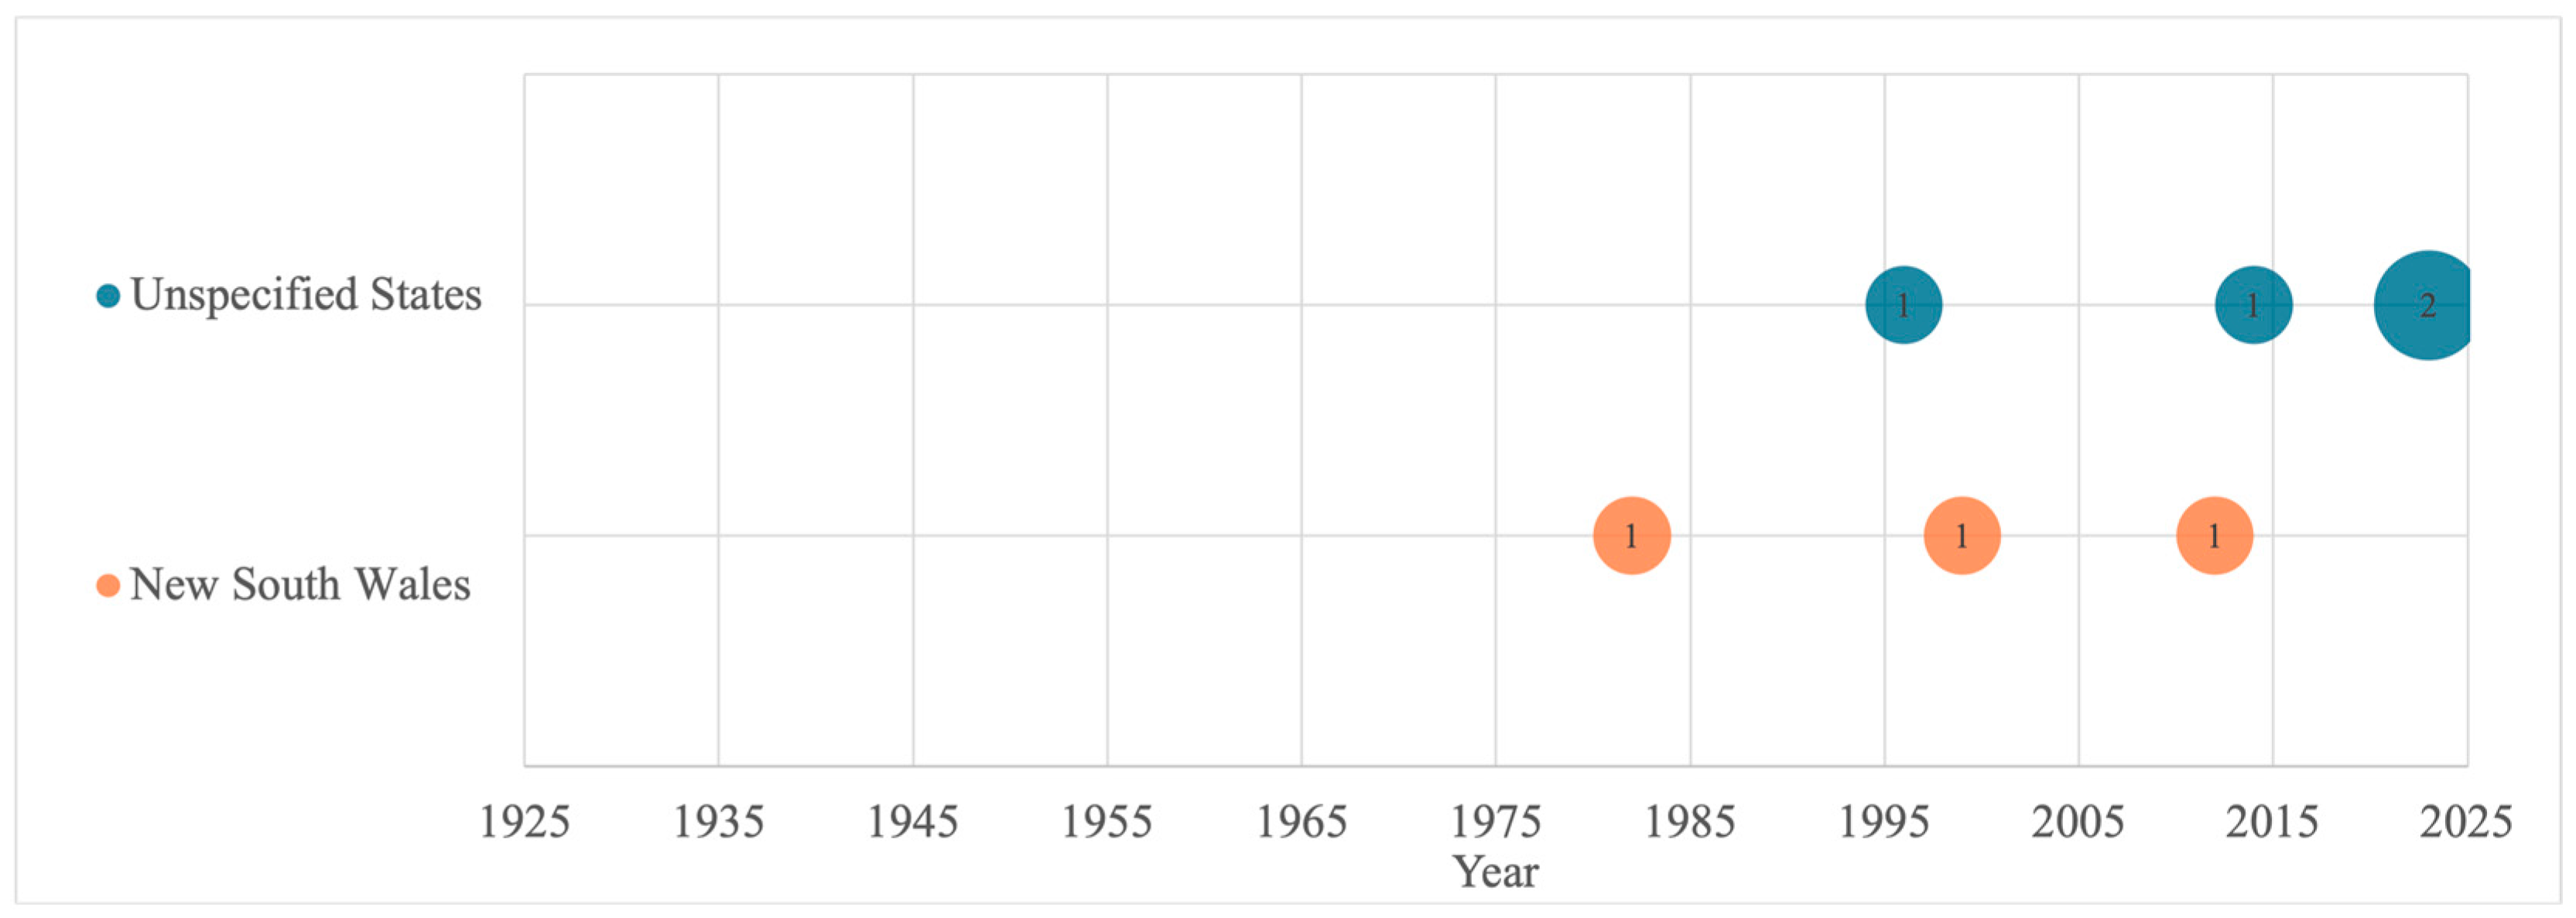
3.2. Study Characteristics
3.3. Temporal Changes in Iron Content of Wheat and Rice
4. Discussion
5. Conclusions
Supplementary Materials
Author Contributions
Funding
Institutional Review Board Statement
Informed Consent Statement
Data Availability Statement
Conflicts of Interest
References
- Hunt, J.R. Moving toward a plant-based diet: Are iron and zinc at risk? Nutr. Rev. 2002, 60, 127–134. [Google Scholar] [CrossRef] [PubMed]
- Willett, W.; Rockström, J.; Loken, B.; Springmann, M.; Lang, T.; Vermeulen, S.; Garnett, T.; Tilman, D.; DeClerck, F.; Wood, A.; et al. Food in the Anthropocene: The EAT-Lancet Commission on healthy diets from sustainable food systems. Lancet 2019, 393, 447–492. [Google Scholar] [CrossRef] [PubMed]
- World Health Organisation. Plant-Based Diets and Their Impact on Health, Sustainability and the Environment: A Review of the Evidence. WHO European Office for the Prevention and Control of Noncommunicable Diseases. Available online: https://www.who.int/europe/publications/i/item/WHO-EURO-2021-4007-43766-61591 (accessed on 18 October 2023).
- Morgan, R. The Slow But Steady Rise of Vegetarianism in Australia. Available online: https://www.roymorgan.com/findings/the-slow-but-steady-rise-of-vegetarianism-in-australia (accessed on 18 October 2023).
- Morgan, R. Rise in Vegetarianism not Halting the March of Obesity. Available online: https://www.roymorgan.com/findings/rise-in-vegetarianism-not-halting-the-march-of-obesity (accessed on 18 October 2023).
- Pawlak, R.; Berger, J.; Hines, I. Iron Status of Vegetarian Adults: A Review of Literature. Am. J. Lifestyle Med. 2018, 12, 486–498. [Google Scholar] [CrossRef] [PubMed]
- Australian Bureau of Statistics. Australian Health Survey: Nutrition First Results—Food and Nutrients, 2011–2012; Australian Bureau of Statistics: Canberra, Australia, 2014.
- National Health and Medical Research Council. Nutrient Reference Values for Australia and New Zealand. Available online: https://www.eatforhealth.gov.au/nutrient-reference-values/nutrients/iron (accessed on 18 October 2023).
- Australian Institute of Health Welfare. Nutrition across the Life Stages; AIHW: Canberra, Australia, 2018.
- Modlinska, K.; Adamczyk, D.; Maison, D.; Pisula, W. Gender Differences in Attitudes to Vegans/Vegetarians and Their Food Preferences, and Their Implications for Promoting Sustainable Dietary Patterns—A Systematic Review. Sustainability 2020, 12, 6292. [Google Scholar] [CrossRef]
- Fan, M.S.; Zhao, F.J.; Fairweather-Tait, S.J.; Poulton, P.R.; Dunham, S.J.; McGrath, S.P. Evidence of decreasing mineral density in wheat grain over the last 160 years. J. Trace Elem. Med. Biol. 2008, 22, 315–324. [Google Scholar] [CrossRef] [PubMed]
- Marles, R.J. Mineral nutrient composition of vegetables, fruits and grains: The context of reports of apparent historical declines. J. Food Compos. Anal. 2017, 56, 93–103. [Google Scholar] [CrossRef]
- Food and Agriculture Organization of the United Nations. The Future of Food and Agriculture—Trends and Challenges; Food and Agriculture Organization of the United Nations: Rome, Italy, 2017. [Google Scholar]
- Mariem, S.B.; Gámez, A.L.; Larraya, L.; Fuertes-Mendizabal, T.; Cañameras, N.; Araus, J.L.; McGrath, S.P.; Hawkesford, M.J.; Murua, C.G.; Gaudeul, M.; et al. Assessing the evolution of wheat grain traits during the last 166 years using archived samples. Sci. Rep. 2020, 10, 21828. [Google Scholar] [CrossRef]
- Eberl, E.; Li, A.S.; Zheng, Z.Y.J.; Cunningham, J.; Rangan, A. Temporal Change in Iron Content of Vegetables and Legumes in Australia: A Scoping Review. Foods 2022, 11, 56. [Google Scholar] [CrossRef]
- O’Brien, L.; Jacobs, B.J.; Dunckel, S.M.; Panozzo, J.F. A century of improvement in the quality of Australian wheat. Agric. Sci. 2020, 31, 82–91. [Google Scholar]
- Brennan, J.P. Beyond semi-dwarf wheat yield increases: Impacts on the Australian wheat industry of on-going spillovers from the International Maize and Wheat Improvement Center. Aust. J. Agric. Resour. Econ. 2007, 51, 385–401. [Google Scholar] [CrossRef]
- Peters, M.; Godfrey, C.; McInerney, P.; Munn, Z.; Tricco, A.; Khalil, H. Chapter 11: Scoping Reviews (2020 Version). Available online: https://jbi-global-wiki.refined.site/space/MANUAL/4687342/Chapter+11%3A+Scoping+reviews (accessed on 4 October 2023).
- Page, M.J.; McKenzie, J.E.; Bossuyt, P.M.; Boutron, I.; Hoffmann, T.C.; Mulrow, C.D.; Shamseer, L.; Tetzlaff, J.M.; Akl, E.A.; Brennan, S.E.; et al. The PRISMA 2020 statement: An updated guideline for reporting systematic reviews. BMJ 2021, 372, n71. [Google Scholar] [CrossRef] [PubMed]
- Dadswell, I.W. Some observations on the inorganic composition of wheat grown in eastern Australia. Aust. J. Exp. Biol. Med. Sci. 1935, 13, 33–42. [Google Scholar] [CrossRef]
- Murphy, G.M.; Law, D.P. Some mineral levels in Australian wheat. Aust. J. Exp. Agric. Anim. Husb. 1974, 14, 663–665. [Google Scholar] [CrossRef]
- Mugford, D.C.; Steele, R.J. The mineral content of Australian wheat and bakers’ flours. Food Technol. Aust. 1980, 32, 630–636. [Google Scholar]
- Zarcinas, B.A.; Cartwright, B.; Spouncer, L.R. Nitric acid digestion and multi-element analysis of plant material by inductively coupled plasma spectrometry. Commun. Soil Sci. Plant Anal. 1987, 18, 131–146. [Google Scholar] [CrossRef]
- Bolland, M.D.A.; Jarvis, R.J.; Coates, P.; Harris, D.J. Effect of phosphate fertilizers on the elemental composition of seed of wheat, lupin, nad triticale. Commun. Soil. Sci. Plant Anal. 1993, 24, 1991–2014. [Google Scholar] [CrossRef]
- Batten, G.D. Concentrations of elements in wheat grains grown in Australia, North America, and the United Kingdom. Aust. J. Exp. Agric. 1994, 34, 51–56. [Google Scholar] [CrossRef]
- Hocking, P.J. Dry matter production, mineral nutrient concentrations, and nutrient distribution and redistribution in irrigated spring wheat. J. Plant Nutr. 1994, 17, 1289–1308. [Google Scholar] [CrossRef]
- Booth, C.K.; Reilly, C.; Farmakalidis, E. Mineral Composition of Australian Ready-to-Eat Breakfast Cereals. J. Food Compos. Anal. 1996, 9, 135–147. [Google Scholar] [CrossRef]
- Morrison, E. The Contribution of Australian Wheat and Wheat Products Essential Trace Mineral Intake. Ph.D. Thesis, Queensland University of Technology, Brisbane, Australia, 1996. [Google Scholar]
- Ryan, M.H.; Derrick, J.W.; Dann, P.R. Grain mineral concentrations and yield of wheat grown under organic and conventional management. J. Sci. Food Agric. 2004, 84, 207–216. [Google Scholar] [CrossRef]
- Fernando, N.; Panozzo, J.; Tausz, M.; Norton, R.; Fitzgerald, G.; Seneweera, S. Rising atmospheric CO2 concentration affects mineral nutrient and protein concentration of wheat grain. Food Chem. 2012, 133, 1307–1311. [Google Scholar] [CrossRef]
- Norton, R.M. Wheat Grain Micronutrient Content in Southeastern Australia. Available online: http://anz.ipni.net/article/ANZ-3184 (accessed on 21 August 2023).
- Fernando, N.; Panozzo, J.; Tausz, M.; Norton, R.M.; Neumann, N.; Fitzgerald, G.J.; Seneweera, S. Elevated CO2 alters grain quality of two bread wheat cultivars grown under different environmental conditions. Agric. Ecosyst. Environ. 2014, 185, 24–33. [Google Scholar] [CrossRef]
- Ishida, E.; Nakamura, K.; Ariyama, K.; Kawasaki, A. Determining the origin of wheat using trace element concentrations and heavy element isotope ratios. Anal. Chem. 2014, 63, 255–261. [Google Scholar] [CrossRef]
- Broom, M.; Salman, H.; Georgie, A. A Comprehensive Nutrient Content Database of Grains And Legumes Produced in Australia. Available online: https://grdc.com.au/resources-and-publications/grdc-update-papers/tab-content/grdc-update-papers/2014/05/a-comprehensive-nutrient-content-database-of-grains (accessed on 21 August 2023).
- Rose, T.J.; Raymond, C.A.; Bloomfield, C.; King, G.J. Perturbation of nutrient source-sink relationships by post-anthesis stresses results in differential accumulation of nutrients in wheat grain. J. Plant Nutr. Soil. Sci. 2015, 178, 89–98. [Google Scholar] [CrossRef]
- Jin, J.; Armstrong, R.; Tang, C.X. Impact of elevated CO2 on grain nutrient concentration varies with crops and soils—A long-term FACE study. Sci. Total Environ. 2019, 651, 2641–2647. [Google Scholar] [CrossRef]
- Beasley, J.T.; Bonneau, J.P.; Sanchez-Palacios, J.T.; Moreno-Moyano, L.T.; Callahan, D.L.; Tako, E.; Glahn, R.P.; Lombi, E.; Johnson, A.A.T. Metabolic engineering of bread wheat improves grain iron concentration and bioavailability. Plant Biotechnol. J. 2019, 17, 1514–1526. [Google Scholar] [CrossRef]
- Joukhadar, R.; Thistlethwaite, R.; Trethowan, R.M.; Hayden, M.J.; Stangoulis, J.; Cu, S.; Daetwyler, H.D. Genomic selection can accelerate the biofortification of spring wheat. Theor. Appl. Genet. 2021, 134, 3339–3350. [Google Scholar] [CrossRef]
- Wills, R.B.H.; Palipane, K.B.; Greenfield, H. Composition of Australian foods. 13. Rice. Food Technol. Aust. 1982, 34, 66–68. [Google Scholar]
- Marr, K.M.; Batten, G.D.; Blakeney, A.B. Relationships between minerals in Australian brown rice. J. Sci. Food Agric. 1995, 68, 285–291. [Google Scholar] [CrossRef]
- Marr, K.M.; Batten, G.D.; Lewin, L.G. The effect of nitrogen fertiliser on yield, nitrogen and mineral elements in Australian brown rice. Aust. J. Exp. Agric. 1999, 39, 873–880. [Google Scholar] [CrossRef]
- Wurm, P.A.S.; Campbell, L.C.; Batten, G.D.; Bellairs, S.M. Australian Native Rice: A New Sustainable Wild Food Enterprise. Available online: https://agrifutures.com.au/product/australian-native-rice-a-sustainable-wild-food-enterprise/#:~:text=Wild%20rice%20was%20an%20important,tourism%20or%20native%20food%20industries (accessed on 21 August 2023).
- Rahman, M.M.; Rinklebe, J.; Naidu, R. Arsenic speciation as well as toxic and nutrient elements in pantavat (overnight steeped rice). Environ. Pollut. 2023, 331, 121901. [Google Scholar] [CrossRef] [PubMed]
- Birch, J.; Benkendorff, K.; Liu, L.; Luke, H. The nutritional composition of Australian native grains used by First Nations people and their re-emergence for human health and sustainable food systems. Front. Sustain. Food Syst. 2023, 7, 1237862. [Google Scholar] [CrossRef]
- NUTTAB91-92; Nutrient Data Table for Use in Australia. National Food Authority: Canberra, Australia, 1991.
- Food Standards Australia New Zealand. Australian Food Composition Database—Release 2; FSANZ: Canberra, Australia, 2022.
- Dyke, G.; George, B.; Johnston, A.; Poulton, P.; Todd, A. The Broadbalk wheat experiment 1968–1978: Yields and plant nutrients in crops grown continuously and in rotation. Rothamsted Exp. Stn. Rep. 1983, 5–44. [Google Scholar] [CrossRef]
- Garvin, D.F.; Welch, R.M.; Finley, J.W. Historical shifts in the seed mineral micronutrient concentration of US hard red winter wheat germplasm. J. Sci. Food Agric. 2006, 86, 2213–2220. [Google Scholar] [CrossRef]
- Murphy, K.M.; Reeves, P.G.; Jones, S.S. Relationship between yield and mineral nutrient concentrations in historical and modern spring wheat cultivars. Euphytica 2008, 163, 381–390. [Google Scholar] [CrossRef]
- Welch, R.M.; Graham, R.D. A new paradigm for world agriculture: Meeting human needs: Productive, sustainable, nutritious. Field Crops Res. 1999, 60, 1–10. [Google Scholar] [CrossRef]
- Gregorio, G.; Senadhira, D.; Htut, H.; Graham, R. Breeding for Trace Mineral Density in Rice. Food Nutr. Bull. 2000, 21, 382–386. [Google Scholar] [CrossRef]
- Davis, D.R.; Epp, M.D.; Riordan, H.D. Changes in USDA food composition data for 43 garden crops, 1950 to 1999. J. Am. Coll. Nutr. 2004, 23, 669–682. [Google Scholar] [CrossRef]
- Peterson, C.; Johnson, V.; Mattern, P. Influence of Cultivar and Environment on Mineral and Protein Concentrations of Wheat Flour, Bran, and Grain; Cereal Chem: Saint Paul, MI, USA, 1986. [Google Scholar]
- Ekholm, P.; Reinivuo, H.; Mattila, P.; Pakkala, H.; Koponen, J.; Happonen, A.; Hellström, J.; Ovaskainen, M.-L. Changes in the mineral and trace element contents of cereals, fruits and vegetables in Finland. J. Food Compos. Anal. 2007, 20, 487–495. [Google Scholar] [CrossRef]
- Grains Research and Development Corporation. Growing Regions. Available online: https://grdc.com.au/about/our-industry/growing-regions (accessed on 19 October 2023).
- Graham, R.; Welch, R. Breeding for Staple-Food Crops with High Micronutrient Density; International Food Policy Research Institute: Washington, DC, USA, 1996. [Google Scholar]
- Jordan-Meille, L.; Holland, J.E.; McGrath, S.P.; Glendining, M.J.; Thomas, C.L.; Haefele, S.M. The grain mineral composition of barley, oat and wheat on soils with pH and soil phosphorus gradients. Eur. J. Agron. 2021, 126, 126281. [Google Scholar] [CrossRef]
- Bindraban, P.S.; Dimkpa, C.; Nagarajan, L.; Roy, A.; Rabbinge, R. Revisiting fertilisers and fertilisation strategies for improved nutrient uptake by plants. Biol. Fertil. Soils 2015, 51, 897–911. [Google Scholar] [CrossRef]
- Panda, B.B.; Sharma, S.; Mohapatra, P.K.; Das, A. Application of Excess Nitrogen, Phosphorus, and Potassium Fertilizers Leads to Lowering of Grain Iron Content in High-Yielding Tropical Rice. Commun. Soil. Sci. Plant Anal. 2012, 43, 2590–2602. [Google Scholar] [CrossRef]
- Loladze, I. Rising atmospheric CO2 and human nutrition: Toward globally imbalanced plant stoichiometry? Trends Ecol. Evol. 2002, 17, 457–461. [Google Scholar] [CrossRef]
- Mariem, S.B.; Soba, D.; Zhou, B.; Loladze, I.; Morales, F.; Aranjuelo, I. Climate change, crop yields, and grain quality of c3 cereals: A meta-analysis of [CO2], temperature, and drought effects. Plants 2021, 10, 1052. [Google Scholar] [CrossRef] [PubMed]
- Semba, R.D.; Askari, S.; Gibson, S.; Bloem, M.W.; Kraemer, K. The Potential Impact of Climate Change on the Micronutrient-Rich Food Supply. Adv. Nutr. 2022, 13, 80–100. [Google Scholar] [CrossRef]
- Jajda, H.M.; Patel, K.G.; Patel, S.R.; Solanki, V.H.; Patel, K.N.; Singh, S. Comparative efficacy of two standard methods for determination of iron and zinc in fruits, pulses and cereals. J. Food Sci. Technol. 2015, 52, 1096–1102. [Google Scholar] [CrossRef]
- Nielsen, S.S. Food Analysis, 5th ed.; Springer: Cham, Switzerland, 2017. [Google Scholar] [CrossRef]
- Ahmed, F.; Coyne, T.; Dobson, A.; McClintock, C. Iron status among Australian adults: Findings of a population based study in Queensland, Australia. Asia Pac. J. Clin. Nutr. 2008, 17, 40–47. [Google Scholar]
- Dary, O.; Hurrell, R. Guidelines on Food Fortification with Micronutrients; World Health Organization; Food and Agricultural Organization of the United Nations: Geneva, Switzerland, 2006. [Google Scholar]
- Food Standards Australia New Zealand. Vitamins and Minerals Added to Food. Available online: https://www.foodstandards.gov.au/consumer/food-fortification/vitamin-added (accessed on 25 October 2023).
- Matres, J.M.; Arcillas, E.; Cueto-Reaño, M.F.; Sallan-Gonzales, R.; Trijatmiko, K.R.; Slamet-Loedin, I. Biofortification of Rice Grains for Increased Iron Content. In Rice Improvement: Physiological, Molecular Breeding and Genetic Perspectives; Ali, J., Wani, S.H., Eds.; Springer International Publishing: Cham, Switzerland, 2021; pp. 471–486. [Google Scholar] [CrossRef]


| Reference | Variety/Cultivar | Sampling Details (Year, Location, and Samples Collected) | Analysis Method | Iron Content µg/g a |
|---|---|---|---|---|
| Dadswell, 1935 [20] | Triticum aestivum cv. Free Gallipoli, Nizam, Nabawa, Major, Minister, Federation, Ranee, Comeback | Collected 1930–1931, VIC and NSW n = 25 | Thiocyanate colorimetry | 47.8 (SD = 8.8, R = 32.0–62.0) |
| Murphy and Law, 1974 [21] | Triticum aestivum | Collected 1971–1973, NSW, QLD, VIC, SA and WA QLD samples representative of wheat delivered to major depots in Southern QLD Samples from other states representative of total wheat production in each state n = 2–78 per state, total 88 | AAS | 48.6 (SD = 5.4, R = 43.2–54.5) |
| Mugford and Steele, 1980 [22] | Triticum aestivum | Collected 1977, NSW, VIC, WA, SA, QLD, TAS Representative samples of wheat from 62 Australian flour mills, n = 3–24 per state, total 62 | AAS | 41.8 (R = 34.8–50.9) |
| Zarcinas et al., 1987 [23] | Triticum aestivum L. | Collected 1987 (publication year), AUS Field sample, n = 1 | ICPS | 60.0 |
| Bolland et al., 1993 [24] | Triticum aestivum cv. Gutha, Jacup, Eradu | Collected 1987, WA (three locations) Field experiment controls Samples grown in three replicate plots Rainfall during growing season: 203–490 mm Annual rainfall: 330–600 mm | ICP-AES | 57.0 (SD = 23.6, R = 37.0–83.0) |
| Batten, 1994 [25] | Triticum aestivum Prime Hard, Australian Hard Australian Standard White, Soft Triticum durum | Collected 1987–1990, NSW, QLD, SA, VIC and WA Composite samples representative of wheat grades in various port zones, n = 1–20 samples per cultivar, total 47 | ICP-AES | T aestivum: 37.4 (SD = 2.0, R = 34.7–39.2) T durum: 47.3 |
| Hocking, 1994 [26] | Triticum aestivum L. cv. Egret | Collected prior to 1994 (publication year), NSW Field experiment controls, samples grown in four representative plots | XRF | 26.0 |
| Booth et al. 1996 [27] | Triticum aestivum Soft | Collected 1993 Representative samples randomly collected from different batches and geographical locations in Australia, n = 4 | ICP-AES | 35.4 (SEM = 0.7, R = 30.0–40.0) |
| Morrison, 1996 [28] | Triticum aestivum cv. Australian Prime Hard, Australian Hard, Australian Standard White, Australian Soft, General Purpose | Collected 1990–1993, QLD, NSW, SA, VIC and WA Composite receival site samples, n = 1–33 per cultivar, year and location, total 233 | ICP-AES | 30.2 (SD = 6.8, R = 16.7–52.2) |
| Ryan et al., 2004 [29] | Triticum aestivum cv. Vulcan, Janz, Dollarbird | Collected 1991–1993, NSW (two locations) Field experiment controls, samples grown in 2–15 plots Ardlethan mean rainfall: 490 mm (1991—373 mm; 1992—784 mm; 1993—601 mm) Yenda mean rainfall: 420 mm (1993—554 mm) | XRF | 23.8 (SD = 1.4, R = 19.0–33.0) |
| Fernando et al., 2012 [30] | Triticum aestivum L. cv. Yitpi | Collected 2008–2009, VIC Field experiment controls, samples grown in four replicates of two plots Growing season 2008: average 19 °C, 127 mm rain Growing season 2009: average 20.3 °C, 213 mm rain | ICP-AES | 33.8 (SD = 8.8, R = 27.5–40.0) |
| Norton, 2013 [31] | Triticum aestivum L. cv. Yitpi Triticum aestivum L. cv. Gladius | Collected 2008–2009, NSW, VIC and SA Samples collected at random from 70 national variety trial sites across 12 regions, n = 12 | ICP–OES | 36.8 (SD = 6.9) |
| Fernando et al., 2014 [32] | Triticum aestivum L. cv. Yitpi Triticum aestivum L. cv. Janz | Collected 2007, 2008 and 2009, VIC Field experiment controls, samples grown in four replicate plots Growing season: Mediterranean climate with several 40 °C days post anthesis, 250–300 mm rain | ICP-AES | 39.5 |
| Ishida et al., 2014 [33] | Triticum aestivum Australian Standard White, Prime Hard | Collected 2009–2010, AUS Cross sectional analysis, n = 88 | ICP-MS | 39.1 (SD = 7.0) |
| Broom et al., 2014 [34] | Triticum aestivum Australian Prime Hard | Collected 2012, AUS Single sample from one region in Australia, n = 1 | ICP-AES or ICP–MS | 42.0 |
| Rose et al., 2015 [35] | Triticum aestivum L. Wyalcatchem | Collected 2012, NSW Field experiment controls, three replicate plots | ICP-OES | 63.1 |
| Jin et al., 2019 [36] | Triticum aestivum L. Yitpi | Collected 2010, VIC Field experiment controls, Samples grown in three different soil types, four replicate plots | ICP-OES | 76.3 (SD = 9.4, R = 66.4–85) |
| Beasley et al., 2019 [37] | Triticum aestivum L. | Collected 2015, WA Field experiment controls, wild type | ICP-MS | 40.0 |
| Joukhadar et al., 2021 [38] | Triticum aestivum | Collected 2017 and 2018, NSW, VIC and WA Field experiment controls, Samples grown in three trials of two replicate plots | ICP-MS | 38.7 (SD = 1.4, R = 37.1–39.1) |
| Reference | Variety/Cultivar | Sampling Details (Year, Location, and Samples Collected) | Analysis Method | Iron Content µg/g a |
|---|---|---|---|---|
| Wills et al., 1982 [39] | Oryza sativa L. | Collected 1982 (publication year), NSW 4 × 500 g retail packets combined to form a composite sample of each brand, n = 2 | AAS | 12.0 (SD = 1.4, R = 11.0–13.0) |
| Marr et al., 1995 [40] | Oryza sativa L. Amaroo | Collected 1991–1992, NSW Samples obtained from individual farmer deliveries, n = 90 | ICP-AES | 13.0 (R = 5.0–67.0) |
| Booth et al., 1996 [27] | Oryza sativa L. | Collected 1993 Representative samples randomly collected from different batches and geographical locations in Australia, n = 7 | ICP-AES | 12.3 (SEM = 0.1, R = 11.5–13.0) |
| Marr et al., 1999 [41] | Oryza sativa L. Amaroo, Langi, YRL38, Pelde, Kyema | Collected 1993–1994, NSW Field experiment controls n = 9 (1993), n = 8 (1994) | ICP-OES | 24.9 (SD = 2.1, R = 22.0–25.0) |
| Wurm et al., 2012 [42] | Oryza sativa L. | Collected 2008, NSW Pooled commercial rice samples supplied by SunRice Pty Ltd., Leeton, Australia NSW | ICP-AES | 11.0 |
| Broom et al., 2014 [34] | Oryza sativa L. | Collected 2012, Sample consisting of intact grains from northern and southern regions in Australia, n = 1 | ICP-AES or ICP–MS | 8.0 |
| Rahman, 2023 [43] | Oryza sativa L. | Collected 2023 (publication year) Rice obtained from local Australian market, n = 1 | ICP-MS | 11.5 |
| Birch et al., 2023 [44] | Oryza sativa L. | Collected 2020 Samples purchased at a major food retailer in Australia, n = 3 | ICP-MS | 26.0 (SEM = 0.2) |
Disclaimer/Publisher’s Note: The statements, opinions and data contained in all publications are solely those of the individual author(s) and contributor(s) and not of MDPI and/or the editor(s). MDPI and/or the editor(s) disclaim responsibility for any injury to people or property resulting from any ideas, methods, instructions or products referred to in the content. |
© 2024 by the authors. Licensee MDPI, Basel, Switzerland. This article is an open access article distributed under the terms and conditions of the Creative Commons Attribution (CC BY) license (https://creativecommons.org/licenses/by/4.0/).
Share and Cite
Cheung, Y.L.; Zheng, B.; Rehman, Y.; Zheng, Z.Y.J.; Rangan, A. Iron Content of Wheat and Rice in Australia: A Scoping Review. Foods 2024, 13, 547. https://doi.org/10.3390/foods13040547
Cheung YL, Zheng B, Rehman Y, Zheng ZYJ, Rangan A. Iron Content of Wheat and Rice in Australia: A Scoping Review. Foods. 2024; 13(4):547. https://doi.org/10.3390/foods13040547
Chicago/Turabian StyleCheung, Yee Lui, Belinda Zheng, Yumna Rehman, Zi Yin Joanne Zheng, and Anna Rangan. 2024. "Iron Content of Wheat and Rice in Australia: A Scoping Review" Foods 13, no. 4: 547. https://doi.org/10.3390/foods13040547
APA StyleCheung, Y. L., Zheng, B., Rehman, Y., Zheng, Z. Y. J., & Rangan, A. (2024). Iron Content of Wheat and Rice in Australia: A Scoping Review. Foods, 13(4), 547. https://doi.org/10.3390/foods13040547