Article

Comparative Analysis of Characteristic Volatile Compounds in Five Types of Infant Nutrition Powders by HS-GC-IMS and GC-MS

1
Shenzhen Institute of Standards and Technology, Shenzhen 518033, China
2
Shenzhen Key Laboratory of Food Nutrition and Health, College of Chemistry and Environmental Engineering, Institute for Innovative Development of Food Industry, Shenzhen University, Shenzhen 518060, China
*
Author to whom correspondence should be addressed.
Foods 2024, 13(5), 648; https://doi.org/10.3390/foods13050648
Submission received: 12 January 2024 / Revised: 12 February 2024 / Accepted: 13 February 2024 / Published: 21 February 2024
(This article belongs to the Section Dairy)

Abstract

:
This study employed the headspace-gas chromatography-ion migration spectrum (HS-GC-IMS) in conjunction with the gas chromatography-mass spectrometer (GC-MS) technique for the assessment of the flavor quality of complementary food powder intended for infants and young children. A total of 62 volatile compounds were identified, including aldehydes, esters, alcohols, ketones, pyrazines, and furans, among which aldehydes were the most abundant compounds. Based on the principal component analysis (PCA) and partial least squares discriminant analysis (PLS-DA) models, infant nutritional powder (YYB) from different manufacturers could be clearly distinguished. Among them, 2-hydroxybenzaldehyde, 1, 2-dimethoxyethane, 2-isobutyl-3-methoxypyrazine, and methyl butyrate were the four most critical differential volatiles. In addition, these differences were also manifested in changes in fatty acids. The reason for this phenomenon can be attributed to the difference in the proportion of raw materials used in nutrition powder, micronutrient content, and the packaging process. In conclusion, this study provides comprehensive information on the flavor quality of YYB, which can be used as a basis for quality control of YYB.

1. Introduction

Malnutrition in early childhood in China is a moderate public health problem [1]. After 6 months of age, the nutritional elements obtained from breast milk can no longer meet the healthy development needs of infants and young children, so semi-solid and solid foods need to be added in a timely and scientific manner, and gradually converted into domestic foods [2]. In China, the availability and affordability of nutrient-rich complementary foods are limited in many lower-income areas, mainly poor and less-educated rural areas, leading to widespread early stunting in infants and young children [3,4]. Since 2012, with the financial support of the central government, the National Health Commission and the All-China Women’s Federation have launched a nutrition improvement project for children in poor areas. Infant nutrition powder can be used for nutritional intervention in children in underprivileged areas to lower the risk of infant malnutrition, according to China’s National Nutrition Plan 2017–2030. Infant Supplemental Nutrition Pack (YYB), is a supplement containing a variety of micronutrients (vitamins, minerals, etc.) added to ready-to-eat complementary foods for infants and toddlers (6–36 months), and can also be used as a dietary supplement for children (37–60 months) for their growth needs [5].
As awareness of children’s nutrition increases and the demand for infant nutritional supplements grows, related technologies, policies, and regulations are gradually maturing. This has led to the emergence of various brands and formulations of products. Complementary food nutrition packaging products are one of the products implemented under the policy, and have been widely used in poor rural areas and areas affected by natural disasters for nutrition improvement in 6–24-month-old infants. At present, there are a variety of infant complementary food nutrition products on the market, due to the difference in nutritional composition, trace elements, and processing technology, the quality of YYB is also different, resulting in consumer liking being inconsistent [6]. As a complementary food for infants and young children, the product is suitable for the preferences of infants and young children, which is a prerequisite to ensure that the nutrients are effectively supplemented. In the practical application of nutrition packages, it is not uncommon for children and parents to refuse to eat because of “odor” and other reasons, which is very unfavorable to the effective implementation of nutrition packages and the implementation of nutrition improvement for children in poor areas, but measures can be taken to effectively improve the problem [7].
The flavor of nutrition packages is a key factor in determining whether consumers buy and eat them. Volatile compounds, including aldehydes, ketones, and alcohols, which can originate from the primary and secondary oxidation products of unsaturated fatty acids, are integral in forming off-flavors that ultimately affect the shelf life and storage resilience of food products [8]. Therefore, it is very important to clarify the composition of volatile flavor substances in infant complementary food nutrition powder and the flavor differences among different nutrition packages. With the development of volatile compound detection technology, gas chromatography-ion mobility spectrometry (GC-IMS), an emerging detection technology, has both GC separation characteristics and IMS high sensitivity and does not require sample pretreatment [9]. It has been increasingly applied to the research of the flavor and quality of various foods such as nutritional powders [5].
Although researchers have explored the processing technology and flavor of nutrition powder, there are few reports on the differences in the flavor of infant complementary food powder products from different manufacturers. Therefore, we randomly selected five types of YYB with relatively high market shares from the Chinese market and used GC-IMS technology combined with gas chromatography-mass spectrometer (GC-MS) technology to detect flavor compounds and fatty acids (FAs) in YYB. The volatile flavor substances in YYB manufactured by different companies were compared using multivariate statistical analysis. Meanwhile, multivariate statistical analysis was also performed to identify the characteristic volatile flavor substances of YYB products. The findings of this research could provide a significant theoretical foundation for quality control of infant complementary food nutrition powder.

2. Materials and Methods

2.1. Materials and Chemicals

According to the market share of infant nutritional powders in China, five products (denoted as numbers 1–5, respectively) with high market share were selected for analysis. The production of YYB involves selecting raw materials, implementing quality control, adding excipients, mixing, and packaging, adhering to the Chinese national food safety standard GB 22570–2014 for infant food supplements. The 5 YYB samples contained protein (>25%) and fat (~10%), complemented by a modest amount of vitamins and minerals to support infant nutrition. All YYB products were placed in the LHS-250SC constant temperature and humidity incubator (Shanghai Yiheng Scientific Instrument Co., Ltd., Shanghai, China) for 90 days of accelerated storage. The storage temperature was 37 ± 2 °C, and the relative humidity (RH) was 75%. For simplicity in notation, products are designated with a suffix “A” after the YYB number to denote the condition at day 0 of storage (e.g., YYB-1A), and a suffix “B” to represent the state following 90 days of storage (e.g., YYB-1B).

2.2. Color Measurements

Color measurements were obtained using an Ultra Scan PRO colorimeter (Hunter Lab, USA), through pouring the powder sample into a transparent, self-sealing bag and calibrating against a standard white board, as previously described by Manzi et al. [10]. The CIE L* a* b* system, which describes the change in lightness from black (0) to white (100) with L*, and the red (+a*) to green (−a*) color spectrum with a*, and the yellow (+b*) to blue (−b*) color spectrum with b*, was employed to characterize the color. ΔE and W values were calculated, respectively, as follows:
W = 100 − [(100 − L*)2 + a*2 + b*2]1/2
Δ E = ( L L ) 2 + ( a a ) 2 + ( b b ) 2
where W value was the white value; L*, a*, and b* were the measured values of the sample. ΔE was the total color difference value.

2.3. Headspace (HS)-GC-IMS Analysis

The volatile organic compounds (VOCs) of the sample were determined for different accelerated storage times (0 or 90 days) using the GC-IMS (FlavorSpec®) (GAS, Dortmund, Germany), following the method of Li et al. with some modifications [9]. Two grams of YYB were placed into a headspace glass vial and incubated at 60 °C for 20 min, followed by automatic injection of 800 μL using a heated syringe set at 85 °C. The analysis time was set to 30 min, with a chromatographic column (MXT-5) measuring 15 m in length, 0.53 mm in diameter, and 1 μm in thickness. The column temperature was maintained at 60 °C, while the IMS temperature was set to 45 °C. Nitrogen gas (N2) was used as the carrier gas. The flow rate started at 2 mL/min for the first 2 min, increased to 10 mL/min for the next 10 min, then to 100 mL/min for another 10 min, and finally reached 150 mL/min for the last 20 min to stop the flow. External references, N-ketones C4–C9 (Sinopharm Chemical Reagent Beijing Co., Ltd., Beijing, China), were utilized for calculating the retention index (RI) of VOCs. The signal intensity of compounds in LAV software (version 2.2.1) was converted into peak volume comparisons to quantify the relative variation difference of VOCs.

2.4. Analysis of Fatty Acids in YYB Samples from Different Manufacturers before and after Storage Using GC-MS

FAs in YYB samples from various manufacturers were analyzed according to the method (with minor modifications) of Walczak et al. [11]. GC (6890N, Agilent Technologies, Waldron, Germany) and MS (Agilent 5975 Inert XL MSD, Zebron ZB-WAX capillary column, 30 m long, 0.25 μm inner caliber; Phenomenex, Torrance, CA, USA) were utilized for the FAs in YYB samples GC-MS analysis. The column temperature underwent a programmed increase, starting at 60 °C for 2 min, followed by a rise to 150 °C at a rate of 13 °C/min, and finishing with an increase to 230 °C at 2 °C/min, with a hold for 6 min. Meanwhile, the splitless injector temperature was fixed at 240 °C. The mass spectrometry analyses were performed in full-scan mode, scanning across a mass range of 35 to 450 m/z. The electron energy was 70 eV, and both the ion source and line transfer were held at 200 °C. Chromatographic data were obtained using Agilent Chromatography Workstation 3 software. The identification of FAs in YYB samples was based on retention time comparison with standard and spectral analysis.

2.5. Statistical Analysis

Differences among YYB were analyzed using analysis of variance (ANOVA) and Duncan’s multiple range test with SPSS 19.0 software (SPSS Inc., Chicago, IL, USA). VOCs were searched through the Hanon 3H_IMS_2022 database (Beijing, China) and qualitatively identified by retention time reference values. All experiments were repeated three times, and the significance was evaluated at a confidence level of ±5% (p < 0.05). Principal component analysis (PCA) and partial least squares discriminant analysis (PLS-DA) were conducted using SIMCA-P software (Umetrics, version 13.0, Malmö, Sweden), MetaboAnalyst 5.0 software (http://www.metaboanalyst.ca, accessed on 10 May 2023) and networking tool (https://www.chiplot.online/#Pie-plot, accessed on 10 May 2023). GraphPad Prism (version 9.5.0; GraphPad Software, Boston, MA, USA) and PowerPoint (Microsoft Office 365; Redmond, WA, USA) were used to generate the remaining figures. All results were expressed as the mean ± standard deviation.

3. Results and Discussion

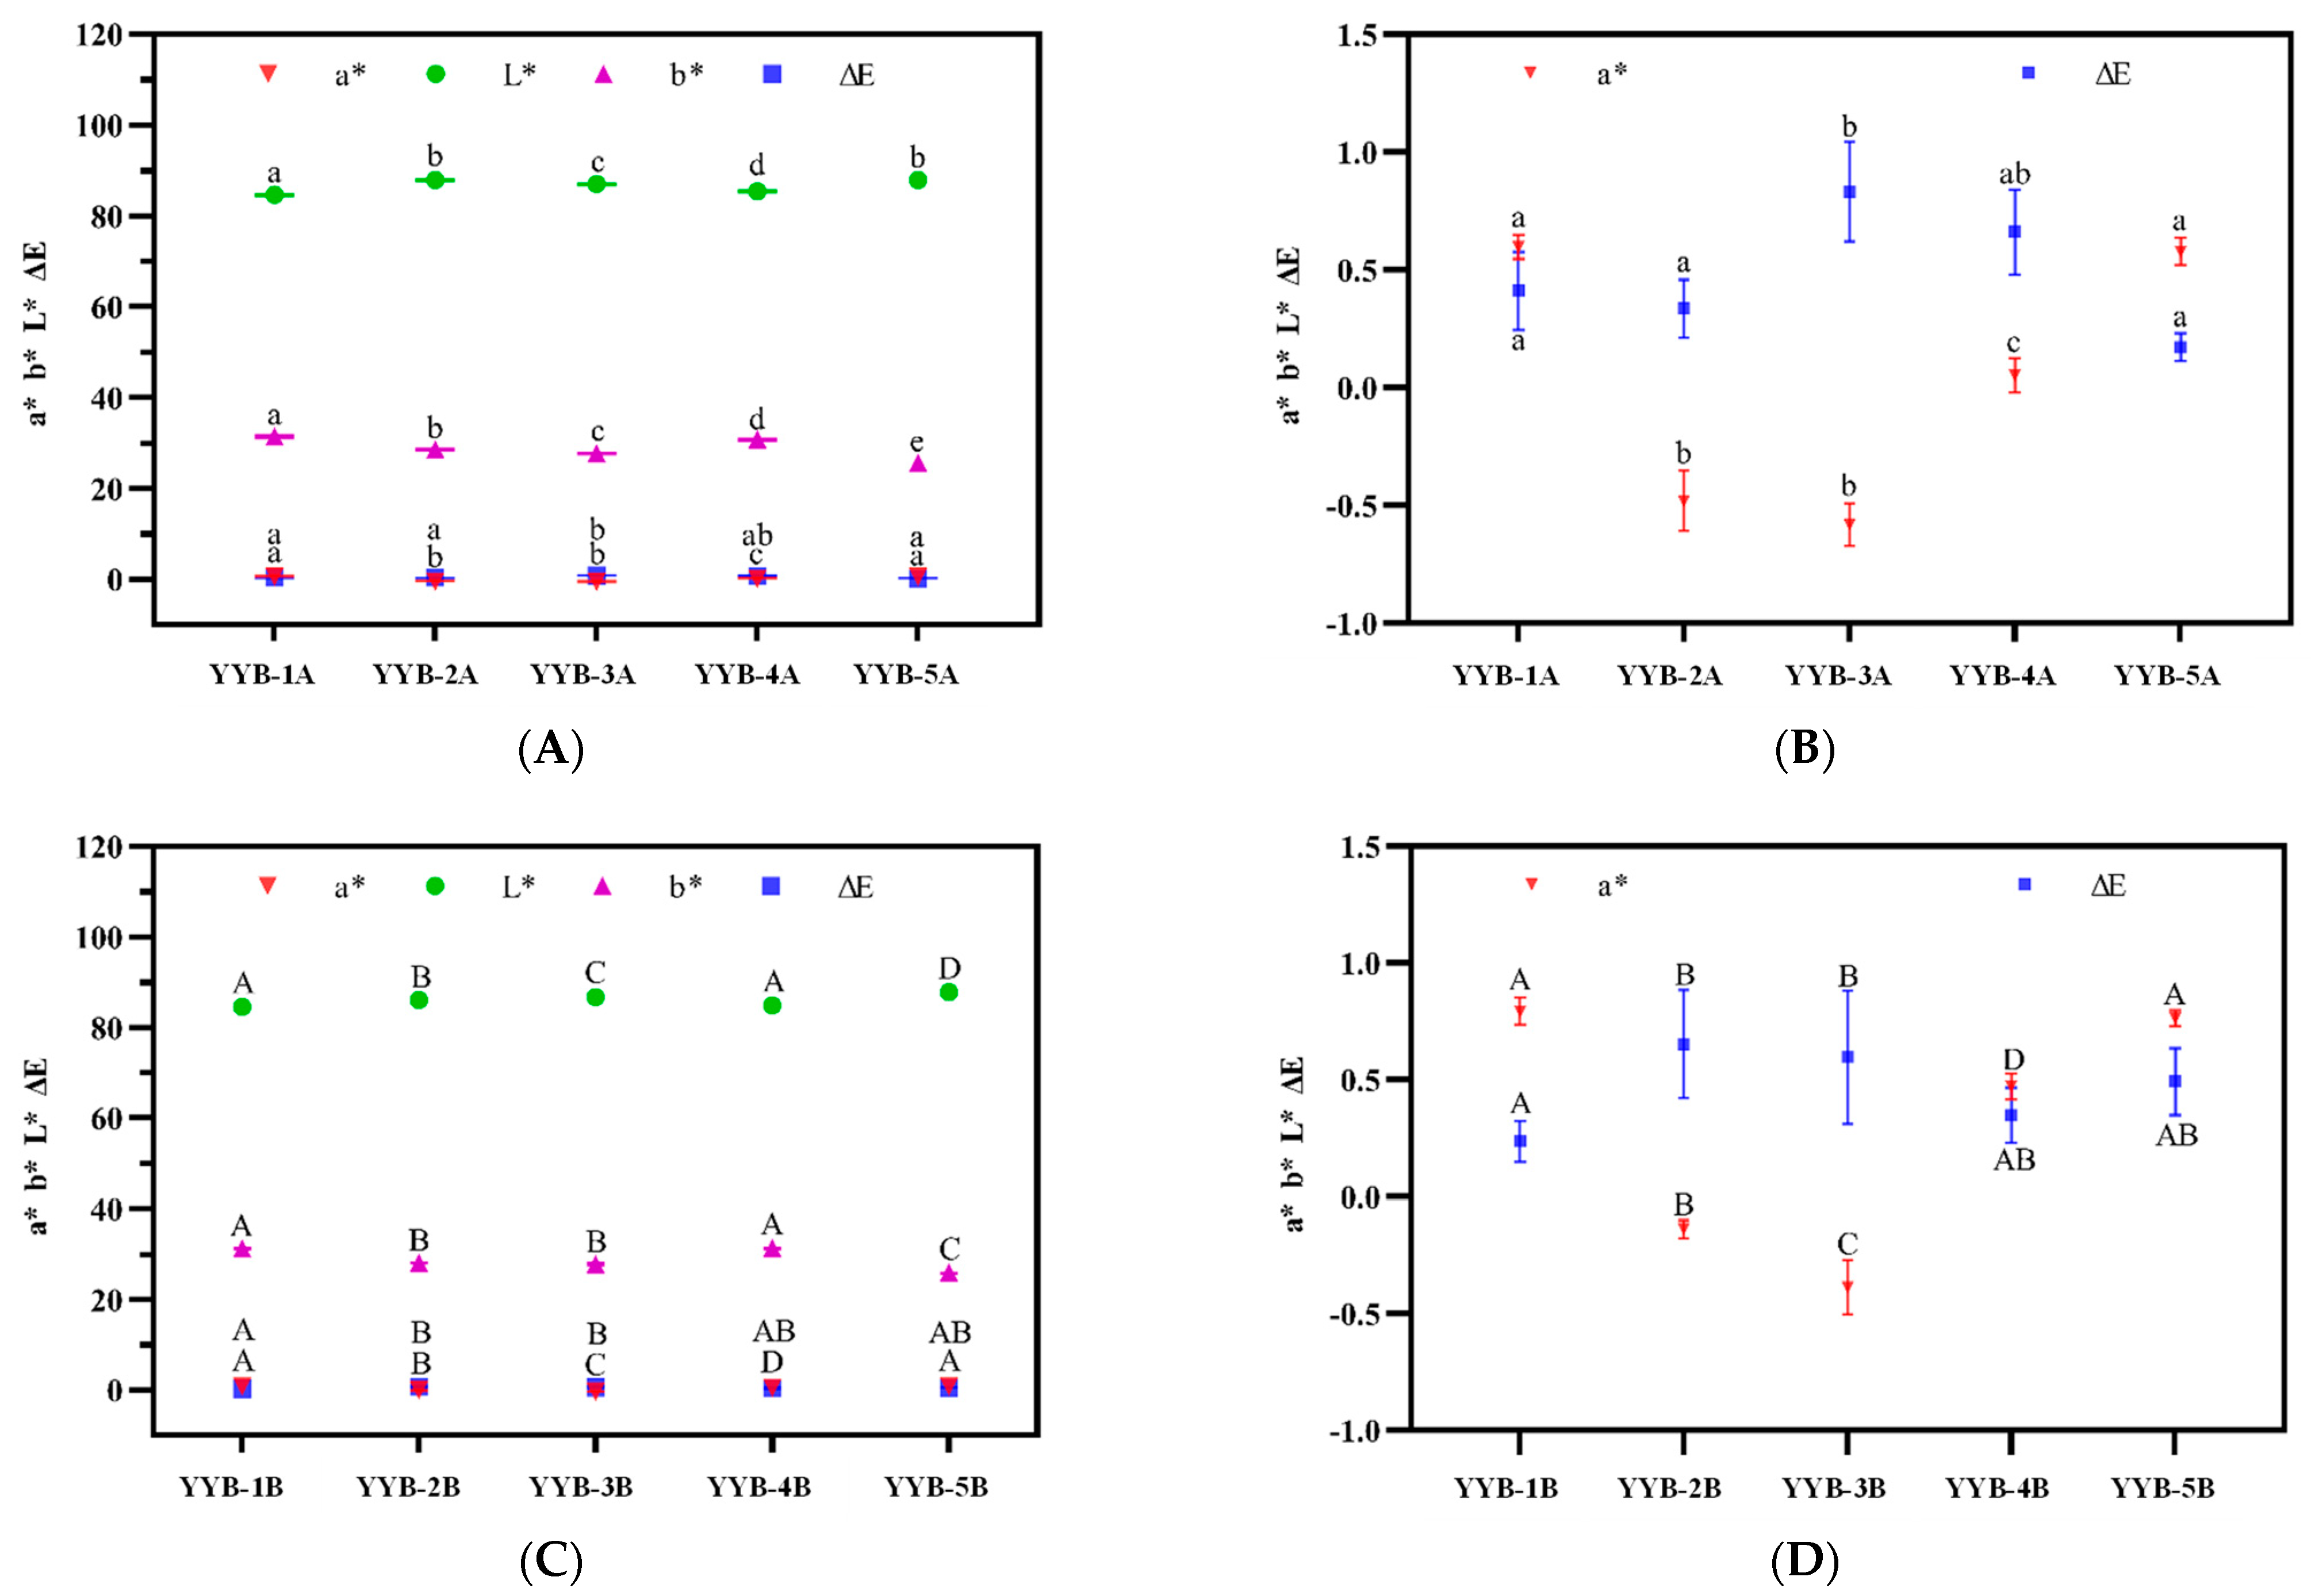
3.1. The Color Changes of Five Types of Infant Nutrition Powder after Accelerated Storage

The color is an important test index of powder product quality, which directly affects consumers’ satisfaction with the product. Measuring the L* a* b* values of YYB can be used to quantify the difference in perceived color intensity of the sample under accelerated storage time. As can be seen from Figure 1, when stored for 0 days, the values of ∆E, L*, and b* of samples from different manufacturers have no significant difference overall. After three months of storage, the value of ∆E shows an upward trend, the value of L* shows an upward trend, the value of b* shows a downward trend, and the value of a* has no obvious change. It showed that the color of nutrient powder became dark yellow after storage. Studies have shown that egg white powder has a similar color change during storage [12]. After 90 days of accelerated storage, due to the oxidation and deterioration of proteins in the sample components, the spatial configuration was destroyed and hydrophobic pores were formed, resulting in a slight increase in L* value [13]. In addition, during storage, the Maillard reaction products in YYB form brown aggregates, which change the color appearance of the sample [14,15]. The relatively high storage humidity (75% RH) fosters microbial activity in nutrient powders, enhancing the hydrolysis of proteins and starches. This generates additional amino and carbonyl groups, accelerating the Maillard reaction and increasing yellow compound content, resulting in significant alterations to the L* and b* values of the powder [16]. After 90 days of accelerated storage, the color difference of YYB-1 and YYB-5 did not change significantly, which may be due to the high nitrogen content when the product was filled, which effectively protected the stability of the color. The changes in the L* values in YYB-3 and YYB-5 may be due to the smaller particles in the nutrient powders, which have a larger specific surface area, resulting in a larger reflection factor for the powders [17]. The YYB was filled with nitrogen during the packaging process, which also plays a certain protective role in the storage process. The difference between YYB from different manufacturers was related to the amount of nitrogen filled in the packaging and the difference between the packaging materials. At the same time, if the product needs long-term storage, it should be carried out in a dry and low-temperature environment.

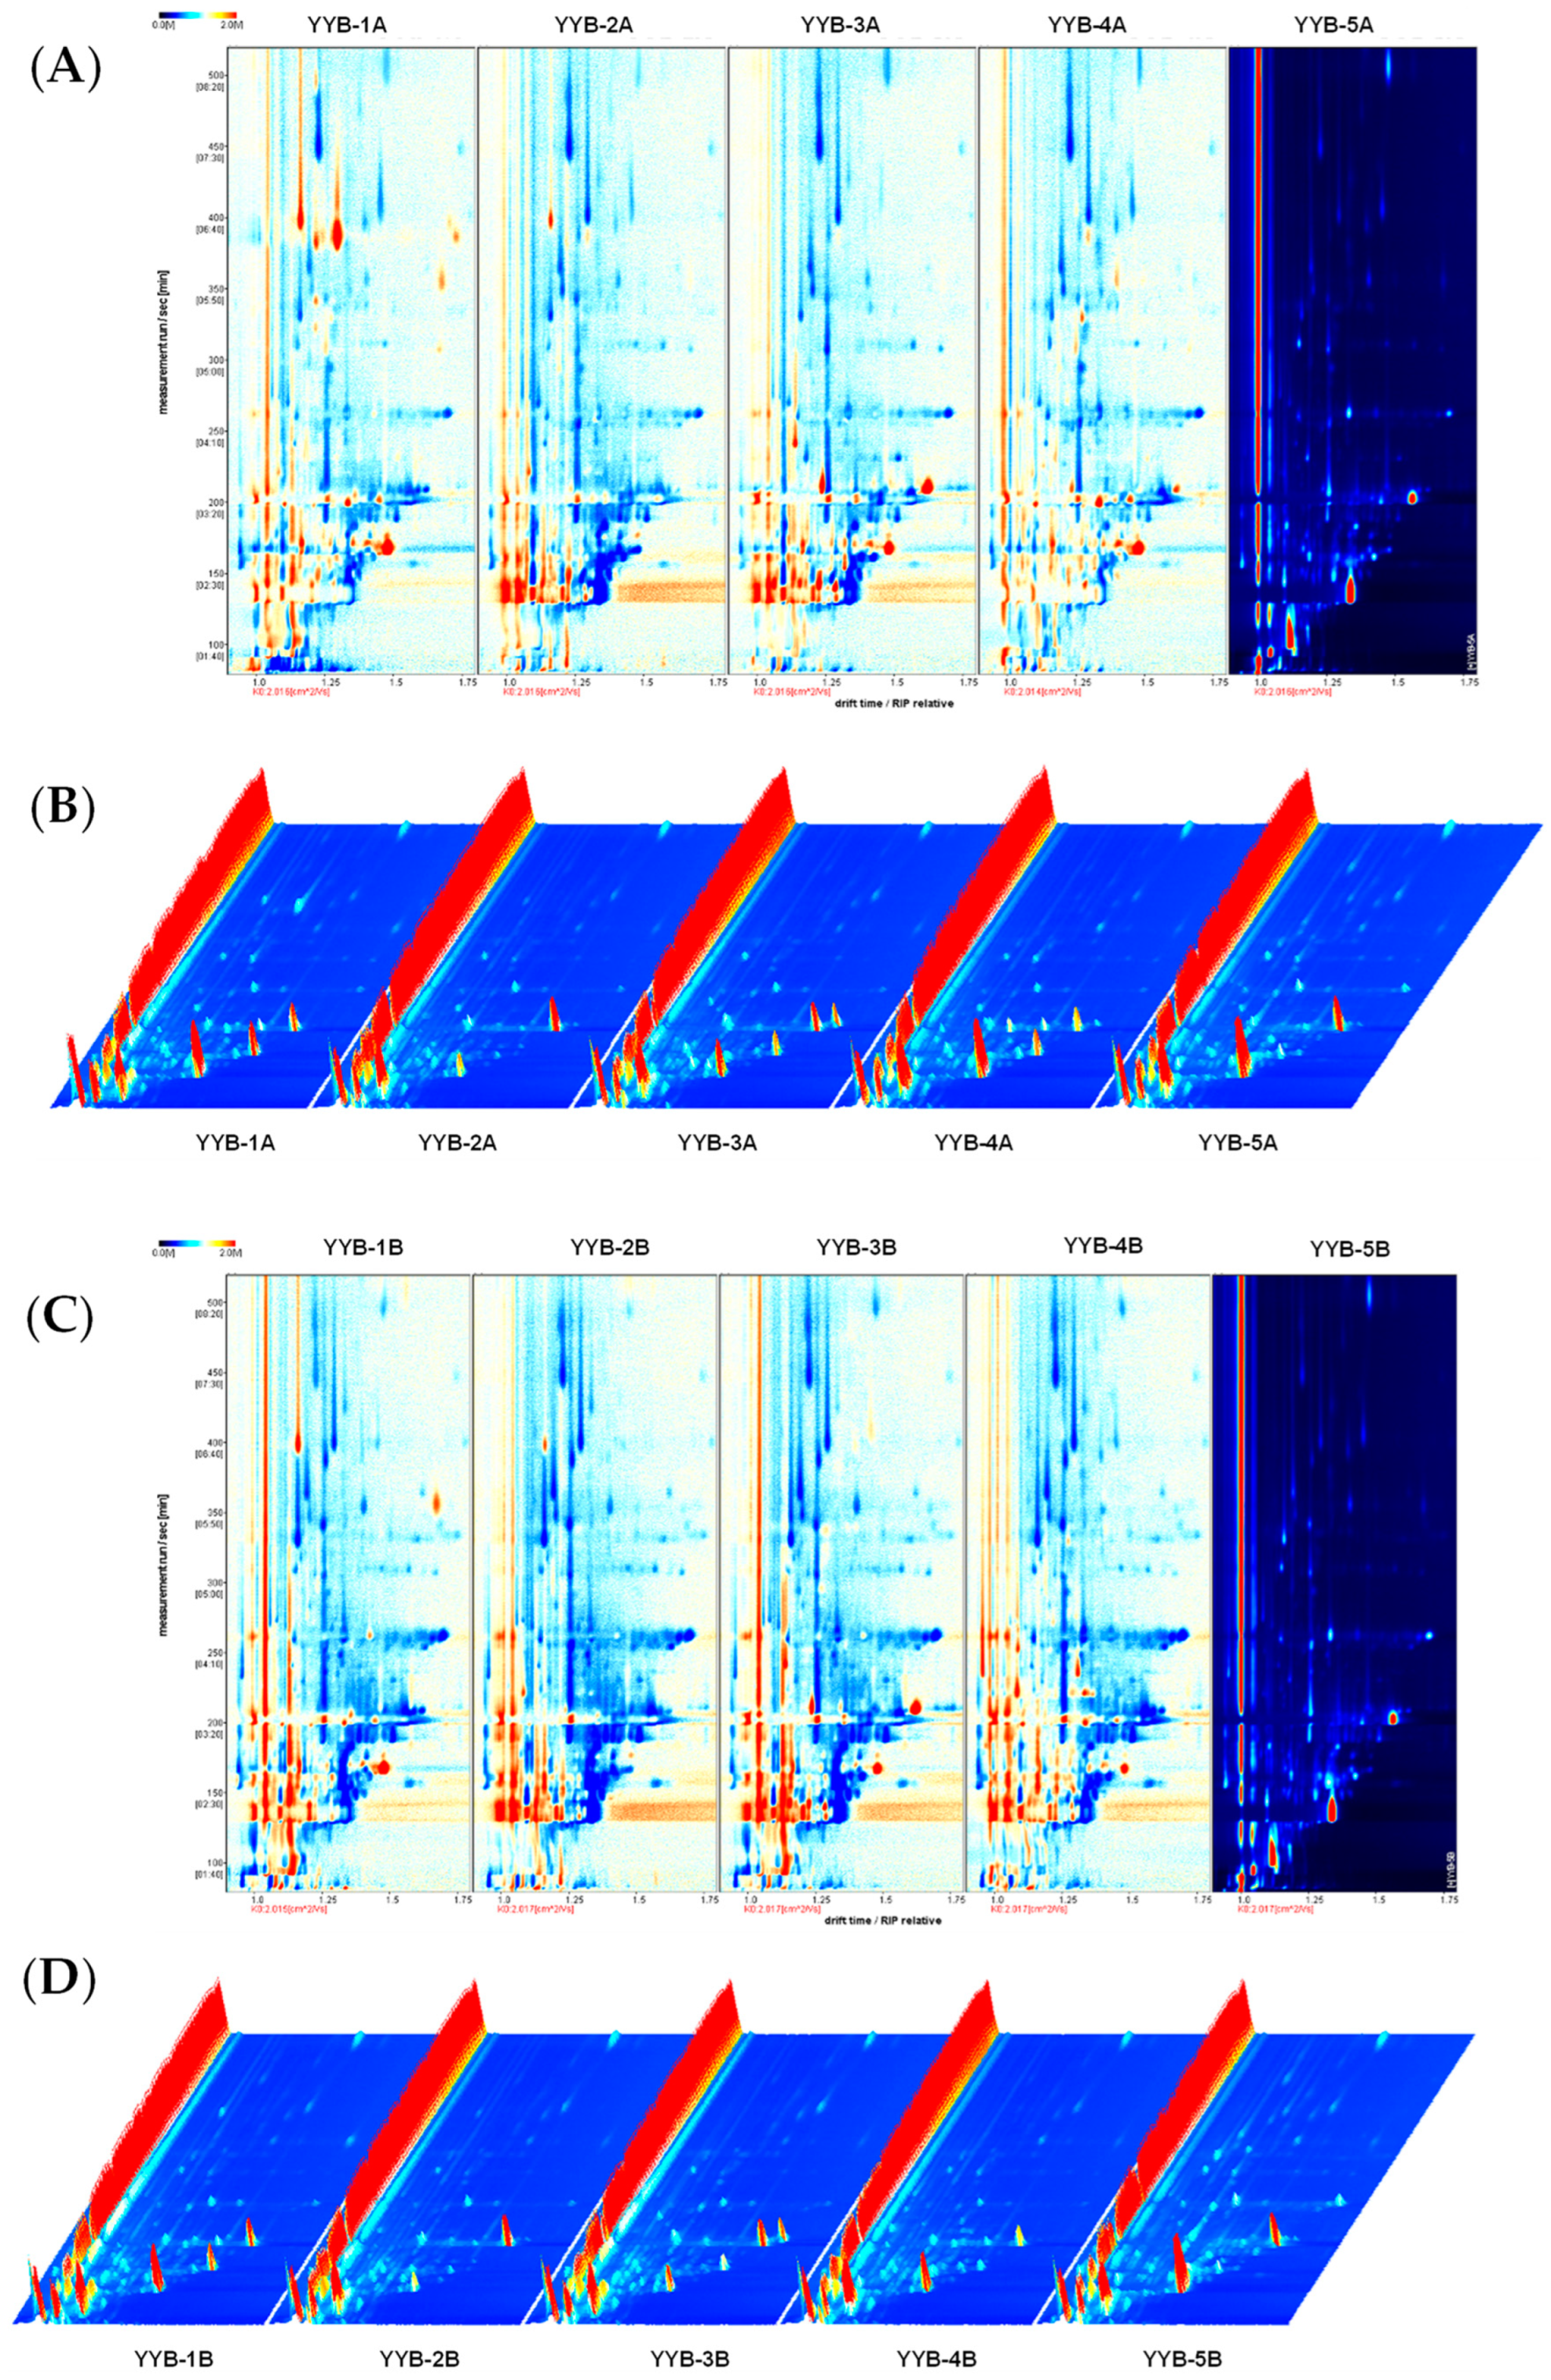
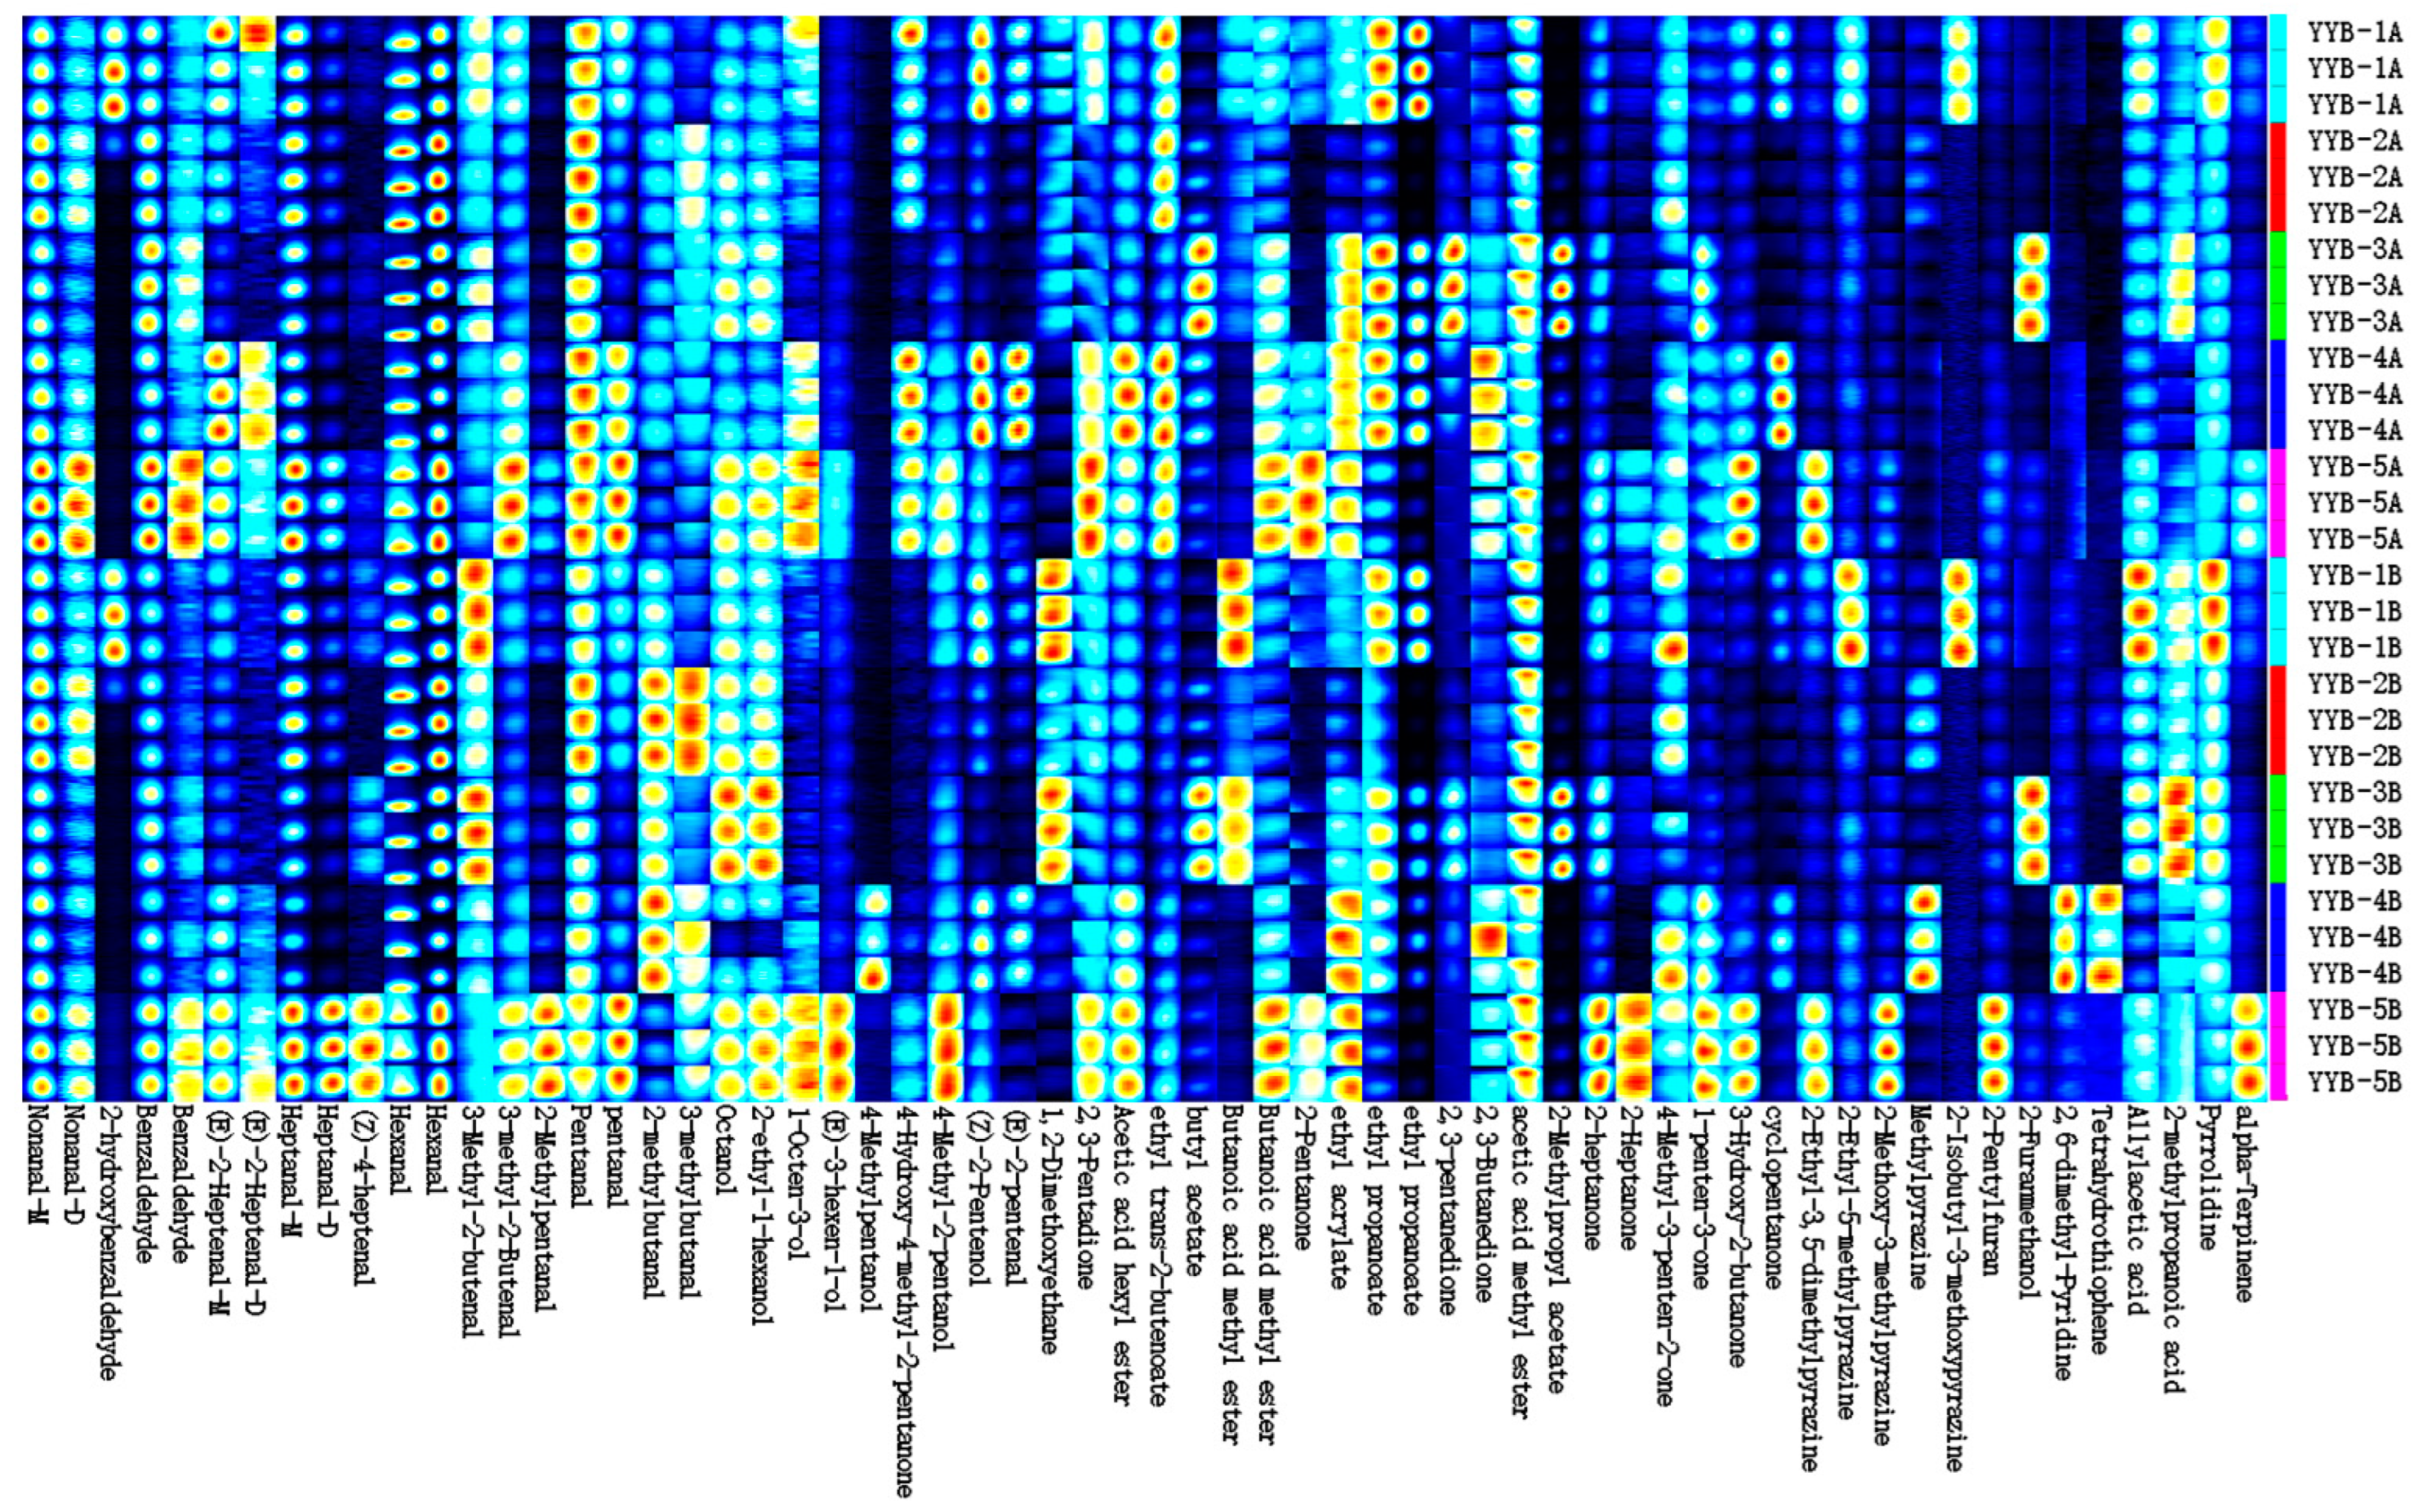
3.2. Changes in Volatile Compounds in Infant Nutrition Powder from Different Manufacturers

This study employed HS-GC-IMS to analyze VOCs in nutrition powder during accelerated storage. HS-GC-IMS generated a 3D topographic plot to display the statistical data, revealing diverse peak intensities among the VOCs in different samples. The 3D topographic plot employed the Y axis to represent the retention time of the gas chromatograph, the X axis to indicate ion migration time for identification, and the Z axis to quantify peak values. Each peak corresponds to a specific volatile compound, with color indicating its intensity. Red peaks symbolized VOCs exhibited higher signal intensities. The findings revealed the presence of various VOCs in YYB. The peak signal intensity and signal intensity of VOCs in YYB produced by different manufacturers are different. As shown in Figure 2, a total of 62 VOCs were identified in five types of infant nutrition powders including 19 aldehydes, 13 esters, 11 alcohols, 6 ketones, 5 pyrazines, 2 furans, 2 acids, and 4 other compounds (Table 1). Most of the VOCs in five types of YYB products correspond to different signal strengths, indicating that YYB of different manufacturers has its own characteristics. To better understand the VOC differences between different samples, we classified the VOC of YYB in the fingerprint (Figure 3).
A deeper red color indicated a higher concentration of the compound. White indicated less concentration of the volatile compound, whereas a volatile compound may produce more than a signal or spot (monomer, dimer or even trimer). Each row represented a sample, and every column represented a signal peak. Characteristic volatile flavor compounds and differences in samples can be clearly seen in the species fingerprint.
Aldehydes and ketones mainly come from the oxidative degradation of fats and are closely related to changes in food flavor [18]. Nonanal monomer, benzaldehyde, heptanal, hexanal, and pentanal were found to have stronger signal intensities in YYB products from different manufacturers, and these small-molecule aldehydes are one of the sources of floral and fruity aromas in YYB products [19]. The signal intensities of (E)-2-Heptenal, 3-Methyl-2-butenal, and 2-methylbutanal were higher in YYB-1, YYB-3, and YYB-5 products. Although Nonanal, heptanal, pentanal, and other aldehydes have a stronger signal intensity in YYB, the content of these compounds in the products of different manufacturers is still different, which indicates that the origin of the raw materials and the processing method may affect the compound types and content in the products [20]. During the accelerated storage process, the protein and fat in the nutritional powder undergo lipid oxidation and the Maillard reaction, which are prone to oxidation and decomposition, resulting in the release of free fatty acids. Saturated fatty acids are easily degraded into aldehydes, alcohols, ketones and other volatiles after being oxidized into unstable hydroperoxides, which are the precursors of aromatic compounds [21]. 2-methyl-butenal and 3-methyl-2-butenal were volatile aldehydes that were products of the metabolic degradation of fats or produced by the breakdown of proteins in raw materials [22]. At the same time, these flavor compounds played a crucial role in the formation of nutritional powder flavor [23]. Low concentrations of aldehydes usually have a grassy taste and sweetness, while high concentrations may produce an odor [24].
Alcohols were flavor substances formed by aldehyde reduction, amino acid metabolism, or lactose fermentation, with polyunsaturated fatty acids as precursors. The formation of alcohols is closely related to the oxidation of fats and the reduction of ketones. 4-methyl-2-pentanol, (E)-2-pentenal, 1,2-dimethoxyethane have a strong signal strength in YYB-4A. 1-Octen-3-ol, 4-hydroxy-4-methyl-2-pentanone, 1, 2-dimethoxyethane were stronger in YYB-1A and YYB-5A, while octanol and 2-ethyl-1-hexanol were stronger in YYB-3A. The threshold for saturated alcohols is relatively high, and unsaturated alcohols such as 1-octen-3-ol, (E)-3-hexen-1-ol, (Z)-2-pentenol, (E)-2-pentenal provide fresh grassy and mushroom flavors [25]. 2-ethyl-1-hexanol, (E)-2-pentenal, (Z)-2-pentenol have a nutty aroma that will add to the grassy aroma of the powder [26]. After accelerated storage, the signal strength of octanol and 2-ethyl-1-hexanol in YYB-3B and YYB-5B was significantly enhanced, and the signal strength of 1-octen-3-ol and (E)-3-hexen-1-ol was stronger in YYB-5B, which may have given the products a unique flavor that was different from other products. The difference in the ratio of saturated alcohols/unsaturated compounds in the products may be one of the reasons for this difference. Both lipid oxidation and thermal degradation of proteins produce alcohol compounds [27], which also affect the flavor of nutritional powders [28].
The most ester compounds were detected in YYB-3 and YYB-4, including butyl acetate ethyl acrylate, ethyl propanoate, ethyl propanoate and 2,3-pentanedione. Acetic acid, hexyl ester, ethyl trans-2-butenoate, ethyl acrylate, and ethyl propanoate are found primarily in YYB-1. YYB-5 was dominated by butanoic acid methyl ester, 2-pentanone and ethyl acrylate. Hexyl acetate, butyl acetate, 2-methylpropyl acetate, butanoic acid methyl ester and ethyl acrylate mainly present fruity and woody aromas, which were one of the main aromas of nutrition powder. Ethyl acrylate is an important odorant with a strong signal strength and low threshold in YYB-1, 3 and 4. After accelerated storage, the signal intensity of butanoic acid methyl ester in YYB-1 and YYB-3 noticeably strengthens, likely as a result of the elevated content of alcohols and carboxylic acids. Moreover, the signal intensity of most ester compounds in different products is weakened to different degrees, showing a decrease in aromatic substances.
The signal intensity of heterocyclic compounds in the samples increased noticeably post-storage as compared to pre-storage. The heterocyclic nitrogen-containing compounds, including 2-methoxy-3-methylpyrazine, 2-isobutyl 3-methoxypyrazine, and 2-ethyl-5-methylpyrazine, were derived from nonenzymatic protein–sugar interactions [29]. The formation of 2-ethyl-3,5-dimethylpyrazine in dairy products is attributed to the Maillard reaction [30]. The augmentation in the production of nitrogen-containing compounds arising from the catabolic metabolism of proteins and free amino acids in nutritional powders indicates that nutritional powder products are not suitable for storage in high-temperature conditions, which puts forward requirements for storage of commercially available products [31].

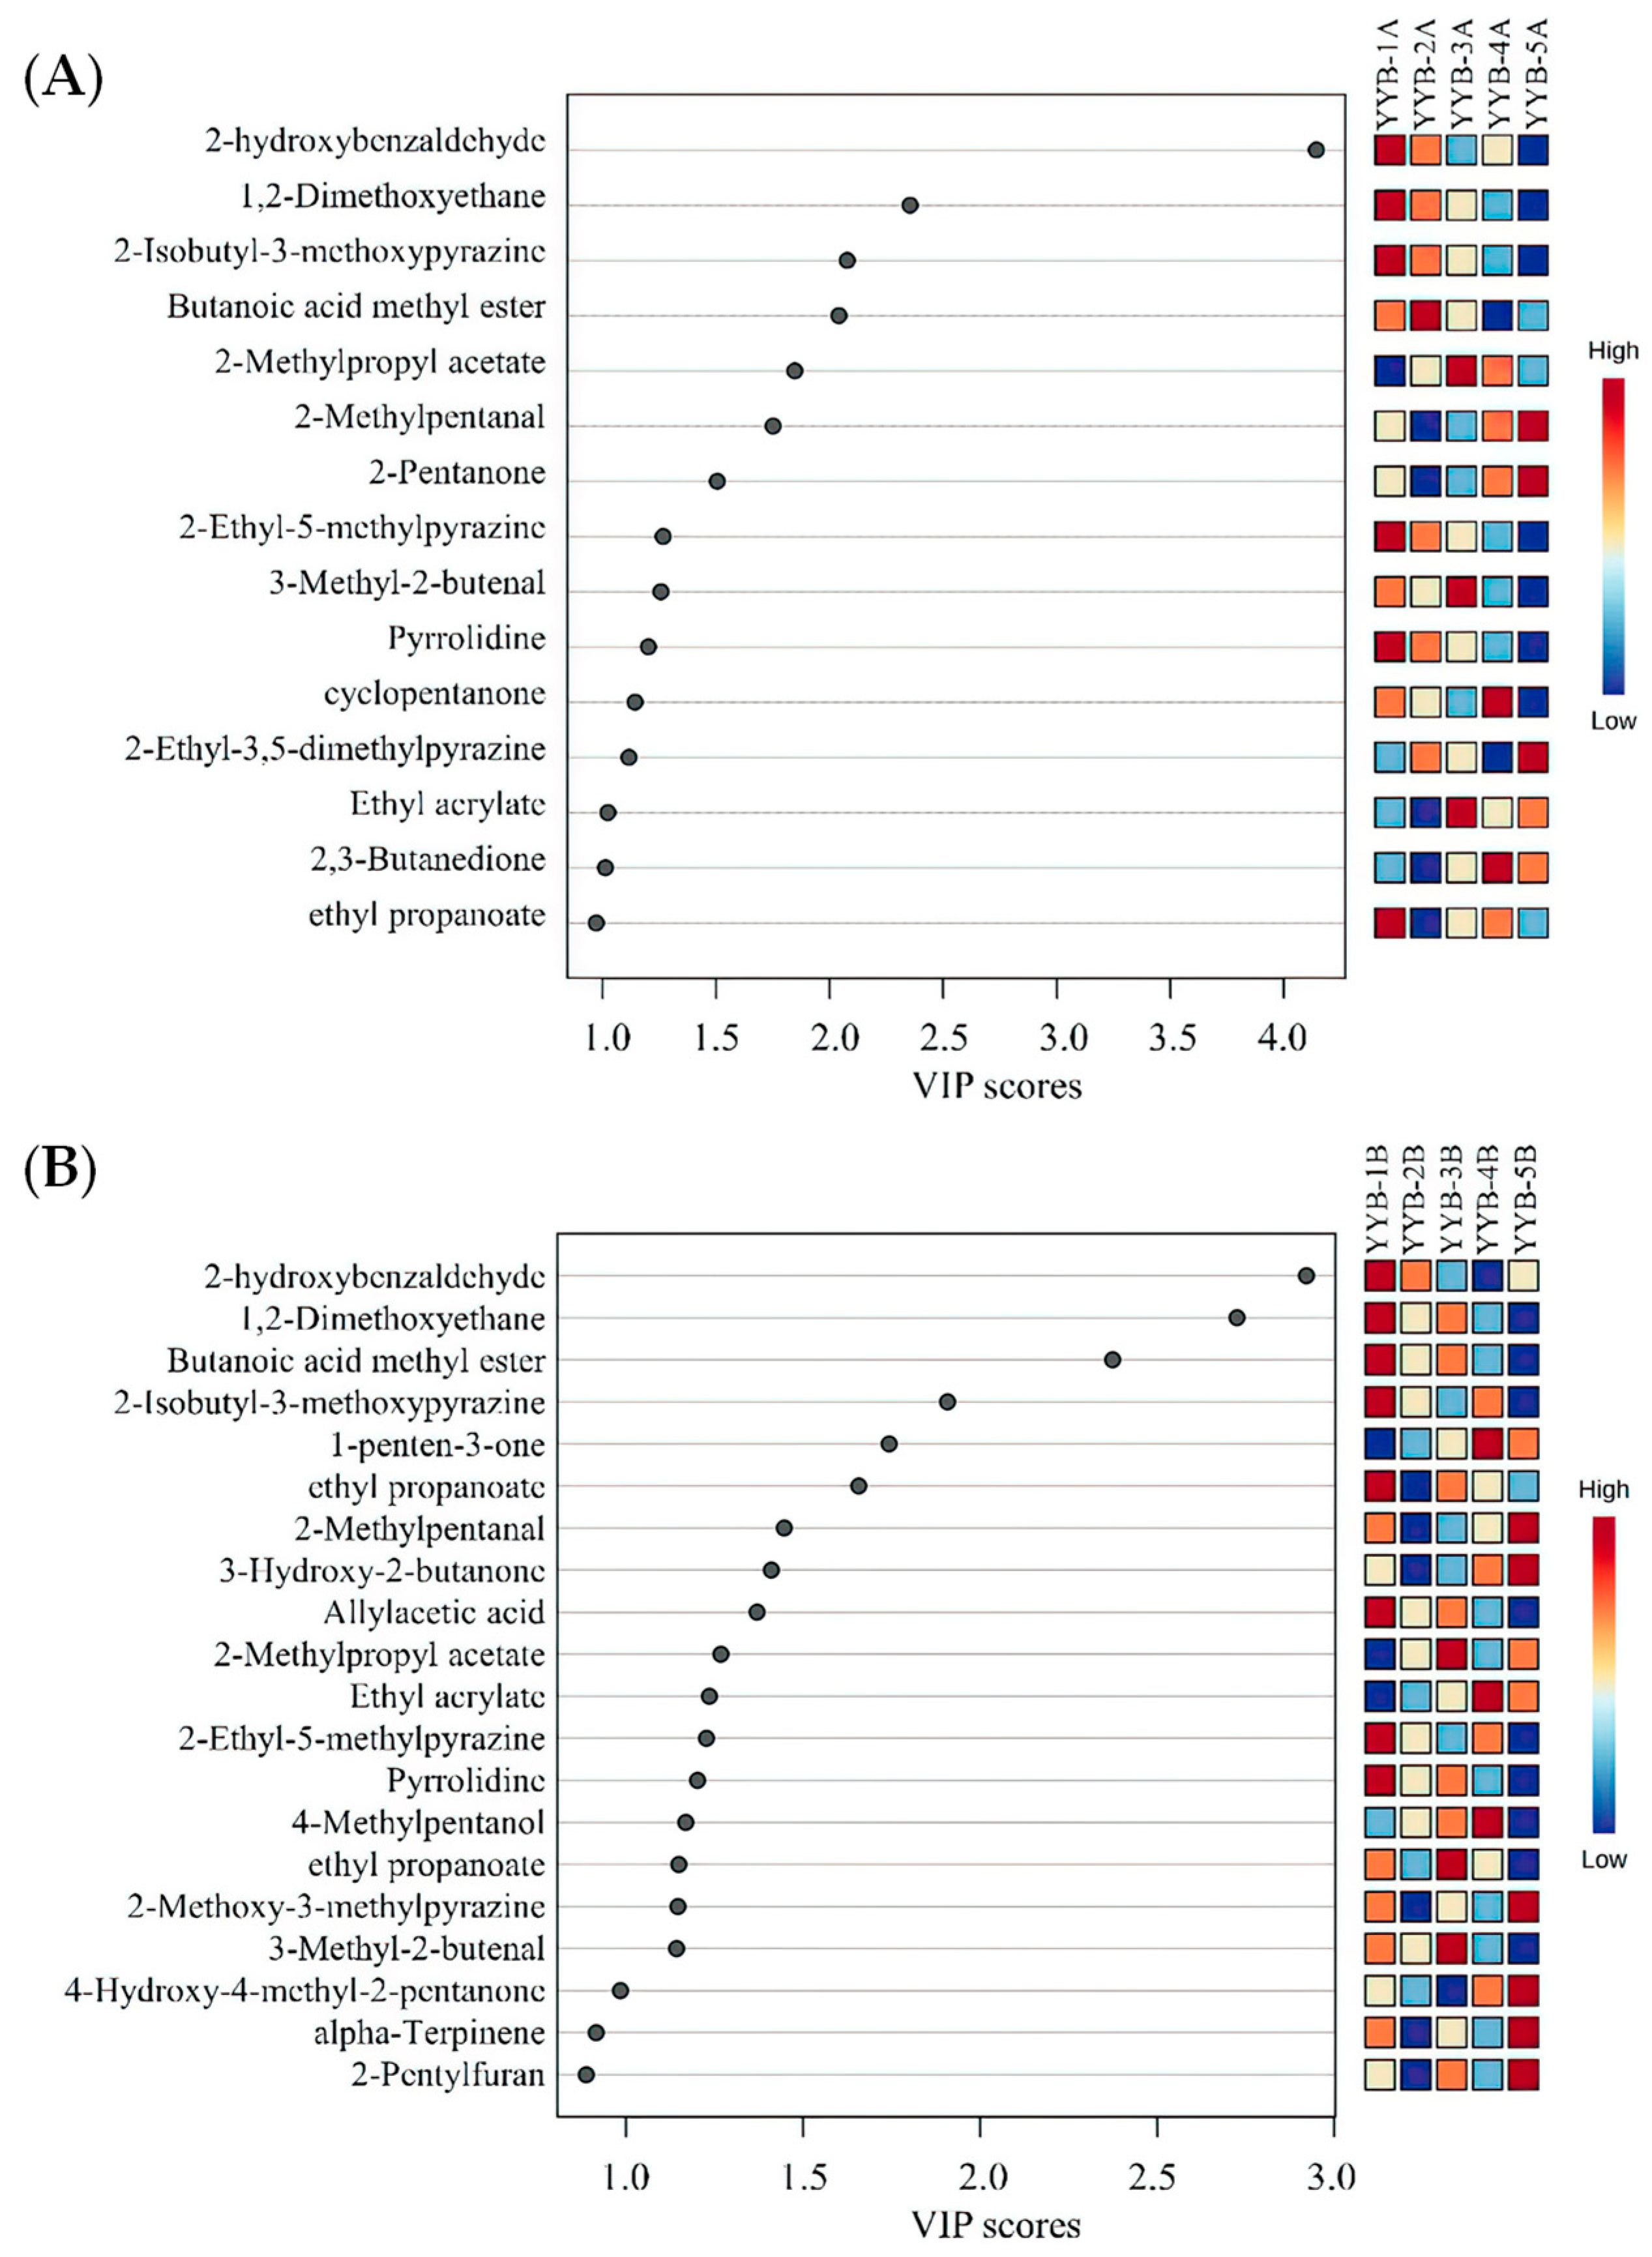
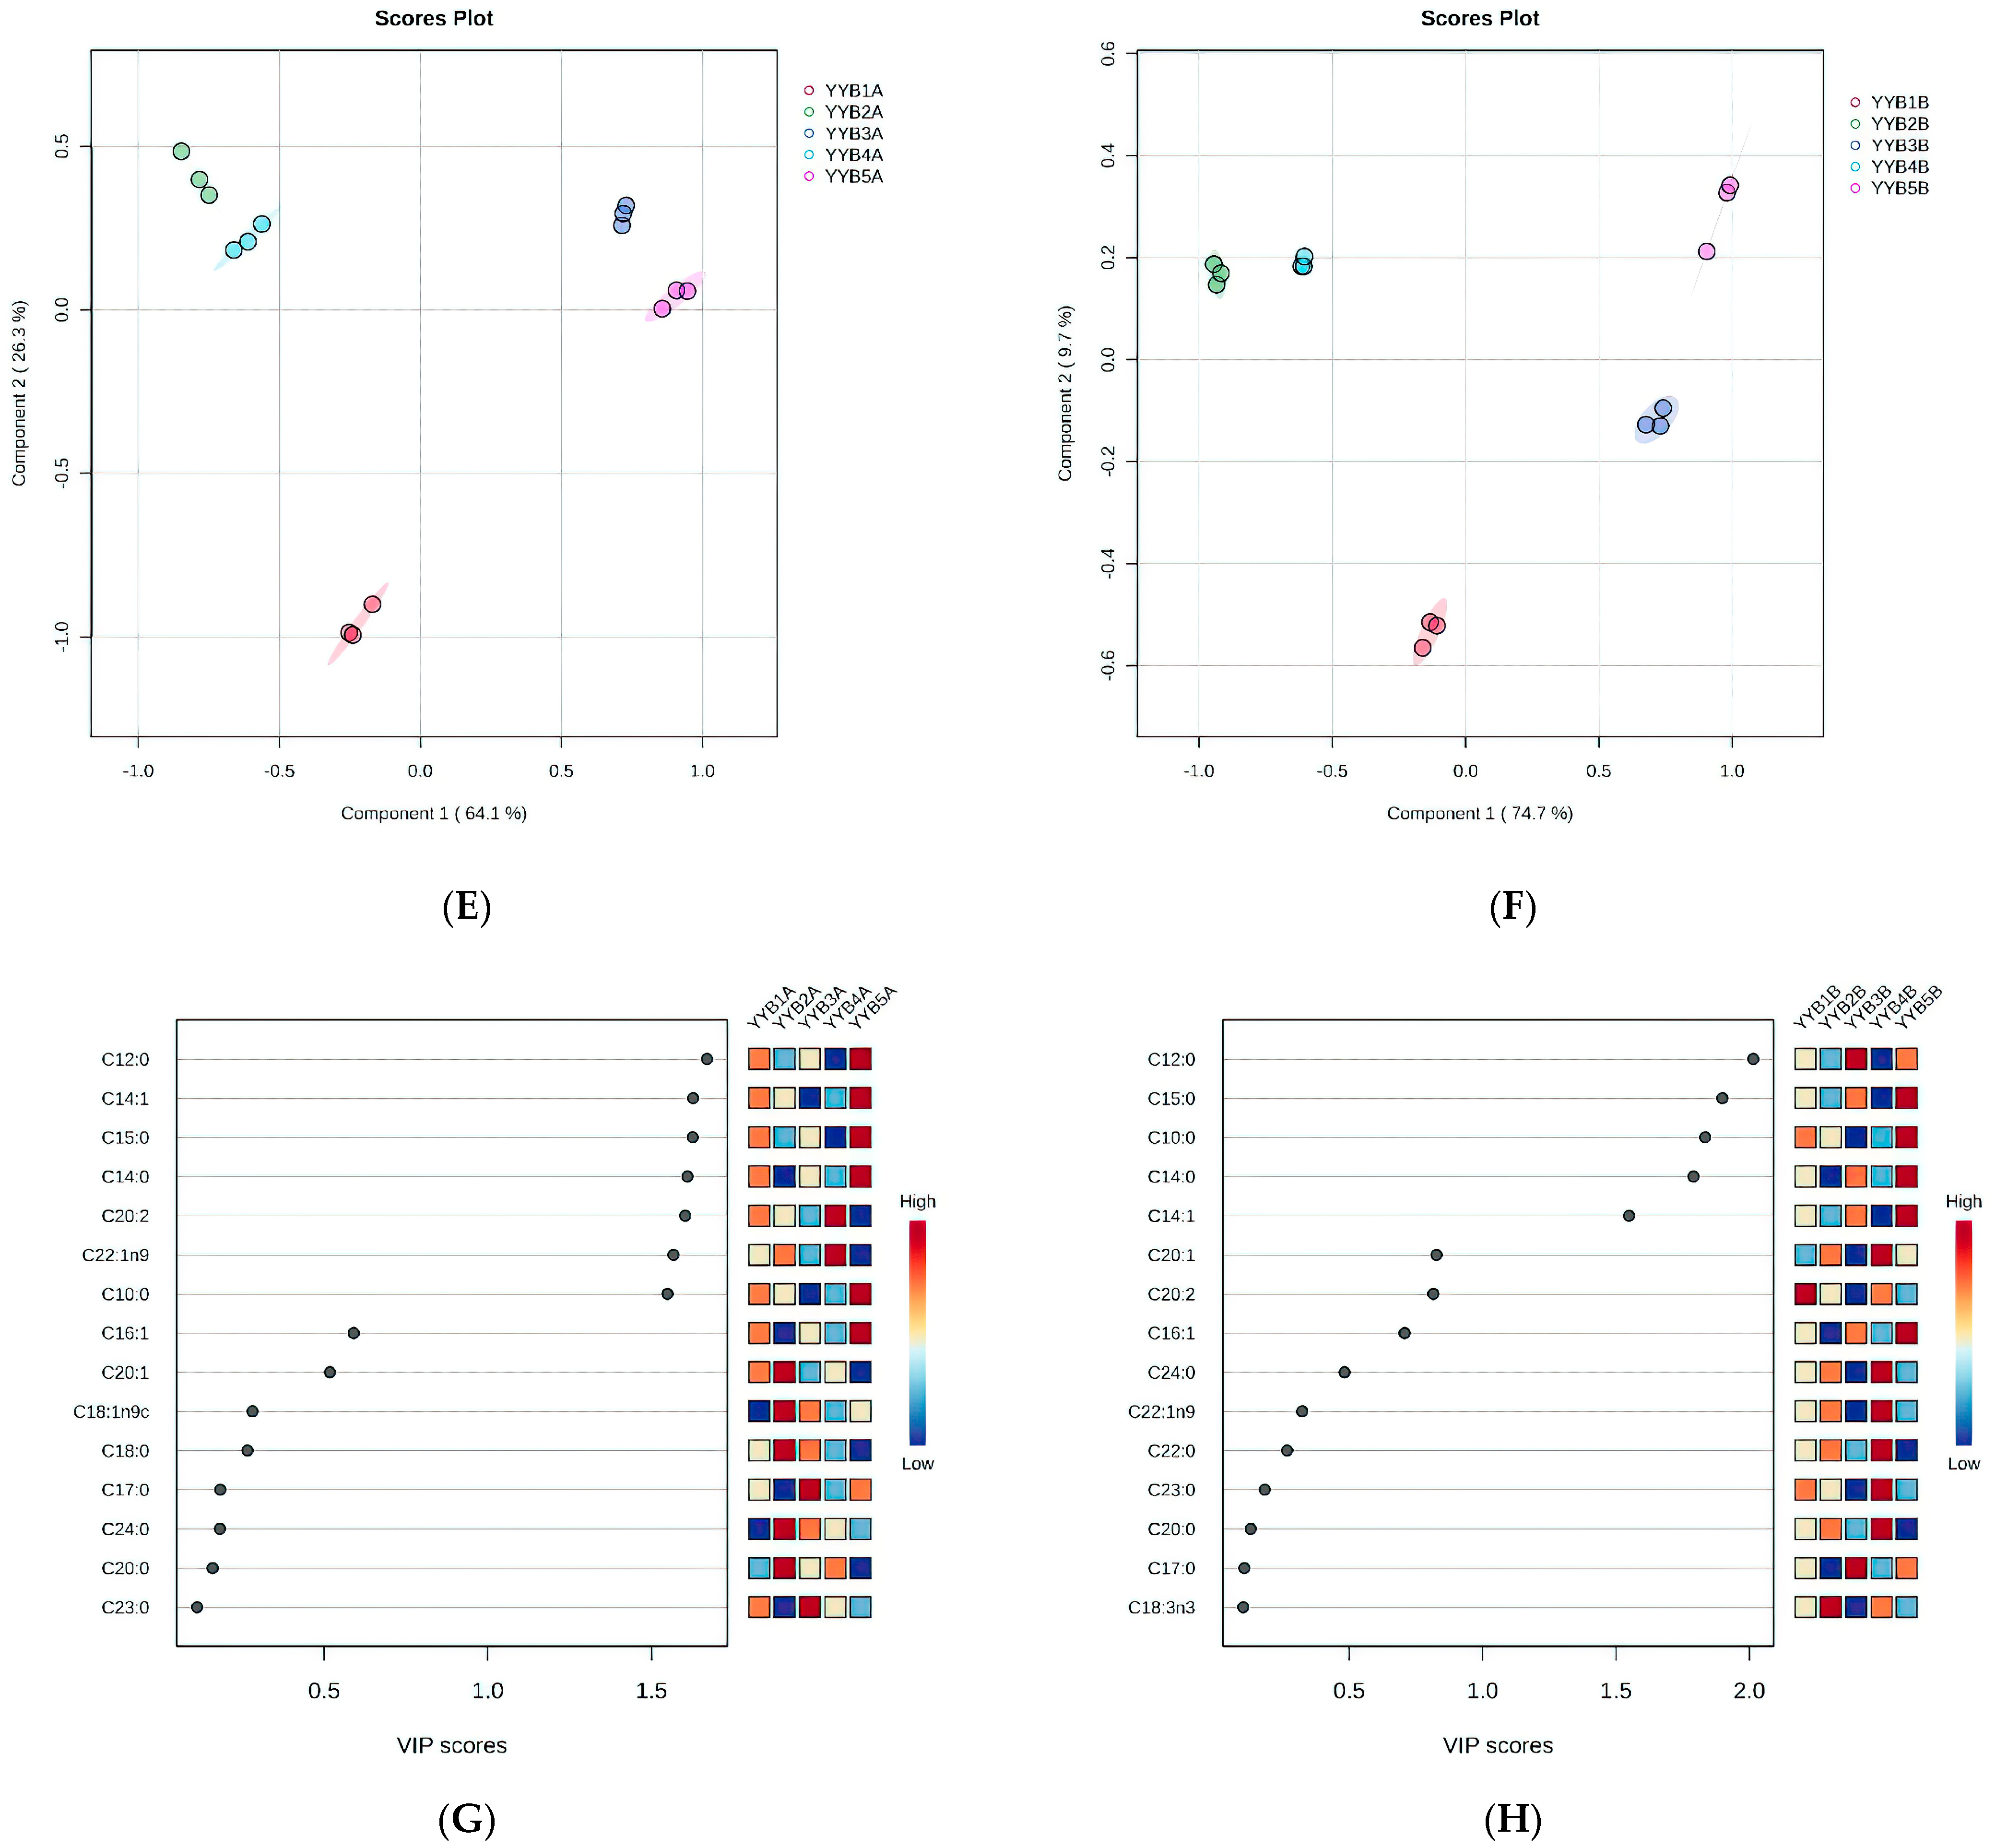
3.3. Principal Component Analysis (PCA)-Based Fingerprint Similarity Analysis

To investigate the variation in VOCs among nutritional powders from various manufacturers, a PCA was conducted, as illustrated in Figure 4. The total variance contribution of PC1 (36.00%) and PC2 (20.00%) accounts for 56.00%. Based on the contribution rates of the principal component factors in the various samples, an evaluation of the patterns, similarities, and differences among the samples was conducted [32].
On the whole, the position of VOCs in the samples after accelerated storage is in the same quadrant as before storage, but with a certain distance [33]. The results indicated a change in the content of VOCs in the nutrient powder after accelerated storage. There was a significant difference between sample YYB-5 and the other four products. The sample points for the remaining four products are situated on the right side of the PCA diagram. The sample points gradually shifted to the left as the storage time increased. Nutrient powder in accelerated storage for 90 days and 0 days varies in the content and composition of compounds contained in samples.
Based on the HS-GC-IMS data, a total of 10 qualitative differential characterization markers with variable importance in projection (VIP) >1 were screened (Figure 5), including four esters, three aldehydes, and three heterocyclic compounds. YYB-1 contained higher levels of 2-hydroxybenzaldehyde, YYB-3 contained higher levels of 2-methylpropyl acetate, 3-methyl-2-butenal and ethyl acrylate, and YYB-4 contained higher levels of Ethyl acrylate and 2,3-Butanedione. These VOCs can be used as potential markers to distinguish between the five different YYBs.

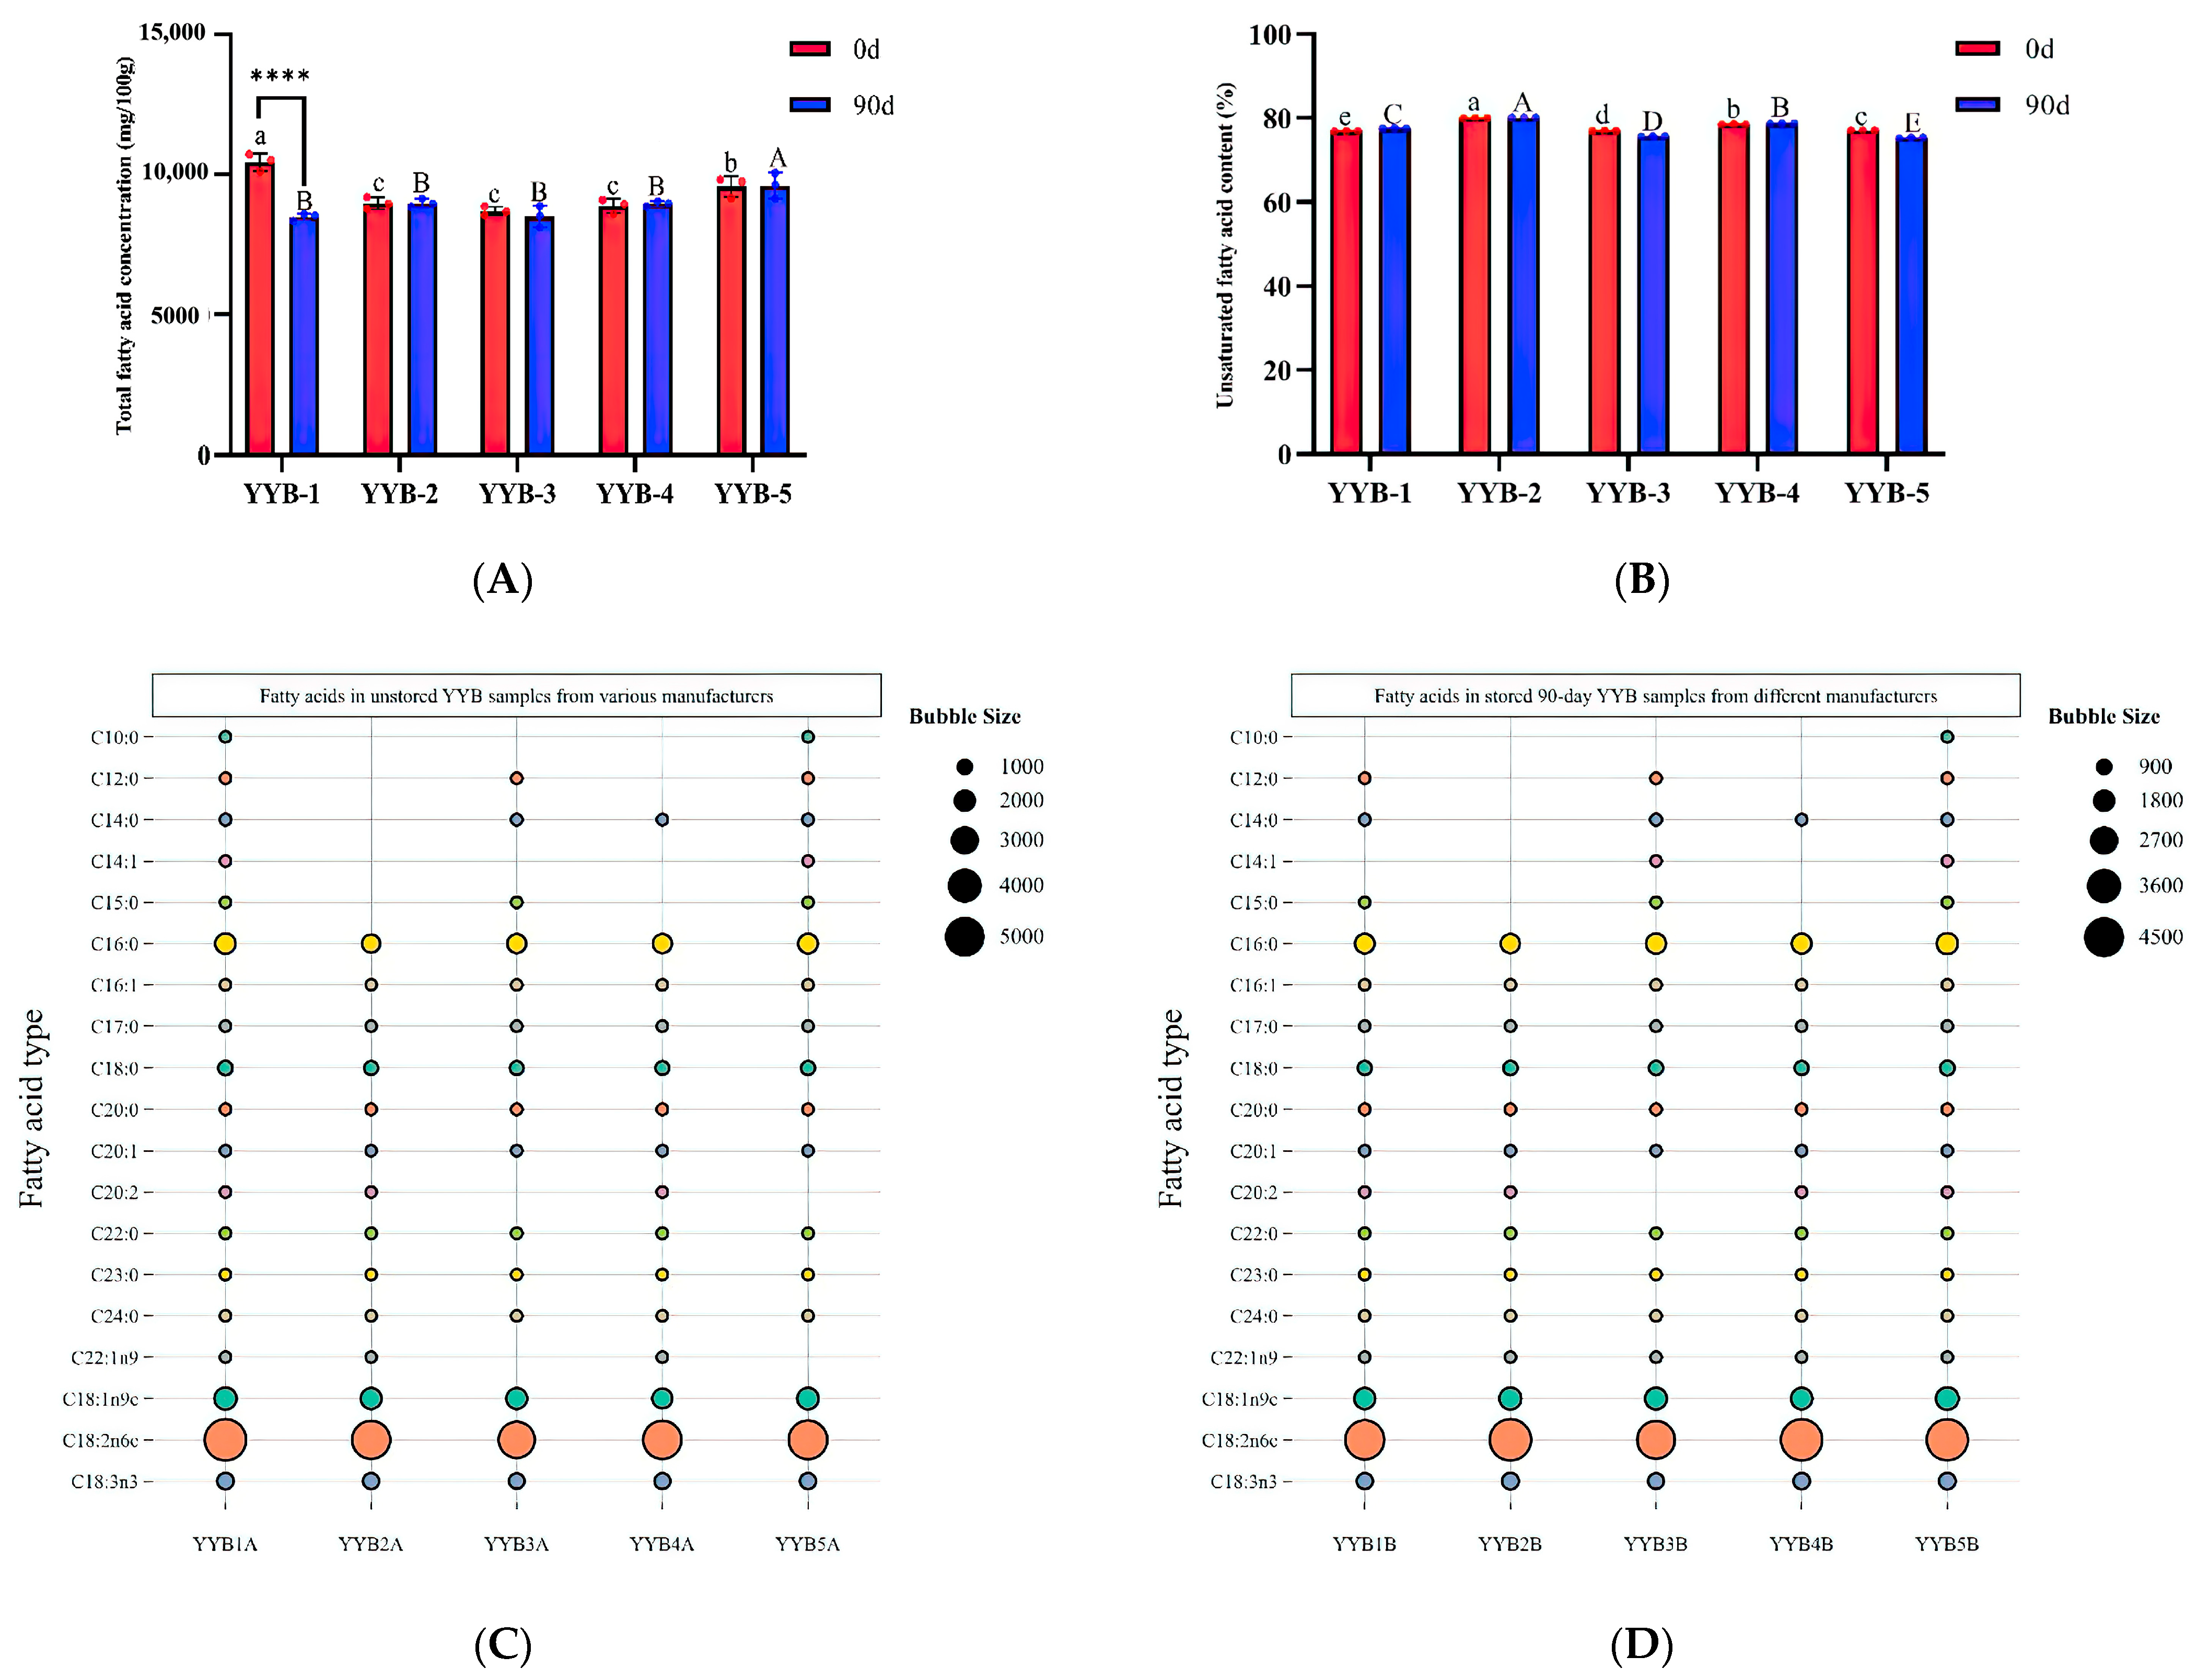
3.4. The Difference in Fatty Acid after Accelerated Storage of YYB from Different Manufacturers

FAs serve various roles in the nutritional package. In addition to providing stable and long-lasting energy, they are crucial components in cell membrane construction [34]. Table 2 and Table 3 display the results of FAs analysis conducted on YYB samples from various manufacturers using GC-MS. As shown in Table 2, a total of 19 FAs were detected in all unstored YYB samples. The number and species of FA varied among the groups; the YYB-1A group had 19 species, YYB-5A had 17, YYB-3A and YYB-4A had 15, and YYB-2A had 14. It is worth noting that changes in FA species were observed in some samples after 90 days of storage. Compared to the initial storage status, the absence of decanoic and myristic acids was observed in YYB-1B; YYB-3B showed an increase in myristate acid and docosahexaenoic acid; YYB-5B exhibited an augmentation in eicosatetraenoic acid and docosahexaenoic acid levels. Unlike the other groups, no significant alterations in FAs species were detected between the pre-storage and post-storage states in groups YYB-2 and YYB-4. Moreover, the concentrations of different FAs showed significant disparities (p < 0.05) among each YYB sample, both prior to and following storage.
The total FAs concentration of each YYB sample is shown in Figure 6A. Significant changes in FAs concentrations were not observed between before and after storage for the four YYB groups except for the YYB-1 group. The FAs concentration of the YYB-1B group was significantly lower than that of the YYB-1A group (p < 0.001). After storage, the FAs concentration of the YYB-5B group was significantly higher (p < 0.05) when compared with the remaining four groups. Generally, moderate consumption of unsaturated fatty acid (UFA) yields several advantageous effects on the human body, including the promotion of heart health, support for the brain and nervous system, and facilitation of fat-soluble vitamin absorption [35]. Figure 6B illustrates that the UFA contents of the YYB-1B, YYB-2B, and YYB-4B groups exhibited significant increases compared to their pre-storage levels (p < 0.05), whereas the YYB-3B and YYB-5B groups experienced significant decreases (p < 0.05). This corresponds to the decline in acid compounds and the corresponding increase in aldehydes and esters in the GC-IMS outcomes.
It becomes evident that the dominant fatty acids in the five groups of YYB samples (Figure 6C,D) were palmitic acid, Omega-9 Oleic acid, Omega-6 (ω-6) Linoleic acid and Omega-3 (ω-3) α-linolenic acid, both before and after storage, of which Omega-6 (ω-6) Linoleic acid had the highest concentration, accounting for approximately 65% of the total UFA concentrations in the YYB samples before and after storage. It was the most dominant UFA in the YYB samples.
The PLS-DA method was employed to visualize the variations in fatty acid composition among YYB samples from different manufacturers. Additionally, the obtained VIP values facilitated the identification of significant differences in fatty acid profiles among the samples [36]. Before analysis, the data were normalized using probability quotient normalization (PQN) with the YYB-1A and YYB-1B groups as references, followed by a Log10 transformation. Figure 6E illustrates a distinct separation of the YYB sample groups before storage on the PLS-DA score plot, indicating differentiation among the five groups. The distance between the sample points on the scoring graph indicates the level of similarity or difference in their fatty acid compositions; a shorter distance corresponds to higher similarity, while a longer distance indicates lower similarity [37]. The YYB-2A and YYB-4A groups were positioned closely, located in the upper left portion of the score graph. Similarly, the YYB-3A and YYB-5A groups were positioned closely, located in the upper right portion of the score graph. Figure 6G presents the seven key differential fatty acids (VIP > 1) found among the five groups of YYB samples before storage, as depicted in the figure. These fatty acids include capric acid, lauric acid, myristic acid, myristoleic acid, pentadecanoic (alkyl) acid, eicosadienoic acid, and Omega-9 fatty acids. Based on the results of Figure 6G, an interesting phenomenon can be found, which was, except for the YYB-3B group, the positions of the other four groups of YYB samples on the scoring graphs did not change significantly. Only the position of YYB-3B group changed significantly, suggesting that the fatty acid composition and content of YYB-3 group samples significantly varied before and after storage. From Figure 6H, it can be observed that there were five key differential FAs in YYB samples after storage. They were capric acid, lauric acid, myristic acid, myristoleic acid, and pentadecanoic acid.

4. Conclusions

In this study, HS-GC-IMS technology, combined with GC-MS was used for the determination of the flavor quality of infant complementary food powder. A total of 62 volatile components, such as aldehydes, esters, alcohols, ketones, pyrazines, and furans were identified by HS-GC-IMS. Among them, aldehydes are the most abundant and have a low threshold, making them the most important flavor substances in the powder. Based on the PCA model, the nutritional package products of different manufacturers can be clearly distinguished. Significant variations in VOCs in the final product were attributed to differences in the ratio of raw materials, the addition of trace elements, and packaging processes. Furthermore, these differences were also reflected in the changes in fatty acids, with lauric acid and myristic acid serving as important indicators for distinguishing YYB from various manufacturers. In summary, this study provides comprehensive insights into the flavor quality of infant complementary food nutrition powder, which can provide a basis for the quality control of YYB.

Author Contributions

Conceptualization, Z.Y. and X.G.; methodology, Z.Y. and J.L.; software, Z.Y. and J.L.; validation, Z.Y., J.L. and X.G.; writing—original draft preparation, Z.Y. and X.G.; writing—review and editing, Z.Y. and X.G.; visualization, J.L.; supervision, X.G.; project administration, X.G.; funding acquisition, X.G. All authors have read and agreed to the published version of the manuscript.

Funding

This research was funded by Shenzhen Science and Technology Program (ZDSYS20220117155800001).

Institutional Review Board Statement

Not applicable.

Informed Consent Statement

Not applicable.

Data Availability Statement

The original contributions presented in the study are included in the article, further inquiries can be directed to the corresponding author.

Conflicts of Interest

The authors declare that they have no known competing financial interests or personal relationships that could have appeared to influence the work reported in this paper.

References

  1. Li, C.; Zhu, N.; Zeng, L.; Dang, S.; Zhou, J.; Yan, H. Effect of Prenatal and Postnatal Malnutrition on Intellectual Functioning in Early School-Aged Children in Rural Western China. Medicine 2016, 95, e4161. [Google Scholar] [CrossRef]
  2. Santos, M.; Matias, F.; Vaz, R.; Castanheira, I.; Rito, A.; Loureiro, I.; Assunção, R. A Study of Commercially Available Complementary Foods for Infants and Young Children under 36 Months. Eur. J. Public Health 2021, 31, ckab165.152. [Google Scholar] [CrossRef]
  3. Bartleman, J. Infant and Child Nutrition. Medicine 2019, 47, 195–198. [Google Scholar] [CrossRef]
  4. Liu, J.; Sun, J.; Huang, J.; Huo, J. Prevalence of Malnutrition and Associated Factors of Stunting among 6–23-Month-Old Infants in Central Rural China in 2019. Int. J. Environ. Res. Public Health 2021, 18, 8165. [Google Scholar] [CrossRef]
  5. Ju, H.; Wu, C.; Jiang, P.; Qi, L.; Lin, S. Inhibition Effect of Nitrogen-filled Technology on Flavor Degradation of Infant Nutrition Powder. Food Process. Preserv. 2022, 46, e17045. [Google Scholar] [CrossRef]
  6. Zhao, M.; Gou, J.; Zhang, K.; Ruan, J. Principal Components and Cluster Analysis of Trace Elements in Buckwheat Flour. Foods 2023, 12, 225. [Google Scholar] [CrossRef]
  7. Kitabayashi, K.; Tanimoto, S.; Kikutani, H.; Ohkita, T.; Mabuchi, R.; Shimoda, M. Effect of Nitrogen Gas Packaging on Odor Development in Yellowtail Seriola Quinqueradiata Muscle during Ice Storage. Fish. Sci. 2019, 85, 247–257. [Google Scholar] [CrossRef]
  8. Clarke, H.J.; O’Sullivan, M.G.; Kerry, J.P.; Kilcawley, K.N. Correlating Volatile Lipid Oxidation Compounds with Consumer Sensory Data in Dairy Based Powders during Storage. Antioxidants 2020, 9, 338. [Google Scholar] [CrossRef] [PubMed]
  9. Li, X.; Wang, K.; Yang, R.; Dong, Y.; Lin, S. Mechanism of Aroma Compounds Changes from Sea Cucumber Peptide Powders (SCPPs) under Different Storage Conditions. Food Res. Int. 2020, 128, 108757. [Google Scholar] [CrossRef]
  10. Manzi, P.; Di Costanzo, M.; Mattera, M. Updating Nutritional Data and Evaluation of Technological Parameters of Italian Milk. Foods 2013, 2, 254–273. [Google Scholar] [CrossRef]
  11. Walczak, J.; Bocian, S.; Kowalkowski, T.; Trziszka, T.; Buszewski, B. Determination of Omega Fatty Acid Profiles in Egg Yolk by HILIC-LC-MS and GC-MS. Food Anal. Methods 2017, 10, 1264–1272. [Google Scholar] [CrossRef]
  12. Rao, Q.; Rocca-Smith, J.R.; Schoenfuss, T.C.; Labuza, T.P. Accelerated Shelf-Life Testing of Quality Loss for a Commercial Hydrolysed Hen Egg White Powder. Food Chem. 2012, 135, 464–472. [Google Scholar] [CrossRef]
  13. Harnkarnsujarit, N.; Charoenrein, S.; Roos, Y.H. Porosity and Water Activity Effects on Stability of Crystalline β-Carotene in Freeze-Dried Solids. J. Food Sci. 2012, 77, E313–E320. [Google Scholar] [CrossRef]
  14. Damjanovic Desic, S.; Birlouez-Aragon, I. The FAST Index—A Highly Sensitive Indicator of the Heat Impact on Infant Formula Model. Food Chem. 2011, 124, 1043–1049. [Google Scholar] [CrossRef]
  15. Kim, J.; Lee, Y. Characteristics and Antioxidant Activity of Maillard Reaction Products from Fructose-Glycine Oligomer. Food Sci. Biotechnol. 2010, 19, 929–940. [Google Scholar] [CrossRef]
  16. Ma, Y.; Zhao, Y.; Chi, Y. Changes in the Gel Characteristics of Two Hen Egg White Powders Modified by Dry Heating and the Maillard Reaction during Long-Term Storage. LWT 2019, 109, 123–129. [Google Scholar] [CrossRef]
  17. Elleuch, M.; Bedigian, D.; Roiseux, O.; Besbes, S.; Blecker, C.; Attia, H. Dietary Fibre and Fibre-Rich by-Products of Food Processing: Characterisation, Technological Functionality and Commercial Applications: A Review. Food Chem. 2011, 124, 411–421. [Google Scholar] [CrossRef]
  18. Wu, D.; Zhang, L.; Zhang, Y.; Shi, J.; Tan, C.P.; Zheng, Z.; Liu, Y. Lipid Profiles of Human Milk and Infant Formulas: A Comparative Lipidomics Study. Foods 2023, 12, 600. [Google Scholar] [CrossRef] [PubMed]
  19. Corral, S.; Salvador, A.; Flores, M. Salt Reduction in Slow Fermented Sausages Affects the Generation of Aroma Active Compounds. Meat Sci. 2013, 93, 776–785. [Google Scholar] [CrossRef]
  20. Pan, X.; Bi, S.; Lao, F.; Wu, J. Factors Affecting Aroma Compounds in Orange Juice and Their Sensory Perception: A Review. Food Res. Int. 2023, 169, 112835. [Google Scholar] [CrossRef] [PubMed]
  21. Horiuchi, M.; Umano, K.; Shibamoto, T. Analysis of Volatile Compounds Formed from Fish Oil Heated with Cysteine and Trimethylamine Oxide. J. Agric. Food Chem. 1998, 46, 5232–5237. [Google Scholar] [CrossRef]
  22. Fraatz, M.A.; Goldmann, M.; Geissler, T.; Gross, E.; Backes, M.; Hilmer, J.-M.; Ley, J.; Rost, J.; Francke, A.; Zorn, H. Biotechnological Production of Methyl-Branched Aldehydes. J. Agric. Food Chem. 2018, 66, 2387–2392. [Google Scholar] [CrossRef]
  23. Jeleń, H.; Gracka, A. Characterization of Aroma Compounds: Structure, Physico-chemical and Sensory Properties. In Flavour; Guichard, E., Salles, C., Morzel, M., Le Bon, A., Eds.; Wiley: New York, NY, USA, 2016; pp. 126–153. ISBN 978-1-118-92941-4. [Google Scholar]
  24. Tong, L.; Yi, H.; Wang, J.; Pan, M.; Chi, X.; Hao, H.; Ai, N. Effect of Preheating Treatment before Defatting on the Flavor Quality of Skim Milk. Molecules 2019, 24, 2824. [Google Scholar] [CrossRef] [PubMed]
  25. Yuan, X.; Zhu, X.; Sun, R.; Jiang, W.; Zhang, D.; Liu, H.; Sun, B. Sensory Attributes and Characterization of Aroma Profiles of Fermented Sausages Based on Fibrous-like Meat Substitute from Soybean Protein and Coprinus Comatus. Food Chem. 2022, 373, 131537. [Google Scholar] [CrossRef] [PubMed]
  26. Miller, A.E.; Chambers, D.H. Descriptive Analysis and Consumer Acceptance of Black Walnut Cultivars in a Sugar Cookie Base. LWT-Food Sci. Technol. 2013, 53, 139–145. [Google Scholar] [CrossRef]
  27. Xie, J.; Gänzle, M. Microbiology of Fermented Soy Foods in Asia: Can We Learn Lessons for Production of Plant Cheese Analogues? Int. J. Food Microbiol. 2023, 407, 110399. [Google Scholar] [CrossRef] [PubMed]
  28. Jensen, S.; Jansson, T.; Eggers, N.; Clausen, M.R.; Larsen, L.B.; Jensen, H.B.; Ray, C.; Sundgren, A.; Andersen, H.J.; Bertram, H.C. Storage-Induced Changes in the Sensory Characteristics and Volatiles of Conventional and Lactose-Hydrolyzed UHT Processed Milk. Eur. Food Res. Technol. 2015, 240, 1247–1257. [Google Scholar] [CrossRef]
  29. Hu, H.; Shi, A.; Liu, H.; Liu, L.; Fauconnier, M.L.; Wang, Q. Study on Key Aroma Compounds and Its Precursors of Peanut Oil Prepared with Normal- and High-Oleic Peanuts. Foods 2021, 10, 3036. [Google Scholar] [CrossRef]
  30. Friedman, M. Food Browning and Its Prevention:  An Overview. J. Agric. Food Chem. 1996, 44, 631–653. [Google Scholar] [CrossRef]
  31. Amores-Arrocha, A.; Sancho-Galán, P.; Jiménez-Cantizano, A.; Palacios, V. A Comparative Study on Volatile Compounds and Sensory Profile of White and Red Wines Elaborated Using Bee Pollen versus Commercial Activators. Foods 2021, 10, 1082. [Google Scholar] [CrossRef]
  32. Cheng, H.; Erichsen, H.; Soerensen, J.; Petersen, M.A.; Skibsted, L.H. Optimising Water Activity for Storage of High Lipid and High Protein Infant Formula Milk Powder Using Multivariate Analysis. Int. Dairy J. 2019, 93, 92–98. [Google Scholar] [CrossRef]
  33. Chen, L.; Wang, J.; Ye, Z.; Zhao, J.; Xue, X.; Heyden, Y.V.; Sun, Q. Classification of Chinese Honeys According to Their Floral Origin by near Infrared Spectroscopy. Food Chem. 2012, 135, 338–342. [Google Scholar] [CrossRef] [PubMed]
  34. De Carvalho, C.; Caramujo, M. The Various Roles of Fatty Acids. Molecules 2018, 23, 2583. [Google Scholar] [CrossRef] [PubMed]
  35. Shahidi, F.; Ambigaipalan, P. Omega-3 Polyunsaturated Fatty Acids and Their Health Benefits. Annu. Rev. Food Sci. Technol. 2018, 9, 345–381. [Google Scholar] [CrossRef] [PubMed]
  36. Mao, L.; Roos, Y.H.; Miao, S. Effect of Maltodextrins on the Stability and Release of Volatile Compounds of Oil-in-Water Emulsions Subjected to Freeze–Thaw Treatment. Food Hydrocoll. 2015, 50, 219–227. [Google Scholar] [CrossRef]
  37. Liu, Y.; He, C.; Song, H. Comparison of SPME Versus SAFE Processes for the Analysis of Flavor Compounds in Watermelon Juice. Food Anal. Methods 2018, 11, 1677–1689. [Google Scholar] [CrossRef]
Figure 1. The color changes with different manufacturers of YYB after accelerated storage. (A): YYB stored for 0 days; (B): partial enlargement of (A); (C) YYB stored for 90 days; (D): partial enlargement of (C). Different letters above the bars indicate that the samples exhibit statistically significant differences (p < 0.05) from one another. Uppercase letters represent differences among samples on day 0, while lowercase letters denote differences among samples stored after 90 days.
Foods 13 00648 g001
Figure 2. The two-dimensional topographic plots of flavor compounds in YYB under accelerated storage conditions. (A) The YYB under the condition with 37 °C and 75% RH stored for 0 days, (C) The YYB under the condition with 37 °C and 75% RH stored for 90 days. Three-dimensional topographic plots and chromatograms of flavor compounds in YYB under accelerated storage conditions. (B) The YYB under the condition with 37 °C and 75% RH stored for 0 days, (D) The YYB under the condition with 37 °C and 75% RH stored for 90 days.
Foods 13 00648 g002
Figure 3. The gallery plots of flavor compounds in nutrition powder (YYB) under accelerated storage conditions. The YYB was stored at 37 °C and 75% RH for 90 days. Numbers represent different manufacturers; letters represent storage time.
Foods 13 00648 g003
Figure 4. The principal component analysis (PCA) scatter diagram of flavor compounds in nutrition powder (YYB) under accelerated storage conditions. (A) The YYB under the condition with 37 °C and 75% RH stored for 0 days and 90 days, (B) the YYB under the condition with 37 °C and 75% RH stored for 0 days, (C) the YYB under the condition with 37 °C and 75% RH stored for 90 days.
Foods 13 00648 g004
Figure 5. Variable importance in projection (VIP) scores of each variable in five types of YYB based on GC-IMS (VIP > 1, p < 0.05), (A): 0 d; (B): 90 d.
Foods 13 00648 g005
Figure 6. (A): Total fatty acid content in different YYB; (B): the content of unsaturated fatty acids in different YYB; In panels (A,B), samples are distinguished by different letters above the bars, showing statistically significant differences (p < 0.05) between them; uppercase letters represent differences among day 0 samples, while lowercase letters denote differences among day 90 samples; In panels (A), the asterisks **** represent statistical significance at the levels of p < 0.0001; (C): bubble chart of fatty acid content in different YYB storage for 0 days; (D): bubble chart of fatty acid content in different YYB stores for 90 days; (E): PLS-DA score chart of fatty acid content in different YYB storage for 0 days; (F): PLS-DA score chart of fatty acid content in different YYB storage for 90 days; (G): VIP chart of different YYB storage for 0 days; (H): VIP chart of different YYB storage for 90 days.
Foods 13 00648 g006aFoods 13 00648 g006b
Table 1. Flavor compounds from YYB during storage.
No.CompoundCASFormulaMWRI 1Rt 2Dt 3
1nonanal (M)124-19-6C9H18O142.21107.9506.7031.94623
2nonanal (D)124-19-6C9H18O142.21108.2507.281.47979
32-hydroxybenzaldehyde90-02-8C7H6O2122.11041.5400.1781.16322
4benzaldehyde (M)100-52-7C7H6O106.1962.9311.2911.14982
5benzaldehyde (D)100-52-7C7H6O106.1963.3311.5721.46808
6(E)-2-heptenal (M)18829-55-5C7H12O112.2958.6307.641.25807
7(E)-2-heptenal (D)188255-5C7H12O112.2959.9308.7641.67159
8heptanal (M)111-71-7C7H14O114.2901.7263.4251.333
9heptanal (D)111-71-7C7H14O114.2900.4262.4991.69684
10(Z)-4-heptenal6728-31-0C7H12O112.2888.5254.8411.63226
11hexanal (M)66-25-1C6H12O100.2783206.7991.26096
12hexanal (D)66-25-1C6H12O100.2776.9203.4971.56295
133-methyl-2-butenal107-86-8C5H8O84.1781.1205.791.35933
142-methylpentanal123-15-9C6H12O100.2748.4188.781.51291
15pentanal (M)110-62-3C5H10O86.1691.7162.5821.18891
16pentanal (D)110-62-3C5H10O86.1690.6162.1151.42669
172-methylbutanal96-17-3C5H10O86.1664.8153.0851.16143
183-methylbutanal590-86-3C5H10O86.1650.9148.5171.17545
193-methyl-2-Butenal107-86-8C5H8O84.1744.4186.8221.11091
20octanol111-87-5C8H18O130.21046.7407.6361.45537
212-ethyl-1-hexanol104-76-7C8H18O130.21038.2395.6041.39794
221-octen-3-ol3391-86-4C8H16O128.2961.9310.4491.56875
23(E)-3-hexen-1-ol928-97-2C6H12O100.2851.8237.0421.26041
244-methylpentanol626-89-1C6H14O102.2848.2235.3991.30886
254-hydroxy-4-methyl-2-pentanone123-42-2C6H12O2116.2838.4230.8931.51444
264-methyl-2-pentanol108-11-2C6H14O102.2754.4191.7661.25491
27(Z)-2-pentenol1576-95-0C5H10O86.1773.7201.7761.45079
28(E)-2-pentenal1576-87-0C5H8O84.1767.9198.7441.10396
291,2-dimethoxyethane110-71-4C4H10O290.1649.6148.0921.13222
302,3-pentadione600-14-6C5H8O2100.1654.6149.71.27829
312-heptanone (M)110-43-0C7H14O114.2889.8255.4891.26345
322-heptanone (D)110-43-0C7H14O114.2898.8261.3991.66038
334-methyl-3-penten-2-one141-79-7C6H10O98.1794.5211.7151.46891
341-penten-3-one1629-58-9C5H8O84.1681.8158.8621.32791
353-hydroxy-2-butanone513-86-0C4H8O288.1734.7182.0861.35775
36cyclopentanone120-92-3C5H8O84.1770.7200.211.32899
372-ethyl-3,5-dimethylpyrazine13925-07-0C8H12N2136.21074.5450.0571.22834
382-ethyl-5-methylpyrazine13360-64-0C7H10N2122.21008.8356.3111.68005
392-methoxy-3-methylpyrazine2847-30-5C6H8N2O124.1986.4331.8321.16217
40methylpyrazine109-08-0C5H6N294.1816.9221.3021.08503
412-isobutyl-3-methoxypyrazine24683-00-9C9H14N2O166.21176.1645.7811.81887
42acetic acid, hexyl ester142-92-7C8H16O2144.21009.5357.1951.40756
43ethyl trans-2-butenoate623-70-1C6H10O2114.1841.1232.1231.18045
44butyl acetate123-86-4C6H12O2116.2792.7210.9731.24106
45butanoic acid methyl ester (M)623-42-7C5H10O2102.1716.9173.7411.13044
46butanoic acid methyl ester (D)623-42-7C5H10O2102.1723.7176.8811.41501
472-pentanone107-87-9C5H10O86.1691.1162.3271.38112
48ethyl acrylate140-88-5C5H8O2100.1704.3168.0641.41033
49ethyl propanoate (M)105-37-3C5H10O2102.1703.6167.7451.48045
50ethyl propanoate (D)105-37-3C5H10O2102.1704.5168.171.16611
512,3-pentanedione600-14-6C5H8O2100.1625.4140.481.28563
522,3-butanedione431-03-8C4H6O286.1582.1127.8021.1808
53acetic acid methyl ester79-20-9C3H6O274.1522.1112.1251.1826
542-methylpropyl acetate110-19-0C6H12O2116.2791.3210.3771.62248
552-pentylfuran3777-69-3C9H14O138.2997.1341.8591.25701
562-Furanmethanol98-00-0C5H6O298.1862241.9011.14061
57allylacetic acid591-80-0C5H8O2100.1901.2263.1031.43113
582-methylpropanoic acid79-31-2C4H8O288.1770.9200.3071.36084
59Tetrahydrothiophene110-01-0C4H8S88.2816.9221.3021.33391
60alpha-Terpinene99-86-5C10H16136.21016.4366.0431.19378
61Pyrrolidine123-75-1C4H9N71.1690.5162.0651.2915
622,6-dimethyl-pyridine108-48-5C7H9N107.2884.1252.6711.08859
CAS is the registration number of chemical substances by Chemical Abstracts Service. 1 represents the retention time in the capillary GC column; 2 represents the retention index calculated on an MXT-5 column using n-ketones C4-C9 as external standard; 3 represents the drift time in the drift tube.
Table 2. The GC-MS analyses of fatty acids in nutrient packs stored for 0 days by different manufacturers (mg/g).
YYB-1AYYB-2AYYB-3AYYB-4AYYB-5A
C10:08.76 ± 0.578.64 ± 0.57
C12:023.22 ± 1.27 a18.54 ± 0.34 b22.95 ± 2.3 a
C14:085.12 ± 2.06 a59.69 ± 0.8 b13.55 ± 0.56 c83.64 ± 2.72 a
C14:14.78 ± 0.215.31 ± 0.59
C15:09.38 ± 0.34 a6.22 ± 0.14 b9.25 ± 0.25 a
C16:01577.94 ± 39.09 a1208.29 ± 21.36 c1341.29 ± 20.37 b1344.17 ± 30.57 b1443.27 ± 43.66 a
C16:114.18 ± 0.9 a3.75 ± 0.2 c10.72 ± 1.09 b4.9 ± 0.25 c14.32 ± 0.7 a
C17:014.48 ± 0.02 a9.6 ± 0.61 c12.44 ± 0.17 b10.18 ± 0.69 c13.54 ± 0.72 ab
C18:0537.25 ± 13.39 a460.45 ± 7.03 bc451.89 ± 6.28 c420.22 ± 9.44 d482.12 ± 14.92 b
C18:1n9c1888.58 ± 47.77 a1669.97 ± 29.74 c1655.6 ± 24.31 c1487.73 ± 33.55 d1772.41 ± 58.71 b
C18:2n6c5233.62 ± 125.89 a4663.31 ± 81.66 b4314 ± 66.52 c4687.39 ± 104.83 b4756.86 ± 143.07 b
C18:3n3902.37 ± 20.6 a837.98 ± 20.19 bc724.84 ± 10.47 d793.14 ± 17.31 c844.84 ± 25.2 b
C20:038.13 ± 1.29 a33.67 ± 1.56 b30.79 ± 0.57 c32.54 ± 0.74 bc32.48 ± 1.26 bc
C20:116.75 ± 1.38 a14.26 ± 3.58 a11.55 ± 1.54 a12.58 ± 0.36 a11.33 ± 2.16 a
C20:25.20 ± 0.45 a3.98 ± 0.62 a4.35 ± 0.16 a
C22:055.08 ± 2.89 a46.33 ± 1.23 bc43.58 ± 0.43 c47.67 ± 2.99 bc49.23 ± 1.68 b
C22:1n95.3 ± 0.52 a4.36 ± 0.45 a5.09 ± 0.85 a
C23:07.58 ± 0.85 a5.24 ± 0.27 c6.87 ± 0.21 ab5.92 ± 0.71 bc6.95 ± 0.67 ab
C24:017.33 ± 1.2 a15.72 ± 0.78 ab15.29 ± 0.4 ab14.76 ± 0.31 b16.24 ± 0.59 ab
Data are presented as means ± standard deviation (n = 3). Samples marked with different letters within the same row show statistically significant differences (p < 0.05).
Table 3. The GC-MS analyses of fatty acids in nutrient packs stored for 90 days by different manufacturers (mg/g).
YYB-1BYYB-2BYYB-3BYYB-4BYYB-5B
C10:012.48 ± 0.45
C12:015.08 ± 0.14 c28.78 ± 0.88 b31.63 ± 1.32 a
C14:058.4 ± 0.48 c83.8 ± 3.15 b18.72 ± 0.43 d110.81 ± 3.93 a
C14:14.98 ± 0.196.66 ± 1.01
C15:06.32 ± 0.41 c8.92 ± 0.25 b12.78 ± 0.25 a
C16:01275.75 ± 15.89 cd1208.58 ± 16.96 d1369.07 ± 50.41 b1322.08 ± 12.38 bc1533.36 ± 58.91 a
C16:19.91 ± 0.32 c4.15 ± 0.5 e13.88 ± 0.74 a5.16 ± 0.31 d18.7 ± 1.39 b
C17:011.33 ± 0.31 c10.14 ± 0.44 c13.14 ± 0.39 b10.62 ± 0.31 c15 ± 0.84 a
C18:0426.06 ± 5.2 cd454.51 ± 6.56 bc459.67 ± 16.97 b422.56 ± 3.39 d518.35 ± 19.87 a
C18:1n9c1516.01 ± 17.7 c1661.15 ± 23.36 b1617.03 ± 58.37 bc1575.71 ± 15.22 bc1764.33 ± 66.27 a
C18:2n6c4317.87 ± 53.22 b4679.68 ± 64.51 a4118.66 ± 152.18 b4668.69 ± 43.4 a4641.05 ± 177.19 a
C18:3n3743.13 ± 8.96 c844.06 ± 11.94 a692.85 ± 25.44 d795.23 ± 6.78 b824.63 ± 32.44 ab
C20:029.94 ± 0.79 bc33.33 ± 0.3 a28.08 ± 1.63 c33.85 ± 0.11 a31.79 ± 1.45 ab
C20:19.29 ± 1.68 b12.68 ± 1.59 ab8.2 ± 1.92 b14.28 ± 0.3 a12.72 ± 2.64 ab
C20:26.58 ± 0.97 a3.88 ± 0.04 b4.04 ± 0.37 b3.41 ± 0.1 b
C22:043.23 ± 0.74 c43.73 ± 0.95 bc40.2 ± 0.94 d52.16 ± 0.86 a46.12 ± 1.89 b
C22:1n94.22 ± 0.66 a4.37 ± 0.22 a3.95 ± 0.35 a5.07 ± 0.92 a5 ± 0.1 a
C23:06.37 ± 0.24 a5.92 ± 0.47 a5.22 ± 0.68 a6.5 ± 0.3 a6.62 ± 1.16 a
C24:013.54 ± 0.23 c15.98 ± 0.26 b13.01 ± 0.9 c18.66 ± 1.34 a16.01 ± 0.7 b
Data are presented as means ± standard deviation (n = 3). Samples marked with different letters within the same row show statistically significant differences (p < 0.05).
Disclaimer/Publisher’s Note: The statements, opinions and data contained in all publications are solely those of the individual author(s) and contributor(s) and not of MDPI and/or the editor(s). MDPI and/or the editor(s) disclaim responsibility for any injury to people or property resulting from any ideas, methods, instructions or products referred to in the content.

