A Comprehensive Study from Cradle-to-Grave on the Environmental Profile of Malted Legumes


Abstract
:
1. Introduction
2. Pulses: Cultivation and Utilization, Market Prospects, and Ecological Implications
3. Methodology
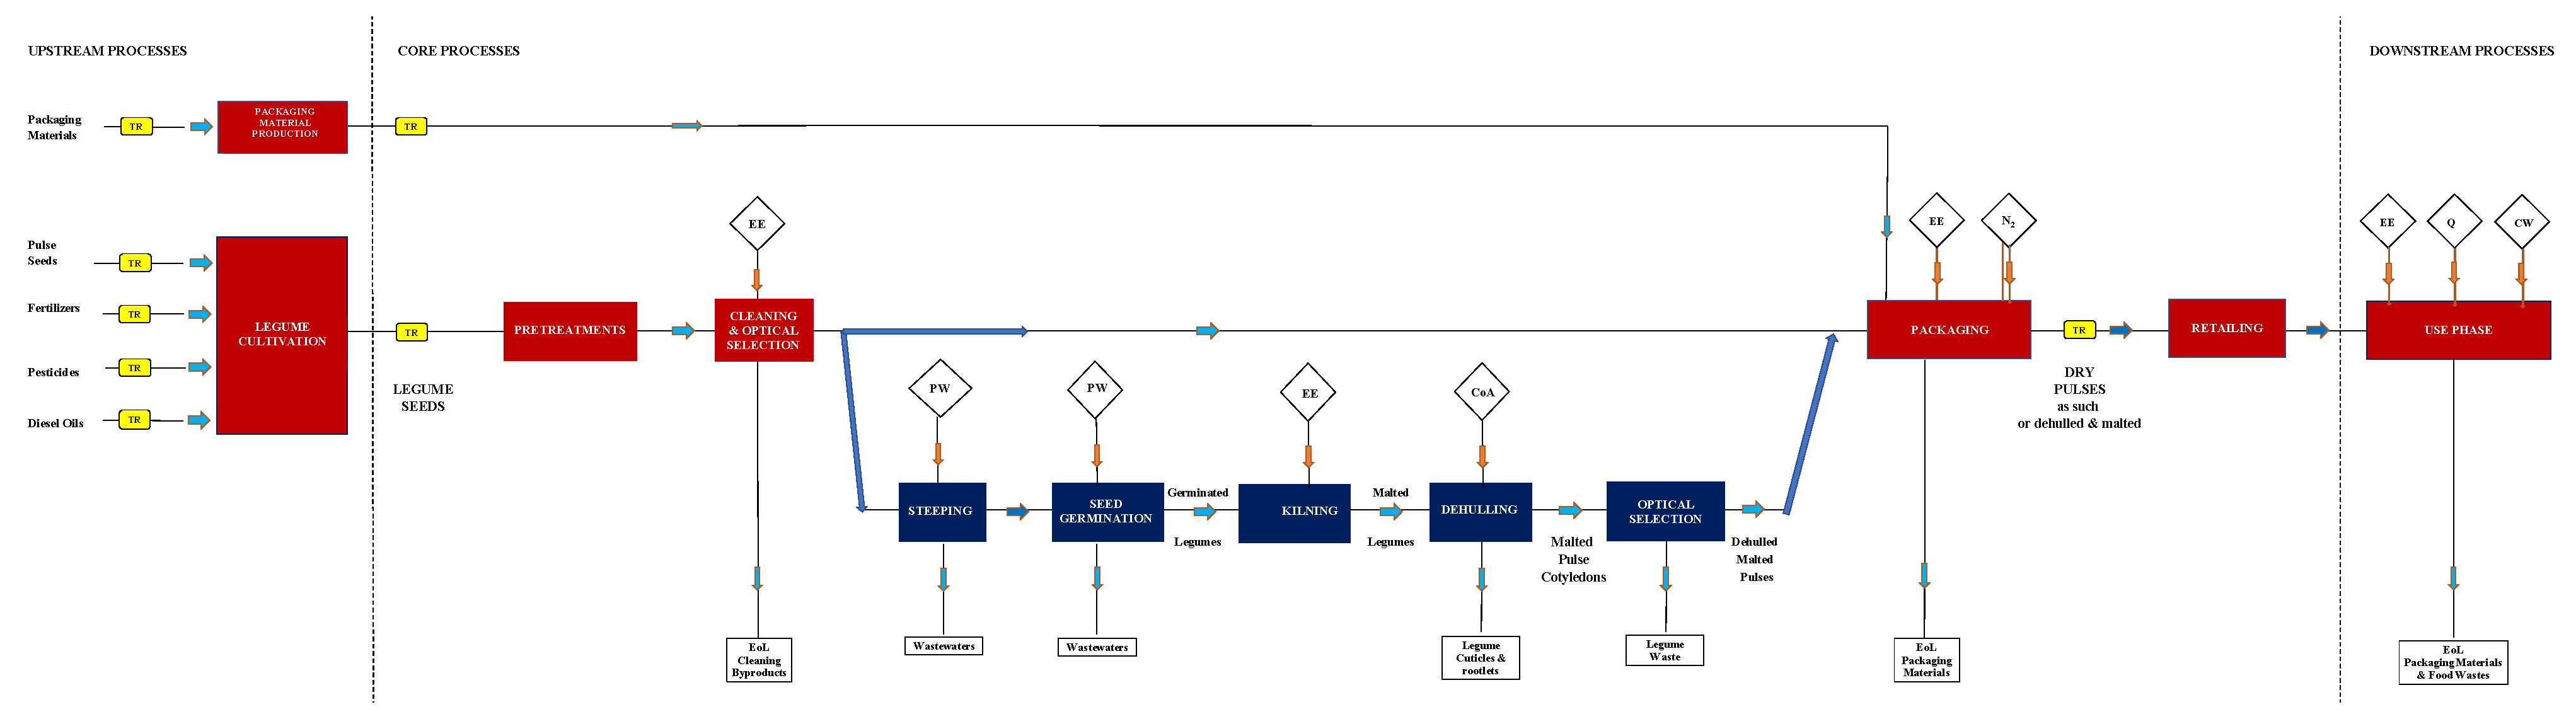
3.1. Goal and Scope Definition
- (i)
- Conventional cultivation of legumes in the Latium region of Italy.
- (ii)
- Pre-treatment of the harvested seeds to prevent insect proliferation.
- (iii)
- Cleaning and selection of treated legumes, which are then stored in polyethylene (PE) super-sacks.
- (iv)
- Primary packaging of selected legumes in food-grade PP bags, where inside air is automatically removed and replaced with gaseous N2. These are then sealed with a cardboard collar and two brass rivets to extend the shelf life of pulses to at least 1 year.
- (v)
- Secondary and tertiary packaging: twelve 500 g legume packages are collected in each cardboard box, which is then palletized.
- (vi)
- Storage at room temperature.
- (vii)
- Transportation of palletized products using a Jumper-type van for delivery to retailers, where the primary packages are displayed on store shelves.
- (viii)
- Home consumption: the packaged lentils are directly cooked in 4 L of tap water for each kg of dry legume, which is kept boiling for the time recommended on the label. In contrast, dried beans and chickpeas are similarly cooked on the condition that they have been preliminarily soaked in tap water (4 L/kg) for 16 h.
- (ix)
- Disposal of post-consumer cooked legume and packaging wastes.
- (x)
- Figure 1 also shows a block diagram related to the production of malted and decorticated legumes from cleaned and selected legumes (step iii), this involving the following steps:
- (xi)
- (xii)
- Germination under pre-set thermo-hygrometric conditions (25 °C) for 72 h to reduce the phytic acid and oligosaccharide contents.
- (xiii)
- Drying (kilning) of germinated legumes with a pre-established thermal diagram.
- (xiv)
- Decortication of malted legumes using a cyclone separator to remove their cuticles and rootlets.
- (xv)
- Optical selection of malted pulse cotyledons.
3.2. Life Cycle Inventory Analysis
3.2.1. Pulse Cultivation
3.2.2. Grain Fumigation
3.2.3. Seed Cleaning/Grading
3.2.4. Packaging of Dry Pulses
3.2.5. Logistics of Input and Output Materials
3.2.6. Energy Sources
3.2.7. Consumer Use
3.2.8. Disposal of Processing and Post-Consumer Wastes
- -
- Packaging wastes generated during production, storage at retailers, and consumer use (namely, PE super-sacks and PP bags, cardboard collars, labels, brass rivets, cartons, scotch tapes, PE shrink films, and broken semi-pallets) were collected in containers for plastic, paper and cardboard, or metal waste.
- -
- Dry legume wastes resulting from cleaning and packaging were pelletized, collected in the same PE super-sacks previously used for storing selected legumes, and delivered to local livestock farms, while the dust and herbaceous fractions recovered during the cleaning phase were collected and returned to the agricultural soil.
- -
- Cooked legume waste was discarded in containers for organic waste collection.
3.2.9. Life Cycle of Dry Legumes
3.2.10. Malting Process of Dried Legumes
- (a)
- Soaking at 25 °C for 3 or 5 h in the case of Onano lentils or Gradoli Purgatory beans and straight furrow chickpeas.
- (b)
- Germination at 25 °C for 72 h for any legume variety.
- (c)
- Drying at a maximum temperature of 60 °C for 12 h when processing 50 kg of dried legumes/cycle.
3.3. Impact Assessment
3.4. Sensitivity Analysis
4. Results and Discussion
4.1. Environmental Profile of Harvested Pulse Seeds at the Farm Gate
4.2. Cradle-to-Grave Environmental Profile of Dry Pulses
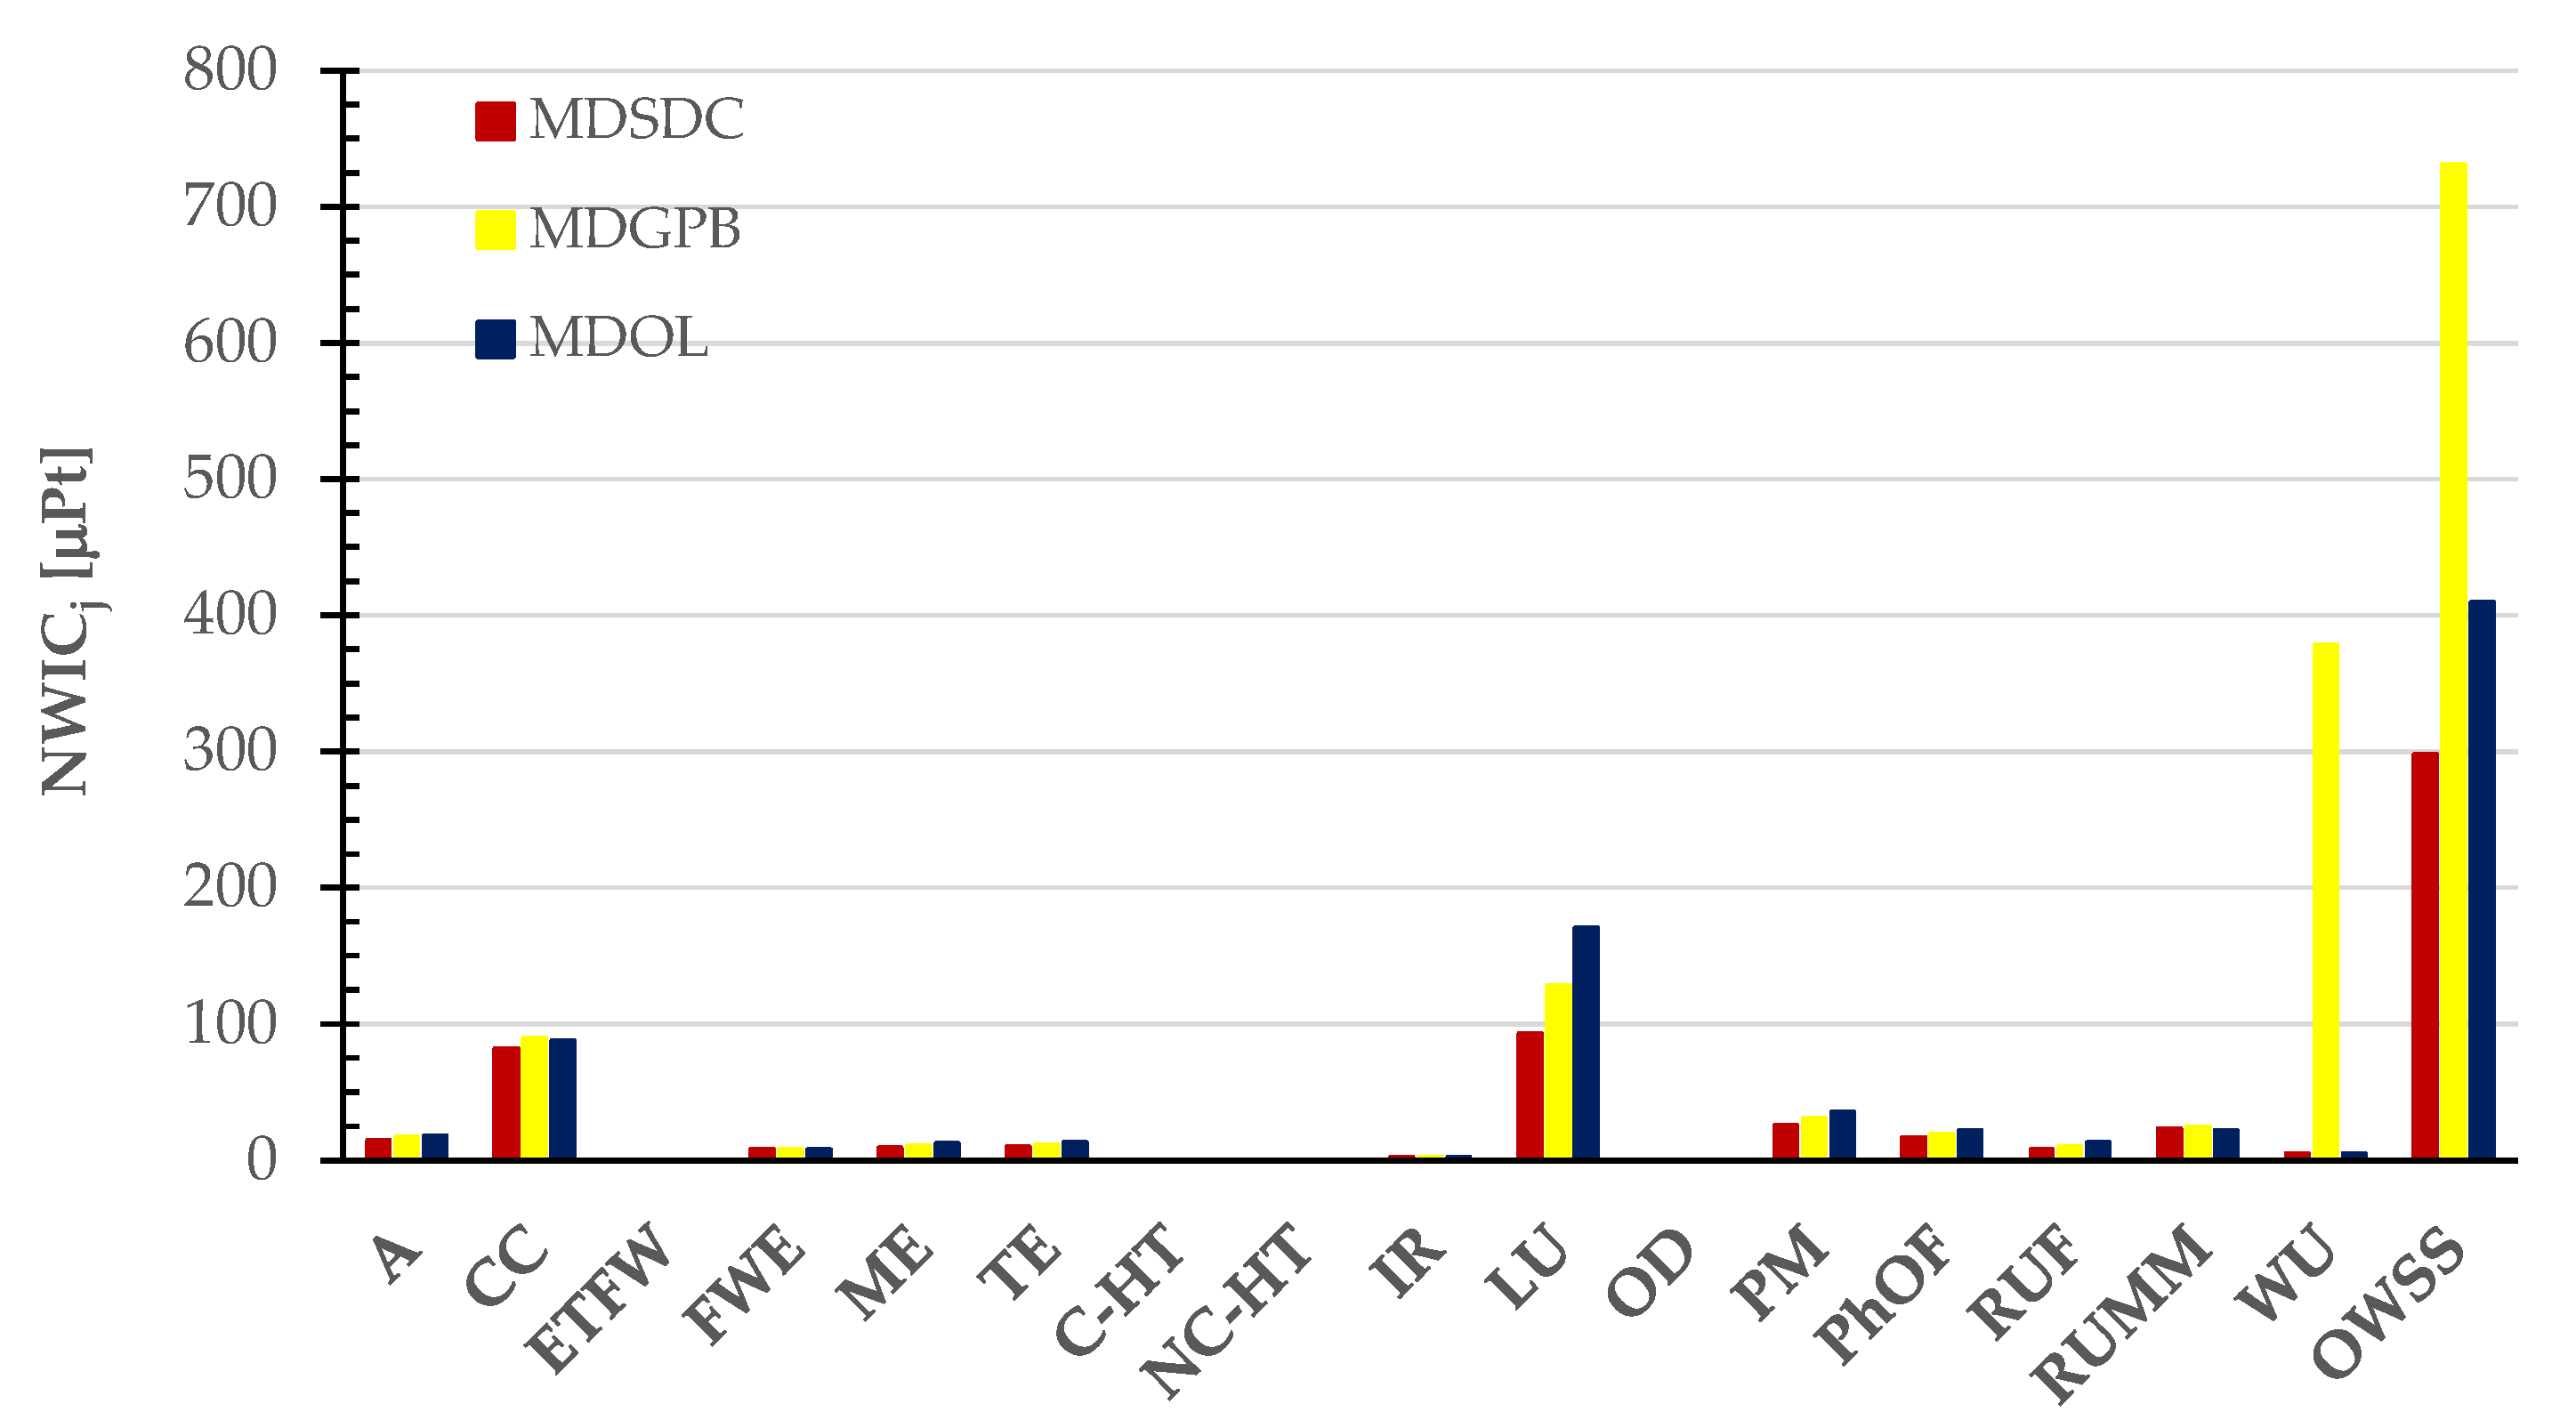
4.3. Cradle-to-Grave Environmental Profile of Dry Malted and Decorticated Pulses
4.4. Options to Improve the Sustainability of Dry Pulses as Such and Malted and Decorticated
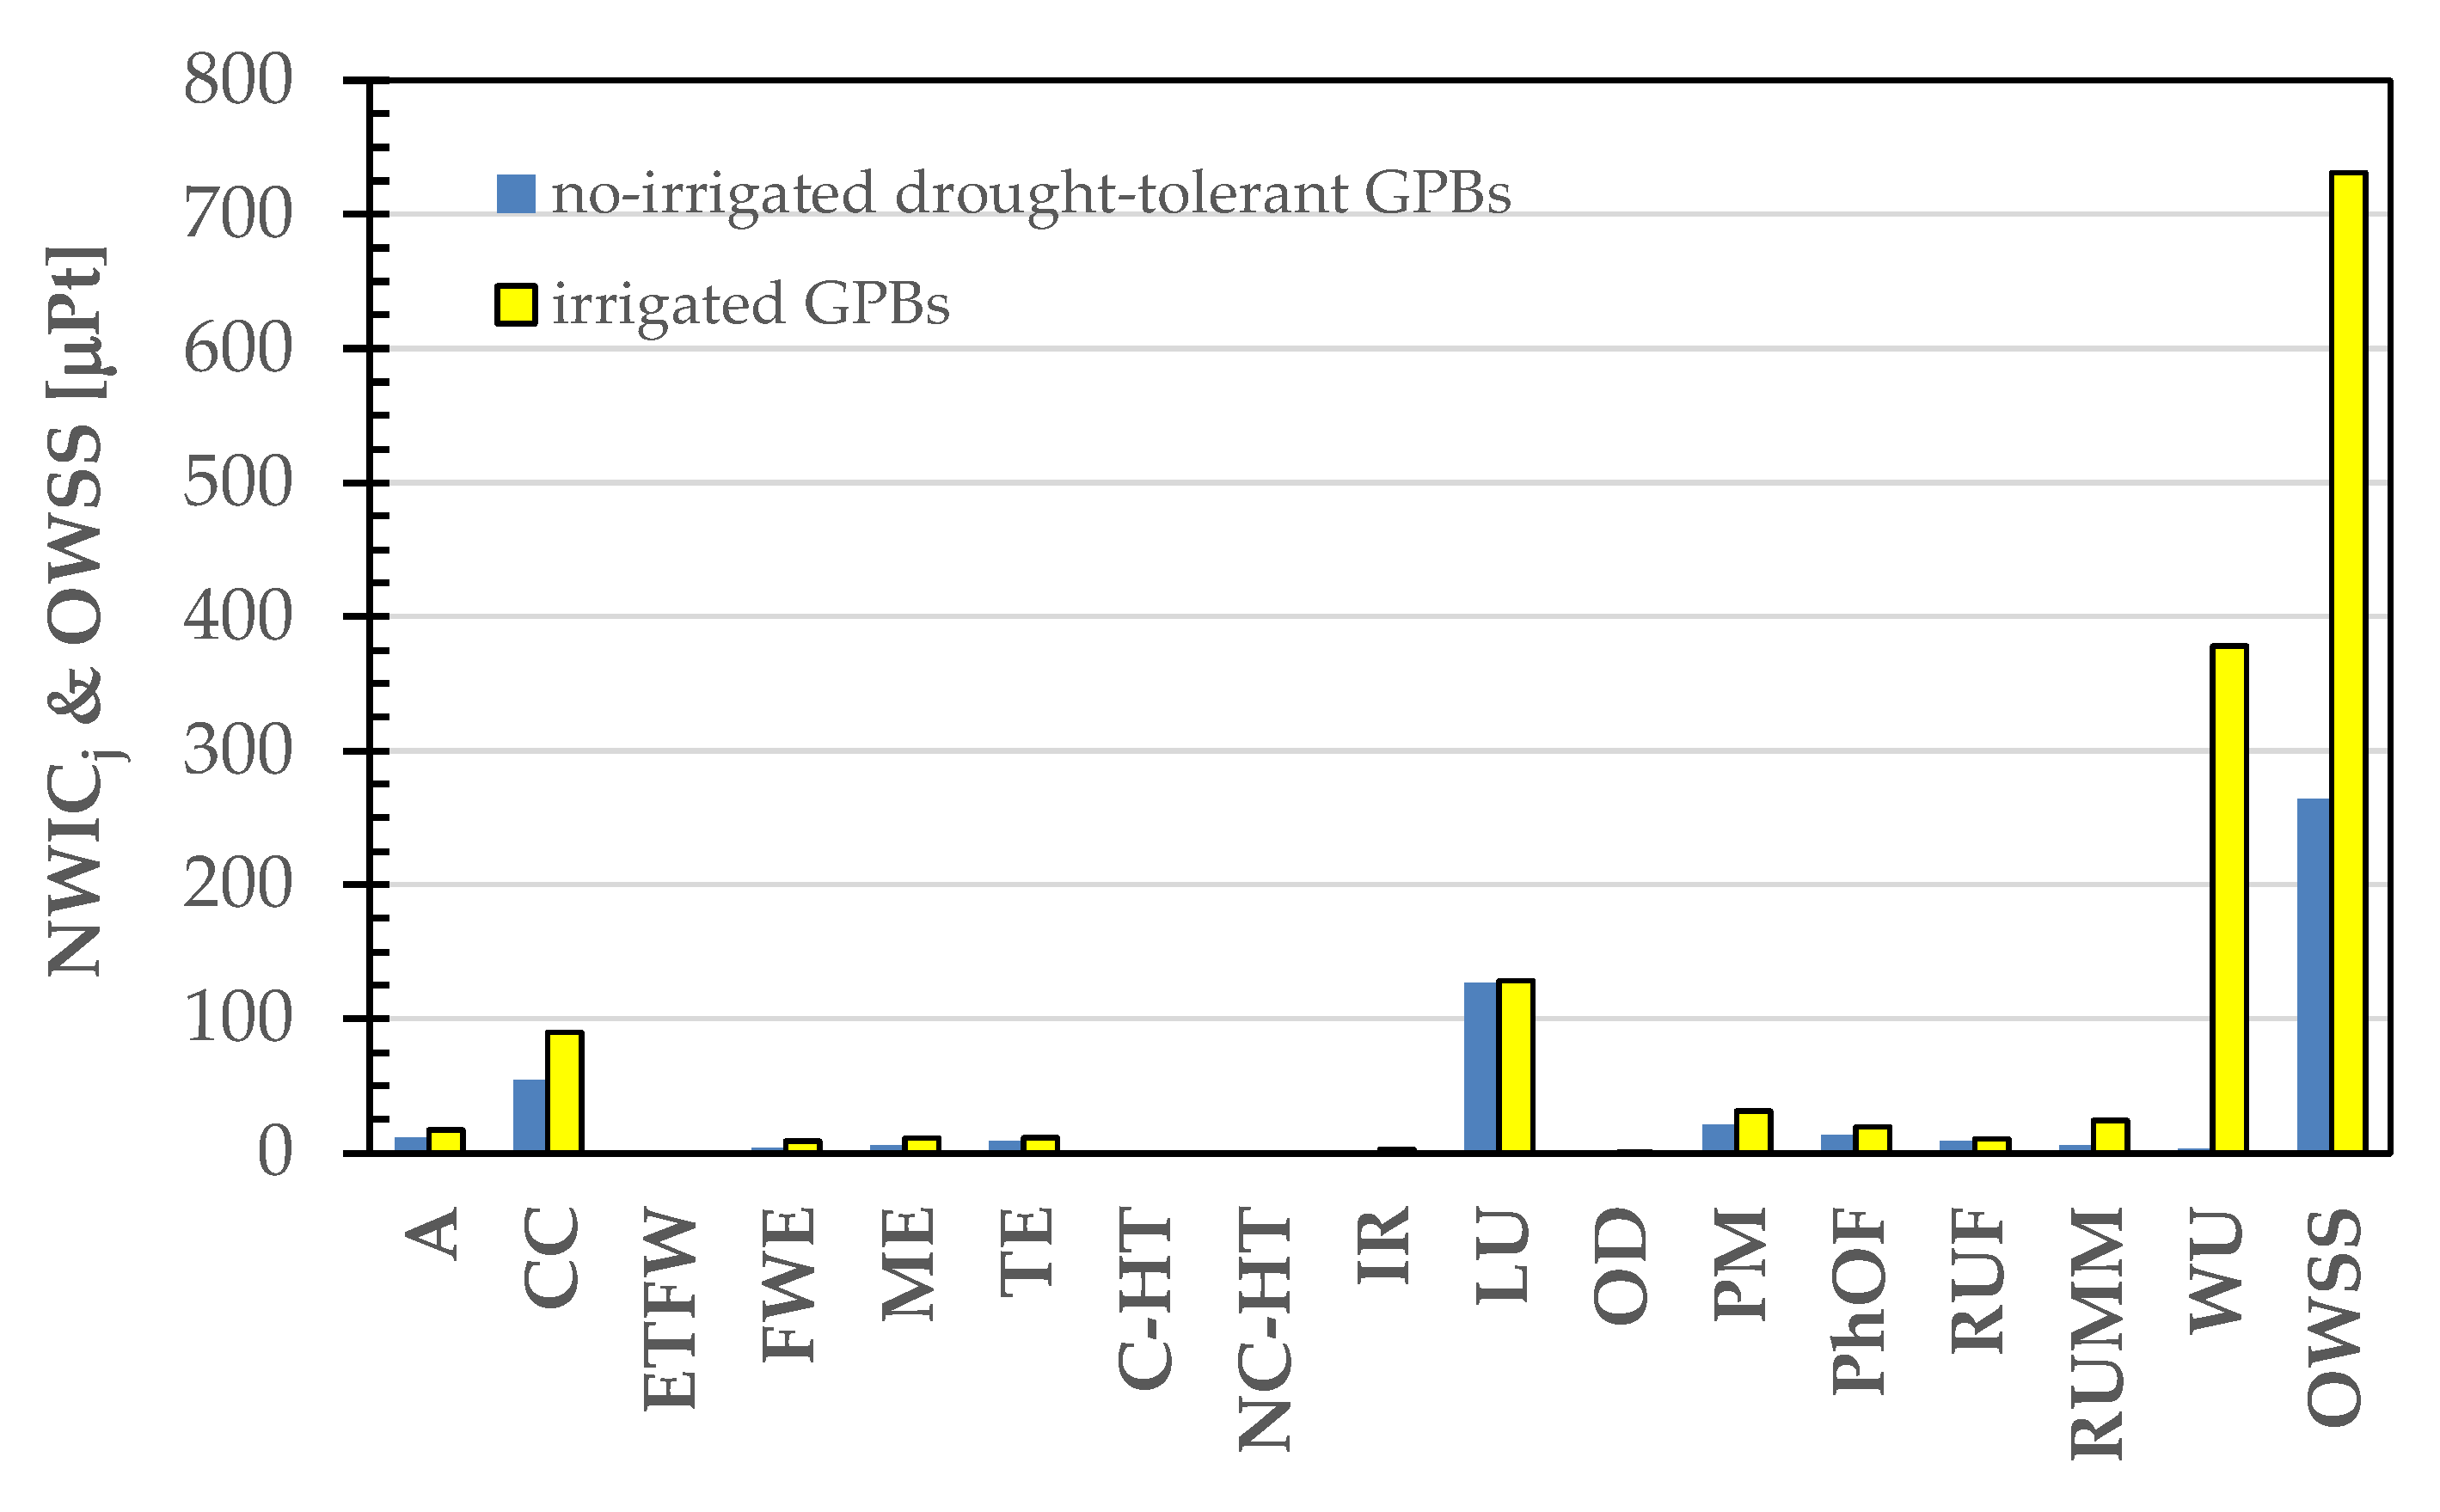
4.4.1. Land Use Mitigation
4.4.2. Water Use Mitigation
4.4.3. Climate Change Mitigation
- Minimizing electricity consumption in the malting process involves two key considerations. First, it is crucial to validate the specific consumption rate of 0.8 kWh per kg of dry pulses during malting, as determined in a pilot-scale malter, for its accurate application in industrial-scale equipment. Second, exploring the potential adoption of solar tunnel dryers for the kilning step represents a promising avenue for further reducing environmental impact.
- Transitioning to photovoltaic electricity: the company relied solely on electricity for dry legume production, consuming 32,900 kWh from the Italian medium-voltage grid in 2022 [51]. After installing photovoltaic panels on warehouse roofs, approximately 19,000 kWh per year was generated. Half of this was used on-site, contributing to about 29% of the total annual electricity consumption [51]. Expanding this photovoltaic paneling could potentially cover the entire factory’s electricity needs with solar power.
- Upgrading transport vehicles: replace the current light commercial vehicles, used for transporting the majority of resources in legume cultivation, packaging, and distribution, with new 1200 kg diesel vans complying with the CO2 emission performance target (95 g CO2e/km) set by the European Community in 2019 [94]. This change would reduce the emission factor from 2.01 to just 0.079 kg CO2e Mg−1 km−1.
- Optimizing pulse cooking with energy-efficient appliances: transition from gas-fired and electric kitchen appliances to energy-efficient home appliances, such as induction-heated cookstoves, to optimize pulse cooking. According to Table A3, the energy consumption during pulse cooking was minimal with induction cookstoves, ranging from 1.15 to 0.99 and 0.70 kWh per kg for dried SDCs, GPBs, and OLs, respectively. For malted and decorticated pulses, the use of induction hobs could further reduce energy needs from 0.85–1.12 (Table 6) to 0.62–0.78 kWh per kg. This transition aligns with sustainability goals by minimizing energy consumption.
5. Conclusions and Future Perspectives
Supplementary Materials
Author Contributions
Funding
Institutional Review Board Statement
Informed Consent Statement
Data Availability Statement
Acknowledgments
Conflicts of Interest
Nomenclature
| A | Acidification [mol H+e] |
| AGR | Above-ground residues [Mg/(ha year)] |
| ALLMZ | Allocation of by-products used in animal feeding [%] |
| AlP | Aluminum phosphide [g] |
| B2C | Business-to-consumers |
| BG | Dry matter in below-ground crop residues [kg dm/(ha yr)] |
| CA | Cartons [kg] |
| CaF | Cattle farm |
| CAV | Cardboard collars [kg] |
| CC | Climate change [kg CO2e] |
| CFC | Trichlorofluoromethane |
| CH | Consumer house |
| C-HT | Cancer human toxicity [CTUh] |
| CO2e | Carbon dioxide equivalent |
| CoA | Compressed air |
| cPdm | Specific heat of dry matter [kJ kg−1 K−1] |
| cpPD | Specific heat of dried legumes [kJ kg−1 K−1] |
| cpPH | Specific heat of pre-hydrated legumes [kJ kg−1 K−1] |
| cpW | Specific heat of cooking water (= 4.186 kJ kg−1 K−1]) |
| CTUe | Comparative Toxic Unit, ecotoxicity |
| CTUh | Comparative Toxic Unit, human health |
| CU | Consumer use phase |
| CW | Cooking water |
| D | Decorticated |
| DD | Decimal degree |
| DF | Diesel fuel |
| DFLO | Diesel fuel and lubricant oil |
| E | Herbaceous fraction in harvest pulse grains [kg] |
| EC | Carton label [kg] |
| eC | Specific electricity consumption [kWh/kg] |
| ECT | Effective pulse cooking time [min] |
| EE | Electric energy |
| EF1 | N2O emission factor per kg of N present in both mineral and organic fertilizers of animal origin [kg NO2-N/kg N] |
| EF4 | N2O emission factor resulting from the atmospheric deposition of N on soils and surface waters [kg N2O-N/kg of NH3-N and NOX-N volatilized] |
| EF5 | N2O emission factor resulting from leaching and runoff of N [kg N2O-N per kg of leached or washed N] |
| EoL | End of life |
| EP | Pallet label [kg] |
| EPD | Environmental Product Declaration |
| ES | Energy supplied by the generic stove (gas, electric, or induction) at a preset power level [kJ] |
| ES,BP | Energy supplied to bring cooking water and dry pulses to the boiling point [kJ] |
| ES,min | Energy supplied by the generic stove (gas, electric, or induction) at The minimum power level [kJ] |
| ET | Paper label [kg] |
| Eth | Theoretical energy to cook legumes [kJ or kWh] |
| FE | On-field emissions |
| Fert | Fertilizers |
| FEW | Freshwater eutrophication [kg Pe] |
| FG | Factory gate |
| FIBC | Flexible intermediate bulk container |
| FN2O | N2O emissions associated with the use of mineral and organic fertilizers [kg N2O/(ha yr)] |
| FN2OD | Direct emissions of N2O generated in situ directly from the use of fertilizer [kg N2O/(ha yr)] |
| FN2OIND | Indirect emissions of N2O generated elsewhere by the dispersion of nitrogen in the environment in the form of volatile gas and as nitrate (NO3−) dissolved in leached waters [kg N2O/(ha yr)] |
| FP | Shrink film for pallets [kg] |
| FPh | Field phase |
| FCR | Nitrogen in crop residues [kg/(ha yr)] |
| FracGASF | Fraction of N in synthetic fertilizer that volatilizes as NH3 and NOX [kg N volatilized/kg of applied N] |
| FracGASM | Fraction of N present in organic fertilizers applied and in excretions deposited by grazing animals that volatilizes as NH3 and NOX [kg N volatilized/kg of applied N] |
| FracLEACH | Fraction of N lost through leaching and runoff [kg N lost/kg of applied N] |
| FracRemoved | Fraction of crop surface residues removed annually for alternative purposes (feed, litter, and construction) [dimensionless] |
| FracRenew | Fraction of the total cultivated area renewed annually [dimensionless] |
| FWET | Freshwater eco-toxicity [CTUe] |
| GHG | Greenhouse gas |
| GP | Cleaned grains [kg] |
| GPB | Gradoli Purgatory beans |
| GPD | Dehydrated cleaned grains [kg] |
| GPP | Cleaned grains in PE super-sacks [kg] |
| GPPD | Dehydrated cleaned grains in PE super-sacks [kg] |
| GR | Harvested grains [kg] |
| GRF | Fumigated grains [kg] |
| H1 | Hardness of cooked legumes [N] |
| H2Ov | Moisture lost during storage of cleaned legumes [kg] |
| HRT | Heavy rigid truck |
| ICj | Generic j-th impact category |
| IPCC | Intergovernmental Panel on Climate Change |
| IR | Ionizing radiation [kBq 235Ue] |
| LCA | Life-cycle assessment |
| LCI | Dry legumes in PP bags [kg] |
| LCII | Dry legumes in cardboard [kg] |
| LCIII | Palletized dry legumes [kg] |
| LCV | Light commercial vehicle |
| LCV | Light Commercial Vehicle |
| LU | Land use [Pt] |
| M | Malted |
| MDGPB | Malted and decorticated Gradoli Purgatory beans |
| MDOL | Malted and decorticated Onano lentils |
| mDP | Mass of dry legumes subjected to cooking [kg] |
| mDPdm | Mass of dry matter in dry pukses [kg] |
| MDSDC | Malted and decorticated Solco dritto chickpeas |
| ME | Marine eutrophication [kg Ne] |
| MP | Malted legumes [kg] |
| MPC | Malted and hulled legumes [kg] |
| mPC | Mass of cooked legumes [kg] |
| MPCI | Malted and hulled legumes in PP bags [kg] |
| MPCII | Malted and hulled legumes in cardboard [kg] |
| MPCIII | Malted and hulled legumes palletized [kg] |
| mPH | Mass of legumes after soaking [kg] |
| MSW | Municipal solid waste |
| mW0 | Initial quantity of cooking water [kg] |
| mWC | Mass of water used for cooking [kg] |
| MWCS | Municipal waste collection service |
| mWPC | Mass of residual water after cooking [kg] |
| mWR | Mass of residual water after soaking [kg] |
| mWS | Mass of water used during soaking [kg] |
| MZ | Cleaning waste used in animal feeding [kg] |
| N2 | Gaseous nitrogen [kg] |
| NAG | Weight fraction on a dry basis of N in surface crop residues [kg N/kg dm] |
| NBG | Weight fraction on a dry basis of N in underground crop residues [kg N/kg dm] |
| NC-HT | Non-cancer human toxicity [CTUh] |
| NMVOC | Non-methane volatile organic compounds |
| OD | Stratospheric ozone depletion [kg CFC11e] |
| OL | Lentils from Onano |
| OW | Organic waste [kg] |
| OWSS | Overall Weighted Sustainability Score [Pt] |
| PAL | Semi-pallet [kg] |
| PAS | Publicly Available Specification |
| PCR | Cuticles and rootlets from malted legumes [kg] |
| PCW | Paper and cardboard waste [kg] |
| Pest | Pesticides |
| PH3 | Phosphine released in air [g] |
| PhOF | Photochemical ozone formation [kg NMVOCe] |
| PHS | Primary hotspot |
| PM | Particulate matter [disease inc.] |
| PMP | Packaging material production |
| PO | Powders in harvested pulse grains [kg] |
| PO + E | Powders and herbs in harvested pulse grains [kg] |
| PoS | Point of sale |
| PP | Polypropylene and PP bag [kg] |
| PR | Harvested production [Mg]. |
| PS | Production site |
| pvGPD | Selling price of selected legumes [€/kg] |
| pvMZ | Selling price of pulse cleaning by-products [€/kg] |
| PW | Process water |
| Q | Thermal energy |
| qgel | Gelatinization heat of starch in legumes [kJ] |
| qsPI | Sensible heat to raise the temperature of legumes from T0 to Tb [kJ] |
| qsW | Sensible heat to raise the temperature of cooking water from T0 to Tb [kJ] |
| r2 | Coefficient of determination [dimensionless] |
| RA | Resource availability |
| RBG-BIO | Ratio between dry matter in below ground residues and above-ground residues [g/g] |
| RCC′ | Paper and cardboard waste at the gates of the processing company [kg] |
| RCC″ | Paper and cardboard waste at the gates of the points of sale [kg] |
| RCC′′′ | Paper and cardboard waste post-consumption [kg] |
| RM′ | Non-ferrous metallic waste at the gates of the processing company [kg] |
| RM′′′ | Non-ferrous metallic waste post-consumption [kg] |
| RO | Brass rivets [kg] |
| RORG | Organic waste post-consumption [kg] |
| RP | Cleaning waste [kg] |
| RPL′ | Plastic waste at the gates of the processing company [kg] |
| RPL″ | Plastic waste at the gates of the points of sale [kg] |
| RPL′′′ | Plastic waste post-consumption [kg] |
| RPS | Bagged cleaning waste [kg] |
| RUF | Resource use, fossils [MJ] |
| RUMM | Resource use, minerals and metals [kg Sbe] |
| S | Cultivated area [ha/y] |
| SC | Scotch tape [kg] |
| SCA | Carton waste [kg] |
| SCAV | Cardboard collar waste [kg] |
| Sd | Seed density [kg/ha] |
| SDC | Solco Dritto chickpeas |
| SEC | Carton label waste [kg] |
| Seeds | Legume seeds intended for planting [kg] |
| SEP | Pallet label waste [kg] |
| SET | Label waste [kg] |
| SFP | Shrink film waste [kg] |
| SGP | Waste of cleaned legumes at primary packaging [kg] |
| SHS | Secondary hotspot |
| SP | Legume cleaning waste [kg] |
| SPAL | Semi-pallet seed waste [kg] |
| SPP | PP bag waste [kg] |
| SRO | Rivet waste [kg] |
| SS | PE super-sacks [kg] |
| SSC | Scotch tape waste [kg] |
| SSC | Scotch tape waste [kg] |
| SSU | Reused PE super-sacks for collecting cleaning waste [kg] |
| ST | Pulse soaking time [h] |
| T0 | Initial temperature [°C] |
| Tb | Boiling point of water [°C] |
| tBP | Time needed to bring the legume-water suspension to a boil [min] |
| tC | Cooking time for legumes [min] |
| tC,T | Total cooking time [min] |
| TE | Terrestrial eutrophication [mol Ne] |
| TPA | Texture Profile Analysis |
| TR | Transportation |
| UH | User’s house |
| WCC | Waste collection center |
| WD | Waste Collection Center |
| WU | Water use [m3 depriv.] |
| WUp | Water absorbed by cooked legumes [kg] |
| xP | Total protein content in legumes on a dry basis [g/g dm] |
| xS | Total starch content in legumes on a dry basis [g/g dm] |
| xWCP | Moisture content in cooked legumes [g/g] |
| xWS | Moisture content in soaked legumes [g/g] |
| xWSf | Final moisture content in soaked legumes [g/g] |
| yS | Cleaning waste percentage [%] |
| Greek Symbols | |
| ΔHgel | Enthalpy change associated with starch gelatinization in legumes [J/g] |
| ηC,H | Efficiency of the stove to bring cooking water to the boiling point [%] |
| ηC,over | Overall efficiency of the legume cooking process [%] |
Appendix A. Legume Cooking Energy Consumption

| Legume | xS [g/g dm] | xP [g/g dm] | ΔHgel [J/g] |
|---|---|---|---|
| SDC | 0.468 ± 0.006 | 0.223 ± 0.017 | 3.4 |
| GPB | 0.338 ± 0.017 | 0.227 ± 0.017 | 15.0 |
| LO | 0.509 ± 0.004 | 0.261 ± 0.020 | 10.9 |
| Hob Type | Knob Setting | ES [kJ] | ηE [%] |
|---|---|---|---|
| LPG hob | max | (1.972 ± 0.005) t | 54 ± 1 |
| min | (0.522 ± 0.001) t | ||
| Electric hob | max | (1.47 ± 0.03) t | 57.6 ± 0.1 |
| min | (0.54 ± 0.01) t | ||
| Induction hob | max | (1.919 ± 0.007) t | 75 ± 6 |
| min | (0.33 ± 0.01) t |
| Parameter | SDC | GPB | OL | MSDC | MGPB | MOL | Unit |
|---|---|---|---|---|---|---|---|
| mPD | 1.0 | 1.0 | 1.0 | 1.0 | 1.0 | 1.0 | [kg] |
| xW | 8.3 | 8.3 | 8.3 | 8.3 | 8.3 | 8.3 | [%] |
| mPDdm | 0.917 | 0.917 | 0.917 | 0.917 | 0.917 | 0.917 | [g/g] |
| mW,DP | 0.083 | 0.083 | 0.083 | 0.083 | 0.083 | 0.083 | [kg] |
| Soaking | Yes | Yes | No | No | No | No | |
| mWS | 4 | 4 | 0 | 0 | 0 | 0 | [kg] |
| xMSf | 0.55 | 0.55 | 0.083 | 0.083 | 0.083 | 0.083 | [g/g] |
| mPH | 2.038 | 2.038 | 1.000 | 1.0 | 1.0 | 1.0 | [kg] |
| mW,PH | 1.121 | 1.121 | 0.083 | 0.083 | 0.083 | 0.083 | [kg] |
| cpPI | 2.977 | 2.977 | 1.723 | 1.723 | 1.723 | 1.723 | [kJ kg−1 K−1] |
| mWR | 2.962 | 2.962 | 0.000 | 0.000 | 0.00 | 0.000 | [kg] |
| Cooking | Yes | Yes | Yes | Yes | Yes | Yes | |
| mWC | 4 | 4 | 4 | 4 | 4 | 4 | [kg] |
| xMCf | 0.65 | 0.65 | 0.72 | 0.65 | 0.65 | 0.72 | g/g |
| mPC | 2.62 | 2.62 | 3.275 | 2.62 | 2.62 | 3.275 | [kg] |
| mW,PC | 1.703 | 1.703 | 2.358 | 1.703 | 1.703 | 2.358 | [kg] |
| WUp | 0.582 | 0.582 | 2.275 | 1.620 | 1.620 | 2.275 | [kg] |
| mE | 0.200 | 0.200 | 0.200 | 0.200 | 0.200 | 0.200 | [kg] |
| mWRPC | 3.218 | 3.218 | 1.525 | 2.180 | 2.180 | 1.525 | [kg] |
| qSW | 1306.0 | 1306.0 | 1306.0 | 1306.0 | 1306.0 | 1306.0 | [kJ] |
| qSP | 473.2 | 473.2 | 134.4 | 134.4 | 134.4 | 134.4 | [kJ] |
| xS | 0.468 | 0.338 | 0.509 | 0.468 | 0.338 | 0.509 | [g/g dm] |
| ΔHgel | 3.4 | 15 | 10.9 | 3.4 | 15 | 10.9 | [kJ/kg] |
| qgel | 1.5 | 4.6 | 5.1 | 9.7 | 7.0 | 10.5 | [kJ] |
| EthBP | 0.494 | 0.494 | 0.400 | 0.400 | 0.400 | 0.400 | [kWh] |
| LPG hob | |||||||
| ηC,H | 54 | 54 | 54 | 54 | 54 | 54 | [%] |
| ES,BP | 3295 | 3295 | 2667 | 2667 | 2667 | 2667 | [kJ] |
| tBP | 27.8 | 27.8 | 22.5 | 22.5 | 22.5 | 22.5 | [min] |
| tC | 90 | 60 | 30 | 45 | 30 | 15 | [min] |
| ES,min | 2819 | 1879 | 940 | 1409 | 940 | 470 | [kJ] |
| ES | 1.70 | 1.44 | 1.00 | 1.13 | 1.00 | 0.87 | [kWh] |
| ηCover | 29 | 34 | 40 | 35 | 40 | 46 | [%] |
| Electric hob | |||||||
| ηC,H | 57.6 | 57.6 | 57.6 | 57.6 | 57.6 | 57.6 | [%] |
| ES,BP | 3089 | 3089 | 2501 | 2501 | 2501 | 2501 | [kJ] |
| tBP | 35.0 | 35.0 | 28.4 | 28.4 | 28.4 | 28.4 | [min] |
| tC | 90 | 60 | 30 | 45 | 30 | 15 | [min] |
| ES,min | 2916 | 1944 | 972 | 1458 | 972 | 486 | [kJ] |
| ES | 1.67 | 1.40 | 0.96 | 1.10 | 0.96 | 0.83 | [kWh] |
| ηCover | 30 | 35 | 42 | 36 | 42 | 48 | [%] |
| Induction hob | |||||||
| ηC,H | 75.0 | 75.0 | 75.0 | 75.0 | 75.0 | 75.0 | [%] |
| ES,BP | 2372 | 2372 | 1921 | 1921 | 1921 | 1921 | [kJ] |
| tBP | 20.6 | 20.6 | 16.7 | 16.7 | 16.7 | 16.7 | [min] |
| tC | 90 | 60 | 30 | 45 | 30 | 15 | [min] |
| ES,min | 1782 | 1188 | 594 | 891 | 594 | 297 | [kJ] |
| ES | 1.15 | 0.99 | 0.70 | 0.78 | 0.70 | 0.62 | [kWh] |
| ηCover | 43 | 50 | 57 | 51 | 57 | 65 | [%] |
References
- Abu-Ghannam, N.; Gowen, A. Pulse-based food products. Chp. 15. In Pulse Foods. Processing, Quality and Nutraceutical Applications, 2nd ed.; Tiwari, B.K., Gowen, A., McKenna, B., Eds.; Academic Press: London, UK, 2021; pp. 369–391. [Google Scholar]
- Maphosa, Y.; Jideani, V.A. The Role of Legumes in Human Nutrition. Chp. 6. In Functional Food—Improve Health through Adequate Food; Chávarri Hueda, M., Ed.; IntechOpen Ltd.: London, UK, 2017; pp. 103–121. Available online: https://www.intechopen.com/chapters/55808 (accessed on 16 February 2024).
- Nemecek, T.; von Richthofen, J.-S.; Dubois, G.; Casta, P.; Charles, R.; Pahl, H. Environmental impacts of introducing grain legumes into European crop rotations. Eur. J. Agron. 2008, 28, 380–393. [Google Scholar] [CrossRef]
- Rawal, V.; Navarro, D.K. The Global Economy of Pulses; FAO: Rome, Italy, 2019. [Google Scholar]
- de Almeida Costa, G.E.; Da Silva Queiroz-Monici, K.; Pissini Machado Reis, S.M.; De Oliveira, A.C. Chemical composition, dietary fibre and resistant starch contents of raw and cooked pea, common bean, chickpea and lentil legumes. Food Chem. 2006, 94, 327–330. [Google Scholar] [CrossRef]
- Gebrelibanos, M.; Tesfaye, D.; Raghavendra, Y.; Sintayeyu, B. Nutritional and health implications of legumes. Int. J. Pharm. Sci. Res. 2013, 4, 1269–1279. [Google Scholar]
- Didinger, C.; Thompson, H. Motivating pulse-centric eating patterns to benefit human and environmental well-being. Nutrients 2020, 12, 3500. [Google Scholar] [CrossRef] [PubMed]
- Henn, K.; Goddyn, H.; Olsen, S.B.; Bredie, W.L.P. Identifying behavioral and attitudinal barriers and drivers to promote consumption of pulses: A quantitative survey across five European countries. Food Qual. Prefer. 2022, 98, 104445. [Google Scholar] [CrossRef]
- Henn, K.; Zhang, X.; Thomsen, M.; Rinnan, Å.; Bredie, W.L.P. The versatility of pulses: Are consumption and consumer perception in different European countries related to the actual climate impact of different pulse types? Future Foods 2022, 6, 100202. [Google Scholar] [CrossRef]
- Jensen, E.S.; Peoples, M.B.; Boddey, R.M.; Gresshoff, P.M.; Hauggaard-Nielsen, H.; Alves, B.J.R.; Morrison, M.J. Legumes for mitigation of climate change and the provision of feedstock for biofuels and biorefineries. A review. Agron. Sustain. Dev. 2012, 32, 329–364. [Google Scholar] [CrossRef]
- MacWilliam, S.; Parker, D.; Marinangeli, C.; Trémorin, D. A meta-analysis ap- proach to examining the greenhouse gas implications of including dry peas (Pisum sativum L.) and lentils (Lens culinaris M.) in crop rotations in western Canada. Agric. Syst. 2018, 166, 101–110. [Google Scholar] [CrossRef]
- Preissel, S.; Reckling, M.; Schläfke, N.; Zander, P. Magnitude and farm-economic value of grain legume pre-crop benefits in Europe: A review. Field Crops Res. 2015, 175, 64–79. [Google Scholar] [CrossRef]
- Watson, C.A.; Reckling, M.; Preissel, S.; Bachinger, J.; Bergkvist, G.; Kuhlman, T.; Lind-ström, K.; Nemecek, T.; Topp, C.; Vanhatalo, A.; et al. Grain legume production and use in European agricultural systems. Adv. Agron. 2017, 144, 235–303. [Google Scholar]
- Leip, A.; Weiss, F.; Lesschen, J.P.; Westhoek, H. The nitrogen footprint of food products in the European Union. J. Agric. Sci. 2014, 152, S20–S33. [Google Scholar] [CrossRef]
- Sharma, N.; Sahu, J.K.; Joshi, S.; Khubber, S.; Bansal, V.; Bhardwaj, A.; Bangar, S.P.; Bal, L.M. Modulation of lentil antinutritional properties using non-thermal mediated processing techniques—A review. J. Food Compos. Anal. 2022, 109, 104498. [Google Scholar] [CrossRef]
- Das, G.; Sharma, A.; Sarkar, P.K. Conventional and emerging processing techniques for the post-harvest reduction of antinutrients in edible legumes. Appl. Food Res. 2022, 2, 100112. [Google Scholar] [CrossRef]
- Cimini, A.; Poliziani, A.; Morgante, L.; Moresi, M. Assessment of the malting process of Purgatory bean and Solco Dritto chickpea seeds. Foods 2023, 12, 3187. [Google Scholar] [CrossRef]
- Cimini, A.; Poliziani, A.; Morgante, L.; Moresi, M. Antinutrient removal in yellow lentils by malting. J. Sci. Food Agric. 2024, 104, 508–517. [Google Scholar] [CrossRef]
- Moresi, M.; Cibelli, M.; Cimini, A. Standard methods effectively useful to mitigate the environmental impact of food industry. In Environmental Impact of Agro-Food Industry and Food Consumption; Chpater 1; Galanakis, C., Ed.; Academic Press: San Diego, CA, USA, 2021; pp. 1–30. [Google Scholar] [CrossRef]
- BSI. PAS 2050: 2011. Specification for the Assessment of the Life Cycle Greenhouse Gas Emissions of Goods and Services; British Standards Institution: London, UK, 2011. [Google Scholar]
- Commission Recommendation (EU) 2021/2279 of 15 December 2021 on the use of the Environmental Footprint methods to measure and communicate the life cycle environmental performance of products and organisations. Off. J. Eur. Union 2021, L471/1, 1–396. Available online: https://eur-lex.europa.eu/legal-content/EN/TXT/PDF/?uri=CELEX:32021H2279 (accessed on 10 February 2024).
- Shahbandeh, M. Production Volume of Pulses Worldwide from 2010 to 2022. Statista. 2024. Available online: https://www.statista.com/statistics/721945/pulses-production-volume-worldwide/#statisticContainer (accessed on 10 February 2024).
- Confederazione dell’Industria Manifatturiera Italiana e dell’Impresa Privata. La Produzione di Legumi in Italia Riprende a Crescere; Confimi: Rome, Italy, 2018; Available online: https://www.confimi.it/pagina-iniziale/868-la-produzione-di-legumi-in-italia-riprende-a-crescere (accessed on 10 February 2024).
- Di Giovannantonio, C.; Catta, M.; Pica, G.; Casadei, G. Lazio Patrimonio Agroalimentare tra Biodiversità e Tradizione; ARSIAL: Rome, Italy, 2019. [Google Scholar]
- Slow Food Foundation for Biodiversity. Purgatory beans. n.d. Available online: https://www.fondazioneslowfood.com/en/ark-of-taste-slow-food/purgatory-beans/ (accessed on 10 February 2024).
- Slow Food Foundation for Biodiversity. Solco Dritto Chickpea. n.d. Available online: https://www.fondazioneslowfood.com/en/ark-of-taste-slow-food/solco-dritto-chickpea/ (accessed on 10 February 2024).
- Commission Implementing Regulation (EU) No. 2022/897 of 2 June 2022 Entering a Name in the Register of Protected Designations of Origin and Protected Geographical Indications (‘Lenticchia di Onano’, PGI). Off. J. Eur. Union 2022, 156, 2. Available online: https://eur-lex.europa.eu/eli/reg_impl/2022/897/oj (accessed on 10 February 2024).
- Cimini, A.; Poliziani, A.; Moresi, M. Effect of temperature on the hydration kinetics of chickpea (Cicer arietinum L.) and yellow soybean (Glycine max). Chem Engin Trans. 2021, 87, 31–36. [Google Scholar]
- Spano, M.; Di Matteo, G.; Giusti, A.M.; Donini, L.M.; Mannina, L.; Cimini, A. Application of NMR analysis for monitoring the malting effect on legume seeds. In Proceedings of the Oral communication at the 50th National Congress on Magnetic Resonance, University of Rome—La Sapienza, Rome, Italy, 6–8 September 2023. [Google Scholar]
- Cimini, A.; Poliziani, A.; Morgante, L.; Moresi, M. Cooking and nutritional characteristics of malted chickpeas. Chem. Eng. Trans. 2023, 102, 343–348. [Google Scholar] [CrossRef]
- Moga, V.T. Caratterizzazione ed Ottimizzazione del Processo di Cottura dei Legumi e Valutazione LCA (Characterization and Optimization of Legume Cooking Process and Life Cycle Assessment). Master’s Thesis, University of Tuscia, Viterbo, Italy, 2023. [Google Scholar]
- Cimini, A.; Poliziani, A.; Morgante, L.; Moresi, M. Use of malted pulses to formulate gluten-free fresh-egg pasta. Ital. J. Food Sci. 2024, 36, 105–115. [Google Scholar] [CrossRef]
- Commission Regulation (EU). No. 432/2012 of 16 May 2012 establishing a list of permitted health claims made on foods, other than those referring to the reduction of disease risk and to children’s development and health. Off. J. Eur. Union 2012, 136, 1–40. Available online: https://eur-lex.europa.eu/legal-content/EN/TXT/PDF/?uri=CELEX:02012R0432-20170822 (accessed on 10 February 2024).
- Abeliotis, K.; Detsis, V.; Pappia, C. Life cycle assessment of bean production in the Prespa National Park, Greece. J. Clean Prod. 2013, 41, 89–96. [Google Scholar] [CrossRef]
- Bamber, N.; Dutta, B.; Heidari, M.D.; Shiva Zargar, S.; Li, Y.; Tremorin, D.; Pelletier, N. Spatially resolved inventory and emissions modelling for pea and lentil life cycle assessment. Sustain. Prod. Consum 2022, 33, 738–755. [Google Scholar] [CrossRef]
- Elhami, B.; Khanali, M.; Akram, A. Combined application of Artificial Neural Networks and life cycle assessment in lentil farming in Iran. Inf. Process. Agric. 2017, 4, 18–32. [Google Scholar] [CrossRef]
- del Borghi, A.; Strazza, C.; Magrassi, F.; Taramasso, A.C.; Gallo, M. Life cycle assessment for eco-design of product-package systems in the food industry—The case of legumes. Sustain. Prod. Consum. 2018, 13, 24–36. [Google Scholar] [CrossRef]
- Bandekar, P.A.; Putman, B.; Thoma, G.; Matlock, M. Cradle-to-grave life cycle assessment of production and consumption of pulses in the United States. J. Environ. Manag. 2022, 302, 114062. [Google Scholar] [CrossRef]
- Tidåker, P.; Karlsson Potter, H.; Carlsson, G.; Röös, E. Towards sustainable consumption of legumes: How origin, processing and transport affect the environmental impact of pulses. Sustain. Prod. Consum 2021, 27, 496–508. [Google Scholar] [CrossRef]
- Aguilera, E.; Guzmán, G.; Alonso, A. Greenhouse gas emissions from conventional and organic cropping systems in Spain. I. Herbaceous crops. Agron. Sust. Dev. 2015, 35, 713–724. [Google Scholar] [CrossRef]
- Gustafson, D. Greenhouse gas emissions and irrigation water use in the production of pulse crops in the United States. Cogent Food Agric. 2017, 3, 13334750. [Google Scholar]
- ISO. 14040-Environmental Management and Life Cycle Assessment. Principles and Framework; International Organization for Standardization: Genève, Switzerland, 2006. [Google Scholar]
- ISO. 14044-Environmental Management—Life Cycle Assessment—Requirements and Guidelines; International Organization for Standardization: Genève, Switzerland, 2006. [Google Scholar]
- EcoInvent. Allocation, Cut-Off, EN15804. Available online: https://ecoinvent.org/the-ecoinvent-database/system-models/#!/allocation-cut-off (accessed on 12 December 2023).
- Hergoualc’h, K.; Akiyama, H.; Bernoux, M.; Chirinda, N.; del Prado, A.; Kasimir, Å.; Douglas MacDonald, J.; Ogle, S.M.; Regina, K.; van der Weerden, T.J. N2O emissions from managed soils, and CO2 emissions from lime and urea application. Chp. 11. In Agriculture, Forestry and other Land Use; 2019 Refinement to the 2006 IPCC Guidelines for National Greenhouse Gas Inventories; Intergovernmental Panel on Climate Change: Geneva, Switzerland, 2019; Volume 4, Available online: https://www.ipcc-nggip.iges.or.jp/public/2019rf/pdf/4_Volume4/19R_V4_Ch11_Soils_N2O_CO2.pdf (accessed on 12 February 2024).
- EPD®. Arable Crops. Product Category Classification: UN CPC 011, 014, 017, 019. Vrs. 2.01. 2020. Available online: https://api.environdec.com/api/v1/EPDLibrary/Files/85c58ec4-c10e-43e3-a974-f3977bf29037/Data (accessed on 12 February 2024).
- Bond, E.J. Manual of Fumigation for Insect Control; FAO Plant Production and Protection Paper 54; Food and Agriculture Organization of the United Nations: Rome, Italy, 1984; Available online: https://www.fao.org/3/x5042e/x5042E00.htm (accessed on 12 February 2024).
- Garry, V.F.; Lyubimov, A.V. Phosphine. In Handbook of Pesticide Toxicology, 2nd ed.; Krieger, R.I., Ed.; Academic Press: San Diego, CA, USA, 2001; Volume 2, pp. 1861–1866. [Google Scholar] [CrossRef]
- Tiwari, B.K.; Gowen, A.; McKenna, B. Pulse Foods. Processing, Quality and Nutraceutical Applications; Academic Press: Cambridge, MA, USA; Elsevier: London, UK, 2011. [Google Scholar]
- Annor, G.A.; Zhen, M.; Boye, J.I. Crops—Legumes. In Food Processing. Principles and Applications, 2nd ed.; Clark, S., Jung, S., Lamsal, B., Eds.; JohnWiley & Sons, Ltd.: Hoboken, NJ, USA, 2014; pp. 305–337. [Google Scholar]
- Brizi, G. (Il Cerqueto Srl, Acquapendente, Italy). Personal communication, 2023.
- Nartea, A.; Kuhalskaya, A.; Fanesi, B.; Orhotohwo, O.L.; Susek, K.; Rocchetti, L.; Di Vittori, V.; Bitocchi, E.; Pacetti, D.; Papa, R. Legume byproducts as ingredients for food ap-plications: Preparation, nutrition, bioactivity, and techno-functional properties. Compr. Rev. Food Sci. Food Saf. 2023, 22, 1953–1985. [Google Scholar] [CrossRef]
- Wang, N.; Panozzo, J.F.; Wood, J.; Malcolmson, L.J.; Arganosa, G.C.; Baik, B.-K.; Driedger, D.; Han, J. AACCI approved methods Technical Committee report: Collaborative study on a method for determining firmness of cooked pulses (AACC Interna-tional Method 56-36.01). Cereal Foods World 2012, 57, 230–234. [Google Scholar] [CrossRef]
- Kajumba, P.K.; Okello, D.; Nyeinga, K.; Nydal, O.J. Assessment of the energy needs for cooking local food in Uganda: A strategy for sizing thermal energy storage with cook-er system. Energy Sustain. Dev. 2022, 67, 67–80. [Google Scholar] [CrossRef]
- Kinyanjui, P.K.; Njoroge, D.M.; Makokha, A.O.; Christiaens, S.; Ndaka, D.S.; Hendrickx, M. Hydration properties and texture fingerprints of easy- and hard-to-cook bean varieties. Food Sci. Nutr. 2015, 3, 39–47. [Google Scholar] [CrossRef] [PubMed]
- Singh, N. Functional and physicochemical properties of pulse starch. In Pulse Foods. Processing, Quality and Nutraceutical Applications, 2nd ed.; Tiwari, B.K., Gowen, A., McKenna, B., Eds.; Academic Press: London, UK, 2021; pp. 87–112. [Google Scholar] [CrossRef]
- Biliaderis, C.G.; Maurice, T.J.; Vose, J.R. Starch gelatinization phenomena studied by differential scanning calorimetry. J. Food Sci. 1980, 45, 1669–1674. [Google Scholar] [CrossRef]
- Cimini, A.; Moresi, M. Energy efficiency and carbon footprint of home pasta cooking appliances. J. Food Eng. 2017, 204, 8–17. [Google Scholar] [CrossRef]
- Nosworthy, M.G.; Neufeld, J.; Frohlich, P.; Young, G.; Malcolmson, L.; House, J.D. Determination of the protein quality of cooked Canadian pulses. Food Sci. Nutr. 2017, 5, 896–903. [Google Scholar] [CrossRef]
- Unions de Associations de Fabricants de Pâtes Alimentaires. Product Environmental Footprint Category Rules (PEFCR) for Dry Pasta. Vers. 3. 2018, p. 37. Available online: http://ec.europa.eu/environment/eussd/smgp/pdf/Dry%20pasta%20PEFCR_final.pdf (accessed on 12 February 2024).
- SINU (Società Italiana di Nutrizione Umana). Standard quantitativi delle porzioni. In LARN—Livelli di Assunzione di Riferimento di Nutrienti ed Energia per la Popolazione Italiana; IV Revisione; SICS Editore Srl: Milan, Italy, 2014; p. 10. Available online: https://sinu.it/wp-content/uploads/2019/07/20141111_LARN_Porzioni.pdf (accessed on 12 February 2024).
- Martin, S.; Bunsen, J.; Ciroth, A. Openlca (1.7.2). Case Study: Ceramic Cup vs Paper Cup; GreenDelta GmbH: Berlin, Germany, 2018; Available online: https://www.openlca.org/wp-content/uploads/2018/09/comparative_assessment_openLCA_coffee_mugs.pdf (accessed on 12 February 2024).
- Rahat, R. How Long do Ceramic Plates Last? (Facts to Know before Buying!). Interiorgap. 2022. Available online: https://interiorgap.com/how-long-do-ceramic-plates-last/ (accessed on 12 February 2024).
- Ronchi, E.; Nepi, M.L. L’Italia del riciclo 2021. Fondazione per lo Sviluppo Sostenibile, FISE UNICIRCULAR, Rome, Italy. 2021. Available online: https://www.fondazionesvilupposostenibile.org/wp-content/uploads/ITALIA_DEL_RICICLO_2021_web.pdf (accessed on 12 February 2024).
- Adella, L.; Aragona, G.; D’Alessandro, P.; Ermili, S.; Frittelloni, V.; Lanz, A.M.; Lupica, I.; Minniti, F. Gestione dei rifiuti urbani. In Rapporto Rifiuti Urbani. Edizione 2020. Rapporti 331/2020; ISPRA: Rome, Italy, 2020; pp. 73–175. Available online: https://www.isprambiente.gov.it/files2020/pubblicazioni/rapporti/rapportorifiutiurbani_ed-2020_n-331-1.pdf (accessed on 12 February 2024).
- SRD. Treatment of Municipal Solid Urban Waste in Italy 2022, by Method. Statista Research Department. 2024. Available online: https://www.statista.com/statistics/682944/management-of-solid-urban-waste-in-italy-by-treatment/#statisticContainer (accessed on 12 February 2024).
- EPD®. Uncooked Pasta, not Stuffed or Otherwise Prepared. Product Category Classification: UN CPC 2371. Vers. 4.0.3. 2022. Available online: https://epd-portal-api.azurewebsites.net/api/v1/EPDLibrary/Files/085f5d0d-0511-47f4-f744-08dae3459152/Data (accessed on 12 February 2024).
- USDA Economic Research Service. Food Availability (Per Capita) Data System. Loss-Adjusted Food Availability, Vegetables, 9.23.2022. 2022. Available online: https://www.ers.usda.gov/data-products/food-availability-per-capita-data-system/ (accessed on 12 February 2024).
- Fondazione Barilla. Lo Spreco Alimentare: Cause, Impatti e Proposte; Barilla Center for Food & Nutrition: Parma, Italy, 2012; Available online: https://www.fondazionebarilla.com/wp-content/uploads/2022/05/Lo-spreco-alimentare-Cause-impatti-proposte.pdf (accessed on 12 February 2024).
- FAO. Agribusiness Handbook. Barley, Malt, Beer; Food and Agriculture Organization of the United Nations: Rome, Italy, 2009; pp. 17–25. Available online: https://www.fao.org/3/i1003e/i1003e00.htm (accessed on 12 February 2024).
- Stewart, D. Emissions, energy, water and malt. Brew. Distill. Int. 2010, 6, 38–41. [Google Scholar]
- Myhre, G.; Shindell, D.; Bréon, F.-M.; Collins, W.; Fuglestvedt, J.; Huang, J.; Koch, D.; La-marque, J.-F.; Lee, D.; Mendoza, B.; et al. Anthropogenic and natural radiative forcing. Chp. 8. In Climate Change 2013: The physical science basis. Contribution of Working Group I to the Fifth Assessment Report of the Intergovernmental Panel on Climate Change; Stocker, T.F., Qin, D., Plattner, G.-K., Tignor, M., Allen, S.K., Boschung, J., Nauels, A., Xia, Y., Bex, V., Midgley, P.M., Eds.; Cambridge University Press: Cambridge, UK; New York, NY, USA, 2013; pp. 731–738. Available online: https://www.ipcc.ch/site/assets/uploads/2018/02/WG1AR5_Chapter08_FINAL.pdf (accessed on 12 February 2024).
- WMO Scientific Assessment of Ozone Depletion: 1998. Global Ozone Research and Monitoring Project—Report No. 44; World Meteorological Organization: Geneva, Switzerland, 1999. [Google Scholar]
- Frischknecht, R.; Braunschweig, A.; Hofstetter, P.; Suter, P. Human health damages due to ionising radiation in life cycle impact assessment. Environ. Impact Assess. Rev. 2000, 20, 159–189. [Google Scholar] [CrossRef]
- van Zelm, R.; Huijbregts, M.A.J.; den Hollander, H.A.; van Jaarsveld, H.A.; Sauter, F.J.; Struijs, J.; van Wijnen, H.J.; van de Meent, D. European characterisation factors for human health damage of PM10 and ozone in life cycle impact assessment. Atmos. Environ. 2008, 42, 441–453. [Google Scholar] [CrossRef]
- Fantke, P.; Evans, J.; Hodas, N.; Apte, J.; Jantunen, M.; Jolliet, O.; McKone, T.E. Health impacts of fine particulate matter. In Global Guidance for Life Cycle Impact Assessment Indicators; Frischknecht, R., Jolliet, O., Eds.; UNEP/SETAC Life Cycle Initiative: Paris, France, 2016; Volume 1, pp. 76–99. [Google Scholar]
- Posch, M.; Seppälä, J.; Hettelingh, J.P.; Johansson, M.; Margni, M.; Jolliet, O. The role of atmospheric dispersion models and ecosystem sensitivity in the determination of characterisation factors for acidifying and eutrophying emissions in LCIA. Int. J. Life Cycle Assess. 2008, 13, 477–486. [Google Scholar] [CrossRef]
- Struijs, J.; Beusen, A.; van Jaarsveld, H.; Huijbregts, M.A.J. Aquatic eutrophication. Chp. 6. In ReCiPe 2008—A Life Cycle Impact Assessment Method Which Comprises Harmonised Category Indicators at the Midpoint and the Endpoint Level. Report I: Characterisation Factors, 1st ed.; Goedkoop, M., Heijungs, R., Huijbregts, M.A.J., De Schryver, A., Struijs, J., van Zelm, R., Eds.; VROM: Amsterdam, The Netherlands, 2009; pp. 59–67. Available online: https://www.leidenuniv.nl/cml/ssp/publications/recipe_characterisation.pdf (accessed on 12 February 2024).
- Rosenbaum, R.K.; Bachmann, T.M.; Gold, L.S.; Huijbregts, M.A.J.; Jolliet, O.; Juraske, R.; Köhler, A.; Larsen, H.F.; MacLeod, M.; Margni, M.; et al. USEtox—The UNEP-SETAC toxicity model: Recommended characterisation factors for human toxicity and freshwater ecotoxicity in Life Cycle Impact Assessment. Int. J. Life Cycle Assess. 2008, 13, 532–546. [Google Scholar] [CrossRef]
- Bos, U.; Horn, R.; Beck, T.; Lindner, J.P.; Fischer, M. LANCA®—Characterisation factors for Life Cycle Impact Assessment, Version 2.0; Fraunhofer Verlag: Stuttgart, Germany, 2016. [Google Scholar]
- Boulay, A.-M.; Bare, J.; Benini, L.; Berger, M.; Lathuillière, M.J.; Manzardo, A.; Margni, M.; Motoshita, M.; Núñez, M.; Valerie-Pastor, A.; et al. The WULCA consensus characterization model for water scarcity footprints: Assessing impacts of water consumption based on available water remaining (AWARE). Int. J. Life Cycle Assess. 2018, 23, 368–378. [Google Scholar] [CrossRef]
- van Oers, L.; de Koning, A.; Guinee, J.B.; Huppes, G. Abiotic Resource Depletion in LCA; Road and Hydraulic Engineering Institute, Ministry of Transport and Water: Amsterdam, The Netherlands, 2002. [Google Scholar]
- Sala, S.; Crenna, E.; Secchi, M.; Pant, R. Global Normalisation Factors for the Environmental Footprint and Life Cycle Assessment; JRC Scientific Report; Publications Office of the European Union: Luxembourg, 2017; Available online: https://op.europa.eu/en/publication-detail/-/publication/3ec9e2cb-f1cc-11e7-9749-01aa75ed71a1/language-en (accessed on 12 February 2024).
- Sala, S.; Cerutti, A.K.; Pant, R. Development of a Weighting Approach for the Environmental Footprint; Publications Office of the European Union: Luxembourg, 2018; Available online: https://op.europa.eu/en/publication-detail/-/publication/6c24e876-4833-11e8-be1d-01aa75ed71a1/language-en (accessed on 12 February 2024).
- Theodoridis, S. Monte Carlo methods. Chp. 14. In Machine Learning. A Bayesian and Optimization Perspective; Academic Press: London, UK, 2015; pp. 707–744. [Google Scholar]
- Schmidt, M. The Sankey diagram in energy and material flow management—Part II: Methodology and current applications. J. Ind. Ecol. 2008, 12, 173–185. [Google Scholar] [CrossRef]
- Huijbregts, M.A.J.; Hellweg, S.; Frischknecht, R.; Hendriks, H.W.M.; Hungerbühler, K.; Hendriks, A.J. Cumulative energy demand as predictor for the environmental burden of commodity production. Environ. Sci. Technol. 2010, 44, 2189–2196. [Google Scholar] [CrossRef]
- Huijbregts, M.A.J.; Rombouts, L.J.A.; Hellweg, S.; Frischknecht, R.; Hendriks, A.J.; van de Meent, D.; Ragas, A.M.J.; Reijnders, L.; Struijs, J. Is cumulative fossil energy demand a useful indicator for the environmental performance of products? Environ. Sci. Technol. 2006, 40, 641–648. [Google Scholar] [CrossRef] [PubMed]
- Farooq, M.; Gogoi, N.; Barthakur, S.; Baroowa, B.; Bharadwaj, N.; Alghamdi, S.S.; Siddique, K.H.M. Drought stress in grain legumes during reproduction and grain filling. J. Agron. Crop Sci. 2017, 203, 81–102. [Google Scholar] [CrossRef]
- Nadeen, M.; Li, J.; Yahya, M.; Sher, A.; Ma, C.; Wang, X.; Qiu, L. Research progress and perspective on drought stress in legumes: A review. Intl. J. Mol. Sci. 2019, 20, 2541. [Google Scholar] [CrossRef]
- Beebe, S.E.; Rao, I.M.; Blair, M.W.; Acosta-Gallegos, J.A. Phenotyping common beans for adaptation to drought. Front. Physiol. 2013, 4, 35. [Google Scholar] [CrossRef]
- Baqer Hussaini, S.M.; Sidle, R.C.; Kazimi, Z.; Khan, A.A.; Rezaei, A.Q.; Ghulami, Z.; Buda, T.; Rastagar, R.; Fatimi, A.A.; Muhmmadi, Z. Drought tolerant varieties of common beans (Phaseolus vulgaris) in Central Afghanistan. Agronomy 2021, 11, 2181. [Google Scholar] [CrossRef]
- Porch, T.G.; Ramirez, V.H.; Santana, D.; Harmsen, E.W. Evaluation of common bean for drought tolerance in Juana Diaz, Puerto Rico. J. Agron. Crop. Sci. 2009, 195, 328–334. [Google Scholar] [CrossRef]
- European Union (EU). Regulation (EU) 2019/631 of the European Parliament and of the Council of 17 April 2019 setting CO2 emission performance standards for new passenger cars and for new light commercial vehicles and repealing Regulations (EC) No 443/2009 and (EU) No 510/2011. Off. J. Eur. Union 2019, 111/113, 13–53. Available online: http://data.europa.eu/eli/reg/2019/631/oj (accessed on 12 February 2024).


| Component | SDC | MDSDC | GPB | MGPB | OL | MDOL | Unit |
|---|---|---|---|---|---|---|---|
| Raw Protein | 22.3 ± 1.7 | 23.6 ± 1.9 | 22.7 ± 1.7 | 23.4 ± 2.1 | 26.1 ± 2.0 | 28.7 ± 2.2 | g/100 g dm |
| Total Starch | 46.8 ± 0.6 | 45.2 ± 2.0 | 33.81 ± 1.66 | 34.96 ± 0.19 | 50.9 ± 0.4 | 52.1 ± 2.8 | g/100 g dm |
| Resistant Starch | 1.77 ± 0.22 | 1.19 ± 0.43 | 23.59 ± 0.34 | 22.0 ± 1.8 | 2.30 ± 0.17 | 1.88 ± 0.47 | g/100 g dm |
| Phytic Acid | 1.15 ± 0.12 | 0.79 ± 0.09 | 1.15 ± 0.12 | 0.78 ± 0.13 | 1.09 ± 0.09 | 0.80 ± 0.02 | g/100 g dm |
| Raffinose | 3.80 ± 0.15 | 1.65 ± 0.11 | 5.31 ± 0.28 | 1.95 ± 0.20 | 3.78 ± 0.04 | 0.79 ± 0.07 | g/100 g dm |
| Legume | SDC | GPB | OL | Unit |
|---|---|---|---|---|
| Overall cultivation area | 10 | 7–10 | 30 | ha |
| Fallow area | 0 | 0 | 0 | ha |
| Town | Acquapendente (Italy) | - | ||
| Latitude | 42.73661556684243 | DD | ||
| Longitude | 11.891832053277597 | DD | ||
| Altitude | 438 | asl m | ||
| Minimum grain yield | 1.11 | 0.78 | 0.93 | Mg/ha |
| Maximum grain yield | 2.35 | 1.76 | 1.67 | Mg/ha |
| Average grain yield | 1.71 | 1.26 | 1.26 | Mg/ha |
| Above ground biomass use | 100% left in the field after shredding | % | ||
| Below-ground biomass use | 100% left in the field after shredding | % | ||
| Seed density | 130 | 100 | 100 | kg/ha |
| 20-20-20 fertilizer | 100 | 100 | 20 | kg/ha |
| 4-4-4 poultry manure | 200 | 200 | 200 | kg/ha |
| Herbicide (Feinzin) | 0.125 | 0.125 | 0.125 | kg/ha |
| Irrigation water withdrawn from the Val di Paglia Consortium | - | 700–800 | - | m3/ha |
| Overall diesel fuel consumption | 90–120 | L/ha | ||
| Agricultural machinery lubricant oil consumption | 1 | L/ha | ||
| Storage | in loco | |||
| Transportation mode | Tractor with a 10 Mg trailer | |||
| Field-to-harvester distance | 0–4 | km | ||
| Pulse moisture content resulting from solar drying | 0.12 | g/g | ||
| Legume | SDC | GPB | OL | Unit | |
|---|---|---|---|---|---|
| Parameter | |||||
| Minimum–maximum cleaning waste range | 10–15 | 10–15 | 25–40 | % | |
| Average cleaning waste | 12.5 | 12.5 | 32.5 | % | |
| - Dust fraction | 2 | 3 | 5 | % | |
| - Grass and insect fraction | 6 | 5 | 15 | % | |
| - Broken legumes, etc., fraction | 4.5 | 4.5 | 12.5 | % | |
| Average cleaned grain yield | 1.5 | 1.1 | 0.85 | Mg/ha | |
| Packaging Type | Technical Specifications | Unit |
|---|---|---|
| Primary Packaging | PP bags | |
| Mass of dried pulses | 500 | g |
| Mass of a PP bag | 5.0 ± 0.3 | g |
| Width × Depth × Height | 80 × 50 × 200 | mm × mm × mm |
| Thickness | 100 | mm |
| Mass of cardboard collar | 5.8 | g |
| Mass of brass rivets | no. 2 × 0.33 | g |
| Mass of adhesive paper label | 0.323 | g |
| Massa of gaseous N2 | 5.0 | g |
| Primary packaging overall mass | 516.5 | g |
| Secondary Packaging | Cardboard carton | |
| No. of primary packages | 12 | - |
| Length × Width × Height | 380 × 280 × 120 | mm × mm × mm |
| Carton mass | 302 ± 3 | g |
| Mass of adhesive label for cartons | 2.0 | g |
| Mass of scotch tape | 4.0 | g |
| Mass of dry pulses per carton | 6.00 | kg |
| Secondary packaging overall mass | 6.505 | kg |
| Tertiary Packaging | PP Semi-pallet | |
| Semi-pallet mass | 5 | kg |
| Length × Width × Height | 600 × 800 × 144 | mm × mm × mm |
| No. of cartons per layer | 4 | - |
| No. of layers per pallet | 6 | - |
| Overall height of pallet | 0.864 | m |
| Paper label per pallet | no. 2 × (3.108 ± 0.05) | g |
| Stretch-and-shrink PE film | 287 | g |
| Mass of dried pulses per pallet | 144 | kg |
| Tertiary packaging overall mass | 161.42 | kg |
| Input/Output Materials | From | To | Means of Transport | Load Capacity [Mg] | Distance [km] |
|---|---|---|---|---|---|
| Seeds | PS | Field | LCV | 1.3 | 25 |
| NPK Fertilizer | PS | Field | LCV | 1.3 | 100 |
| Poultry Manure | PS | Field | LCV | 1.3 | 100 |
| Herbicide | PS | Field | LCV | 1.3 | 25 |
| Diesel Fuel | PS | Field | LCV | 1.3 | 25 |
| Lubricant Oil | PS | Field | LCV | 1.3 | 25 |
| Fresh Pulse Grain | Field | FG | Tractor and Trailer | 10 | 4 |
| Cleaning Waste | FG | CaF | Tractor and Trailer | 10 | 50 |
| AlP | PS | FG | LCV | 1.3 | 280 |
| PE Super-sacks | PS | FG | LCV | 1.3 | 355 |
| Gaseous N2 | PS | FG | Euro5 HRT | 10 | 35 |
| Cardboard Collars | PS | FG | LCV | 1.3 | 30 |
| Brass Rivets | PS | FG | LCV | 1.3 | 200 |
| Cartons | PS | FG | Euro5 HRT | 13.9 | 105 |
| Paper Labels | PS | FG | LCV | 1.3 | 30 |
| PP bags, PE films, Scotch Tape | PS | FG | Euro5 HRT | 13.9 | 200 |
| PP Semi-pallet | PS | FG | Euro5 HRT | 13.9 | 200 |
| Palletized Dried Pulses | FG | PoS | LCV | 1.3 | 150 |
| Dust and Herbs (PO + E) | FG | Field | Tractor and Trailer | 10 | 4 |
| Packaging or Organic Waste | FG, R or UH | WCC | MWCS | 13.9 | 50 |
| Phase | Soaking | Cooking | |||||||||
|---|---|---|---|---|---|---|---|---|---|---|---|
| Legume | AS | MD | AS | MD | |||||||
| WPR * | ST | WPR # | LCT | ECT | eC | ECT | eC | ||||
| [L/kg] | [h] | [L/kg] | [min] | [min] | [kWh/kg] | [min] | [kWh/kg] | ||||
| SDC | Yes | 4 | 16–24 | No | 4 | 90 Ɉ | 90 | 1.68 | 45 ɸ | 1.12 | |
| GPB | Yes | 4 | 16–24 | No | 4 | 80 § | 60 | 1.42 | 30 ɸ | 0.98 | |
| OL | No | - | - | No | 4 | 16 ¥ | 30 ɸ | 0.98 | 15 ɸ | 0.85 | |
| Waste Management Scenario | Landfill [%] | Recycling [%] | Incineration [%] | References |
|---|---|---|---|---|
| Non-ferrous metal waste | 25.4 | 68.1 | 6.5 | [64] |
| Organic waste | 31 | 51 | 18 | [65,66] |
| Paper and cardboard waste | 5.2 | 87.3 | 7.5 | [64] |
| Plastic waste | 7.4 | 45.6 | 47.0 | [64] |
| ICj | SDC | GPB | OL | Unit | ||||||
|---|---|---|---|---|---|---|---|---|---|---|
| PHS | % | ICj Score | PHS | % | ICj Score | PHS | % | ICj Score | ||
| CC | FE | 32 | 5.9 × 10⁻¹ ± 9.7 × 10⁻² b | DFLO | 36 | 7.3 × 10⁻¹ ± 1.3 × 10⁻¹ a | DFLO | 46 | 5.7 × 10⁻¹ ± 4.1 × 10⁻² c | kg CO2e |
| OD | Sd | 60 | 1.2 × 10⁻⁸ ± 1.8 × 10⁻⁹ a | Sd | 41 | 1.1 × 10⁻⁸ ± 1.8 × 10⁻⁹ b | Sd | 47 | 6.6 × 10⁻⁹ ± 1.5 × 10⁻⁸ c | kg CFC11e |
| IR | Fert | 51 | 1.2 × 10⁻² ± 1.8 × 10⁻³ b | Fert | 59 | 1.4 × 10⁻² ± 2.3 × 10⁻³ a | Sd | 32 | 6.6 × 10⁻³ ± 1.0 × 10⁻² c | kBq 235Ue |
| PhOF | DFLO | 77 | 4.0 × 10⁻³ ± 6.4 × 10⁻⁴ c | DFLO | 81 | 5.2 × 10⁻³ ± 8.8 × 10⁻⁴ a | DFLO | 89 | 4.6 × 10⁻³ ± 8.8 × 10⁻⁴ b | kg NMVOCe |
| PM | DFLO | 79 | 5.5 × 10⁻⁸ ± 8.9 × 10⁻⁹ c | DFLO | 75 | 7.9 × 10⁻⁸ ± 1.3 × 10⁻⁸ a | DFLO | 90 | 6.5 × 10⁻⁸ ± 1.1 × 10⁻⁸ b | disease inc. |
| A | DFLO | 67 | 3.3 × 10⁻³ ± 5.2 × 10⁻⁴ c | DFLO | 70 | 4.3 × 10⁻³ ± 7.2 × 10⁻⁴ a | DFLO | 86 | 3.5 × 10⁻³ ± 7.8 × 10⁻⁴ b | mol H+e |
| FWE | Fert | 52 | 3.5 × 10⁻⁵ ± 5.4 × 10⁻⁶ c | Fert | 63 | 4.0 × 10⁻⁵ ± 6.5 × 10⁻⁶ b | TR | 36 | 1.7 × 10⁻⁵ ± 2.1 × 10⁻⁶ a | kg Pe |
| ME | DFLO | 81 | 1.4 × 10⁻³ ± 2.2 × 10⁻⁴ c | DFLO | 83 | 1.8 × 10⁻³ ± 3.1 × 10⁻⁴ a | DFLO | 92 | 1.6 × 10⁻³ ± 3.0 × 10⁻⁴ b | kg Ne |
| TE | DFLO | 76 | 1.6 × 10⁻² ± 2.5 × 10⁻³ c | DFLO | 70 | 2.4 × 10⁻² ± 4.0 × 10⁻³ a | DFLO | 90 | 1.8 × 10⁻² ± 3.2 × 10⁻³ b | mol Ne |
| ETFW | Sd | 90 | 8.2 × 101 ± 1.3 × 101 a | Sd | 86 | 8.2 × 101 ± 1.4 × 101 a | Sd | 96 | 1.4 × 10² ± 6.0 × 10² b | CTUe |
| C-HT | Sd | 39 | 2.5 × 10⁻¹⁰ ± 3.9 × 10⁻¹¹ b | TR | 34 | 2.9 × 10⁻¹⁰ ± 4.7 × 10⁻¹¹ a | TR | 38 | 1.9 × 10⁻¹⁰ ± 2.7 × 10⁻¹⁰ c | CTUh |
| NC-HT | Sd | 77 | 1.1 × 10⁻⁸ ± 1.6 × 10⁻⁹ b | Sd | 75 | 1.3 × 10⁻⁸ ± 2.3 × 10⁻⁹ a | Sd | 81 | 1.1 × 10⁻⁸ ± 4.0 × 10⁻⁸ c | CTUh |
| LU | FE | 98 | 5.3 × 10² ± 8.1 × 101 c | FE | 95 | 7.4 × 10² ± 1.2 × 10² a | FE | 98 | 7.0 × 10² ± 1.0 × 10² b | Pt |
| WU | Sd | 91 | 2.0 × 10⁻¹ ± 3.2 × 10⁻² b | FE | 100 | 2.7 × 101 ± 4.5 × 100 a | DFLO | 77 | 1.8 × 10⁻² ± 4.4 × 10⁻³ c | m3 depriv. |
| RUF | DFLO | ~100 | 2.6 × 100 ± 4.3 × 10⁻¹ c | DFLO | ~100 | 3.6 × 100 ± 6.2 × 10⁻¹ a | DFLO | ~100 | 3.5 × 100 ± 4.7 × 10⁻¹ b | MJ |
| RUMM | Fert | 48 | 2.2 × 10⁻⁶ ± 3.4 × 10⁻⁷ b | Fert | 60 | 2.4 × 10⁻⁶ ± 3.9 × 10⁻⁷ a | TR | 39 | 9.7 × 10⁻⁷ ± 1.3 × 10⁻⁶ c | kg Sbe |
| ICj | SDC | GPB | OL | |||
|---|---|---|---|---|---|---|
| [μPt] | [%] | [μPt] | [%] | [μPt] | [%] | |
| CC | 17.3 ± 3.0 | 16.7% | 21.5 ± 4.0 | 6.1% | 17.2 ± 18.4 | 14.1% |
| OD | 0.015 ± 0.002 | 0.01% | 0.014 ± 0.002 | 0.004% | 0.01 ± 0.03 | 0.01% |
| IR | 0.015 ± 0.002 | 0.1% | 0.18 ± 0.03 | 0.1% | 0.09 ± 0.20 | 0.1% |
| PhOF | 5.0 ± 0.8 | 4.8% | 6.5 ± 1.1 | 1.8% | 5.8 ± 1.5 | 4.7% |
| PM | 8.9 ± 1.5 | 8.6% | 12.7 ± 2.2 | 3.6% | 10.4 ± 2.3 | 8.5% |
| A | 3.9 ± 0.6 | 3.8% | 5.1 ± 0.9 | 1.4% | 4.1 ± 1.3 | 3.4% |
| ME | 2.2 ± 0.4 | 2.1% | 2.9 ± 0.5 | 0.8% | 2.6 ± 0.6 | 2.1% |
| FWE | 0.6 ± 0.1 | 0.6% | 0.7 ± 0.1 | 0.2% | 0.3 ± 0.6 | 0.3% |
| TE | 3.5 ± 0.6 | 3.4% | 5.2 ± 0.9 | 1.5% | 4.0 ± 0.9 | 3.2% |
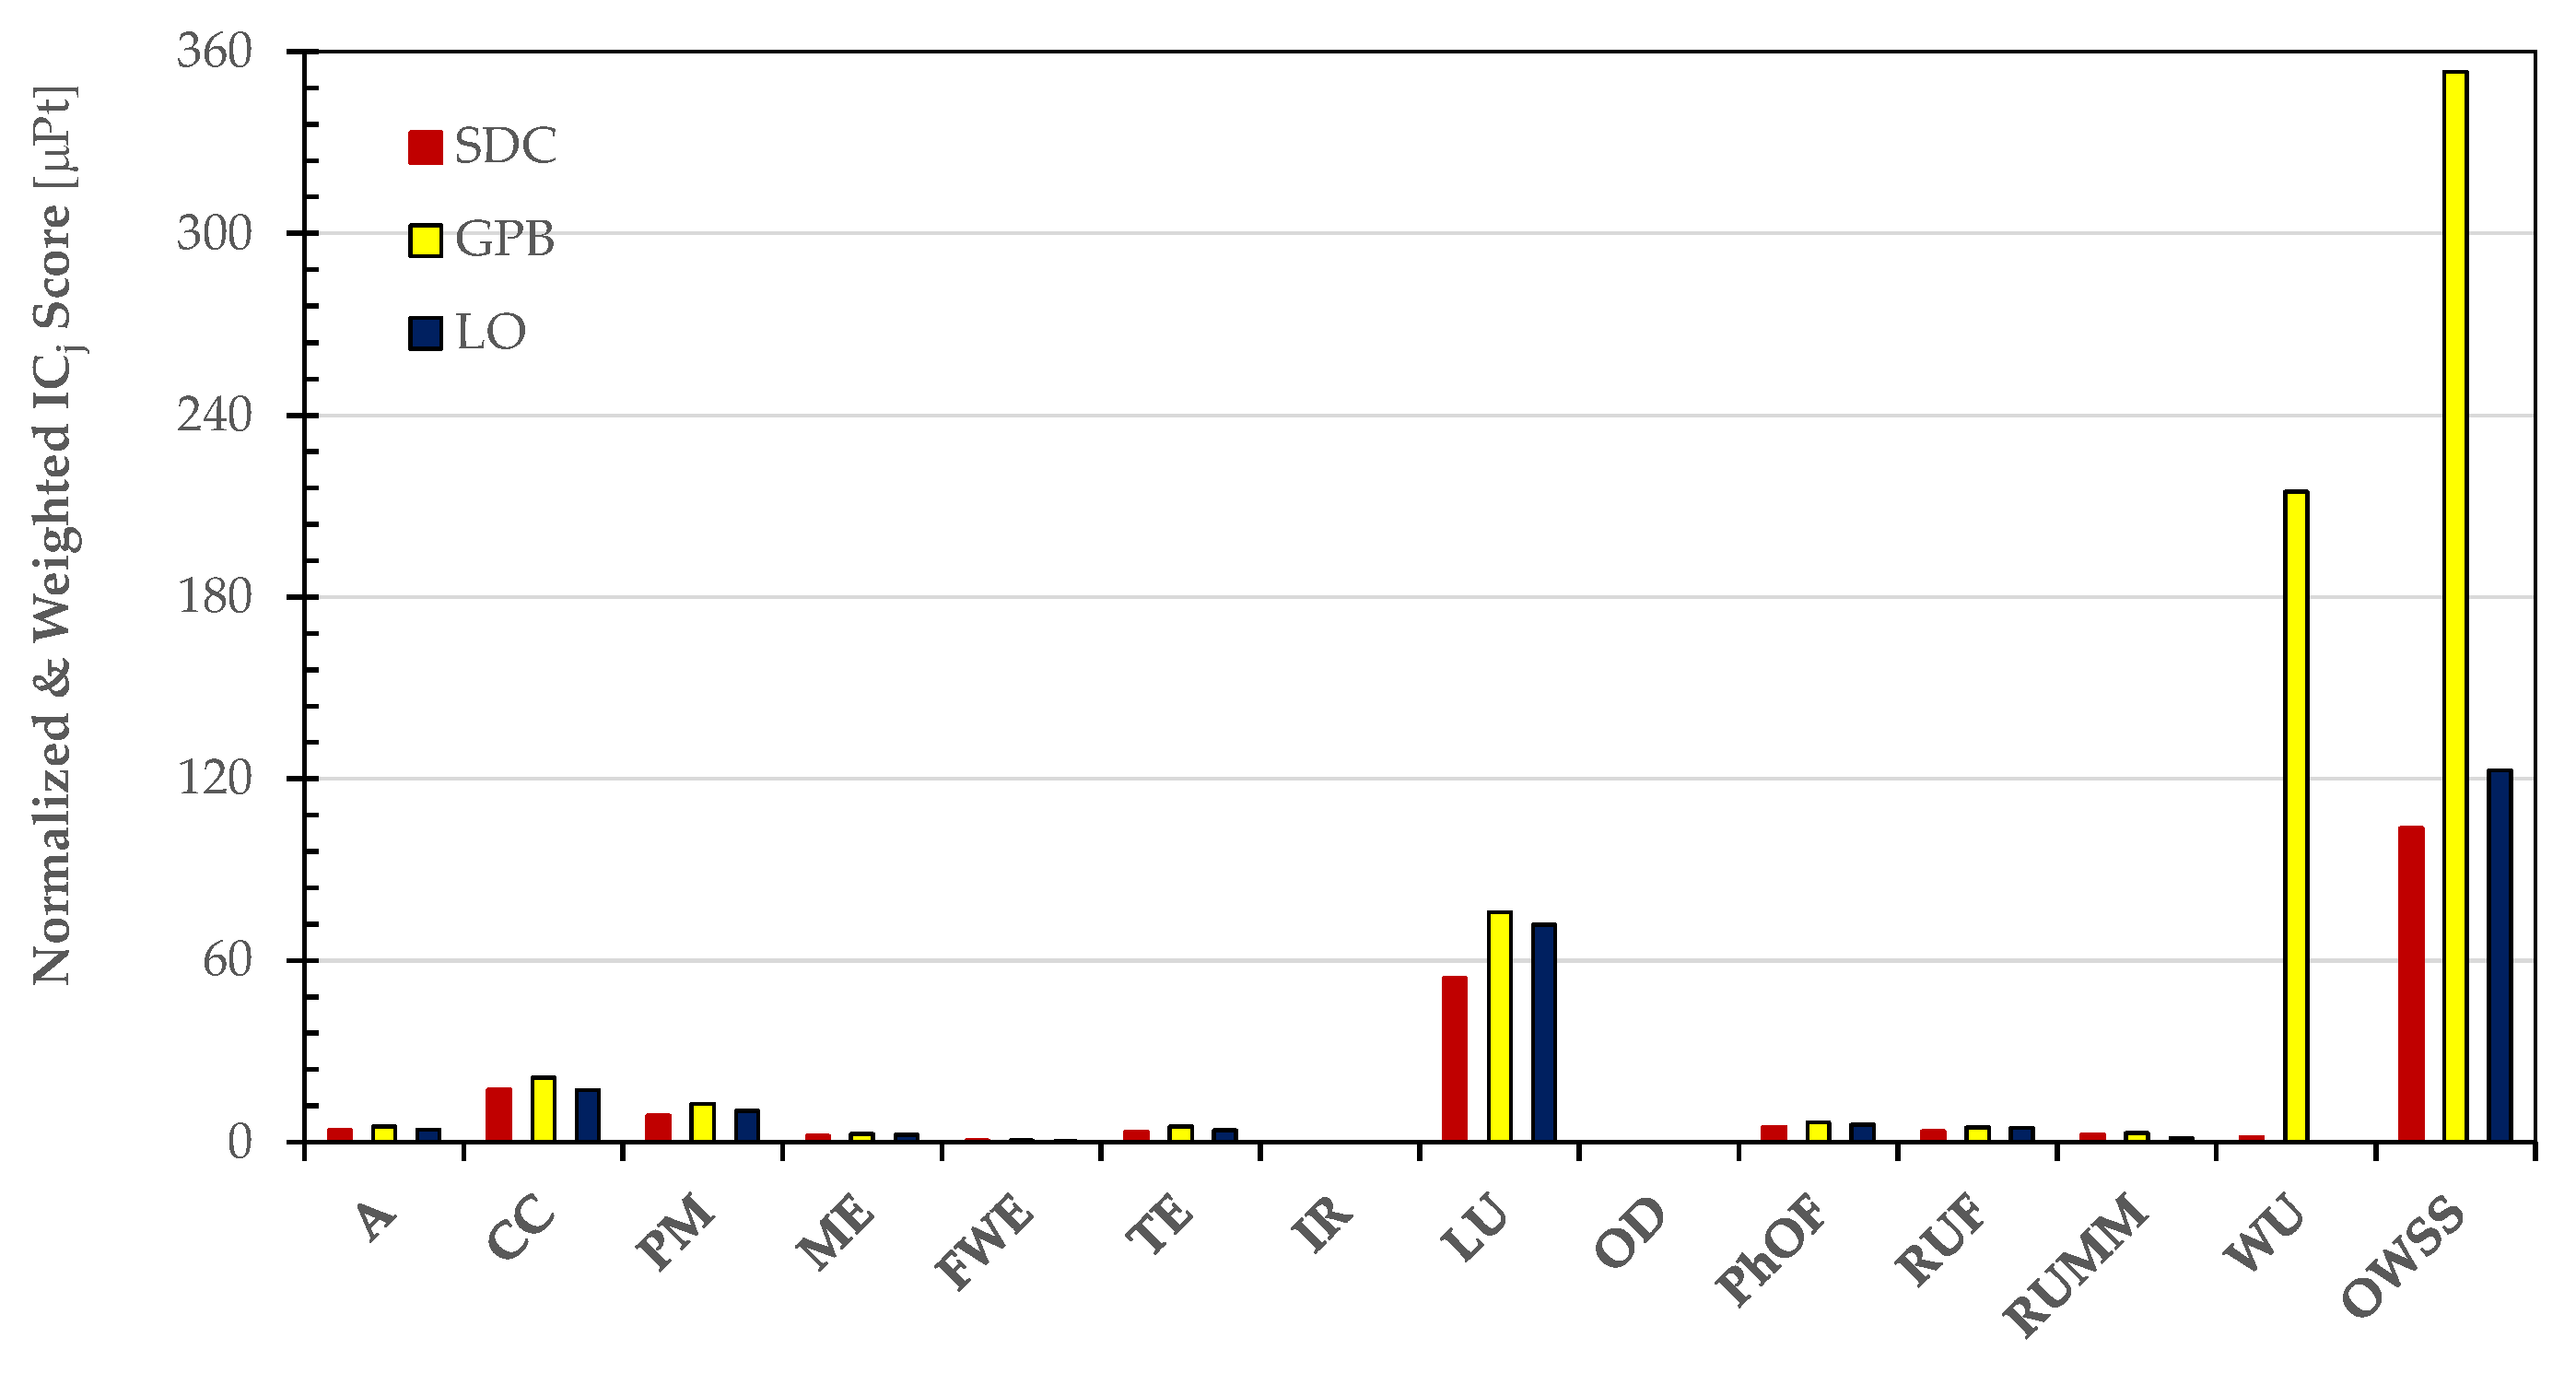
| LU | 54.1 ± 8.5 | 52.2% | 75.9 ± 12.7 | 21.5% | 71.9 ± 12.2 | 58.6% |
| WU | 1.6 ± 0.3 | 1.5% | 214.7 ± 36.4 | 60.8% | 0.14 ± 0.05 | 0.1% |
| RUF | 3.6 ± 0.6 | 3.5% | 4.9 ± 0.9 | 1.4% | 4.8± 0.6 | 3.9% |
| RUMM | 2.7 ± 0.4 | 2.6% | 3.0 ± 0.5 | 0.8% | 1.3 ± 2.5 | 1.1% |
| OWSS | 103.6 ± 16.7 | 100.0% | 353.3 ± 60.2 | 100.0% | 122.6 ± 41.1 | 100.0% |
| ICj | SDC | GPB | OL | Unit | ||||||||||||
|---|---|---|---|---|---|---|---|---|---|---|---|---|---|---|---|---|
| PHS(%) | SHS(%) | ICj Score | PHS(%) | SHS(%) | ICj Score | PHS(%) | SHS(%) | ICj Score | ||||||||
| CC | CU (29) | FPh (28) | 2.5 | ± | 1.3 × 10⁻¹ | FPh (33) | CU (25) | 2.6 | ± | 1.7 × 10⁻¹ | FPh (36) | CU (20) | 2.6 | ± | 4.5 | kg CO2e |
| OD | CU (44) | FPh (24) | 5.7 × 10⁻⁸ | ± | 2.3 × 10⁻⁹ | CU (41) | FPh (23) | 5.3 × 10⁻⁸ | ± | 2.4 × 10⁻⁹ | CU (37) | TR (21) | 4.7 × 10⁻⁸ | ± | 1.6 × 10⁻⁷ | kg CFC11e |
| IR | CU (33) | PR (25) | 1.4 × 10⁻¹ | ± | 2.4 × 10⁻³ | CU (31) | PR (24) | 1.4 × 10⁻¹ | ± | 3.2 × 10⁻³ | CU (30) | PR (27) | 1.3 × 10⁻¹ | ± | 1.1 × 10⁻¹ | kBq 235Ue |
| PhOF | FPh (42) | TR (27) | 1.1 × 10⁻² | ± | 8.2 × 10⁻⁴ | FPh (49) | TR (25) | 1.3 × 10⁻² | ± | 1.2 × 10⁻³ | FPh (55) | TR (23) | 1.4 × 10⁻² | ± | 7.1 × 10⁻³ | kg NMVOCe |
| PM | FPh (47) | TR (30) | 1.4 × 10⁻⁷ | ± | 1.1 × 10⁻⁸ | FPh (56) | TR (26) | 1.7 × 10⁻⁷ | ± | 1.8 × 10⁻⁸ | FPh (60) | TR (24) | 1.8 × 10⁻⁷ | ± | 8.1 × 10⁻⁸ | disease inc. |
| A | FPh (38) | TR (20) | 1.0 × 10⁻² | ± | 6.7 × 10⁻⁴ | FPh (44) | TR (19) | 1.2 × 10⁻² | ± | 9.8 × 10⁻⁴ | FPh (48) | TR (18) | 1.2 × 10⁻² | ± | 7.1 × 10⁻³ | mol H+e |
| I | PMP (28) | CU (22) | 3.9 × 10⁻⁴ | ± | 8.1 × 10⁻⁶ | PMP (28) | CU (20) | 3.9 × 10⁻⁴ | ± | 9.8 × 10⁻⁶ | PMP (30) | CU (19) | 3.7 × 10⁻⁴ | ± | 2.3 × 10⁻⁴ | kg Pe |
| ME | WD (38) | FPh (32) | 5.2 × 10⁻³ | ± | 3.3 × 10⁻⁴ | FPh (39) | WD (35) | 5.7 × 10⁻³ | ± | 4.4 × 10⁻⁴ | FPh (42) | TR (36) | 6.6 × 10⁻³ | ± | 2.3 × 10⁻³ | kg Ne |
| TE | FPh (54) | TR (22) | 3.6 × 10⁻² | ± | 3.3 × 10⁻³ | FPh (64) | TR (18) | 4.6 × 10⁻² | ± | 5.4 × 10⁻³ | FPh (65) | TR (17) | 4.7 × 10⁻² | ± | 2.5 × 10⁻² | mol Ne |
| ETFW | FPh (90) | WD (4) | 1.2 × 10² | ± | 1.6 × 101 | FPh (90) | WD (4) | 1.2 × 10² | ± | 2.0 × 101 | FPh (95) | WD (2) | 3.3 × 10² | ± | 6.6 × 10³ | CTUe |
| C-HT | TR (47) | CU (18) | 1.4 × 10⁻⁹ | ± | 5.0 × 10⁻¹¹ | TR (48) | FPh (17) | 1.4 × 10⁻⁹ | ± | 6.5 × 10⁻¹¹ | TR (50) | FPh (16) | 1.4 × 10⁻⁹ | ± | 2.9 × 10⁻⁹ | CTUh |
| NC-HT | FPh (37) | PMP (25) | 3.5 × 10⁻⁸ | ± | 2.1 × 10⁻⁹ | FPh (42) | PMP (23) | 3.8 × 10⁻⁸ | ± | 3.1 × 10⁻⁹ | FPh (44) | PMP (23) | 4.5 × 10⁻⁸ | ± | 4.5 × 10⁻⁷ | CTUh |
| LU | FPh (97) | PMP (2) | 7.1 × 10² | ± | 1.0 × 10² | FPh (98) | PMP (2) | 9.9 × 10² | ± | 1.6 × 10² | FPh (98) | PMP (1) | 1.3 × 10³ | ± | 6.1 × 10² | Pt |
| WU | FPh (37) | CU (24) | 7.0 × 10⁻¹ | ± | 4.1 × 10⁻² | FPh (99) | CU (0.5) | 3.6 × 101 | ± | 6.0 | CU (33) | PR (32) | 4.4 × 10⁻¹ | ± | 4.2 × 10⁻² | m3 depriv. |
| RUF | FPh (76) | PMP (21) | 4.5 | ± | 5.5 × 10⁻¹ | FPh (81) | PMP (16) | 5.7 | ± | 8.4 × 10⁻¹ | FPh (85) | PMP (13) | 7.2 | ± | 8.3 × 10⁻¹ | MJ |
| RUMM | PMP (44) | CU (22) | 1.8 × 10⁻⁵ | ± | 5.5 × 10⁻⁷ | PMP (44) | CU (21) | 1.9 × 10⁻⁵ | ± | 6.3 × 10⁻⁷ | PMP (48) | TR (21) | 1.7 × 10⁻⁵ | ± | 1.4 × 10⁻⁵ | kg Sbe |
| ICj | SDC | GPB | OL | |||
|---|---|---|---|---|---|---|
| [μPt] | [%] | [μPt] | [%] | [μPt] | [%] | |
| CC | 72.4 ± 3.8 | 28.5 | 75.9 ± 5.2 | 13.1 | 75.5 ± 131.0 | 22.9 |
| OD | 0.073 ± 0.003 | 0.03 | 0.1 ± 0.0 | 0.01 | 0.1 ± 0.2 | 0.02 |
| IR | 1.8 ± 0.0 | 0.7 | 1.8 ± 0.0 | 0.3 | 1.7 ± 1.4 | 0.5 |
| PhOF | 14.0 ± 1.0 | 5.5 | 15.9 ± 1.5 | 2.7 | 17.4 ± 8.8 | 5.3 |
| PM | 22.2 ± 1.8 | 8.7 | 27.4 ± 2.9 | 4.7 | 28.9 ± 13.0 | 8.8 |
| A | 12.5 ± 0.8 | 4.9 | 13.9 ± 1.2 | 2.4 | 14.4 ± 8.5 | 4.4 |
| ME | 8.2 ± 0.5 | 3.2 | 9.1 ± 0.7 | 1.6 | 10.5 ± 3.7 | 3.2 |
| FWE | 7.2 ± 0.2 | 2.8 | 7.2 ± 0.2 | 1.2 | 6.7 ± 4.3 | 2.0 |
| TE | 8.0 ± 0.7 | 3.1 | 10.2 ± 1.2 | 1.8 | 10.3 ± 5.5 | 3.1 |
| LU | 72.3 ± 10.7 | 28.5 | 102.1 ± 16.6 | 17.6 | 128.9 ± 62.4 | 39.2 |
| WU | 5.5 ± 0.3 | 2.2 | 286.0 ± 47.5 | 49.2 | 3.5 ± 0.3 | 1.1 |
| RUF | 6.1 ± 0.8 | 2.4 | 7.9 ± 1.1 | 1.4 | 9.8 ± 1.1 | 3.0 |
| RUMM | 23.4 ± 0.7 | 9.2 | 23.5 ± 0.8 | 4.0 | 21.4 ± 17.8 | 6.5 |
| OWSS | 253.7 ± 21.4 | 100.0 | 581.0 ± 79.0 | 100.0 | 328.9 ± 258.0 | 100.0 |
| ICj | SDC | GPB | OL | |||||||||||||||
|---|---|---|---|---|---|---|---|---|---|---|---|---|---|---|---|---|---|---|
| ICj Score # | NWICj [μPt] | ICj Score # | NWICj [μPt] | ICj Score # | NWICj [μPt] | |||||||||||||
| CC | 2.4 × 100 ± 1.4 × 10⁻¹ | 71.9 | ± | 4.1 | 2.6 × 100 ± 2.1 × 10⁻¹ | 76.8 | ± | 6.1 | 2.5 × 100 ± 1.6 × 10⁻¹ | 73.0 | ± | 4.7 | ||||||
| OD | 4.8 × 10⁻⁸ ± 1.2 × 10⁻⁹ | 0.06 | ± | 0.00 | 4.8 × 10⁻⁸ ± 1.8 × 10⁻⁹ | 0.06 | ± | 0.00 | 4.0 × 10⁻⁸ ± 1.1 × 10⁻⁹ | 0.05 | ± | 0.00 | ||||||
| IR | 1.4 × 10⁻¹ ± 2.3 × 10⁻³ | 1.79 | ± | 0.03 | 1.4 × 10⁻¹ ± 3.4 × 10⁻³ | 1.81 | ± | 0.04 | 1.3 × 10⁻¹ ± 1.3 × 10⁻³ | 1.64 | ± | 0.02 | ||||||
| PhOF | 1.1 × 10⁻² ± 9.5 × 10⁻⁴ | 14.2 | ± | 1.2 | 1.3 × 10⁻²± 1.5 × 10⁻³ | 16.6 | ± | 1.8 | 1.5 × 10⁻² ± 1.4 × 10⁻³ | 18.5 | ± | 1.7 | ||||||
| PM | 1.4 × 10⁻⁷ ± 1.3 × 10⁻⁸ | 22.7 | ± | 2.1 | 1.7 × 10⁻⁷ ± 2.0 × 10⁻⁸ | 27.1 | ± | 3.3 | 1.9 × 10⁻⁷ ± 1.9 × 10⁻⁸ | 31.0 | ± | 3.1 | ||||||
| A | 1.0 × 10⁻² ± 7.6 × 10⁻⁴ | 12.5 | ± | 0.9 | 1.2 × 10⁻² ± 1.2 × 10⁻³ | 14.3 | ± | 1.4 | 1.3 × 10⁻² ± 1.0 × 10⁻³ | 15.1 | ± | 1.2 | ||||||
| ME | 5.2 × 10⁻³ ± 3.6 × 10⁻⁴ | 8.3 | ± | 0.6 | 5.9 × 10⁻³ ± 5.3 × 10⁻⁴ | 9.4 | ± | 0.8 | 6.9 × 10⁻³ ± 5.2 × 10⁻⁴ | 11.0 | ± | 0.8 | ||||||
| FWE | 3.8 × 10⁻⁴ ± 7.8 × 10⁻⁶ | 7.1 | ± | 0.1 | 3.9 × 10⁻⁴ ± 1.1 × 10⁻⁵ | 7.2 | ± | 0.2 | 3.6 × 10⁻⁴ ± 6.0 × 10⁻⁶ | 6.6 | ± | 0.1 | ||||||
| TE | 3.7 × 10⁻²± 3.8 × 10⁻³ | 8.2 | ± | 0.8 | 4.5 × 10⁻² ± 5.8 × 10⁻³ | 9.9 | ± | 1.3 | 5.0 × 10⁻² ± 5.3 × 10⁻³ | 11.1 | ± | 1.2 | ||||||
| ETFW | 2.3 × 101 ± 2.1 × 100 | 0.0 | ± | 0.0 | 2.7 × 101 ± 3.3 × 100 | 0.0 | ± | 0.0 | 2.2 × 101 ± 1.6 × 100 | 0.0 | ± | 0.0 | ||||||
| C-HT | 1.3 × 10⁻⁹ ± 3.7 × 10⁻¹¹ | 0.0 | ± | 0.0 | 1.3 × 10⁻⁹ ± 5.5 × 10⁻¹¹ | 0.0 | ± | 0.0 | 1.2 × 10⁻⁹ ± 3.6 × 10⁻¹¹ | 0.0 | ± | 0.0 | ||||||
| NC-HT | 2.5 × 10⁻⁸ ± 6.8 × 10⁻¹⁰ | 0.0 | ± | 0.0 | 2.6 × 10⁻⁸ ± 1.0 × 10⁻⁹ | 0.0 | ± | 0.0 | 2.4 × 10⁻⁸ ± 6.6 × 10⁻¹⁰ | 0.0 | ± | 0.0 | ||||||
| LU | 7.7 × 10² ± 1.3 × 10² | 79.4 | ± | 13.2 | 1.1 × 10³ ± 2.0 × 10² | 109.2 | ± | 20.4 | 1.4 × 10³ ± 2.0 × 10² | 145.4 | ± | 20.3 | ||||||
| WU | 4.6 × 10⁻¹ ± 4.7 × 10⁻³ | 3.61 | ± | 0.04 | 4.1 × 101 ± 7.8 × 100 | 320.15 | ± | 61.24 | 4.4 × 10− 1 ± 5.1 × 10⁻³ | 3.47 | ± | 0.04 | ||||||
| RUF | 4.9 × 100 ± 6.9 × 10⁻¹ | 6.7 | ± | 0.9 | 6.3 × 100 ± 1.1 × 100 | 8.7 | ± | 1.4 | 8.1 × 100 ± 1.1 × 100 | 11.1 | ± | 1.5 | ||||||
| RUMM | 1.8 × 10⁻⁵ ± 4.9 × 10⁻⁷ | 22.6 | ± | 0.6 | 1.8 × 10⁻⁵ ± 6.8 × 10⁻⁷ | 23.2 | ± | 0.9 | 1.6 × 10⁻⁵ ± 4.0 × 10⁻⁷ | 20.8 | ± | 0.5 | ||||||
| OWSS | 259 | ± | 25 | 624 | ± | 99 | 349 | ± | 35 | |||||||||
| ICj | MDSDC | MDGPB | MDOL | |||||||||||||||
|---|---|---|---|---|---|---|---|---|---|---|---|---|---|---|---|---|---|---|
| ICj Score # | NWICj [μPt] | ICj Score # | NWICj [μPt] | ICj Score # | NWICj [μPt] | |||||||||||||
| CC | 2.8 × 100 ± 1.7 × 10⁻¹ | 82.2 | ± | 5.0 | 3.0 × 100 ± 2.3 × 10⁻¹ | 89.6 | ± | 6.9 | 3.0 × 100 ± 1.9 × 10⁻¹ | 88.2 | ± | 5.4 | ||||||
| OD | 5.3 × 10⁻⁸ ± 1.5 × 10⁻⁹ | 0.07 | ± | 0.00 | 5.4 × 10⁻⁸ ± 2.1 × 10⁻⁹ | 0.070 | ± | 0.003 | 5.0 × 10⁻⁸ ± 1.4 × 10⁻⁹ | 0.06 | ± | 0.00 | ||||||
| IR | 1.9 × 10⁻¹ ± 3.6 × 10⁻³ | 2.36 | ± | 0.05 | 1.9 × 10⁻¹± 4.7 × 10⁻³ | 2.41 | ± | 0.06 | 1.8 × 10⁻¹ ± 2.9 × 10⁻³ | 2.27 | ± | 0.04 | ||||||
| PhOF | 1.3 × 10⁻² ± 1.2 × 10⁻³ | 16.5 | ± | 1.4 | 1.5 × 10⁻² ± 1.7 × 10⁻³ | 19.3 | ± | 2.1 | 1.7 × 10⁻² ± 1.6 × 10⁻³ | 21.8 | ± | 2.0 | ||||||
| PM | 1.6 × 10⁻⁷ ± 1.6 × 10⁻⁸ | 25.7 | ± | 2.6 | 1.9 × 10⁻⁷ ± 2.3 × 10⁻⁸ | 30.9 | ± | 3.7 | 2.2 × 10⁻⁷ ± 2.2 × 10⁻⁸ | 35.6 | ± | 3.6 | ||||||
| A | 1.2 × 10⁻² ± 9.3 × 10⁻⁴ | 14.8 | ± | 1.1 | 1.4 × 10⁻²± 1.3 × 10⁻³ | 17.0 | ± | 1.6 | 1.5 × 10⁻² ± 1.2 × 10⁻³ | 18.1 | ± | 1.4 | ||||||
| ME | 5.8 × 10⁻³ ± 4.3 × 10⁻⁴ | 9.3 | ± | 0.7 | 6.6 × 10⁻³ ± 6.0 × 10⁻⁴ | 10.6 | ± | 1.0 | 7.8 × 10⁻³ ± 5.9 × 10⁻⁴ | 12.5 | ± | 0.9 | ||||||
| FWE | 4.4 × 10⁻⁴ ± 9.5 × 10⁻⁶ | 8.2 | ± | 0.2 | 4.6 × 10⁻⁴ ± 1.3 × 10⁻⁵ | 8.4 | ± | 0.2 | 4.3 × 10⁻⁴ ± 7.1 × 10⁻⁶ | 8.0 | ± | 0.1 | ||||||
| TE | 4.3 × 10⁻² ± 4.6 × 10⁻³ | 9.5 | ± | 1.0 | 5.2 × 10⁻² ± 6.7 × 10⁻³ | 11.6 | ± | 1.5 | 5.9 × 10⁻² ± 6.1 × 10⁻³ | 13.0 | ± | 1.4 | ||||||
| ETFW | 2.6 × 101 ± 2.5 | 0.0 | ± | 0.0 | 3.1 × 101± 3.7 × 100 | 0.0 | ± | 0.0 | 2.5 × 101 ± 1.8 × 100 | 0.0 | ± | 0.0 | ||||||
| C-HT | 1.4 × 10⁻⁹ ± 4.5 × 10⁻¹¹ | 0.0 | ± | 0.0 | 1.4 × 10⁻⁹ ± 6.3 × 10⁻¹¹ | 0.0 | ± | 0.0 | 1.4 × 10⁻⁹ ± 4.1 × 10⁻¹¹ | 0.0 | ± | 0.0 | ||||||
| NC-HT | 2.7 × 10⁻⁸ ± 8.2 × 10⁻¹⁰ | 0.0 | ± | 0.0 | 2.9 × 10⁻⁸ ± 1.1 × 10⁻⁹ | 0.0 | ± | 0.0 | 2.8 × 10⁻⁸ ± 7.4 × 10⁻¹⁰ | 0.0 | ± | 0.0 | ||||||
| LU | 9.1 × 10² ± 1.5 × 10² | 93.3 | ± | 15.8 | 1.3 × 10³ ± 2.3 × 10² | 128.5 | ± | 23.3 | 1.7 × 10³ ± 2.3 × 10² | 170.5 | ± | 23.1 | ||||||
| WU | 6.4 × 10⁻¹ ± 1.1 × 10⁻² | 5.03 | ± | 0.09 | 4.8 × 101 ± 8.9 × 100 | 378.38 | ± | 70.11 | 6.4 × 10⁻¹ ± 1.2 × 10⁻² | 5.02 | ± | 0.09 | ||||||
| RUF | 5.5 ± 8.4 × 10⁻¹ | 7.6 | ± | 1.1 | 7.3 × 100 ± 1.2 × 100 | 10.0 | ± | 1.7 | 9.3 × 100 ± 1.2 × 100 | 12.8 | ± | 1.7 | ||||||
| RUMM | 1.8 × 10⁻⁵ ± 5.6 × 10⁻⁷ | 23.3 | ± | 0.7 | 1.9 × 10⁻⁵ ± 7.1 × 10⁻⁷ | 24.3 | ± | 0.9 | 1.7 × 10⁻⁵ ± 4.1 × 10⁻⁷ | 21.9 | ± | 0.5 | ||||||
| OWSS | 298 | ± | 30 | 731 | ± | 113 | 410 | ± | 40 | |||||||||
Disclaimer/Publisher’s Note: The statements, opinions and data contained in all publications are solely those of the individual author(s) and contributor(s) and not of MDPI and/or the editor(s). MDPI and/or the editor(s) disclaim responsibility for any injury to people or property resulting from any ideas, methods, instructions or products referred to in the content. |
© 2024 by the authors. Licensee MDPI, Basel, Switzerland. This article is an open access article distributed under the terms and conditions of the Creative Commons Attribution (CC BY) license (https://creativecommons.org/licenses/by/4.0/).
Share and Cite
Moresi, M.; Cimini, A. A Comprehensive Study from Cradle-to-Grave on the Environmental Profile of Malted Legumes. Foods 2024, 13, 655. https://doi.org/10.3390/foods13050655
Moresi M, Cimini A. A Comprehensive Study from Cradle-to-Grave on the Environmental Profile of Malted Legumes. Foods. 2024; 13(5):655. https://doi.org/10.3390/foods13050655
Chicago/Turabian StyleMoresi, Mauro, and Alessio Cimini. 2024. "A Comprehensive Study from Cradle-to-Grave on the Environmental Profile of Malted Legumes" Foods 13, no. 5: 655. https://doi.org/10.3390/foods13050655