
Production of Biocalcium from Fermented Fish Bone Residue for Fish Emulsion Sausage Fortification


Abstract
:1. Introduction
2. Materials and Methods
2.1. Investigation of the NaOH Concentration and Soaking Time That Yield the Highest Quality Biocalcium from FFBR
2.1.1. Preliminary Treatment of FFBR
2.1.2. Alkaline Treatment and Biocalcium Preparation
2.1.3. Biocalcium Analyses
2.2. Fortification of FES with the Properly Treated Biocalcium and Investigation of the Effects of Biocalcium Fortification on FES Quality Parameters
2.2.1. FES Fortification with Biocalcium
2.2.2. Quality Analyses of FES
2.3. Statistical Analysis
3. Results and Discussion
3.1. Investigation of the NaOH Concentration and Soaking Time That Yield the Highest Quality Biocalcium from FFBR
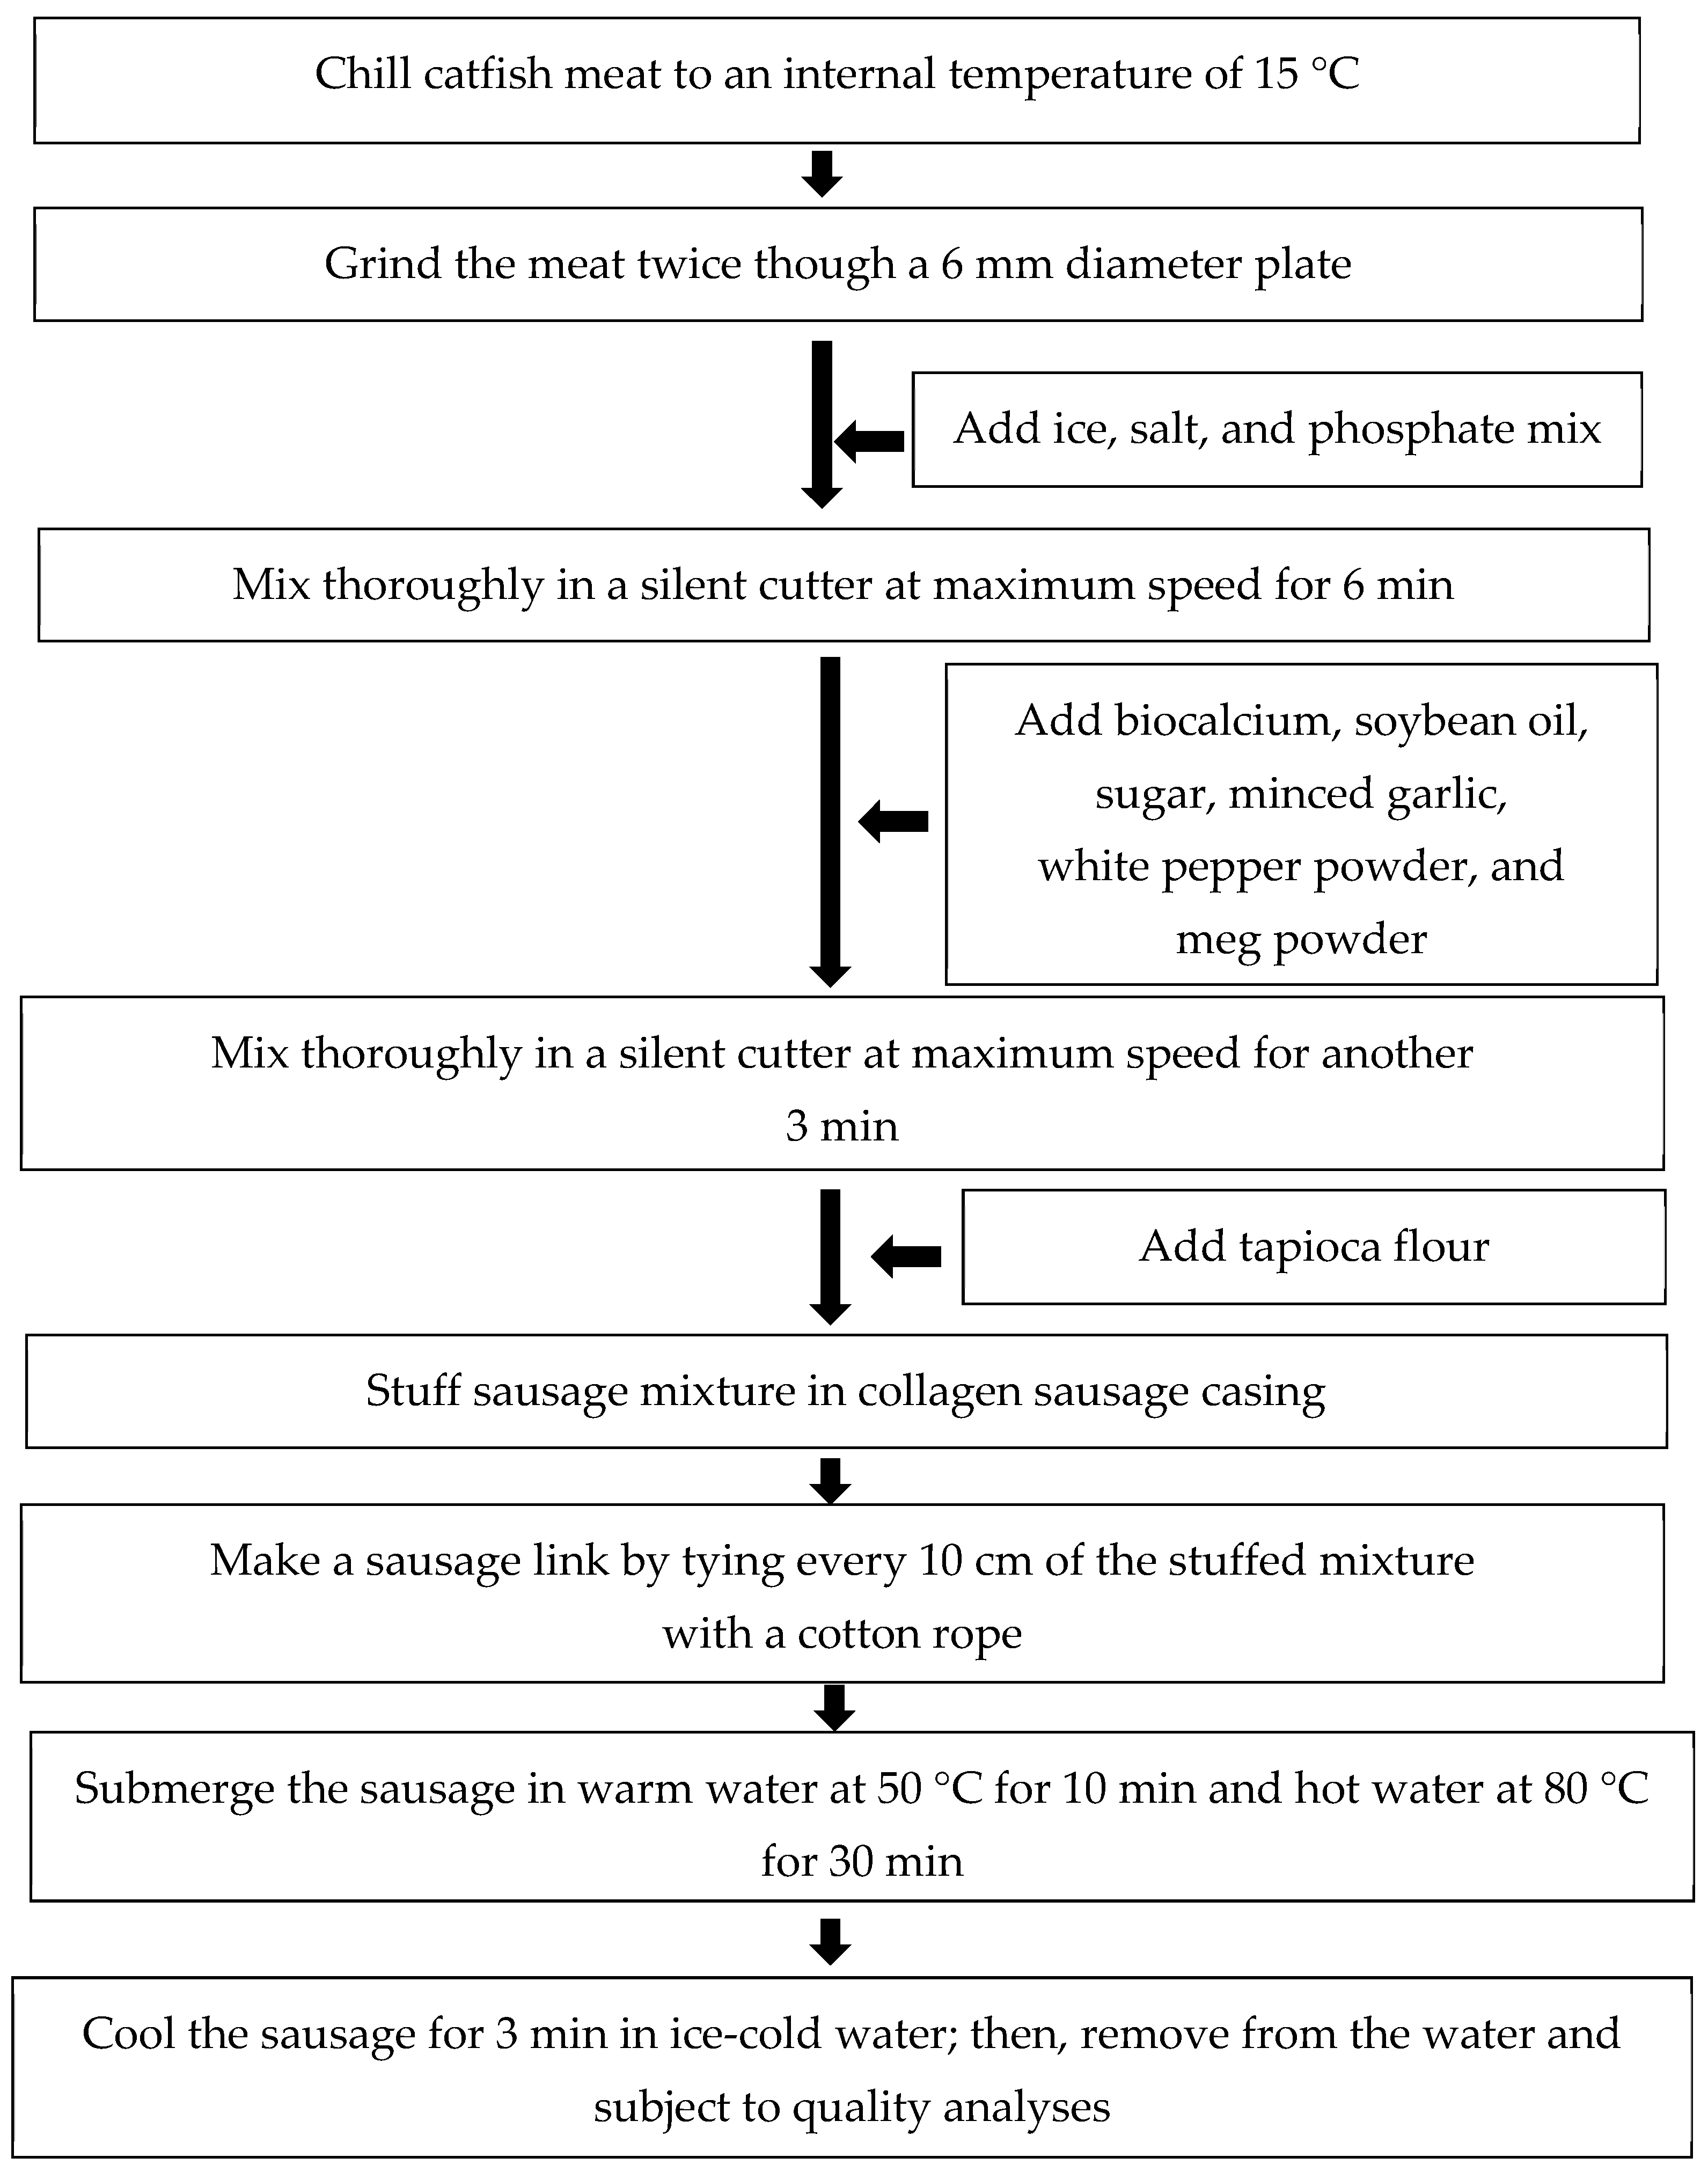
3.1.1. Crude Protein
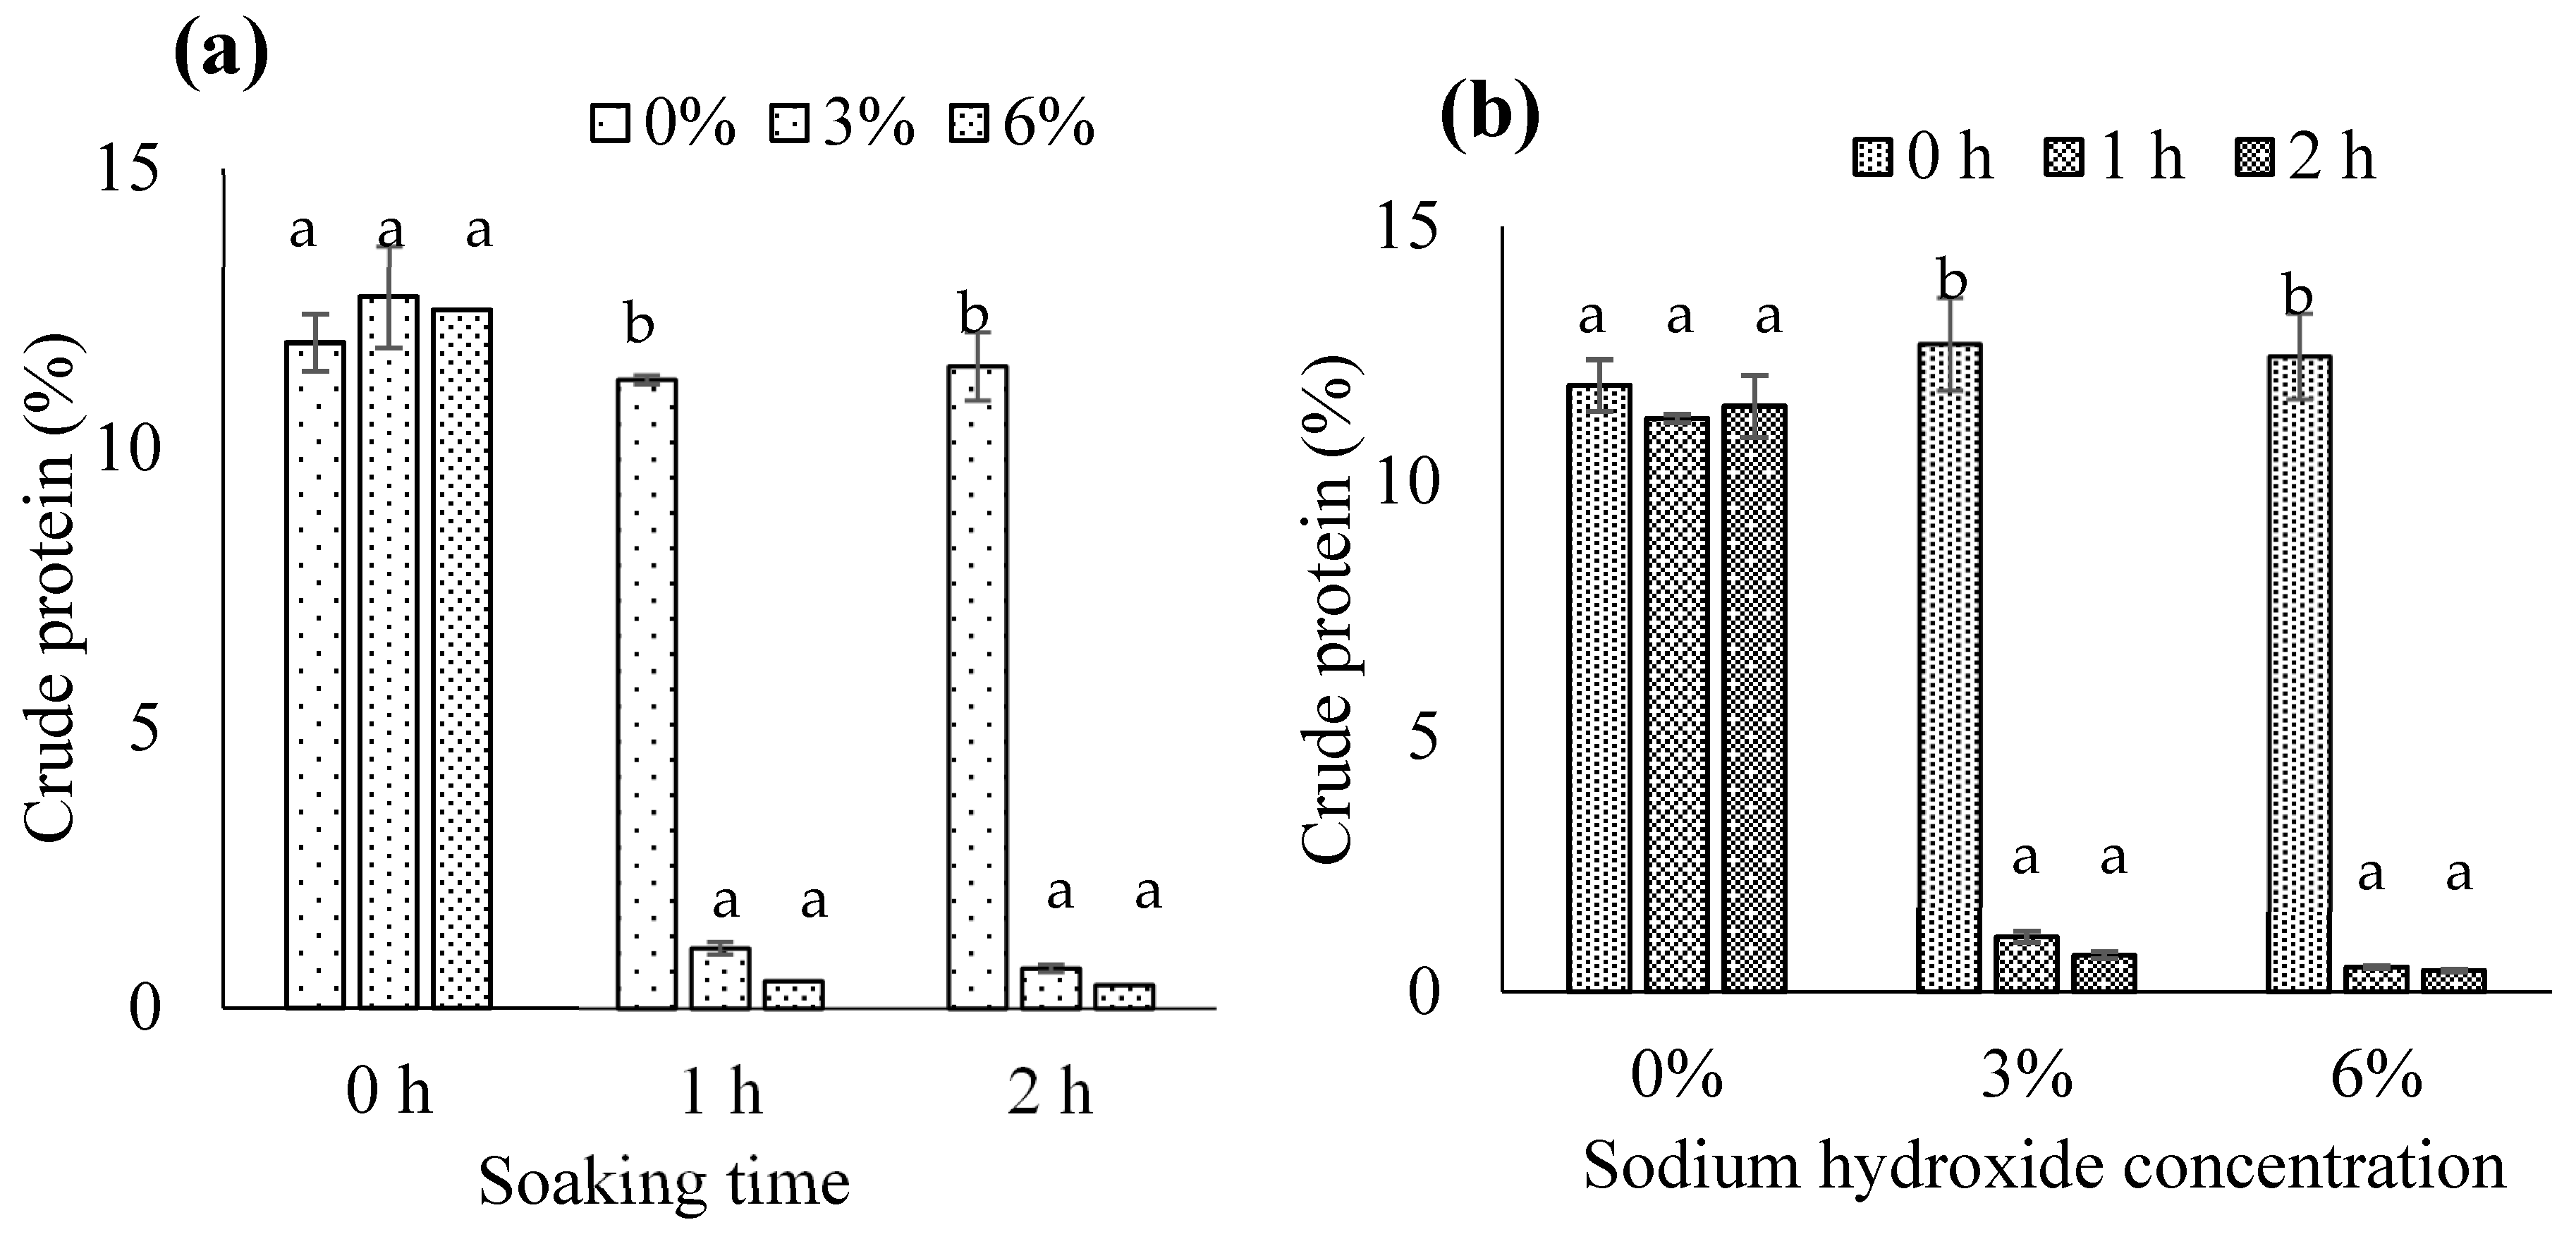
3.1.2. Crude Fat
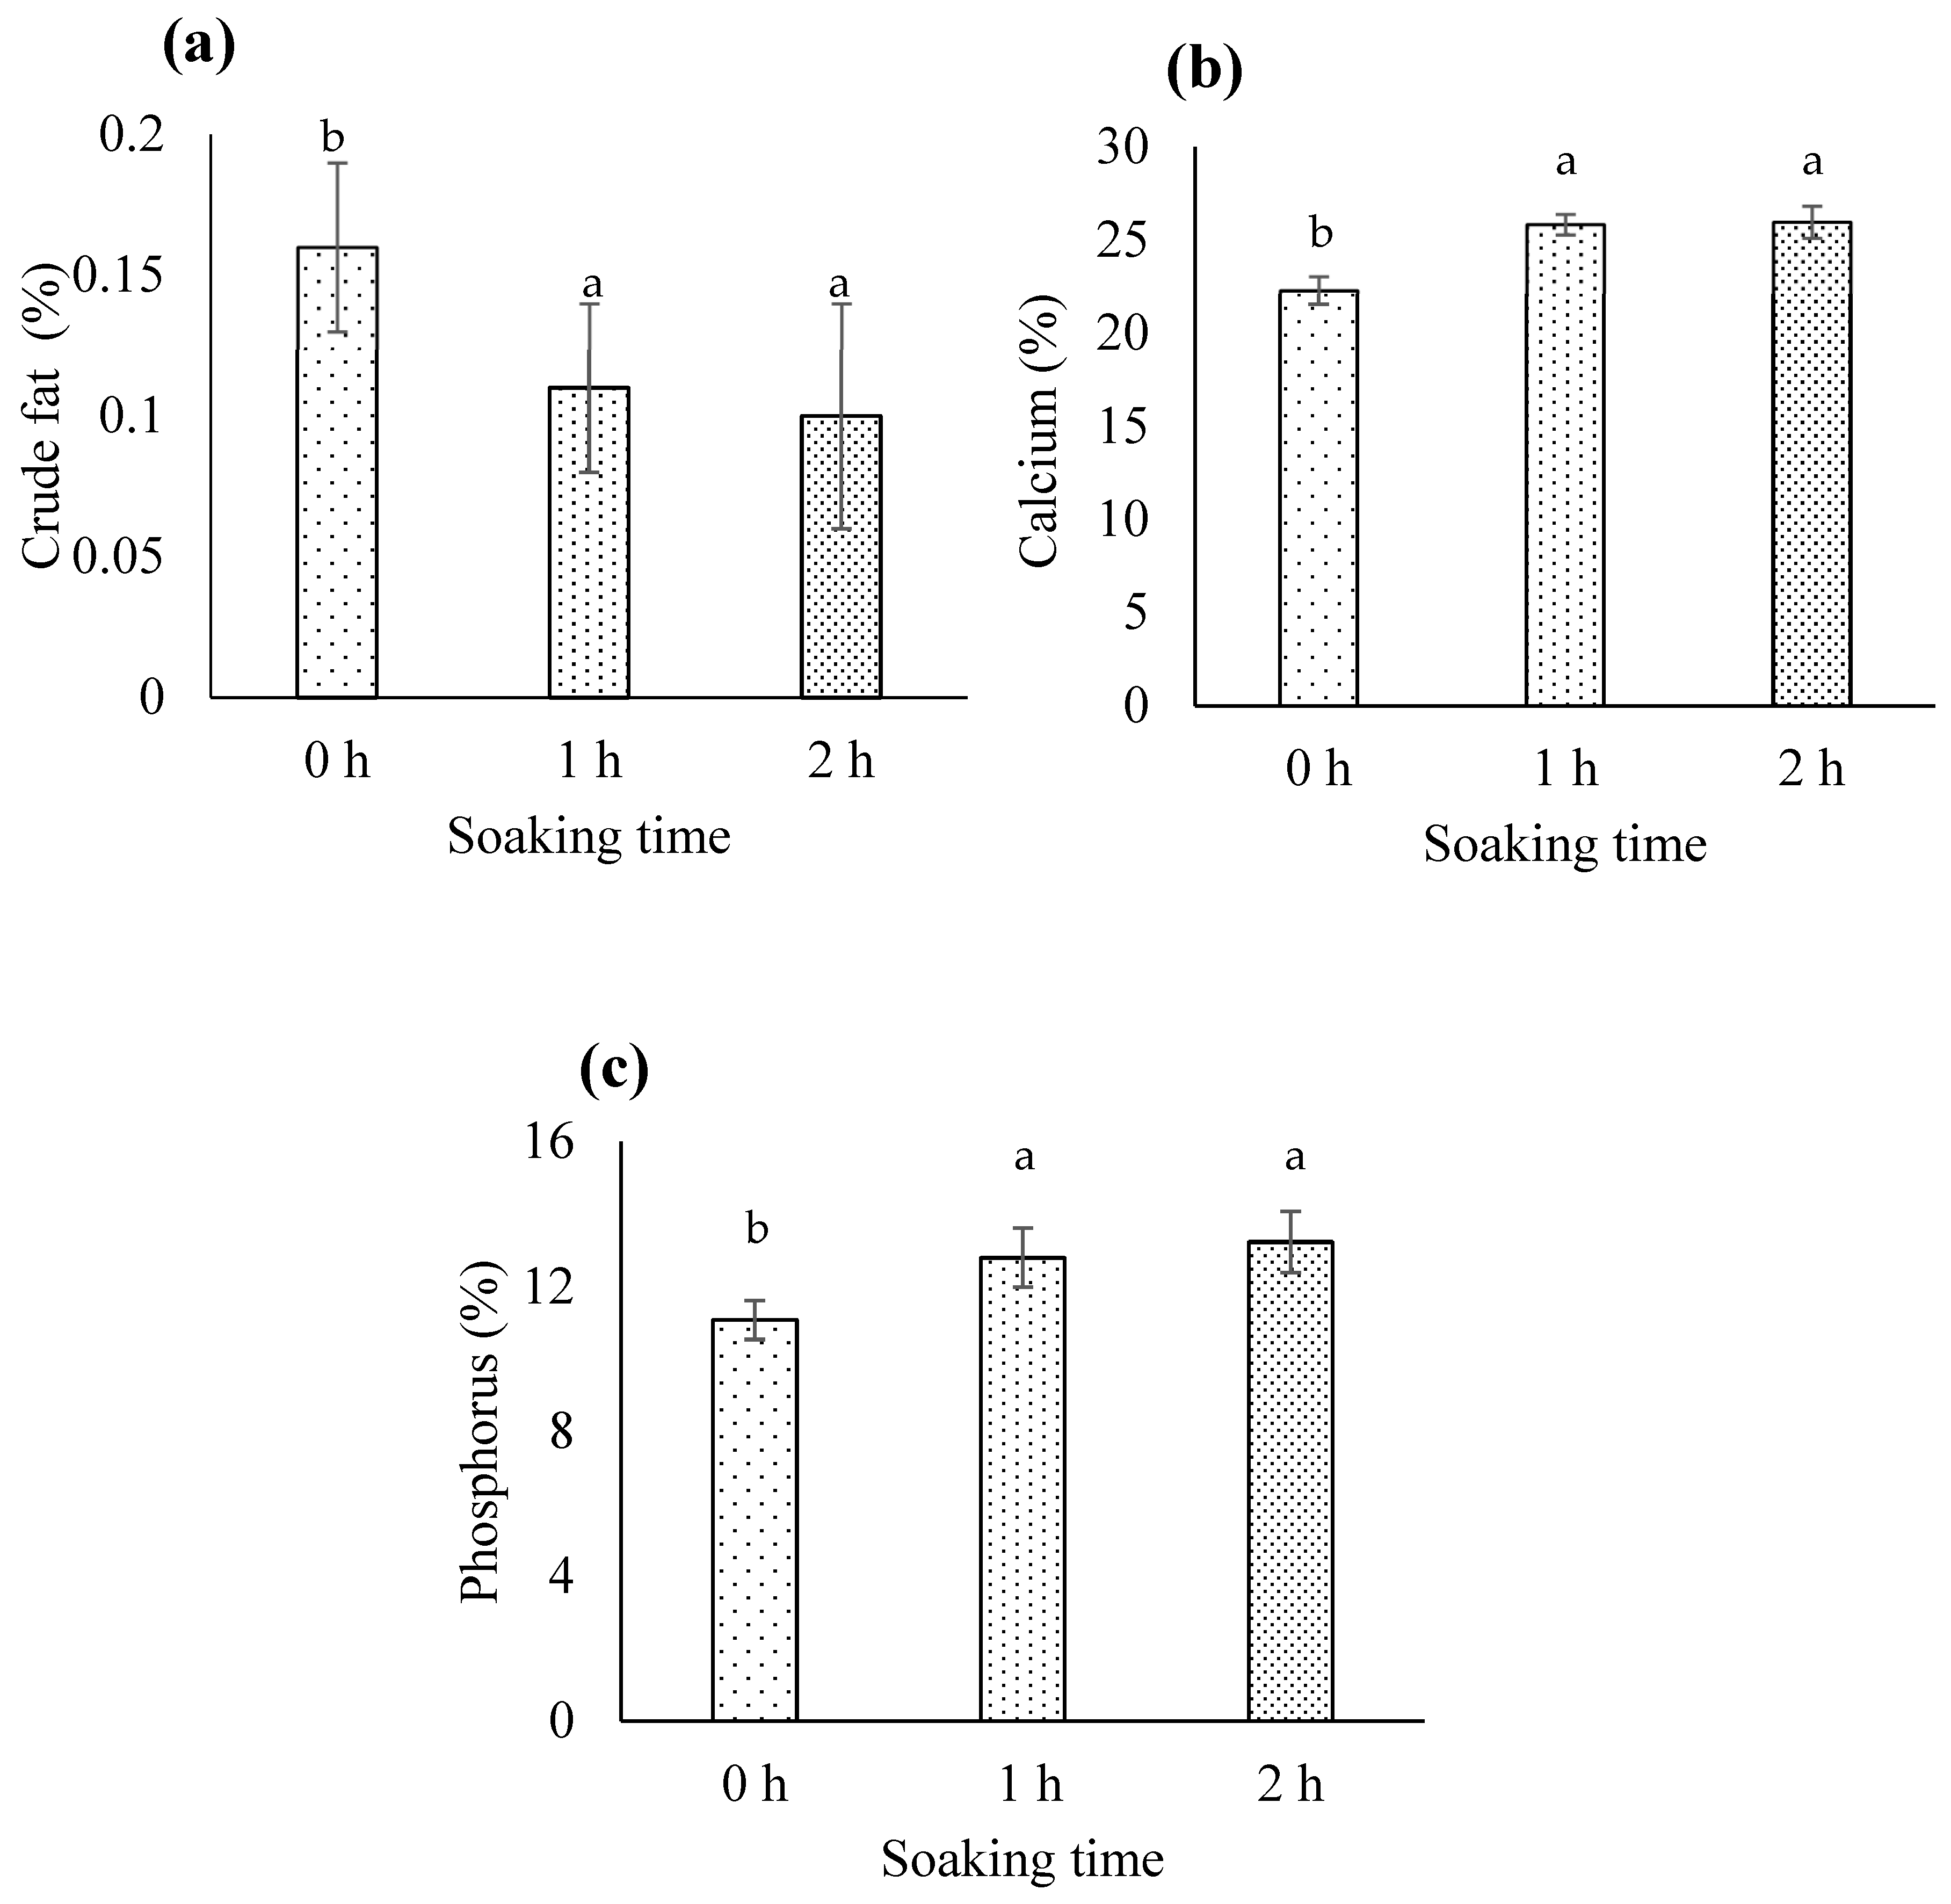
3.1.3. Ash Content
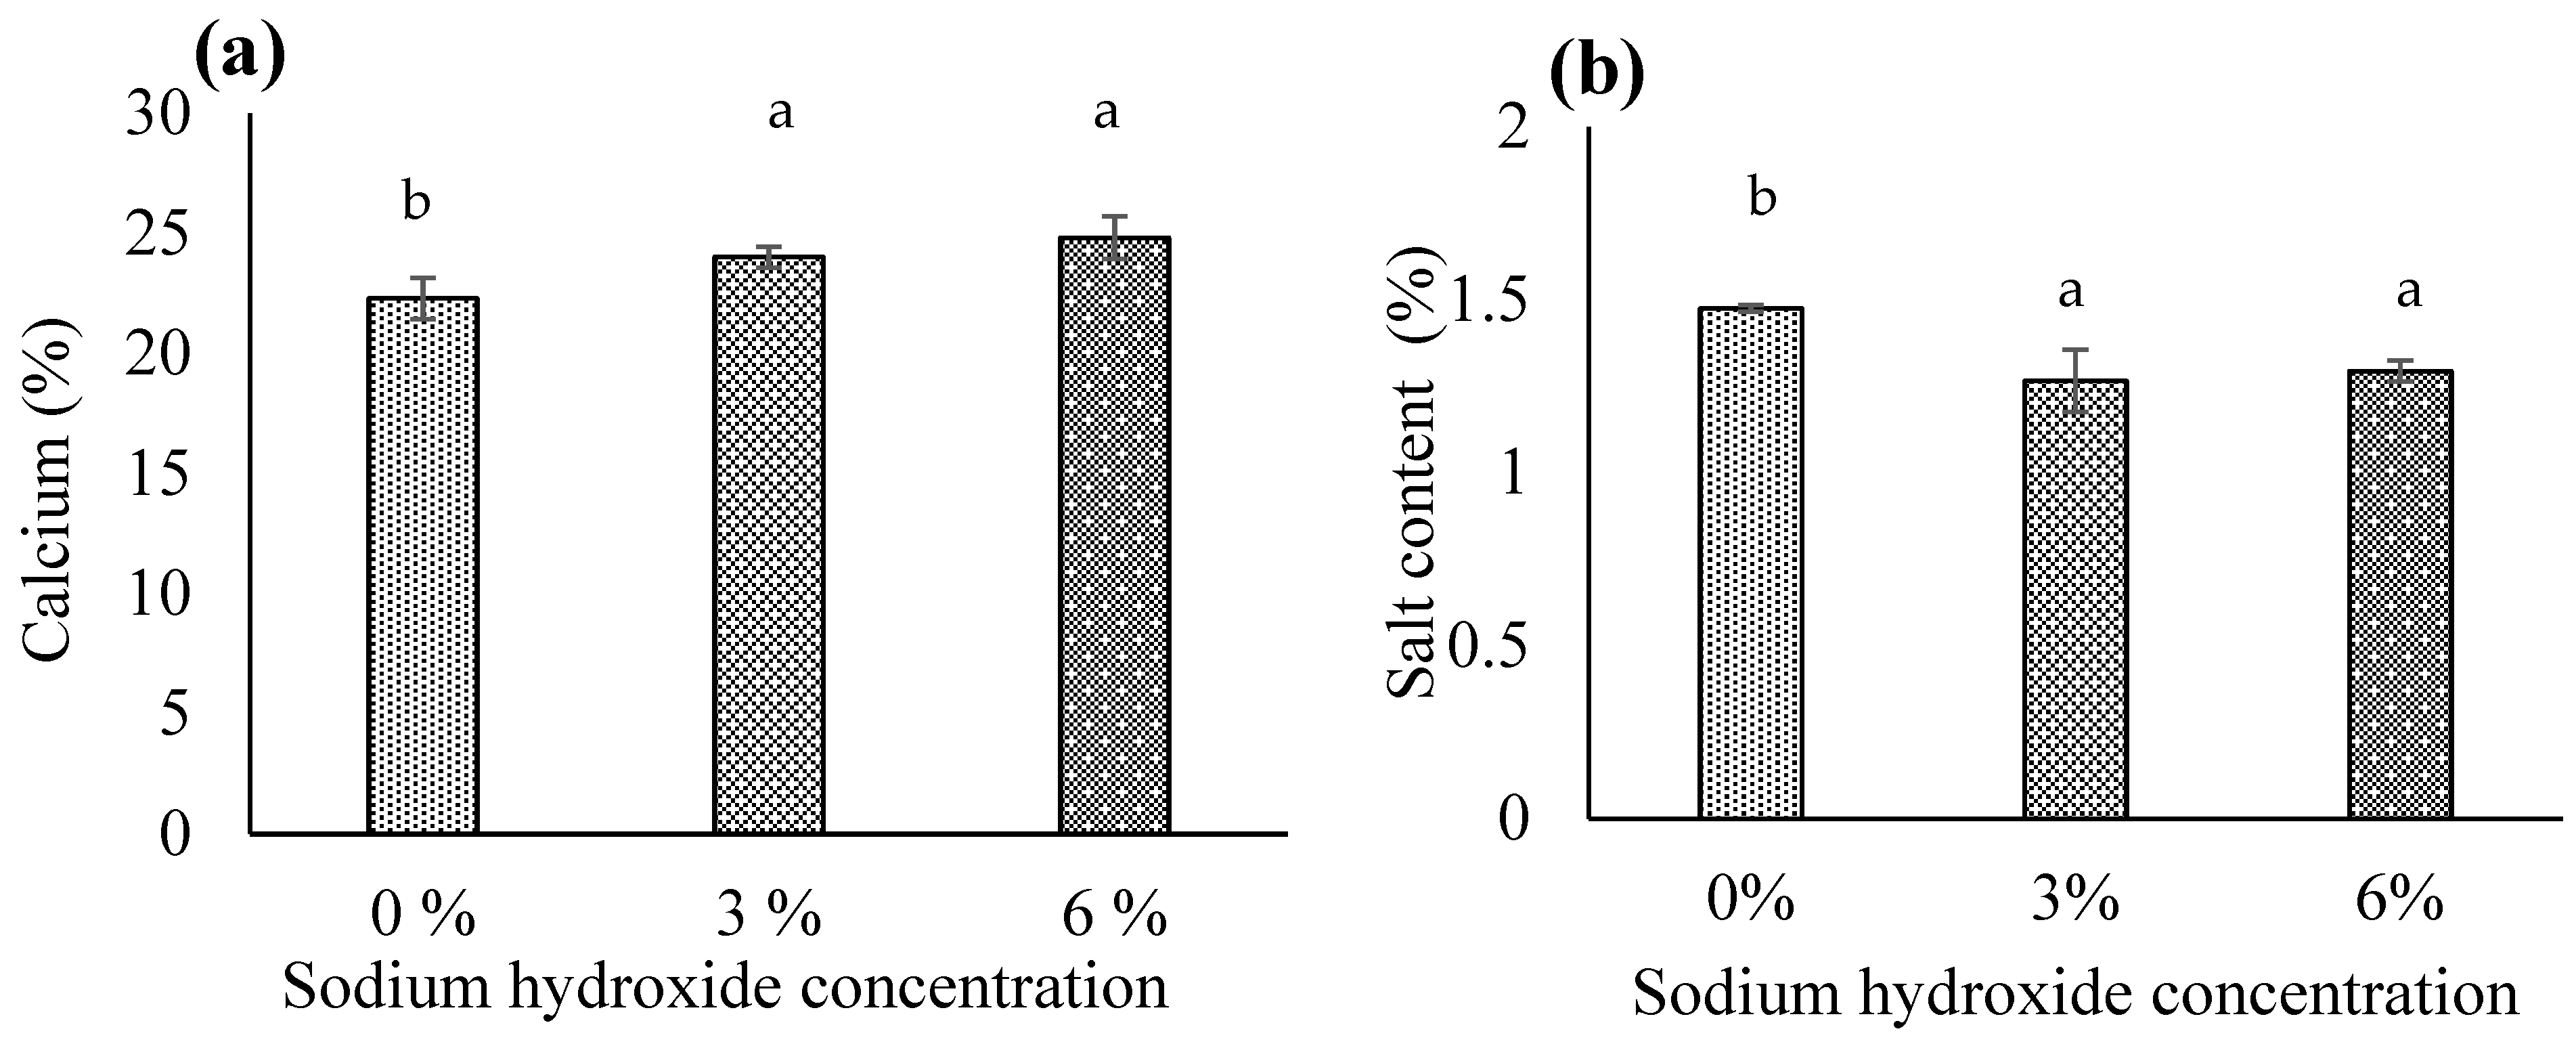
3.1.4. Calcium
3.1.5. Phosphorus
3.1.6. Crude Fiber
3.1.7. Salt Content
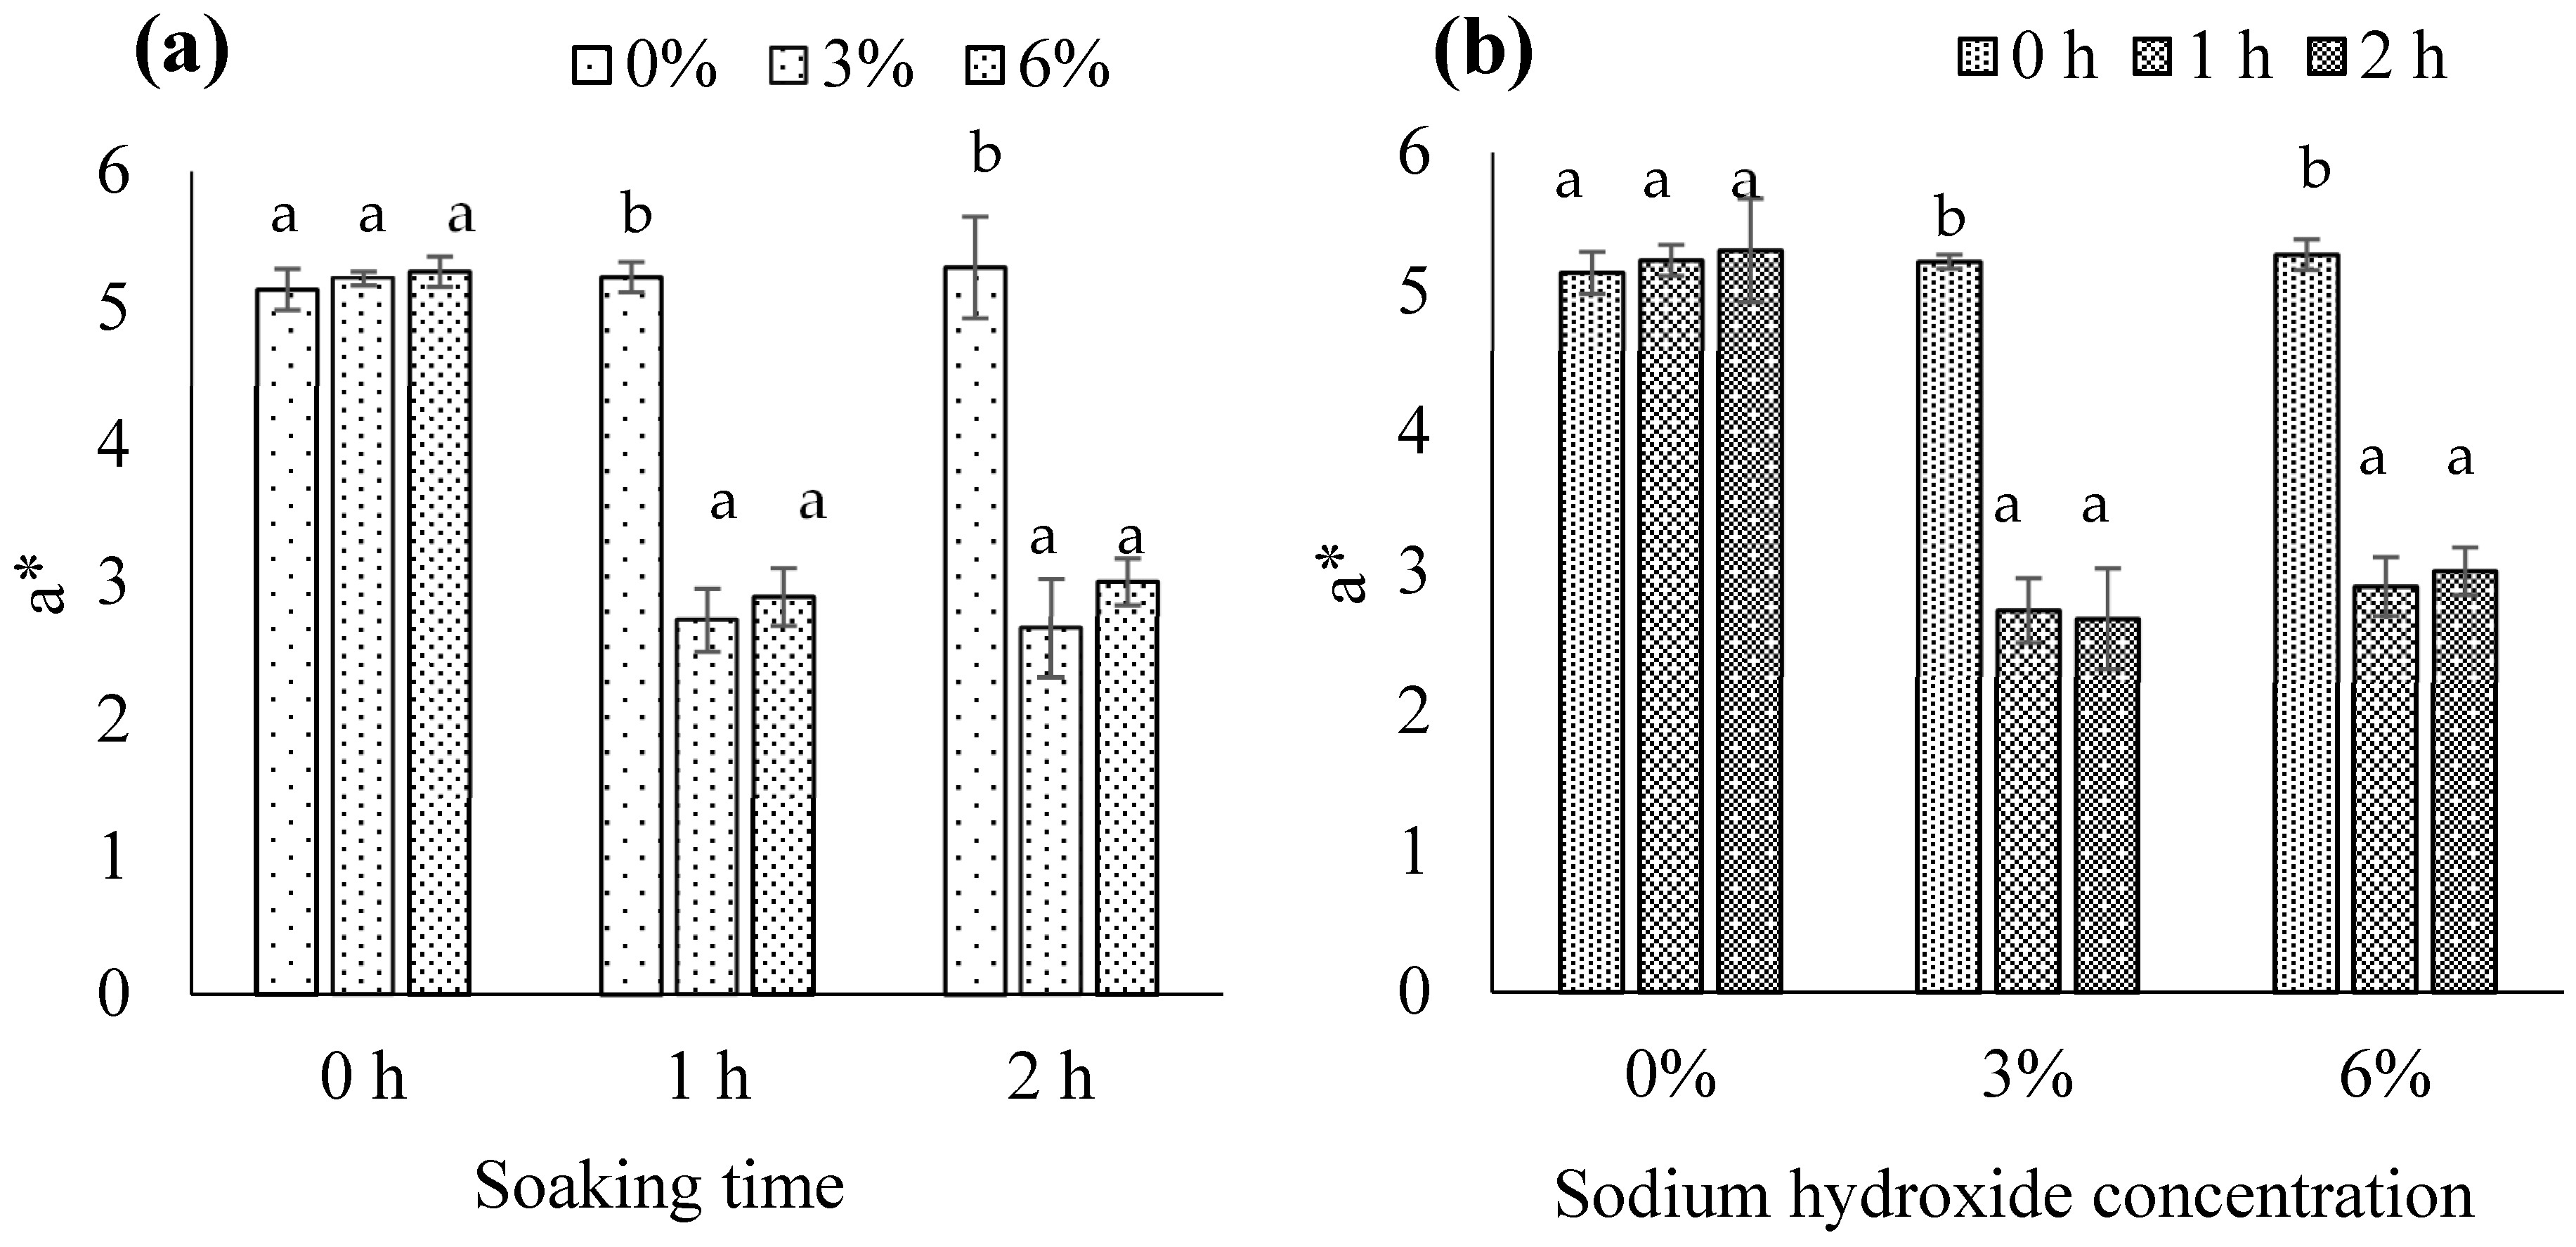
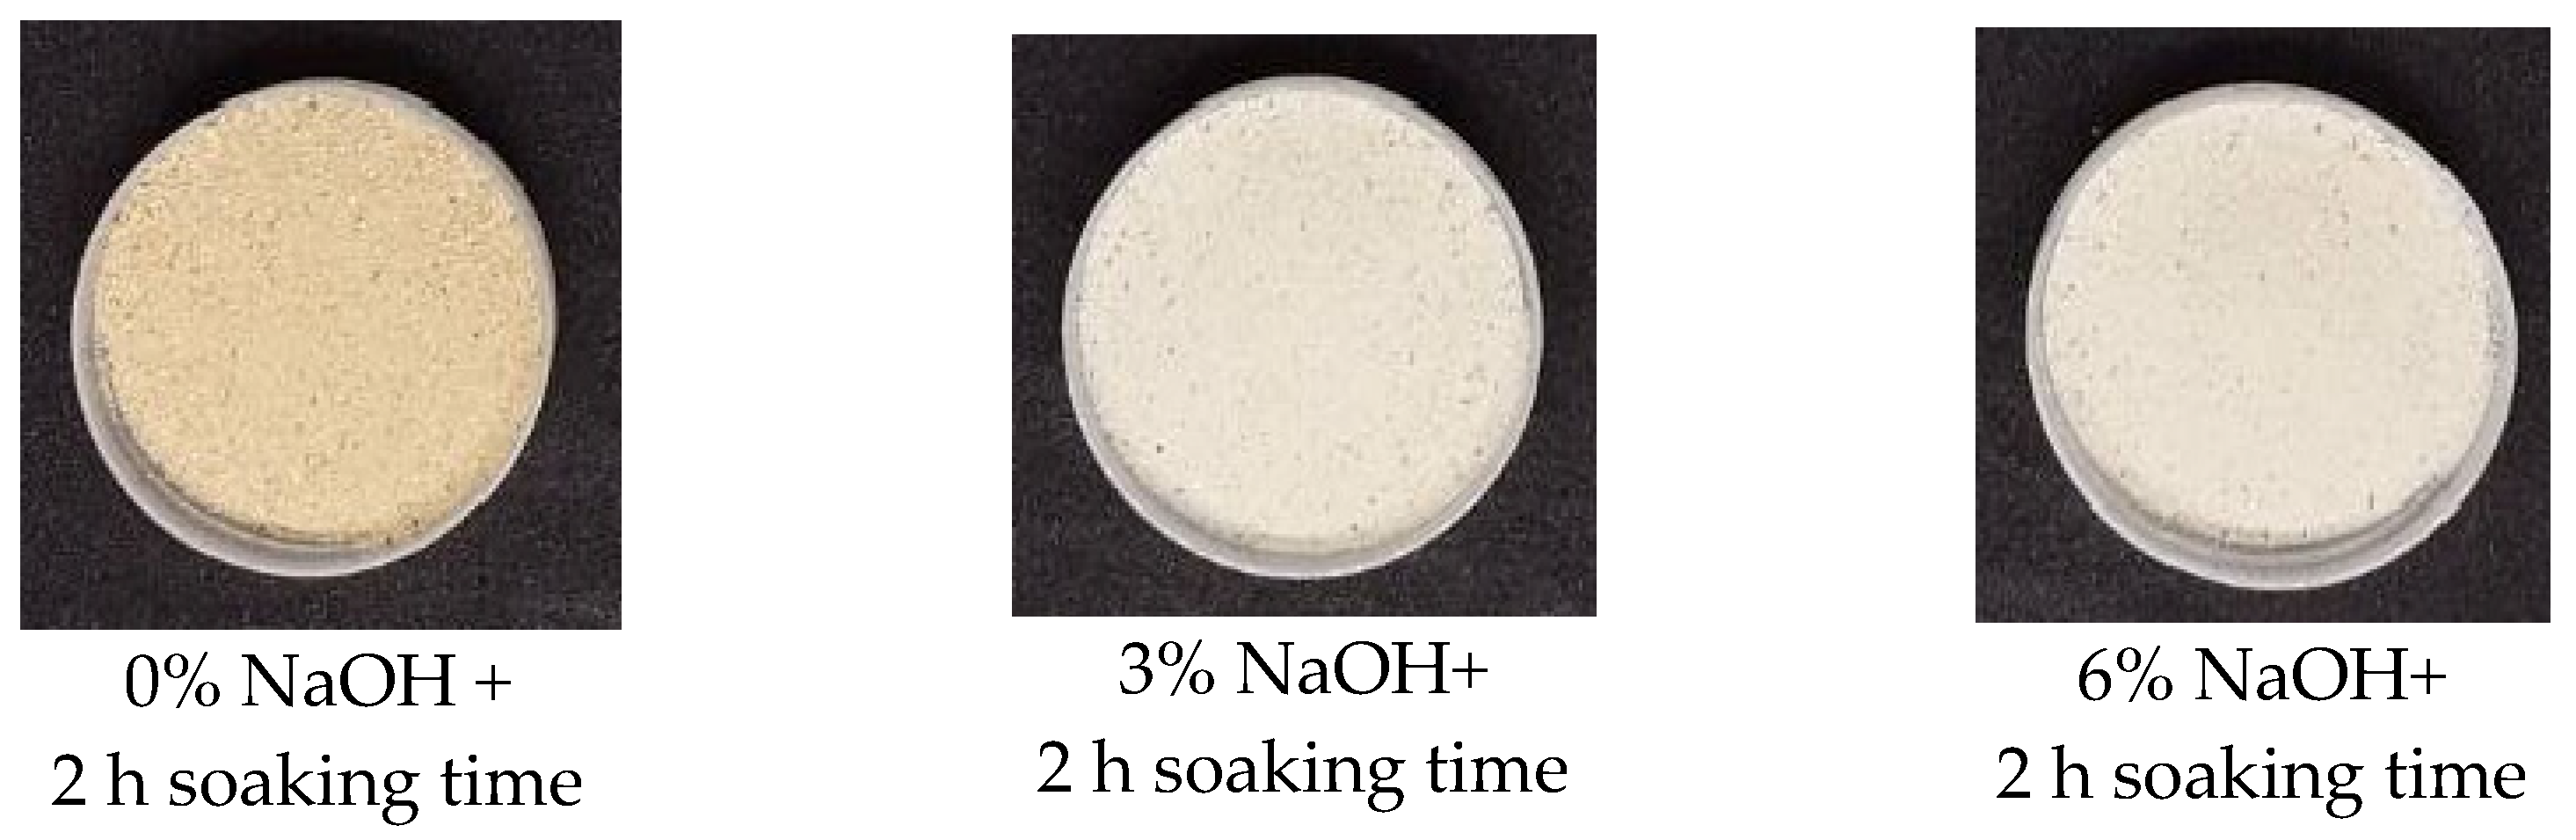
3.1.8. CIE Color Values
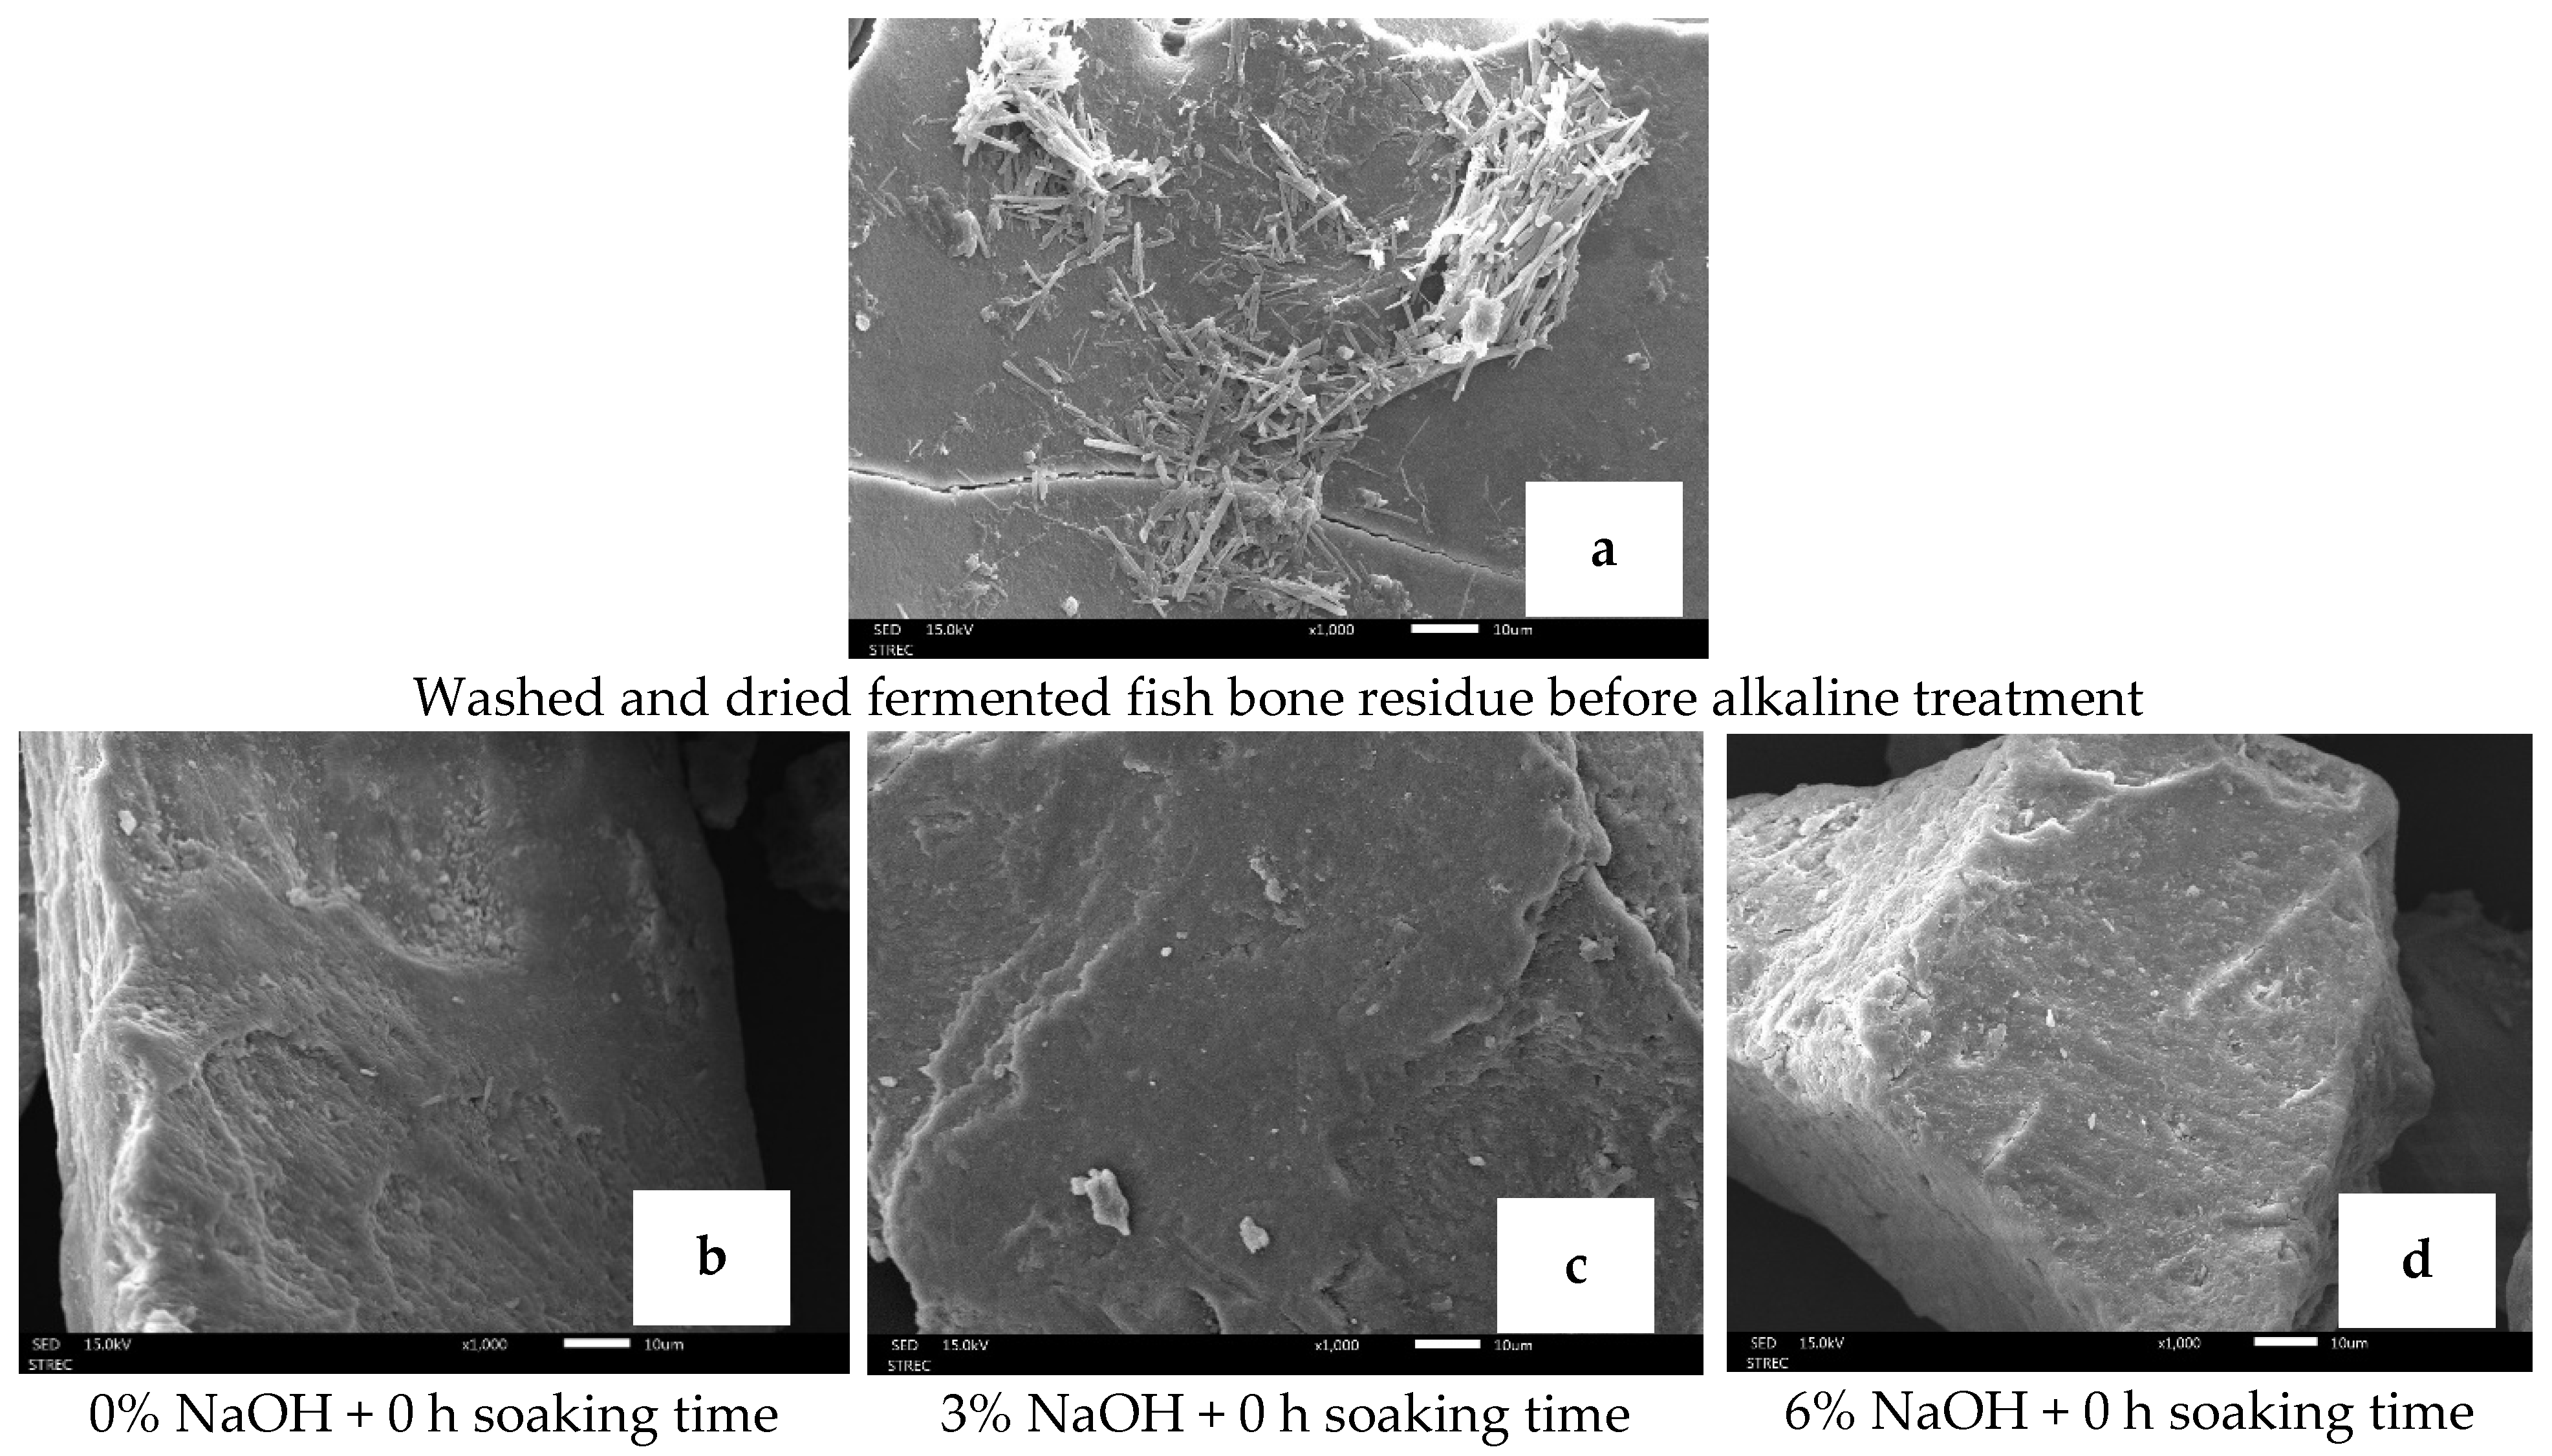
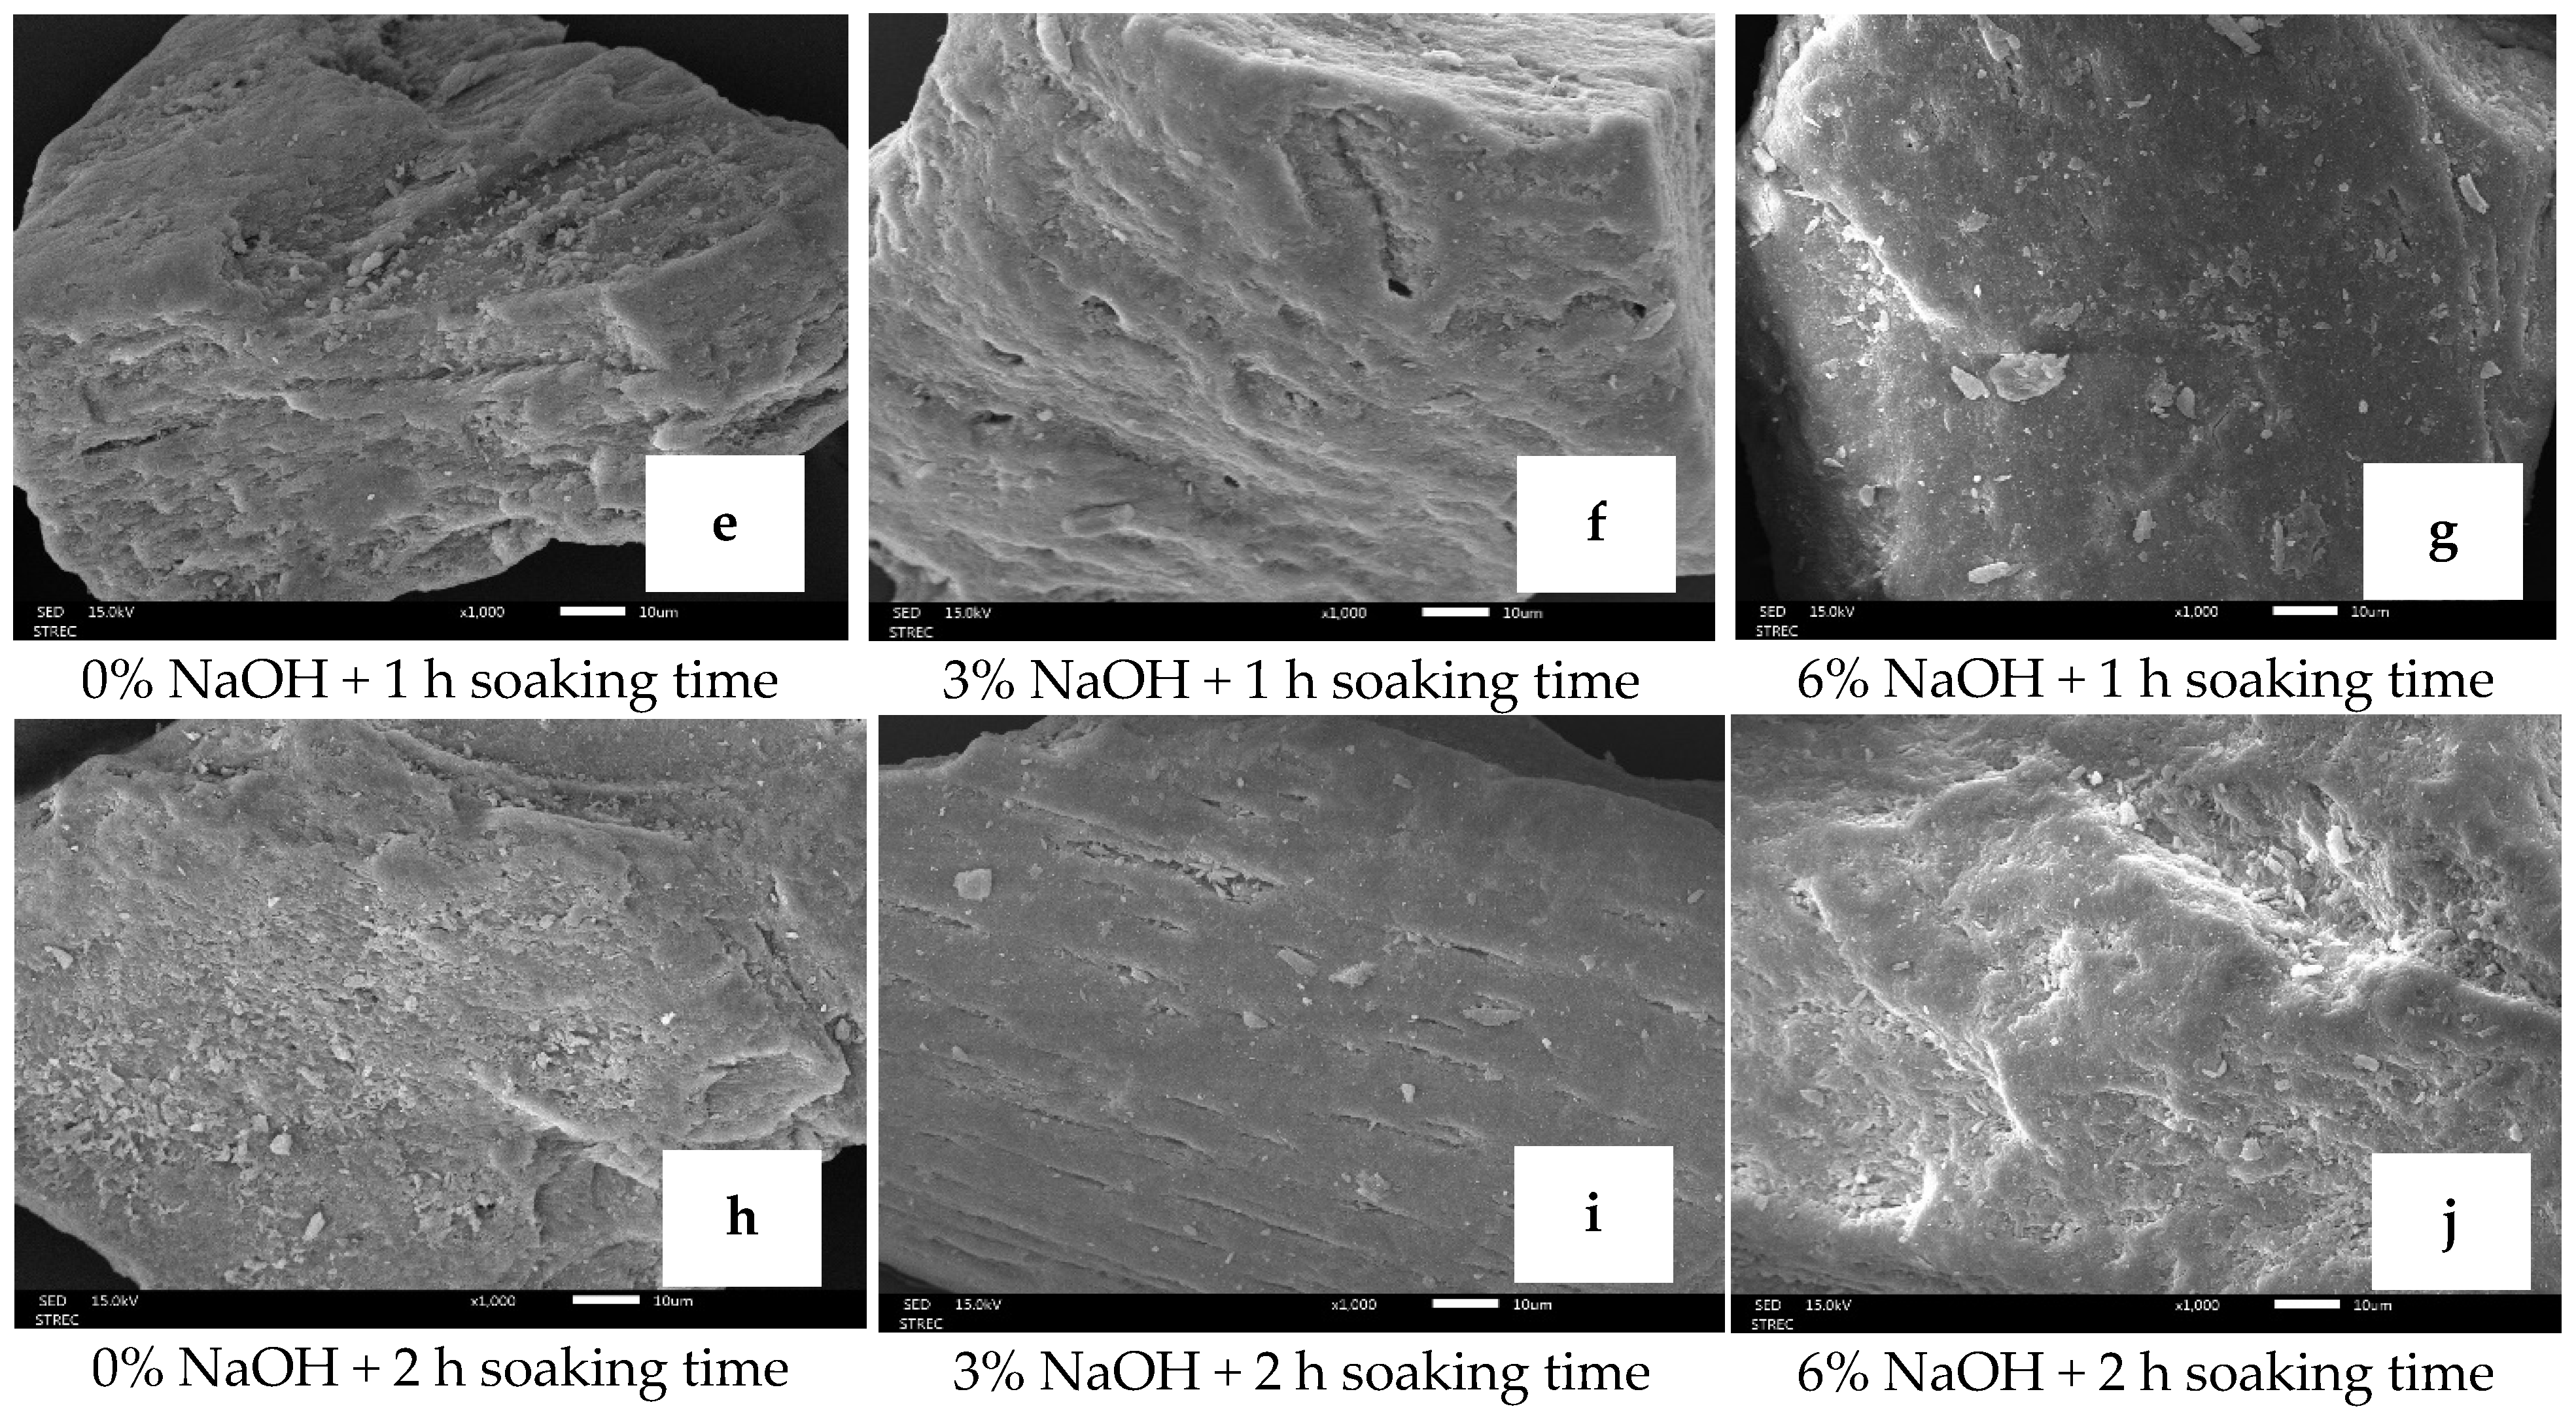
3.1.9. Morphological Structure of Biocalcium Powder
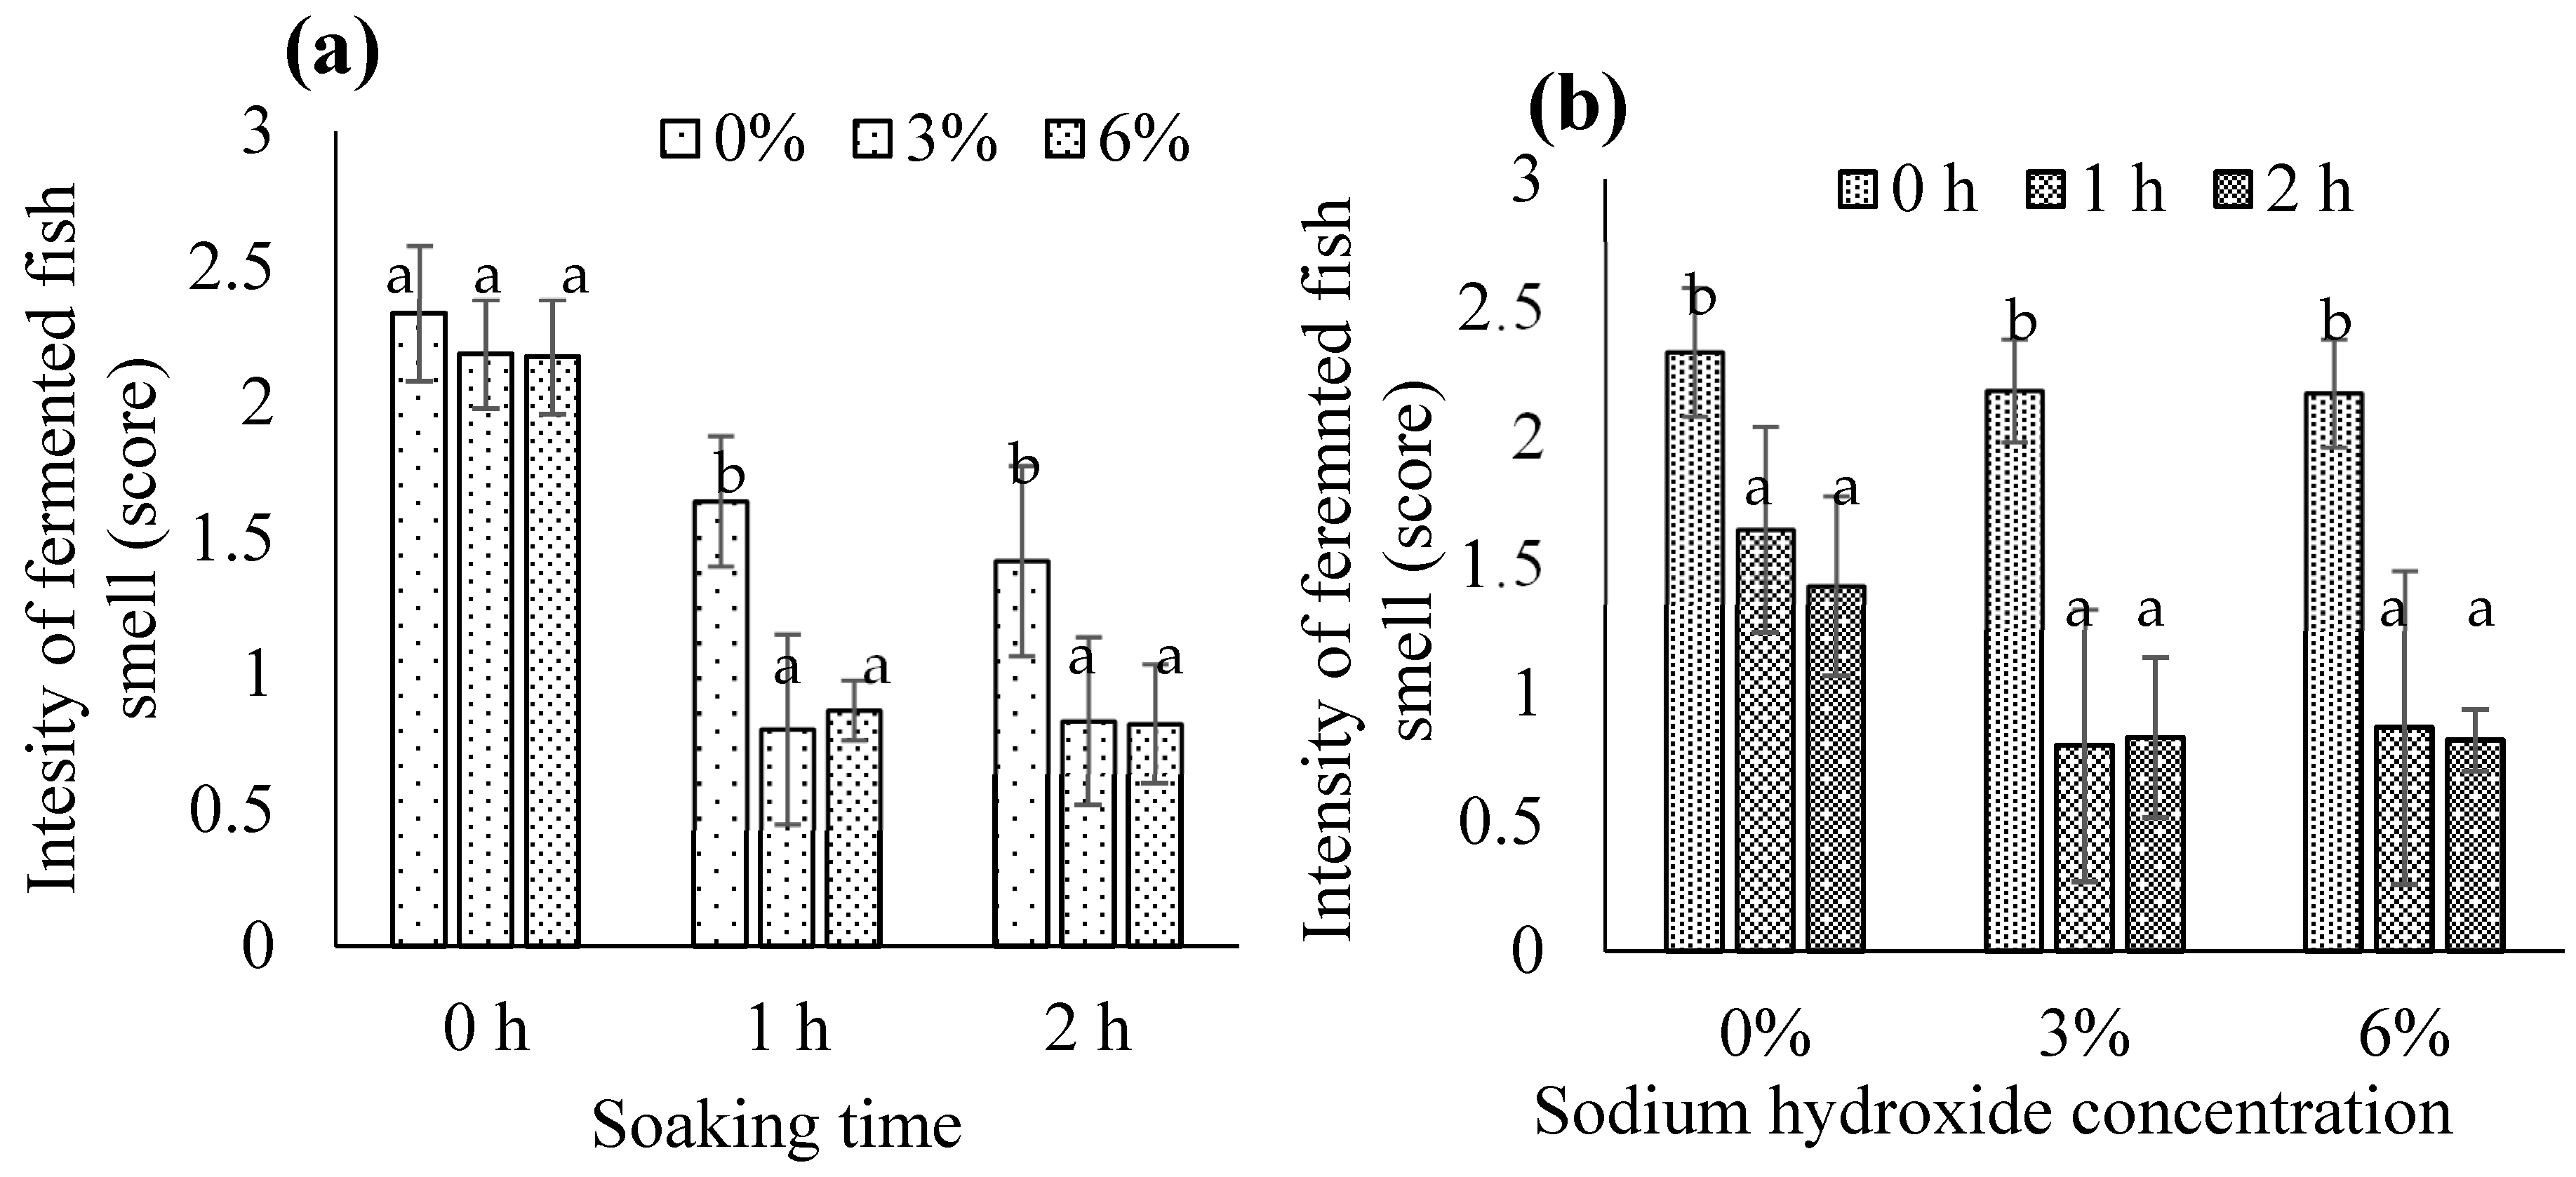
3.1.10. Intensity of the Fermented Fish Smell in Biocalcium Powder
3.2. Fortification of FES with the Properly Treated Biocalcium and Investigation of the Effects of Biocalcium Fortification on FES Quality Parameters
3.2.1. Calcium
3.2.2. Phosphorus
3.2.3. Crude Fiber and Salt Contents
3.2.4. pH
3.2.5. CIE Color Values
3.2.6. Texture Profile Analysis
3.2.7. Emulsion Stability
3.2.8. Sensory Evaluation
4. Conclusions
Author Contributions
Funding
Institutional Review Board Statement
Informed Consent Statement
Data Availability Statement
Acknowledgments
Conflicts of Interest
References
- Krusong, W. Production of Thai fermented fish: Plara, Pla-som, Som-fak. In Industrialization of Indigenous Fermented Foods; Steinkraus, K.H., Ed.; Marcel Dekker: New York, NY, USA, 2004; pp. 707–718. [Google Scholar]
- Gawborisut, S.; Huaisan, K. Production of Micron Fish Bone Powder from Fermented Fish Residue for Fortification of Calcium in Emulsion Meat Products; Program Management Unit for Competitiveness Enhancement (PMU-C): Bangkok, Thailand, 2021; pp. 1–20. [Google Scholar]
- Thai Industrial Standards Institute. Thai Community Product Standard No. 1346/2557: Fermented Fish Sauce, Nam Plara; Thai Industrial Standards Institute: Bangkok, Thailand, 2012; pp. 1–2.
- Asikin, A.N.; Kusumaningrum, I.; Hidayat, T. Effect of knife-fish bone powder addition on characteristics of starch and seaweed Kerupuk as calcium and crude fiber sources. Curr. Res. Nutr. Food Sci. 2019, 7, 584–591. [Google Scholar] [CrossRef]
- Nemati, M.; Huda, N.; Ariffin, F. Development of calcium supplement from fish bone wastes of yellowfin tuna (Thunnus albacares) and characterization of nutritional quality. Int. Food Res. J. 2017, 24, 2419–2426. [Google Scholar]
- Hemung, B. Properties of tilapia bone powder and its calcium bioavailability based on transglutaminase assay. Int. J. Biosci. Biochem. Bioinform. 2013, 3, 306–309. [Google Scholar]
- Nemati, M.; Kamilah, H.; Huda, N.; Ariffin, F. In vitro calcium availability in bakery products fortified with tuna bone powder as a natural calcium source. Int. J. Food Sci. Nutri. 2016, 67, 535–540. [Google Scholar] [CrossRef] [PubMed]
- Amitha, C.V.; Raju, I.P.; Lakshmisha, P.; Kumar, A.; Sarojini, A.; Gajendra; Pal, J. Nutritional composition of fish bone powder extracted from three different fish filleting waste boiling with water and an alkaline media. Int. J. Curr. Microbiol. Appl. Sci. 2019, 8, 2942–2948. [Google Scholar]
- Njoroge, J.G.; Lokuruka, M.N.I. Sensory acceptability of cookies fortified with tilapia fish bone powder. J. Food Nutr. Res. 2020, 2, 94–101. [Google Scholar]
- Fong-in, S.; Phosri, P.; Suttiprapa, S.; Pimpangan, T.; Utama-ang, N. Effect of substitution of wheat flour with Nile tilapia bone powder on the quality characteristics of cashew nut cookies. Chiang Mai Univ. J. Nat. Sci. 2020, 19, 997–1011. [Google Scholar] [CrossRef]
- Ananda, S.; Anggreani, A.A. Suitable of fish bone powder in development of Choco chips cookies. IOP Conf. Ser. Earth Environ. Sci. 2021, 672, 012062. [Google Scholar] [CrossRef]
- Wardah; Sihmawati, R.R. Performance of food quality and sensory properties of Stick with fortification of fish bone flour tuna and kale leaf extract as natural food colorant. Food Sci. Technol. 2022, 5, 31–41. [Google Scholar] [CrossRef]
- Kusumaningrum, I.; Asikin, A.N. The characteristic of calcium fortified fish Keropok from Belida fish bone. J. Pengolah. Has. Perikan. Indones. 2016, 19, 233–240. [Google Scholar] [CrossRef]
- Uthai, N. Effect of partial substituting wheat flour with fish bone powder on the properties and quality of noodles. Afr. J. Food Agric. Nutr. Dev. 2021, 21, 17314–17329. [Google Scholar]
- Chanshotikul, N.; Jirukkakul, N.; Sengkhamparn, N.; Hemung, B. Increasing calcium and dietary fiber of Mu Yo using fish bone and Konjac flour. Asia Pac. J. Sci. Technol. 2018, 23, 8. [Google Scholar]
- Neethu, C.V.; Nair, P.A.; Anil, A.; Vinayak, A.; Shabu, A.; Gowthami, S.; Vaishali, G.; Gorge, J. Development of calcium rich candy from fish bone powder. Int. J. Sci. Res. Publ. 2020, 10, 723–730. [Google Scholar] [CrossRef]
- Shanshan, N.M. The possibility for using fish bone powder to supplement biscuits. J. Food Dairy Sci. Mansoura Univ. 2016, 7, 27–32. [Google Scholar] [CrossRef]
- Hemung, B.; Yongsawatdigul, J.; Chin, K.B.; Limphirat, W.; Siritapetawee, J. Silver carp bone powder as natural calcium for fish sausage. J. Aquat. Food Prod. Technol. 2018, 27, 305–315. [Google Scholar] [CrossRef]
- Hemung, B.; Sriuttha, M. Effects of tilapia bone calcium on qualities of tilapia sausage. Kasetsart J. Nat. Sci. 2014, 48, 790–798. [Google Scholar]
- Akullo, D.; Kigozi, J.; Muyonga, J.H. Nutritional, sensory and shelf life quality of tilapia and Nile perch sausages enriched with fish bone soup. Int. J. Fish. Aquat. Stud. 2020, 8, 646–653. [Google Scholar]
- Yin, T.; Park, J.W.; Xiong, S. Effects of micron fish bone with different particle size on the properties of silver carp (Hypophthalmichthys molitrix) surimi gels. J. Food Qual. 2017, 2017, 8078062. [Google Scholar] [CrossRef]
- Wijayanti, I.; Singh, A.; Benjakul, S.; Sookchoo, P. Textural, sensory, and chemical characteristic of threadfin bream (Nemipterus sp.) surimi gel fortified with bio-calcium from bone of Asian sea bass (Lates calcarifer). Foods 2021, 10, 976. [Google Scholar] [CrossRef]
- Wijayanti, I.; Singh, A.; Prodpran, T.; Sookchoo, P.; Benjakul, S. Effect of Asian sea bass (Lates calcarifer) bio-calcium in combination with different calcium salts on gel properties of threadfin bream surimi. J. Aquat. Food Prod. Technol. 2021, 30, 1173–1188. [Google Scholar] [CrossRef]
- Pudtikajorn, K.; Sae-leaw, T.; Buamard, N.; Zhou, A.; Ma, L.; Benjakul, S. Characterisation of fish tofu fortified with skipjack tuna (Katsuwonus pelamis) eyeball scleral cartilage biocalcium. Int. J. Food Sci. Technol. 2022, 57, 6711–6721. [Google Scholar] [CrossRef]
- Bhenjapaipong, S.; Puttisaowapak, N.; Sutloet, P.; Sompongse, W. Production of fish ball fortified with fish bone powder from salmon. Thai Sci. Technol. J. 2021, 29, 561–571. [Google Scholar]
- Talib, A.; Tangke, U. Diversification of surimi-based processed products (fish meatballs) with the addition of Madidihang fish bone meal. Asian F. Sci. J. 2023, 22, 56–63. [Google Scholar] [CrossRef]
- AOAC. Official Method of Analysis, 18th ed.; AOAC International: Gaithersburg, MD, USA, 2005; pp. 1–800. [Google Scholar]
- Uddin, A.B.M.H.; Khalid, R.S.; Alaama, M.; Abdualkader, A.M.; Kasmuri, A.; Abbas, S.A. Comparative study of three digestion methods for elemental analysis in traditional medicine products using atomic absorption spectrometry. J. Anal. Sci. Technol. 2016, 7, 6. [Google Scholar] [CrossRef]
- Szulczynski, B.; Gebicki, J. Determination of intensity binary gas mixture using perceptual models and an electronic nose combined with fuzzy logic. Sensors 2019, 19, 3473. [Google Scholar] [CrossRef] [PubMed]
- Tirasarot, J.; Wongtanon, C. The utilization of Ang-kak for color development in emulsion fish sausage. Khon Kaen Univ. Sci. J. 2014, 42, 169–175. [Google Scholar]
- Jung, J.; Lee, J.; Choi, Y.; Lee, J.; Choi, J.; Choi, Y.; Chung, Y. Effect of rice bran and wheat fibers on microbiological and physicochemical properties of fermented sausages during ripening and storage. Food Sci. Anim. Resour. 2018, 38, 302–314. [Google Scholar]
- Jeong, Y.; Han, Y. Effect on the emulsification stability and quality of emulsified sausages added with Wanggasi Chunnyuncho (Opuntia humifusa f. jeollaensis) fruit powders. Food Sci. Anim. Resour. 2019, 39, 953–965. [Google Scholar] [CrossRef]
- Meilgaard, M.; Civille, G.V.; Carr, B.T. Sensory Evaluation Techniques; CRC Press: Boca Raton, FL, USA, 1999; pp. 225–257. [Google Scholar]
- Prabu, L.S.; Suriya Trakash, T.N.K.; Thirumurugan, R. Cleaning validation and its regulatory aspects in pharmaceutical industry. In Developments in Surface Contamination and Cleaning; Koli, R., Mittal, K.L., Eds.; Elsevier: New York, NY, USA, 2014; pp. 129–186. [Google Scholar]
- Idowu, A.T.; Benjakul, S.; Sinthusamran, S.; Sae-leaw, T.; Suzuki, N.; Kitani, Y.; Sookchoo, P. Effect of alkaline treatment on characteristics of bio-calcium and hydroxyapatite powders derived from salmon bone. Appl. Sci. 2020, 10, 4141. [Google Scholar] [CrossRef]
- Niwet, J.; Mangumphan, K.; Daengprok, W.; Leelapongwattana, K.; Yarnpakdee, S.; Senphan, T. Development of biocalcium production process from hybrid catfish (Pangasianodon gigas × Pangasianodon hypophthalmus) bone. Burapha Sci. J. 2021, 26, 1532–1544. [Google Scholar]
- Benjakul, S.; Mad-Ali, S.; Senphan, T.; Sookchoo, P. Characteristics of biocalcium from pre-cooked skipjack tuna bone as affected by different treatments. Waste Biomass Valor. 2018, 9, 1369–1377. [Google Scholar] [CrossRef]
- Jintananaruemit, P.; Techakriengkrai, T.; Pasukamonset, P. Physicochemical characteristics of bio-calcium powder from tuna bones by extraction methods. King Mongkut’s Agric. J. 2021, 39, 22–29. [Google Scholar]
- Sriket, C.; Niwet, J.; Pui, L.P.; Yarnpakdee, S.; Senphan, T. Effects of different processes on characteristics and properties of bio-calcium from hybrid catfish (Pangasianodon gigas × Pangasianodon hypophthalmus). Int. J. Food Sci. Technol. 2023, 58, 2161–2169. [Google Scholar] [CrossRef]
- Mohamad Salin, N.S.; Md Saad, W.M.; Abdul Razak, H.R.; Salim, F. Effect of storage temperatures on physico-chemicals, phytochemicals, and antioxidant properties of watermelon juice (Citrullus lanatus). Metabolites 2022, 12, 75. [Google Scholar] [CrossRef] [PubMed]
- Bhaskorol, P.T.; Tjahjaningsih, W.; Mubarak, A.S. The effect of addition of fish bone meal on the concentration of nitrogen (N), phosphorus (P), and potassium (K) in seaweed liquid organic fertilizer of Gracilaria sp. IOP Conf. Ser. Earth Environ. Sci. 2020, 44, 12144. [Google Scholar] [CrossRef]
- Mahdi, Y.S.; Mohammed, A.H.; Mohammed, A.K. Cellulose fibers dissolution in alkaline solution. Al-Khawarizmi Eng. J. 2018, 14, 107–115. [Google Scholar] [CrossRef]
- Wang, T. Preparation of milkfish bone powder by a novel bone-embrittlementing technique and used in manufacturing high calcium egg roll. J. Food Nutr. Res. 2020, 8, 95–101. [Google Scholar]
- Techochatchawal, K.; Therdthai, N.; Khotavivattana, S. Development of calcium supplement from the bone of Nile tilapia (Tilapia nilotica). Asian J. Food Agro-Ind. 2009, 2, 539–546. [Google Scholar]
- Yin, T.; Du, H.; Zhang, J.; Xiong, S. Preparation and characterization of ultrafine fish bone powder. J. Aquat. Food Prod. Technol. 2016, 25, 1045–1055. [Google Scholar] [CrossRef]
- Boutinguiza, M.; Pou, J.; Comesaña, R.; Lusquiños, F.; de Carlos, A.; León, B. Biological hydroxyapatite obtained from fish bones. Mater. Sci. Eng. C 2012, 32, 478–486. [Google Scholar] [CrossRef]
- Nilsuwan, K.; Pomtong, S.; Chedosama, A.; Sookchoo, P.; Benjakul, S. Chemical compositions and characteristics of biocalcium from Asian sea bass (Lates calcarifer) scales as influenced by pretreatment and heating processes. Foods 2023, 12, 2695. [Google Scholar] [CrossRef] [PubMed]
- Thai Food and Drug Administration. Rules, Regulation, and Practice of Nutrification of Foods. Bangkok, 1995. Available online: https://food.fda.moph.go.th/media.php?id=513563807361146880&name=4.4.1-RuleNutrification_Edit1fab49.pdf (accessed on 2 May 2022).
- Ministry of Public Health of Thailand. Nutrient Claims on Food Labels. Bangkok, 1998. Available online: https://rb.gy/n60xpw (accessed on 9 May 2022).
- Kong, X.; Xu, M.; Wan, H.; Han, L.; Liu, X.; Li, Q.; Hao, B.; Zhang, S.; Li, X.; Liu, Y.; et al. Development of a texture evaluation system for winter jujube (Ziziphus jujuba ‘Dongzao’). J. Integr. Agric. 2022, 21, 3658–3668. [Google Scholar] [CrossRef]
- Yin, T.; Park, J.W. Effects of nano-scaled fish bone on the gelation properties of Alaska pollock surimi. Food Chem. 2014, 150, 463–468. [Google Scholar] [CrossRef] [PubMed]
- Chandra, M.V.; Shamasundar, B.A. Texture profile analysis and functional properties of gelatin from the skin of three species of freshwater fish. Int. J. Food Prop. 2015, 18, 572–584. [Google Scholar] [CrossRef]


| Composition (g) | Treatment | |||
|---|---|---|---|---|
| 0 | 12 | 24 | 36 | |
| Ground catfish meat | 5000 | 4988 | 4976 | 4964 |
| Biocalcium | 0 | 12 | 24 | 36 |
| Tapioca flour | 265 | 265 | 265 | 265 |
| Soybean oil | 125 | 125 | 125 | 125 |
| Ice | 1000 | 1000 | 1000 | 1000 |
| Phosphate mix * | 25 | 25 | 25 | 25 |
| Salt | 100 | 100 | 100 | 100 |
| Sugar | 35 | 35 | 35 | 35 |
| Minced garlic | 138 | 138 | 138 | 138 |
| White pepper powder | 25 | 25 | 25 | 25 |
| Meg powder | 8 | 8 | 8 | 8 |
| Total weight | 6721 | 6721 | 6721 | 6721 |
| Quality Parameter | Level of Biocalcium (g) | |||
|---|---|---|---|---|
| 0 | 12 | 24 | 36 | |
| Calcium (mg/100 g) | 1.33 ± 0.52d | 56.93 ± 4.15c | 108.67 ± 2.33b | 163.33 ± 3.46a |
| Phosphorus (mg/100 g) | 259.33 ± 2.81d | 279.23 ± 2.55c | 316.02 ± 3.60b | 343.87 ± 3.06a |
| Crude fiber (%) | 0.83 ± 0.36a | 0.84 ± 0.23a | 0.85 ± 0.11a | 0.85 ± 0.26a |
| Salt content (%) | 1.50 ± 0.53a | 1.53 ± 0.62a | 1.51 ± 0.79a | 1.56 ± 0.67a |
| Quality Parameter | Level of Biocalcium (g) | ||||
|---|---|---|---|---|---|
| 0 | 12 | 24 | 36 | ||
| pH | 6.71 ± 0.13a | 6.74 ± 0.28a | 6.70 ± 0.25a | 6.77 ± 0.26a | |
| CIE color values | L* | 64.28 ± 2.59a | 65.68 ± 1.43a | 66.24 ± 1.11a | 66.70 ± 1.14a |
| a* | 1.38 ± 0.39a | 1.23 ± 0.46a | 1.01 ± 0.09a | 1.37 ± 0.48a | |
| b* | 17.82 ± 0.55a | 17.92 ± 0.74a | 18.53 ± 0.26a | 18.49 ± 0.86a | |
| Texture profile analysis | Hardness (kg) | 8.99 ± 0.23a | 8.56 ± 0.21a | 8.82 ± 0.15a | 8.66 ± 0.20a |
| Adhesiveness (g.s) | −27.71 ± 0.89a | −24.23 ± 0.22b | −24.16 ± 0.10b | −24.88 ± 0.35b | |
| Springiness | 0.84 ± 0.02a | 0.84 ± 0.02a | 0.84 ± 0.02a | 0.84 ± 0.03a | |
| Cohesiveness | 0.52 ± 0.05a | 0.40 ± 0.06b | 0.40 ± 0.07b | 0.42 ± 0.07b | |
| Gumminess (kg) | 4.75 ± 0.13a | 3.40 ± 0.10b | 3.48 ± 0.10b | 3.58 ± 0.16b | |
| Chewiness (kg) | 4.41 ± 0.58a | 3.55 ± 0.62b | 3.52 ± 0.74b | 3.33 ± 0.36b | |
| Emulsion stability | Water loss (%) | 13.65 ± 0.81a | 14.78 ± 0.62a | 14.53 ± 0.52a | 14.87 ± 0.82a |
| Fat Loss (%) | 4.82 ± 0.74a | 5.13 ± 0.68a | 5.26 ± 0.73a | 5.34 ± 0.67a | |
| Quality Parameter | Level of Biocalcium (g) | ||||
|---|---|---|---|---|---|
| 0 | 12 | 24 | 36 | ||
| Sensory evaluation (score) | Interior appearance | 6.70 ± 1.40a | 6.75 ± 1.60a | 6.82 ± 1.57a | 6.72 ± 1.70a |
| Interior color | 6.62 ± 1.55a | 6.46 ± 1.56a | 6.66 ± 1.49a | 6.38 ± 1.72a | |
| Odor | 6.36 ± 1.82a | 6.41 ± 1.45a | 6.28 ± 2.4a | 6.62 ± 1.78a | |
| Mouthfeel texture | 7.26 ± 1.31a | 7.41 ± 1.61a | 7.40 ± 1.54a | 7.30 ± 1.37a | |
| Flavor | 6.78 ± 1.62a | 6.82 ± 1.75a | 6.76 ± 1.91a | 7.04 ± 1.69a | |
| Overall acceptability | 7.22 ± 1.53a | 7.23 ± 1.38a | 7.22 ± 1.56a | 7.26 ± 1.54a | |
| The intensity of fermented fish smell | 0.00 ± 0.00a | 0.00 ± 0.00a | 0.00 ± 0.00a | 0.00 ± 0.00a | |
Disclaimer/Publisher’s Note: The statements, opinions and data contained in all publications are solely those of the individual author(s) and contributor(s) and not of MDPI and/or the editor(s). MDPI and/or the editor(s) disclaim responsibility for any injury to people or property resulting from any ideas, methods, instructions or products referred to in the content. |
© 2024 by the authors. Licensee MDPI, Basel, Switzerland. This article is an open access article distributed under the terms and conditions of the Creative Commons Attribution (CC BY) license (https://creativecommons.org/licenses/by/4.0/).
Share and Cite
Gawborisut, S.; Ketkaew, C.; Buasook, T. Production of Biocalcium from Fermented Fish Bone Residue for Fish Emulsion Sausage Fortification. Foods 2024, 13, 882. https://doi.org/10.3390/foods13060882
Gawborisut S, Ketkaew C, Buasook T. Production of Biocalcium from Fermented Fish Bone Residue for Fish Emulsion Sausage Fortification. Foods. 2024; 13(6):882. https://doi.org/10.3390/foods13060882
Chicago/Turabian StyleGawborisut, Somsamorn, Chavis Ketkaew, and Thongsa Buasook. 2024. "Production of Biocalcium from Fermented Fish Bone Residue for Fish Emulsion Sausage Fortification" Foods 13, no. 6: 882. https://doi.org/10.3390/foods13060882