3.1. Encapsulation Efficiency and Encapsulation Yield
A total of 17 encapsulation sets were carried out using GW as the main coating and selected carbohydrate co-coatings (T, S, MD, X) in varying proportions according to the experimental design described in
Section 2.4. To determine the efficiency of the used coatings, the content of total phenolic compounds (TPC) and surface phenolic compounds (SPC) was determined using the prepared MCs as described in
Section 2.5 and
Section 2.6. The results are shown in
Table 2.
The highest concentration of TPC (124.09 mgGAE/gdb) was found for the MCs coated with GW (GW1), while for the other MCs coated with GW and co-coating, the concentration of TPC varied between 94.12 and 117.34 mgGAE/gdb. The Folin–Ciocalteu method, a spectrophotometric method, is often used for a relatively rapid and inexpensive determination of TPC. However, it is known that the Folin–Ciocalteu reagent is not strictly specific for phenolic substances; it also reacted with other substances, including the proteins present in the samples. Since sample GW1 contained the highest amount of goat whey protein compared to all the other MCs, this could be the result of a slightly higher concentration of the measured TPC value, which does not necessarily correlate with the sum of the concentrations of all the quantified individual phenolic substances in the MCs. It can be observed that the increase in the amount of co-coating influences the decrease in the amount of TPC, regardless of the type of co-coating. On the other hand, the SPC values increased with the increase in the proportion of individual co-coatings and varied from 4.54 mgGAE/gdb (MD5) to 22.15 mgGAE/gdb (T30). In general, MD proved to be the co-coater that had the lowest concentration of non-encapsulated, i.e., surface phenolic compounds, and the MD samples differed least in their SPC content from the GW samples. A statistically significant difference in the content of TPC and SPC was recorded both within a particular group of co-coatings and in general between MCs.
The encapsulation efficiency (EE) of GPE with GW and GW in combination with four different co-coatings was evaluated based on the TPC and SPC values. The values for EE, the moisture content of the MCs, and the encapsulation yield (Y) were determined according to
Section 2.7,
Section 2.8 and
Section 2.9, and the results obtained are shown in
Figure 1.
When GW was used as a coating material for GPE spray drying, the EE reached 95.47% (
Figure 1a). In the MCs encapsulated with a combination of GW and T coatings or MD, the amount of co-coating added had no effect on EE, whereas in the other two groups of MCs, the lowest EE was achieved with the application of 20% S and 15% X. In general, the inclusion of MD as a co-coating in conjunction with GW results in very high spray drying EE rates (91.1–92.5%).
As seen in
Figure 1b, the moisture content in the produced MC varied from 4.98% (GW1) to 5.98% (MD10), and visually, no agglomerate formation was noticed. The reduction in the total proportion of GW and the addition of the co-coatings resulted in an increase in the moisture in all the MC samples. A low moisture content, in the amount of 3–4%, was also reported by the authors Navarro-Flores et al. [
42], who attributed this to the high drying inlet temperature that contributed to a higher rate of heat transfer to the particles, causing rapid water evaporation. A moisture level of less than 10% is thought to be adequate to ensure that the fruit powder produced via spray draying is microbiologically safe [
43].
The Y value can be seen as an indicator of the value of a product for manufacturers. In encapsulation processes, Y can be defined as the output of the physical and chemical properties of MCs. With the help of the calculated Y values, it is possible to compare different encapsulation processes [
44]. According to Tontul and Topuz [
45], any spray drying with a Y value greater than 50% can be characterized as successful. The Y for all the encapsulations in this investigation was extremely high, higher than the 91.18% recorded for T5 (
Figure 1c). We attributed the high Y to the use of GW protein as the main coating material, which improved the MC properties and minimized stickiness, ensuring a very high product yield (91.18–99.77%) in all the test series. Within the groups of MCs, it was observed that with the addition of a higher concentration of co-coating, the Y value also increased slightly. The samples with the addition of T had the lowest Y values on average.
3.2. Microcapsule Characteristics
Density (bulk density, BD and tap density, TD), flowability, and cohesiveness are important properties of powders. The high BD of MCs is favorable for lowering transportation and packaging costs [
45]. Lower product BDs are undesirable, since they necessitate more container space. Furthermore, as the bulk density decreases, more air is trapped inside the MCs, and the product is more likely to oxidize, resulting in decreased storage stability [
46]. The specified properties of the MCs in this paper were determined as stated in
Section 2.10 and
Section 2.11, and the results are shown in
Figure 2.
All the experiments showed low density values (
Figure 2a), which, according to Braga et al. [
47], may be a consequence of the high inlet temperature. Within the S, X, and MD groups, the value of BD and TD decreased with increasing concentrations of the added co-coatings. According to the classification of the European Pharmacopoeia [
48] and the calculated values for CI (
Figure 2b) and HR (
Figure 2c), the flowability and cohesion of the MC for the GW1, T5, T10, MD10, and MD15 samples can be characterized as poor, with a CI between 26–31% and HR of 1.35–1.45. Samples T20, S5, X10, and X30 had a very poor flowability (CI = 32–37%, HR = 1.46–1.59), and all the other samples have a very poor fluidity (CI > 38%, HR > 1.60). The poor flowability of all the produced MCs can be attributed to the large proportion of whey proteins, which have a significant proportion of fat in their composition and are therefore exhibit poor flowability. The size of the MCs also has an effect on the flowability of the MCs. As the particle size decreases, the specific surface area increases, and this leads to reduced flowability. A larger contact area becomes available, especially for cohesive forces, resisting flow frictional forces. In addition, the reduced flowability of the MCs can also be caused by an increase in humidity, as this results in an increase in the effects of the capillary forces between the MC particles [
49]. Furthermore, according to Tontul and Topuz [
45], the surface of the particles affects the bulk density of the MCs, i.e., the smoother and more uniform the particles are, the higher the bulk density value.
Particle size, shape, and size distribution also play essential roles in MC food processing, handling, and shelf life, with particle microstructure influencing various MC qualities such as stability and fluidity. The drying technique and parameters have a significant impact on particle size, shape, and distribution [
50].
Table 3 shows that the average particle size of the produced MCs varied from 3.31 μm (S30) to 4.61 μm (MD2.5). However, within the MD group of MCs, it was noticed that with an increase in the concentration of added MD from 2.5 to 10%, the particle size decreased. According to Medina-Torres et al. [
51], a particle qualifies as fine if its average diameter is less than 5 μm. Accordingly, every coating material combination we have used produces a fine powder. After contrasting our findings with those of other authors, we came to the conclusion that our particles were more uniform and smaller than those of other spray-dried fruits with carriers. The average particle size of acai MCs ranged from 9.33 μm to 13.67 μm [
52], while the particle size of ripe mango fruit MCs was 88.879 μm [
53], whereas the particle size of baobab fruit MCs was 953 μm [
54]. During the production of whey protein isolate particles with trehalose used as a stabilizer, the particle size varied from 100 to 1000 nm [
29]. Nonetheless, the small particle size of our samples is consistent with the claims made by Verruck et al. [
28] and Ćujić-Nikolić et al. [
55].
Table 3 shows that sample GW1 had the highest span value (2.20), which means that it was the least homogeneous sample, i.e., the one with the widest particle size distribution, indicating the uniformity of the sample. As a result, it also had the highest bulk density of 0.11 g/cm
3. Sample X30 was the most homogenous sample, i.e., the sample with the smallest span value of 1.73. In general, the entire group of samples with X used as the co-coating had the lowest span values of 1.73–1.97.
The solubility parameters WSI, WAI, and SP are important indicators of the functional properties of the product and are indicators in the application and storage of MCs. WSI represents the ability of the MCs to dissolve in water. The desirability of a higher WSI value depends on the final application of the MC product. If the MC is intended to be used in the food or pharmaceutical industries, a high WSI is especially important so that the MCs are easily incorporated and evenly distributed within the final product. WAI values are related to the degree of gelatinization and microbial stability. The higher the WAI values, the greater the possibility of microbiological instability of the MC products [
19]. The solubility properties of the MCs determined in this study are listed in
Table 4.
The MCs with X used as the co-coating showed the highest water solubility (WSI). Within that group, the WSI values varied from 51.80 to 63.15%. In addition, the MCs from the group showed the highest WAI values (4.60–5.18) as well as the highest SP values (10.75–13.93). The small size and uniformity of the capsules certainly contributed to the good solubility of the X microcapsules. In contrast to X, the use of MD as the co-coating material resulted in MCs with the lowest WSI and SP values. Within that group, the WSI ranged from 43.91 to 51.17% and the SP values ranged from 8.11 to 9.64. The reason for this may be cross-linking of MD with other compounds, which results in lower values of solubility and swelling ability compared to the other samples. During encapsulation via spray drying the phenolic mango extract, MCs with lower WSI (8.62% to 24.28%) and WAI (2.58% to 3.91%) values were obtained [
19]. Unlike these MCs, Sidlagatta et al. [
56] reported a WSI value of 77.9 to 89.8% as well as WAI values of 6.7 to 12.3% for a spray-dried sweet orange MC.
Based on the value of the contact angle of water and diiodomethane, the polarity of the samples was calculated as described in
Section 2.14, which ranged from 36.46% (MD2.5) to 48.39% (S20), as shown in
Table 4. It can be concluded that all the prepared MCs are hydrophilic, which indicates their good solubility in water. According to Chang et al. [
57], many spray-dried plant extracts contain a considerable amount of hydrophilic substances in their composition, which makes them hygroscopic.
X-ray powder diffraction (XRPD) and differential scanning calorimetry (DSC) analyses were used to investigate the crystallinity and amorphousness of the MC samples. The XRPD patterns and the DSC thermograms of the MC samples are shown in
Figure 3. As stated by numerous authors, spray drying produces mostly amorphous MCs.
Figure 3a shows that the co-coating materials S (S0), T (T0), and X (X0) have a crystalline structure. The spray-dried MCs containing 10% T (T10), S (S10), X (X10), 5% MD (MD5), and MC containing only GW (GW1) had a partially crystalline structure, while all the other MCs had an amorphous structure according to the XRPD results, as did the GW (GW0) and MD (MD0) coatings. Spray drying of fruit juices, according to Cano-Chauca et al. [
58], results in MCs with a high proportion of sugars present in an amorphous state due to the drying process used.
Because these sugars are exceedingly hygroscopic, they can crystallize by absorbing only a small amount of water. Because the ordered system of the crystalline structure promotes product stability, this type of structure in final products is constantly sought. By investigating the effects of various conditions on water-induced crystallization across different amorphous materials obtained via spray drying, the authors Chiou and Langrish [
59] came to similar conclusions. They verified that products require longer times to crystallize when their molecular weight and glass transition temperature are higher. Since grape pomace extract is also rich in numerous sugars, it is possible that water adsorption is precisely the reason for the partially crystalline structure of the mentioned samples. During the crystallinity test, in contrast to our research, the addition of sugar by the authors Haque et al. [
29] did not cause the appearance of peaks on the X-ray diffractograms, and thus the structures of these MCs were characterized as amorphous. The use of cellulose or waxy starch in combination with MD caused a partially crystalline structure of the soy sauce MCs [
60].
The DSC thermograms (
Figure 3b) of MC samples GW1, T10, S10, MD5, and X10 showed endothermic peaks at a temperature of around 240 °C, which confirms the partially crystalline structure proven by the XRPD analysis. Slightly broadened peaks are also visible from the DSC curves of the spray-dried MC samples, indicating water loss. Endothermic peaks are visible in the DSC curves of the samples of pure co-coatings with crystalline structures (T0, S0, and X0), indicating their melting points.
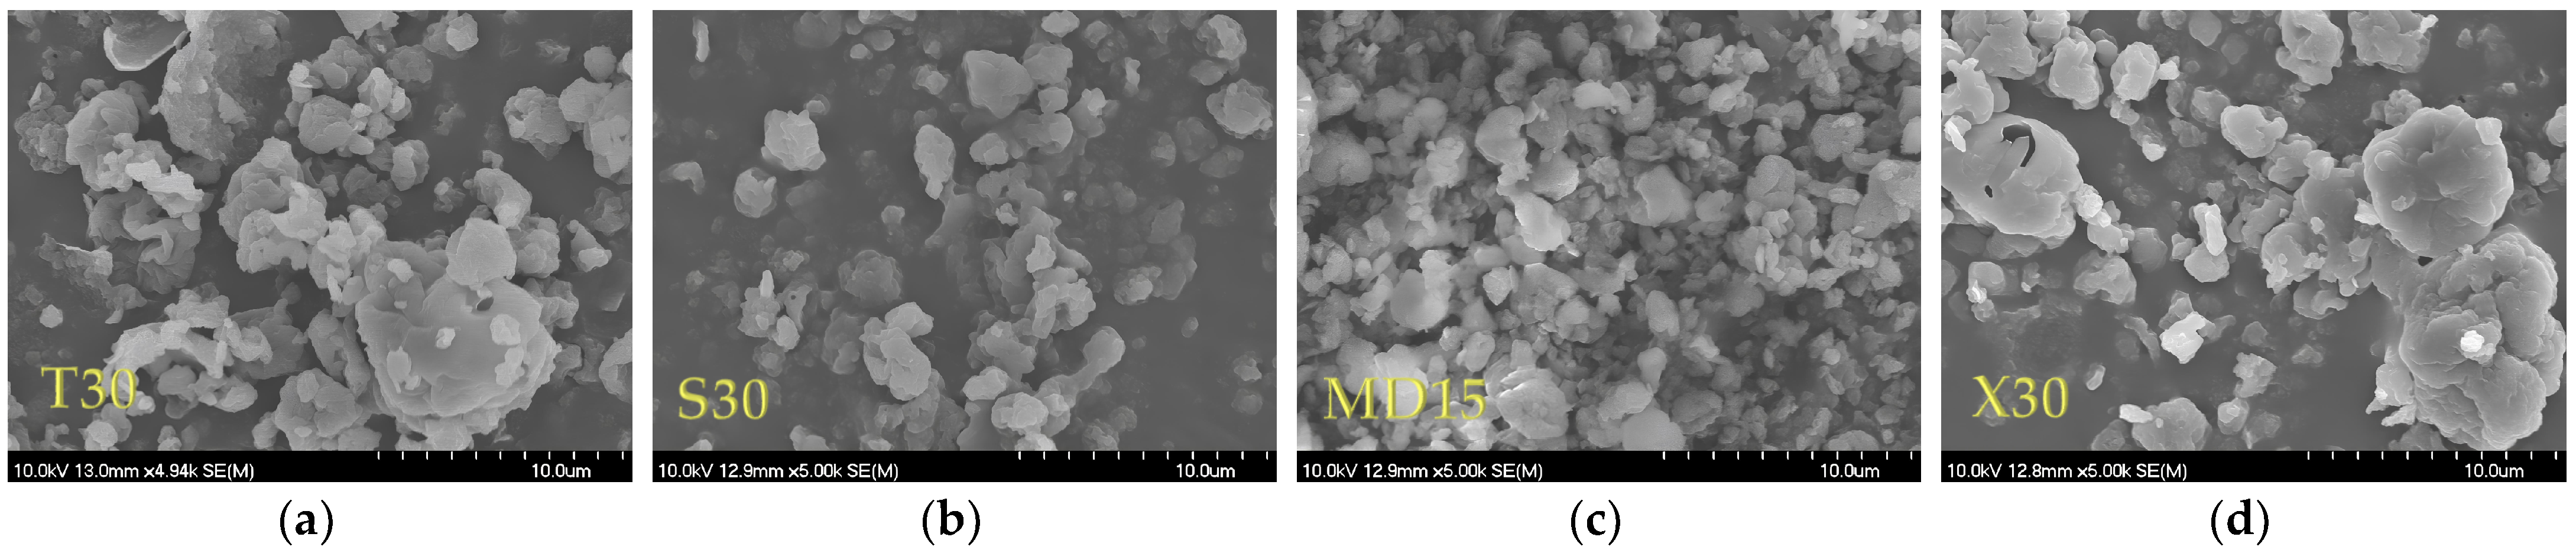
The scanning electron microscope (SEM) images of the coatings and MC samples are shown in
Figure 4 (GW and MCs coated with GW) and
Figure 5 (T, S, MD, X, and MCs coated with GW and co-coating in different ratios). It can be seen that all the MC particles had an approximately spherical shape, their surface was not smooth, and the particles were not uniform in size and morphology. This is one of the explanations for the low density of our MCs, and it confirms the results of the size distribution parameters (
Table 3).
It can be clearly seen (
Figure 4 and
Figure 5) that the coating particles (GW0, T0, S0, MD, and X0) were larger than the MCs produced via spray drying. The MD0 particles were closer to the spherical form, while the rest of the coatings were irregular particles. Also, the hollow structure of the GW itself was very noticeable, which was not visible in the spray-dried, GW-coated MCs (
Figure 4a).
In all the SEM micrographs shown in
Figure 5, it is visible that the combination of GW coatings with co-coatings created MCs whose particles were of different, irregular shapes and sizes, with some of them being in agglomerates. The size and surface appearance of each group of MCs created via spray drying were observed to differ significantly from the coating and co-coating materials. The shriveling of the MCs is explained as a consequence of fast water evaporation due to spray drying. Navarro-Flores et al. [
42] stated that the rapid evaporation of water can result in the hardening of the capsule, which leads to retention of the original shape or the evaporation of water and the formation of shriveled microcapsules.
According to Haque et al. [
29], the wrinkles on the surface of whey protein MCs are the result of the formation of a “skin”, which is characteristic of all protein-rich substances. This property, combined with the rapid evaporation of water during spray drying, results in particles that exhibit protrusions. These deviations from the regular spherical shape of all MCs are the result of the poor flow properties reflected in the CI and HR values (
Figure 2) and good solubility properties (
Table 4). According to Oliveira et al. [
61], such protrusions can have a negative influence on the flow properties of the MCs, but they have no influence on the stability of the MCs. It is also noted that the addition of sugar as a protein stabilizer of GW has an influence on the morphology of the particles, i.e., the MCs with the addition of T, S, and X had smoother surfaces compared to the GW1 MCs. In the case of MCs with the addition of X, the smooth pits were most pronounced. A hollow structure can also be seen in the image for the MD particles. In their study, the authors Wijiani et al. [
62] reported the same effect of the addition of S on the morphology of the particles. In this study, the particles with added S had a smoother surface than the particles without sucrose in their composition.
Based on the results of the above analyses, one representative with good properties (GW1, T10, S10, MD5, and X10) was selected from each MC group to perform in vitro release and in vitro digestion simulation experiments.
3.3. In Vitro Release of Phenolic Compounds from MCs
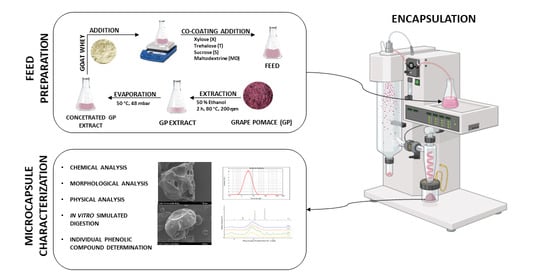
The encapsulation technique allows the matrix to remain isolated from the external environment and offers stability in unfavorable circumstances until the compound needs to be released. Matrix release can be caused by a variety of factors, some of which include diffusion, degradation, solvents, pH, temperature, and pressure [
63]. The release of phenolic compounds from the spray-dried MCs took place in the oral, gastric, and intestinal phases using solutions without enzymes that simulate the conditions in a particular phase of the gastrointestinal tract. The use of the coating material enables the protection of phenolic compounds from adverse environmental conditions such as low pH values in the gastric phase and ensures safe transport and release in the intestinal phase [
38]. Phenolic compounds are adsorbed in the intestinal phase; about 46% in the small intestine and 42% in the large intestine [
64]. The adsorption of phenolic compounds in the intestinal phase enables the manifestation of their numerous biological activities, such as antioxidant, antimicrobial, or antiproliferative activities [
65].
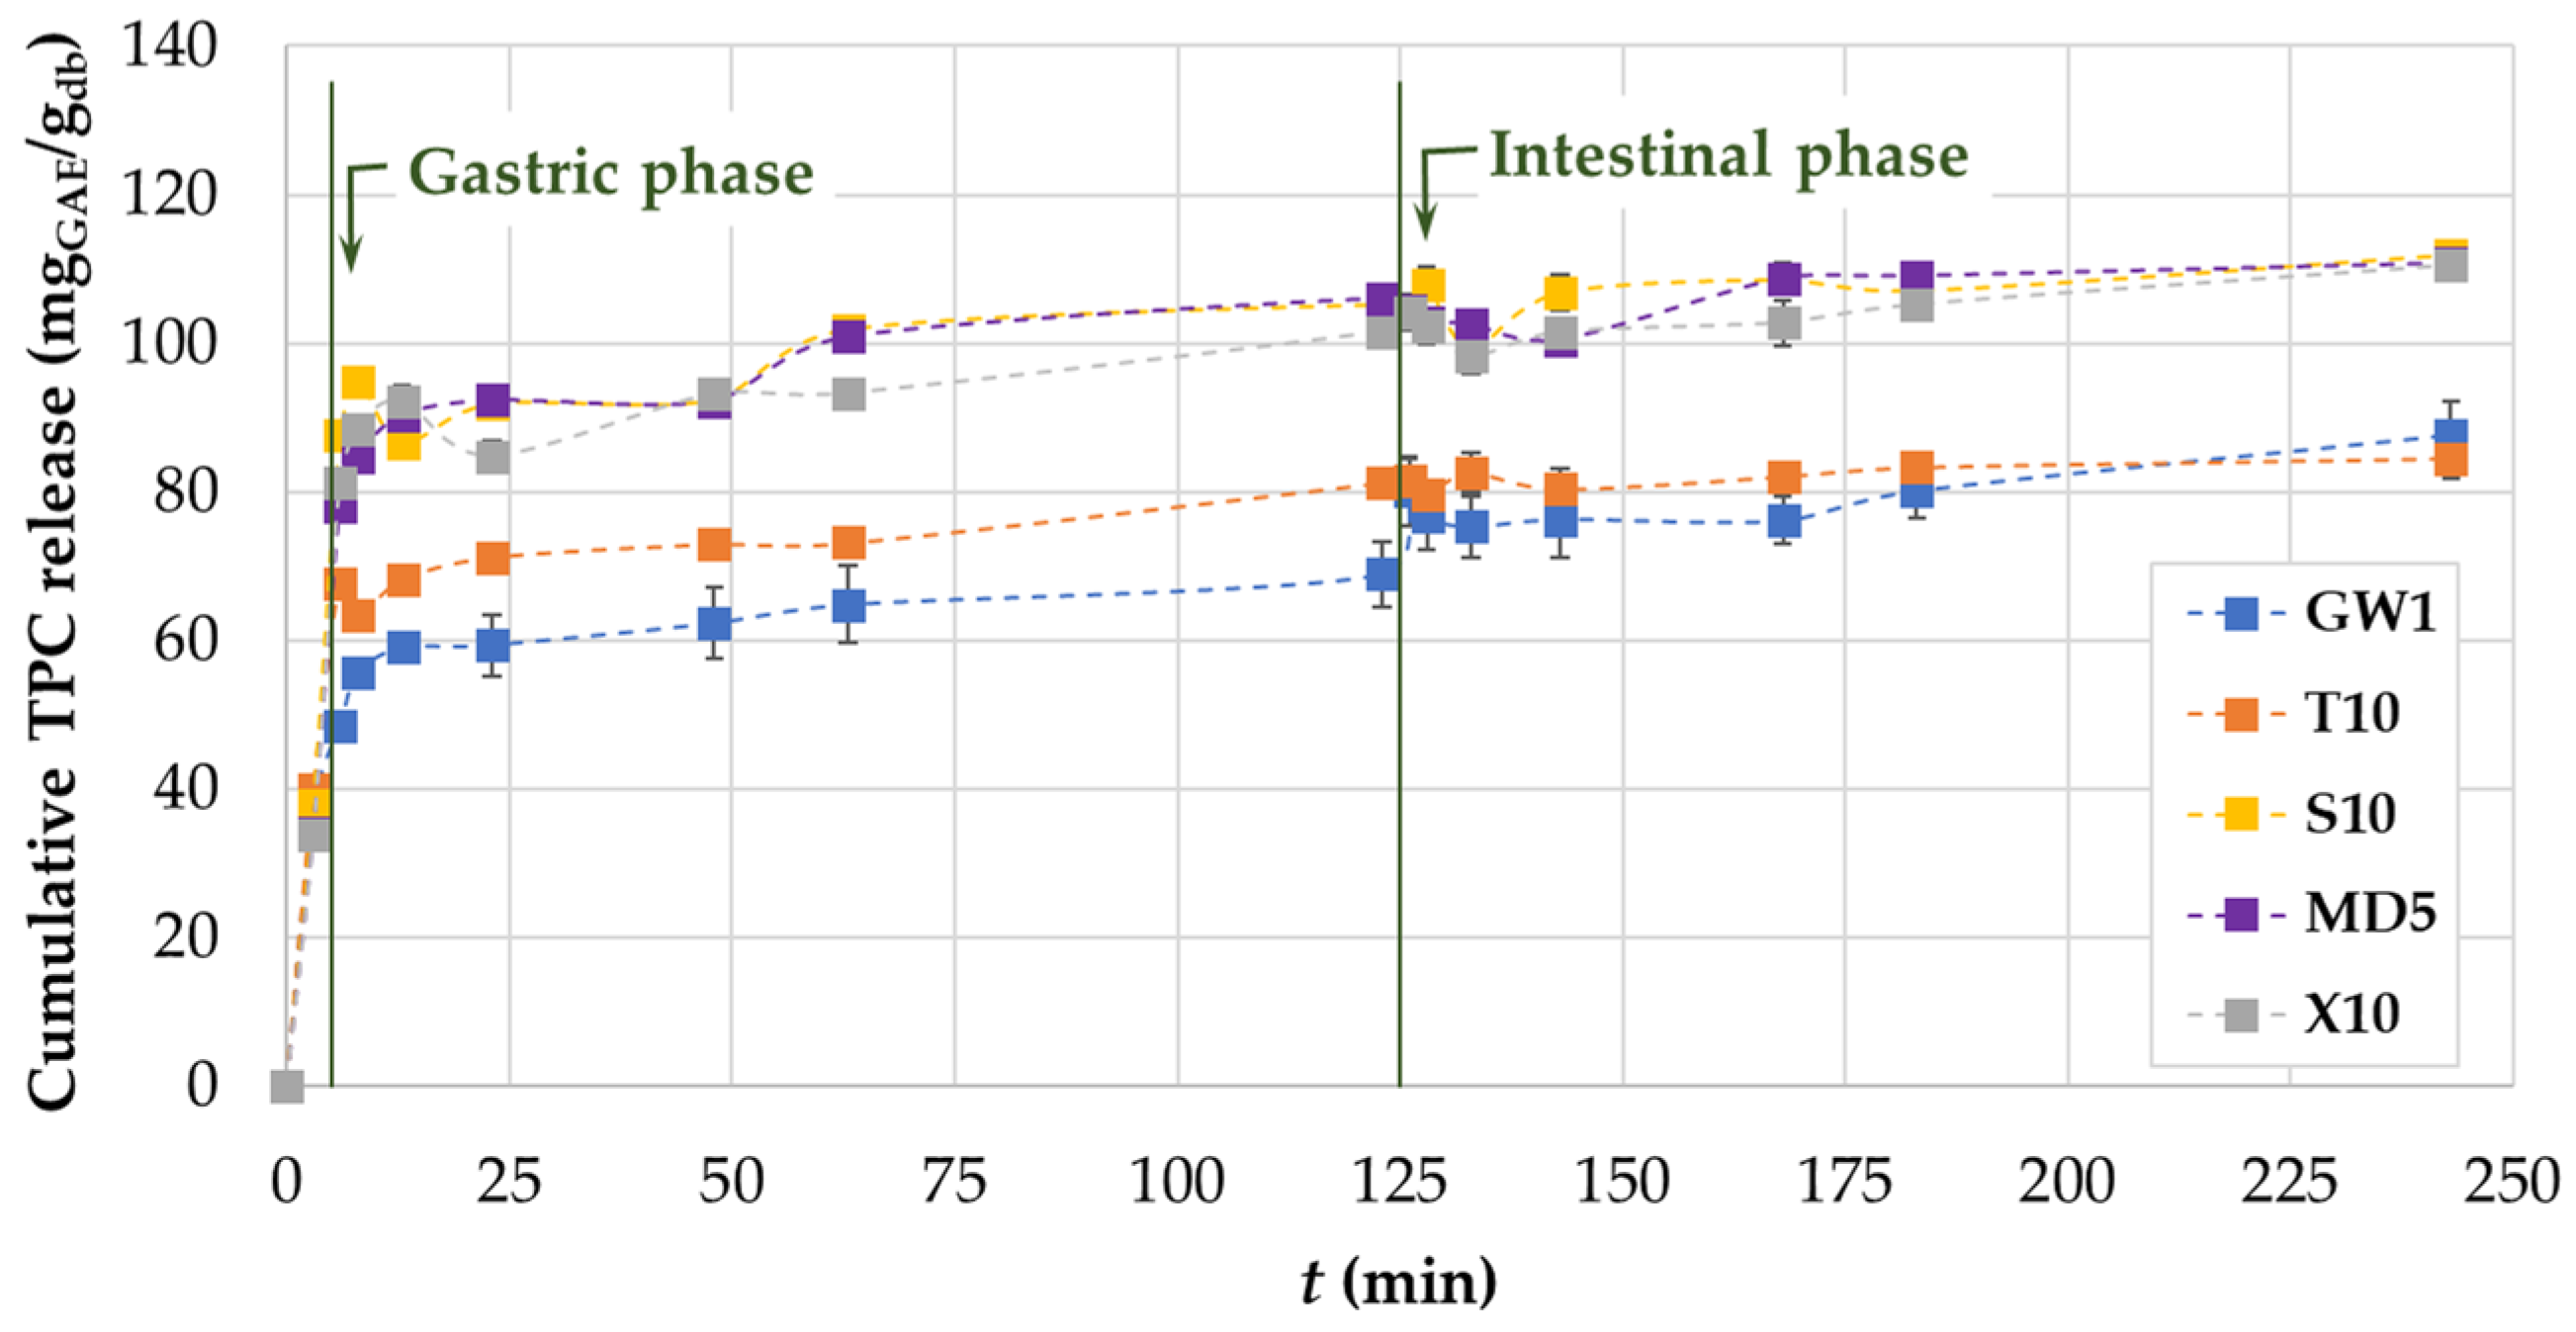
The in vitro release of phenolic compounds test was performed according to the protocol described in
Section 2.18. The results are shown in
Figure 6 as the cumulative release of TPC from the MCs.
The cumulative release rate in the oral phase ranged from 34.13% (MD5) to 40.03% (T10) of the total TPC released at the end of the test (
Figure 6). The diffusion of phenolic compounds then continued in the gastric phase. During the release in the gastric phase due to the pH change to acidic conditions, the color of the electrolyte solution containing the MC changed to red–pink, which was due to the presence of anthocyanins in the grape pomace extract. The cumulative release rate in the gastric phase ranged from 48.56% (GW1) to 100.84% (MD5). Within the last phase of the simulated gastrointestinal digestion, the values of the cumulative released TPC ranged from 76.10% (GW1) to 111.92% (S10). It is important to note that samples X10 and MD5 also had high values of released cumulative TPC in the amount of 110.42 and 110.75%, respectively. Our findings, which show a higher release of phenolic compounds during the intestinal phase of digestion as opposed to the gastric phase, are consistent with the results reported by Dag et al. [
66], who evaluated the release of phenolic compounds from freeze-dried goldenberry juice MCs. Recent studies on delivery system engineering show that protein–polysaccharide blend systems hold great promise for improving the release, retention, and protection of bioactive compounds [
67]. As stated by Belščak-Cvitanović et al. [
68], the hydrophilic character of the used polysaccharide and protein coatings as well as their water sorption properties cause high and rapid release of bioactive compounds in digestive fluids. The strong resistance of β-lactoglobulin to pepsin [
69] is another factor in favor of this. When using these combinations of coating materials, the high value of TPC cumulative release could be attributed to all of the aforementioned factors. The values of TPC released from the MCs in which T was used as a co-coating were lower compared to all the other co-coatings and were closer to the values of TPC released from the MCs in which only GW was used as a coating (GW1). A potential reason for this reduced phenolic release may be that T is less soluble in simulated gastric and intestinal fluids than the rest of the co-coating materials, which makes T-MC less effective in releasing phenolic compounds.
3.4. In vitro Simulated Digestion
In vitro simulated digestion is an accepted approach for estimating target molecule bioaccessibility. It can provide further information regarding the metabolism of phenolic compounds, their availability for further absorption in the body, and their potential health benefits. Phenolic compounds must be liberated from the microparticle matrix during gastrointestinal digestion in order to become bioavailable. Therefore, in this study, the influence of different coatings on the bioaccessibility index (BI) of individual phenolic components from GPE was investigated using in vitro simulated digestion testing according to the protocol described in
Section 2.19 for 243 min, comprising 3 digestion phases: 3 min in the oral phase (OP), 120 min in the gastric phase (GP), and a further 120 min in the intestinal phase (IP). The content of individual phenolic substances was determined before and after a certain period of digestion, and the results of the UHPLC analysis (according to
Section 2.20) are listed in
Table 5 and
Table 6. Before digestion, a total of 21 individual phenolic components were quantified in the dissolved microcapsules. After 243 min of simulated digestion in vitro, 10 of the previously quantified phenolic components were not detected in the digestate of any type of MC, namely: procyanidin B1, caffeic acid, chlogenic acid, syringic acid,
p-coumaric acid, ellagic acid, rutin, resveratrol, kaempferol, and quercetin (
Table 5).
The remaining 11 phenolic compounds quantified in the MCs prior to digestion were also quantified in the digestion product after 243 min of simulated digestion in vitro (
Table 6).
After digestion, the contents of five of the phenolic compounds decreased: gallic acid, catechin, vanillic acid, procyanidin B2, and epicatechin, compared to the amount in the MCs before digestion, resulting in a BI of <55% (
Figure 7a). It is possible that these compounds were hydrolyzed by intestinal enzymes and therefore their content was reduced after digestion [
70]. However, it is important to point out that gallic acid, 3,4-dihydrohibenzoic acid, catechin, vanillic acid, and ferulic acid as well as epicatechin gallate were detected during the intestinal digestion phase, while they were not present in the oral or gastric digestion phase (
Table 6). High concentrations of individual compounds in the digestate after the intestinal digestion phase were found for 3,4-dihydrohibenzoic acid,
p-hydroxybenzoic acid, galocatechin gallate, and
o-coumaric acid. More specifically, their higher concentrations were quantified in the digestate compared to in the MCs of the same type before digestion, resulting in a BI > 100% (
Figure 7b). It can be assumed that the increased concentration of the compounds mentioned is due to the breakdown of more complex compounds during digestion, such as various anthocyanins, which are most abundant in the gastric phase of digestion, i.e., at acidic pH values. 3,4-dihydroxybenzoic acid can be a degradation product of oenin chloride and also of curomannin chloride. It is to be expected that this is also the case for the other phenolic acids mentioned. The high BI value of gallocatechin gallate could be due to the hydrolysis of highly polymerized compounds such as procyanidin B1, which in this case was not quantified in the samples at the end of digestion.
In the case of gallic acid, the BI values varied from 16.79% (MD5) to 33.32% (GW1) (
Figure 7a). Conversely, in the case of o-coumaric acid, the BI values ranged from 255.67% (MD5) to 731.23% (GW1), and these were the highest values of BI in this experiment (
Figure 7b).
3.5. Accelerated Stability of MCs
Amorphous materials are thermodynamically in a non-equilibrium state and therefore tend to convert to crystalline (thermodynamically stable) structures during storage. The rate of this transformation depends primarily on temperature and relative humidity (RH) [
17]. When stored in a high RH environment, they absorb moisture and subsequently recrystallize [
71].
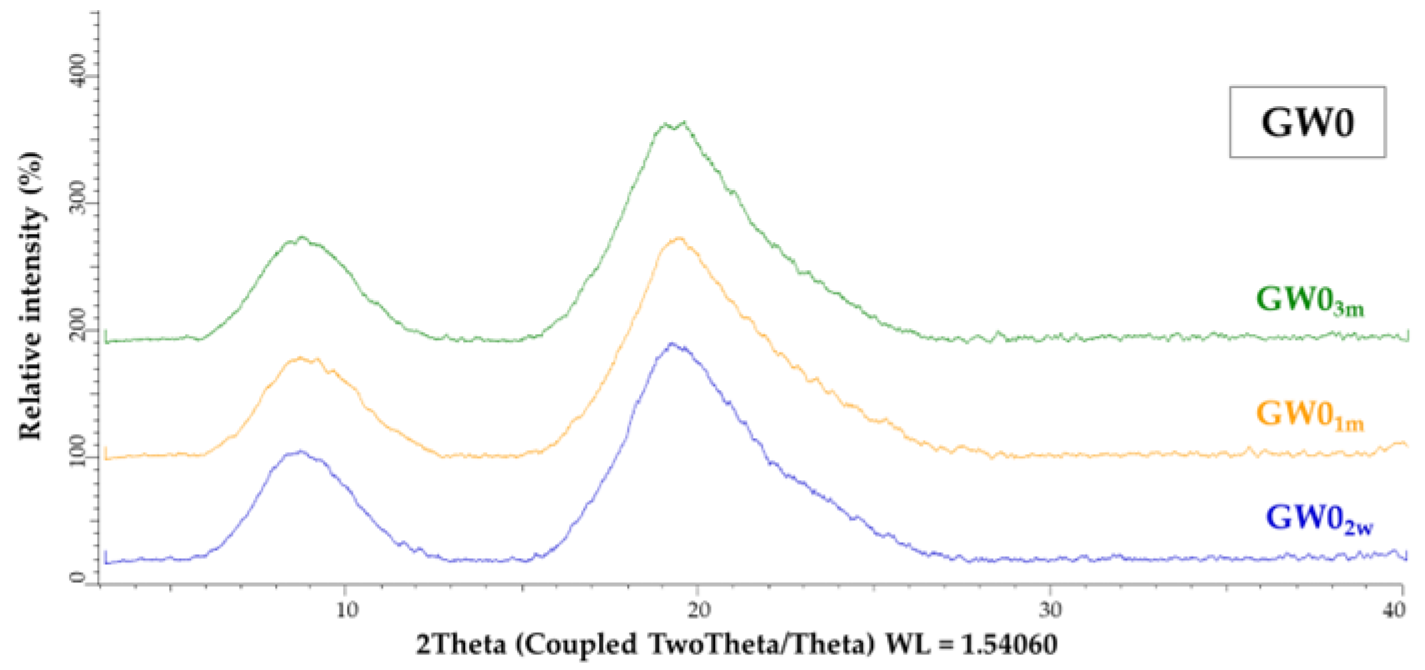
To check the stability of the powders, samples of the pure protein coating (GW0) and samples of microcapsules whose X-ray powder diffractograms (
Figure 3) indicated an amorphous structure (T5, T20, T30, S5, S20, S30, MD2.5, MD10, MD15, X5, X15, and X30) were subjected to the accelerated ageing test as described in
Section 2.21. The X-ray powder diffractograms of the samples after the accelerated ageing test over 2 weeks, 1 month, and 3 months are shown in
Figure 8 and
Figure 9.
The amorphous structure and stability of the GW powder was maintained even after three months of accelerated aging (
Figure 8). After a two-week acceleration stability test (
Figure 9a), only the structure of sample X30 (X30
2w) changed from an amorphous to a partially crystalline structure. All the other samples remained amorphous. The MC samples with the xylose co-coating, X5 and X15 (X5
1m and X15
1m), also changed their structure from amorphous to semi-crystalline after one month of accelerated ageing (
Figure 9b). After three months, sample S30 (S30
3m) and two samples with MD addition (MD15
3m and MD10
3m) showed a change in their structure from an amorphous to a semi-crystalline form. At the same time, samples S5
3m, S20
3m, T5
3m, T20
3m, T30
3m, and MD2.5
3m proved their stability, as no structural changes were detected even after three months under the conditions of the accelerated stability test (
Figure 9c).
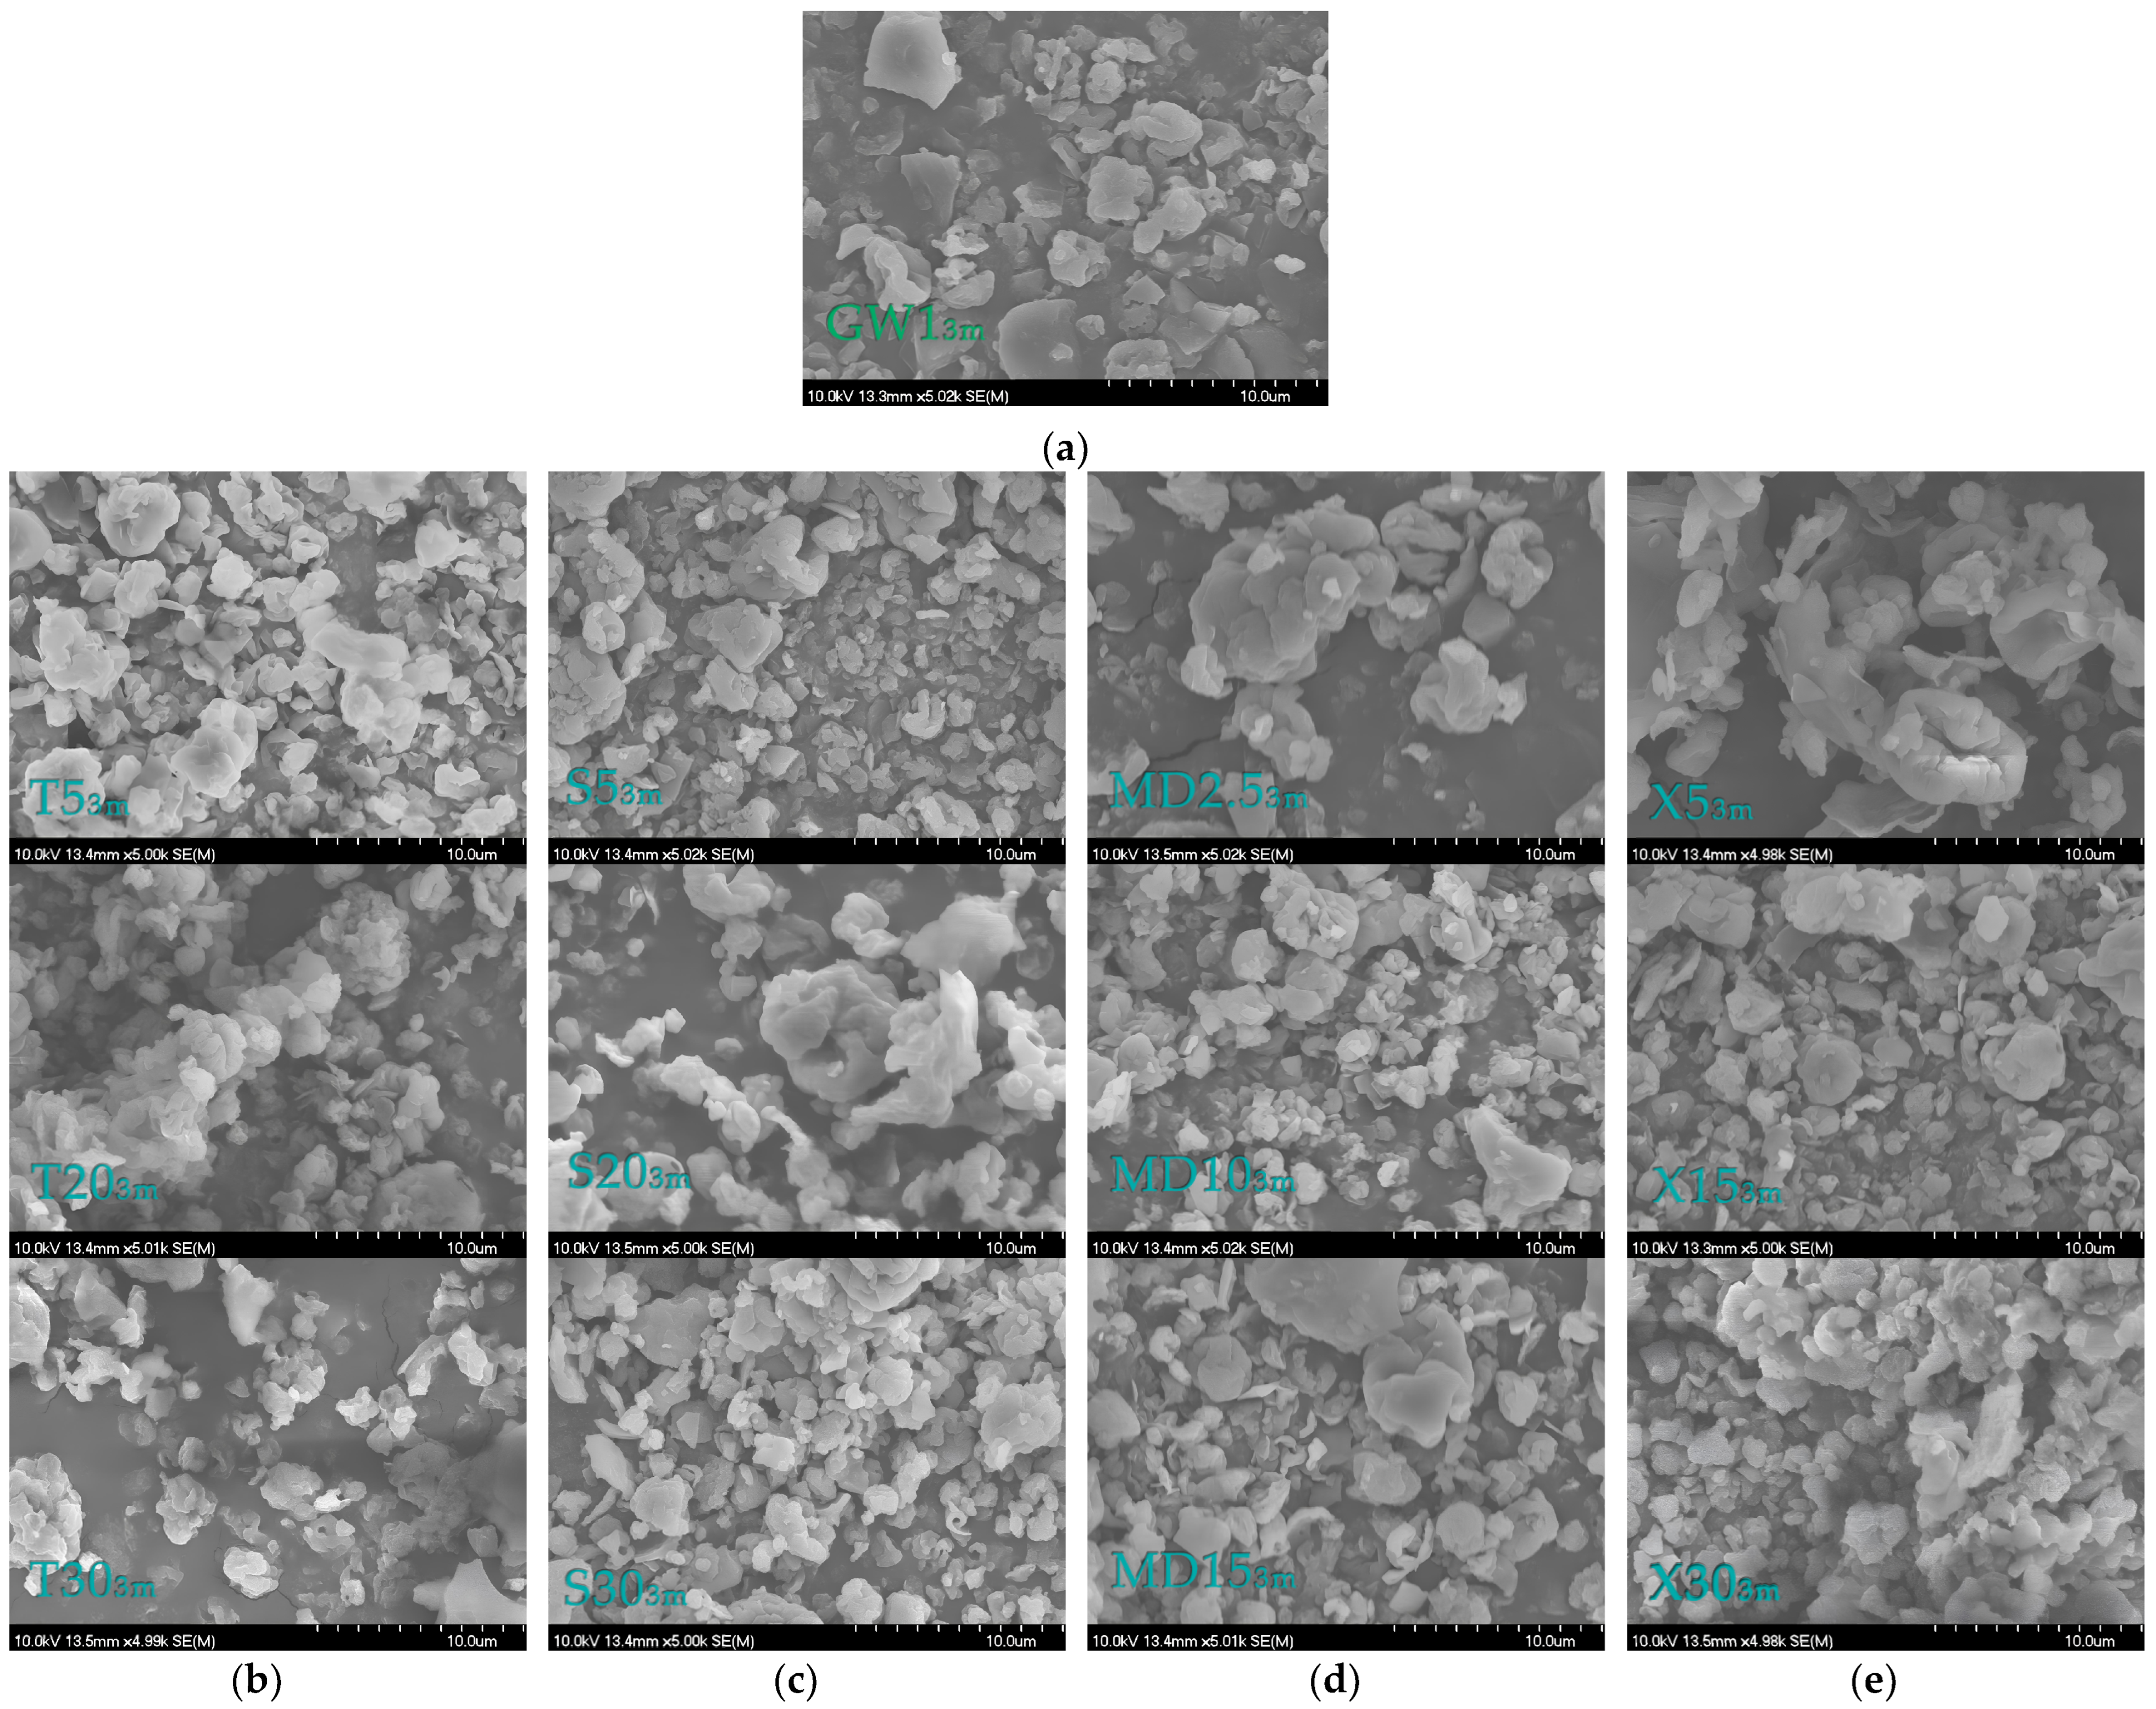
In addition, SEM analyses of the MC samples were made after three months under the conditions of the accelerated stability test. For the majority of the samples, no appreciable alterations in the microcapsule’s appearance were noticed (
Figure 10). For sample X15
3m, there was an apparent cavity. We can infer that trehalose addition, even in the smallest amounts, is necessary to stabilize the main coating material because no changes in the crystallographic structure of the particles were observed in samples T5
3m, T20
3m, T30
3m. Furthermore, the same results were seen in the samples (MD2.5
3m) that had the least amount of MD added.


 ,
, 


