Abstract
Powdered foods are matrices transformed into fine, loose solid particles through dehydration and/or milling, which enhances stability, storage, and transport. Due to their high commercial value and susceptibility to fraudulent practices, detecting adulterants in powdered foods is essential for ensuring food safety and protecting consumer health and the economy. Food fraud in powdered products, such as spices, cereals, dairy-based powders, and dietary supplements, poses an increasing risk to public health and consumer trust. These products were selected as representative matrices due to their high nutritional and economic relevance, which also makes them more susceptible to adulteration and hidden potential health risks from hidden contaminants. Recent studies highlight the potential of spectroscopic techniques combined with chemometrics as rapid, non-destructive, and cost-effective tools for authentication. This narrative review synthesizes recent literature (2020–2025) on the application of near-infrared (NIR) spectroscopy combined with chemometric techniques for adulterant detection in powdered foods. Advances in spectral preprocessing, variable selection, classification, and regression models are discussed alongside the most common adulterants and their nutritional and toxicological implications. Furthermore, the applicability of portable versus benchtop NIR devices is compared. The main contribution of this review lies in critically analyzing methodological frameworks, mapping current gaps, and identifying emerging trends, such as digital integration, self-adaptive chemometric models, and real-time on-site authentication, positioning NIR spectroscopy as a promising tool for food authentication and quality control.
1. Introduction
Food fraud poses a global threat to safety. According to the latest FAO report (2023), this phenomenon results in estimated annual economic losses of $40 billion and affects approximately 16,000 tons of food and beverages [1,2]. The magnitude of this issue not only undermines consumer trust but also compromises nutritional integrity and exposes populations to critical health risks [3,4,5], particularly in powdered foods—such as dairy products, spices, and flours—whose physical structure facilitates fraudulent practices [6,7]. This global problem transcends economic concerns and constitutes a major public health challenge [8].
Within this context, adulteration manifests in three main dimensions: intentional, accidental, and falsified [9,10,11]. Intentional cases include strategies such as substituting premium ingredients with by-products [12], for example, the use of ground walnut, peanut, and pecan shells in cinnamon [13], or the addition of low-cost compounds, such as starches in protein supplements [6,14]. However, adulteration is not always deliberate: failures in good production or manufacturing practices can lead to contamination with heavy metals in ground spices [15] or pesticide residues in fruits and vegetables [16,17], phenomena that, although unintentional, are equally hazardous [18]. Likewise, falsification involves misleading information, such as incorrect labeling or manipulation of geographical origin, as seen in gourmet coffee adulterated with lower-quality varieties [19]. The detection of synthetic pesticides in products labeled as “organic” is a notable example [16,20], illustrating how fraud continues to evolve to circumvent regulations.
These fraudulent practices can have direct consequences on human health. Risks range from immediate allergic reactions caused by hidden allergens [21,22,23,24] to chronic effects, such as neurotoxicity associated with lead in adulterated spices [25]. Historical cases, such as the melamine-contaminated powdered milk scandal reported in 2008—which affected 300,000 infants—demonstrate the catastrophic potential of such practices [26]. Epidemiological studies have linked unauthorized additives in protein supplements to progressive liver damage [27], reinforcing the need for detection systems capable of identifying fraud in powdered foods.
Advanced methods, such as high-performance liquid chromatography (HPLC), used exclusively at the laboratory level, or polymerase chain reaction (PCR), are effective for food authentication [28]. However, these analytical methods face critical limitations in this context. Although accurate, they require extended analysis times, involve high costs, and are destructive to the sample, which restricts their applicability in continuous monitoring [29,30]. Moreover, techniques such as PCR rely on specific reagents, rendering them ineffective against unknown adulterants, while mass spectrometry demands highly specialized personnel, limiting its industrial adoption [31]. These technical and operational barriers limit the availability of such methods in the food industry.
Several reviews have addressed the role of advanced analytical approaches in food authentication. For instance, Shi et al. [32] provided a broad overview of spectroscopic and chemometric techniques applied to diverse food products without focusing on the specific challenges of powdered matrices. Similarly, Usman et al. [33] analyzed both conventional and modern analytical strategies, including NIR spectroscopy, but did not provide a comparison of chemometric models in powdered foods. These contributions highlight the potential of NIR-based approaches but also reveal a gap in specialized reviews centered on powdered products.
NIR spectroscopy emerges as a disruptive solution in this scenario. Based on molecular vibrations of C–H, N–H, and O–H bonds [34,35], this technique enables the rapid and accurate identification of adulterants in powdered foods while preserving the sample [32,36,37]. Its integration with advanced chemometrics—such as regression models or neural networks—has raised detection accuracy to over 90% in cases of food fraud involving powdered dairy products [36,38], spices [13,39,40], cereals [24,41], coffee [23], cocoa [42,43,44], and maca [45,46], among others. Furthermore, portable devices (900–1700 nm) enable on-site analysis, democratizing access to cutting-edge technology, and reducing logistical costs [37]. The combination of NIR and data analysis is not merely a tool but a key pillar in the global food supply chain [47].
Within this framework, the present review examines recent advances (2020–2025) in the application of NIR spectroscopy coupled with chemometrics, assessing its potential as an effective tool for detecting food fraud in powdered products, which are particularly vulnerable to such malpractice. Spectral strategies for common adulterants, chemometric algorithms (PCA, SVM, deep learning), and emerging trends are evaluated through an analysis of Scopus-indexed studies. The objective goes beyond a purely technological overview: this work proposes an integrated framework that prioritizes industrial scalability, analytical sensitivity, and alignment with the Sustainable Development Goals (SDGs 2 and 3).
2. General Principles of NIR Spectroscopy
Near-infrared (NIR) spectroscopy is a technique based on the interaction of light with matter within the spectral range of 700–2500 nm. This range encompasses overtones and combination bands of molecular vibrations associated with C–H, N–H, and O–H bonds, which are typical of organic compounds. Light absorption occurs when the radiation energy matches the molecular vibration frequency, resulting in molecular excitation and generating a characteristic spectral signal [35,48]. As shown in Figure 1, a typical NIR system consists of a radiation source, a sample cell, and a detector and enables spectral acquisition through three main modes: reflectance, transmittance, and transflectance. Diffuse reflectance is the most widely used mode for powdered food matrices, such as coffee [23], cereals [22,24], dairy products [38,49], and powdered spices [39,42]. In contrast, transmittance is preferred for liquids or thin films, whereas transflectance is applied in specialized configurations that combine both phenomena [50,51,52,53].
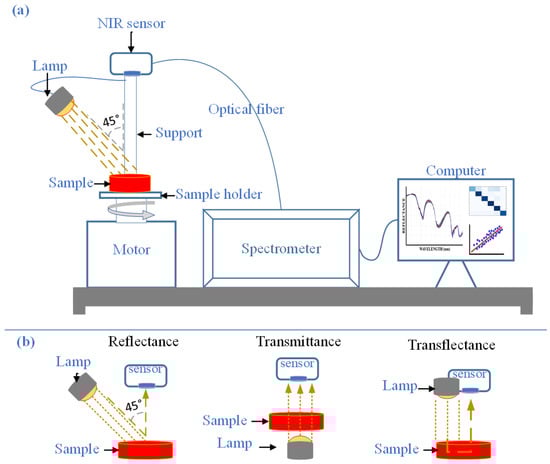
Figure 1.
NIR Spectroscopy System: (a) Components of the NIR spectroscopy system; (b) Diagram of spectral acquisition modes. Adapted from Chikri et al. [40].
Overtone and combination transitions are responsible for absorption in the NIR region, occurring primarily in hydrogen, carbon, and oxygen bonds. These vibrations, which are less intense than those in the mid-infrared (MIR) region, do not alter the sample, providing a significant advantage to the technique [54]. The process is modeled using the Beer–Lambert law, where the absorbance is proportional to both the concentration and the optical path length through the sample [50,55].
NIR spectroscopy is nondestructive, rapid, and does not require chemical reagents, making it both cost-effective and sustainable [35,51]. Its ability to perform simultaneous multicomponent analysis is particularly valuable in the field of food studies [52,53]. However, it has limitations, such as low sensitivity for components present at concentrations below 1% and the need for precise calibration models [56,57]. Additionally, it is affected by environmental factors [58,59] and variability between instruments [56,60].
3. Chemometrics Coupled with NIR for Fraud Detection
The development of robust chemometric models for detecting adulteration in powdered foods fundamentally depends on the following stages: spectral preprocessing, selection of relevant features, classification or regression model, validation, and evaluation of metrics [61,62]. The main strategies used in the reviewed studies are described below. Figure 2 illustrates the general workflow from raw spectral data acquisition to model evaluation to provide a comprehensive overview of this process.
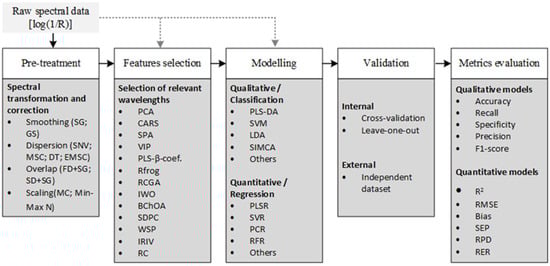
Figure 2.
General workflow for chemometrics coupled with NIR spectroscopy in food fraud detection.
3.1. Spectral Preprocessing Techniques
NIR spectra of powdered foods are influenced by factors such as moisture and particle size or geometry, which cause baseline shifts (additive effects) and slope changes due to light scattering (multiplicative effects). Sample surface irregularities and measurement parameters, including probe–sample distance, measurement angle, or packaging, may also cause additional noise [22,23,63]. To minimize these issues, the experimental design should include controlling the moisture content [37,43], standardizing the particle size [64,65,66], ensuring the surface uniformity [14,67], and harmonizing the measurement parameters [40,68].
In addition, preprocessing techniques are essential to correct residual effects. A wide range of methods—summarized in Table 1—are available, including baseline correction, peak resolution, scattering compensation, normalization, and scaling [23,63,69,70]. These techniques can be applied individually or in combination, depending on the spectral distortion complexity. For instance, MSC or SNV are sufficient to address scattering effects [63,67,70], whereas more complex interferences may require additional approaches, such as Savitzky–Golay smoothing, mean-centering, or autoscaling, which in many cases significantly enhance model performance [23,24,69,71,72].

Table 1.
Spectral preprocessing techniques applied in NIR-based food authenticity studies on powdered products.
This is particularly relevant in the acquisition of NIR spectra using a non-invasive approach, particularly through low-density polyethylene (LDPE) bags, which can cause optical scattering, additional absorption from the packaging, and variations in light path length, all of which affect spectral quality—especially in the 1800–2350 nm region [68,73,74]. To minimize these interferences, calibrating the reference spectra using the same packaging material, consistently using the same type of bag in all measurements, and properly homogenizing the product inside is recommended to ensure a stable surface. In such cases, spectral preprocessing techniques are essential. Commonly applied methods include the Savitzky–Golay method, derivatives, detrending, MSC, and SNV [45,64]. According to Lukacs et al. [68], SNV was used to correct multiplicative scatter effects, whereas Savitzky–Golay with first- or second-order derivatives smoothed the spectra and enhanced relevant signals over background noise. Empirically selected combinations, such as SG + SNV or SG + MSC, significantly improved model performance. These preprocessing steps were crucial for stabilizing the spectra acquired through plastic. Furthermore, LDPE introduced distinct absorption bands—particularly at 1220, 1800, and 2350 nm—that overlapped with phenolic compound bands, causing spectral distortions corrected through SNV, detrending, and derivatives [73].
SG has been widely adopted for spectral smoothing, reducing high-frequency noise while preserving the absorption band morphology [64,77,93]. Its combination with spectral derivatives enhances its ability to highlight subtle differences, facilitating the separation of samples with similar chemical compositions [43,90].
For example, Rukundo et al. [74] applied SG with a first-order derivative (second-degree polynomial, 61-point window) as a preprocessing step for a PCA-SIMCA model, achieving a correct classification rate of 97.4% for metanil yellow-adulterated samples. Similarly, Lukacs et al. [68] combined derivatives with SG and developed PLSR and SIMCA models with 100% sensitivity and specificity for melamine and urea detection in powdered milk. Chen et al. [66] used PLSR to integrate SG with SNV to improve the prediction of 6-gingerol in powdered ginger, obtaining an R2p of 0.9497 and an RPD of 4.23. Coqueiro et al. [75] applied SG to adulterated corn flour and reported a validation R2 of 0.9949 in an optimized PLS model. These results confirm that the use of SG, particularly in combination with derivatives or normalization techniques, substantially contributes to spectral stability and enhances the sensitivity of chemometric models.
SNV is one of the most commonly used techniques to correct variations caused by light scattering or differences in the physical presentation of samples. Lanjewar et al. [37] and Amsaraj et al. [81] applied RF and PLS models to adulterated turmeric and demonstrated that SNV enabled R2 values above 0.97 and RMSEP as low as 0.1696. Additionally, Chen et al. [66] reported that its combined application with SG improved the performance of the PLS model for ginger, achieving an RPD of 4.23.
MSC is effective for samples with high physical heterogeneity. In the PLS models developed by Chikri et al. [40] and Casarin et al. [22], the application of MSC resulted in prediction R2 values exceeding 97% and errors below 0.12% in protein and ash content quantification. Its combination with MC was also useful in improving multiclass discrimination through PLS-DA and SIMCA models, as demonstrated by Yegon et al. [72] and Lukacs et al. [68].
The extended version, EMSC, incorporates both linear and nonlinear components, providing a more accurate correction of physical variations. In the study by Ting et al. [49], EMSC was applied as the final step in a preprocessing sequence that included Cut, Gaussian smoothing, and normalization, leading to an improvement in the accuracy of a logistic-PCA model for detecting adulterated milk from 90% to 100%. In hierarchical SIMCA and quantitative PLSR models for melamine and urea detection, EMSC reduced RMSEP and increased sensitivity to over 97%.
First and Second Derivatives: Spectral derivatives are essential for baseline correction, resolving overlapping peaks, and enhancing spectral differences. In particular, the FD has proven useful in both classification and quantification models. Tao et al. [41] achieved 93.83% accuracy in a multiclass PLS-DA model by applying it in combination with SG (7-point window). Bala et al. [86], using a (1,4,4,1) configuration, reached an R2 of 0.999 and an RPD greater than 16 in MPLSR models applied to adulterated chickpea flour.
SD provided higher resolution for overlapping signals. Sadeghi et al. [39] integrated SD with SNV and detrending in adulterated turmeric, allowing a CNN model to achieve an R2 of 0.848 and an MAE of 3.15%. Casarin et al. [22] reported an R2p of 97.44% for lipid prediction in teff flour, whereas Ndlovu et al. [94] obtained an RPD of 6.23 for resistant starch quantification using PLS with second derivative preprocessing.
DT corrects non-informative systematic trends—such as baseline curvature—by fitting and subtracting a polynomial function. In the PLS and MPLSR models, DT significantly improved spectral linearity and reduced structural noise. Bala et al. [86] and Ndlovu et al. [90] reported R2 values up to 0.999 and SEP < 2.6% in chickpea flour and resistant starch, respectively. The SNV–DT combination applied in SVR models for buckwheat [83] achieved an R2p of 0.9987 and an RMSEP as low as 0.0002.
MC eliminates systematic bias across spectral variables, facilitating multivariate analysis. Its application, particularly in combination with 1D or MSC, has proven to be effective in PLS-DA models. Yegon et al. [72] achieved an R2p of 0.98 and an RMSEP of 2.74% in rice flour, while De Carvalho et al. [46] reported perfect sensitivity and specificity (1.000) for detecting adulteration in maca.
To optimize spectral relevance and reduce noise, complementary techniques, such as cut and Gaussian smoothing, have been employed. In adulterated powdered milk, Ting et al. [49] applied spectral trimming (980.943–1621.240 nm) followed by Gaussian smoothing, which enabled the PCA model to correctly classify 100% of the samples, compared to only 90% with untreated data.
Finally, Min–Max normalization has proven to be highly effective in contexts where spectral comparability is required without altering signal shapes. Kar et al. [65] identified this technique as the most effective among the seven evaluated methods, integrating it into a PLSR model for adulterated turmeric with Sudan I. The model achieved an RMSECV of 0.168 using only five latent variables, demonstrating high accuracy with low structural complexity.
Spectral preprocessing is a critical stage in NIR–chemometric analysis because it improves the quality of the data and directly influences the performance of models for adulteration detection [32]. The reviewed studies show that no single method is universally optimal; instead, the best results are usually obtained by combining approaches such as SG smoothing, first and second derivatives, SNV, MSC, EMSC, and detrending, which help reduce noise, correct baseline shifts, and minimize scattering effects in powdered food spectra. Importantly, some studies have evaluated derivatives separately and later applied SG filtering, which is why both appear as distinct techniques in Table 1, highlighting their individual and complementary contributions.
Preprocessing should not be considered a secondary step but rather an integral component of the analytical workflow. Although preprocessing generally enhances model accuracy and robustness, in some cases, raw spectra have yielded better predictions than preprocessed data [95]. This demonstrates that the specific characteristics of the food matrix and the type of adulteration under study must guide the choice of technique, ensuring reproducibility, reliability, and practical applicability in food authenticity and fraud detection.
3.2. Feature Selection Techniques
Dimensionality reduction and the selection of relevant variables are fundamental steps in chemometric modeling, particularly in NIR spectroscopy, where the number of wavelengths greatly exceeds the number of samples [22,63]. Inadequate variable selection may lead to overfitting, interpretability loss, and reduced generalization capacity [80,96]. In this context, various techniques—both linear and metaheuristic—have been applied to improve the predictive performance and robustness of the models. Table 2 summarizes the main methodologies employed in recent studies on powdered food authenticity, including Principal Component Analysis (PCA), Competitive Adaptive Reweighted Sampling (CARS), Successive Projections Algorithm (SPA), Variable Importance in Projection (VIP), and evolutionary algorithms, each with specific advantages and limitations depending on the type of matrix and adulterant evaluated.
Table 2.
Feature selection techniques applied in NIR-based food authenticity studies on powdered products.
PCA is an effective exploratory technique for reducing the dimensionality of spectral data, facilitating the visualization of latent patterns, and improving the computational efficiency of classification models. In studies such as that of Sadeghi et al. [39], its use prior to CNNs allowed compression of over 1000 wavelengths, reducing training time without compromising accuracy (R2 = 0.848). Similarly, Lanjewar et al. [37] employed PCA combined with SNV to detect starch-adulterated turmeric, achieving a 99.8% reduction in variables and high predictive performance (R2 = 0.999; F1 = 96%). Other studies have highlighted its usefulness for spectral interpretation. Ni et al. [95] applied PCA to associate specific bands with compounds such as chitin or lipids, whereas Boadu et al. [69] identified key spectral regions in coffee samples based on geographical origin. However, some studies have acknowledged its limitations. Chen et al. [66] reported that although PCA slightly improved performance over full-spectrum data, it outperformed RFrog in the detection of specific adulterants. Similarly, in multiclass models, Tao et al. [41] observed that reducing the dataset to three components was insufficient for robust discrimination.
CARS is one of the most effective techniques for wavelength selection in NIR spectral analysis applied to food adulteration detection. Its ability to significantly reduce the number of variables without compromising predictive performance has been validated in multiple studies. Chen et al. [100] reduced the number of wavelengths from 256 to between 5 and 44, depending on the model, improving SVR accuracy with an R2p of 0.7769 and an RPD of 2.32 in rice mixtures—surpassing even the full-spectrum model. Similarly, Yu et al. [24] reported 100% classification accuracy in adulterated buckwheat after a 76% reduction in variables, which also facilitated the identification of relevant spectral peaks (1208 and 1460 nm). Beyond accuracy, CARS has also contributed to the development of more compact and computationally efficient models. In the study by Chen et al. [66] on turmeric, the PLS model with CARS achieved an R2p of 0.9462 and an RPD of 4.04, outperforming the PCA and the full-spectrum model. Chai et al. [83] also emphasized that CARS reduced the number of variables in adulterated buckwheat flour to only 51 wavelengths while achieving an R2p of 0.9987. However, limitations have also been identified: in Sichuan samples, the CARS-based model did not outperform the full-spectrum model, highlighting its dependency on sample origin and the preprocessing method applied.
SPA has been employed as a variable selection technique in NIR spectra due to its ability to reduce collinearity among wavelengths and improve model interpretability. In studies such as that by Chen et al. [100], SPA reduced the number of variables from 198 to only 5–29, while maintaining R2p ≥ 0.75 in several models for adulterated rice, even achieving an RPD of 2.02, comparable to the full-spectrum model. This drastic reduction suggests advantages in computation time and model portability. However, the results also revealed that effectiveness depends on the specific mixture analyzed; in some cases—such as the KS-SNV-SPA-PLSR model—R2p dropped to 0.681, indicating a potential loss of useful information. Moreover, the effectiveness of SPA was inconsistent across all contexts. Moghaddam et al. [80] reported that models built with SPA-selected variables showed lower sensitivity and accuracy than full-spectrum models in adulterated protein supplements. For instance, the “adulterated” class achieved only 22% accuracy when only two variables were used, compromising the approach’s viability. Although SPA effectively reduces dimensionality, it may eliminate relevant variables when applied without proper validation. Despite these limitations, studies such as Li et al. [85] demonstrated the potential of SPA for portable devices, reducing the number of variables from 198 to only 7 in the green tea analysis. Its implementation is especially valuable when simplicity, portability, and robustness against spectral redundancy are prioritized, although its effectiveness relies on the balance between compression and information retention.
VIP is an embedded technique within PLS and PLS-DA models that allows the evaluation of each wavelength’s relative contribution to model performance, making it particularly useful for interpreting complex phenomena’ spectral basis. In the study by Casarin et al. [22], although VIP was not used to reduce variables, it played a key role in identifying relevant spectral bands associated with fraud in teff flour, enhancing chemical interpretation without directly affecting model performance. Regions with high VIP values (>1) were associated with functional groups such as CH, OH/NH, and NH, providing strong spectral evidence for differentiating authentic and adulterated samples. In contrast, Kar et al. [65] applied VIP as an active selection technique, narrowing the spectral range from 900–1700 nm to an optimized interval of 1380–1650 nm, which drastically improved the PLSR model’s performance for detecting Sudan I in adulterated turmeric. Outstanding metrics were obtained, including R2p = 0.979, RPD = 9.6, and RER = 24.5, indicating not only high precision but also substantial improvements in efficiency and interpretability. In contexts where spectral signals are subtle or overlapping, VIP has proven particularly effective by focusing on relevant bands and avoiding redundancy. Similarly, De Carvalho et al. [46] applied VIP in authenticity studies of Peruvian maca without explicit variable reduction, yet achieved high predictive performance (sensitivity and specificity = 1.00). The regions highlighted by VIP corresponded to absorption bands typical of adulterant compounds, such as RBPs. Although the computation time was not improved, the analysis enabled a detailed interpretation of the underlying chemical patterns.
Several advanced feature selection techniques have been explored in food adulteration analysis using NIR spectroscopy, showing notable results in terms of accuracy, variable reduction, and interpretability enhancement. For example, IWO and RF are highly effective in complex spectral contexts with high collinearity. IWO significantly improved the accuracy of an SVM model for adulterated coffee (R2p = 92.25%) by selecting bands associated with key compounds such as caffeine and chlorogenic acids [23]. RFrog, on the other hand, achieved the best predictive values in ginger (R2p = 0.9559; RPD = 4.89) using only 85 variables, standing out for its robustness against noise and redundancy [66].
Techniques such as EMCVS and RCGA have also shown strong practical applicability. EMCVS drastically reduced spectral variables (from 228 to 14–19) in cocoa shells, improving R2p for both portable and benchtop instruments [44]. It also enabled the identification of key functional bands, enhancing the model’s chemical traceability. RCGA, applied to turmeric, optimized models using only 10–30 wavelengths, increasing accuracy and reducing RMSEP, thus facilitating adulterant detection in portable and highly collinear environments [81].
Other methodologies, such as IRIV, SDPC-WSP, and ROBPCA, have also shown promise. IRIV maintained performance with lower computational load in green tea [85], whereas SDPC-WSP achieved accuracies above 97% in adulterated milk using only 7–22 variables [38]. When combined with one-class models, ROBPCA improved the specificity of adulterated almond flour samples, even at low concentrations [70]. Finally, techniques such as BChOA and OCPLS yielded mixed results: BChOA reduced the number of variables but performed less accurately than IWO, whereas OCPLS achieved >98% accuracy by optimizing latent components for one-class classification. Collectively, these techniques offer valuable alternatives to address the challenges of NIR analysis in food applications, each with specific advantages depending on spectral complexity and analytical objectives [23,70].
The scientific literature clearly shows that variable selection not only improves computational efficiency but also strengthens model interpretability by directly linking selected spectral regions to specific chemical compounds. The choice of technique should be aligned with matrix complexity, adulterant type, spectral quality, and the intended modeling algorithm. The combination of exploratory techniques, such as PCA, with selective algorithms, such as VIP or CARS, has proven particularly effective in NIR spectroscopy-based food authentication studies.
3.3. Modeling
In building chemometric models, it is essential to link each spectrum with the sample’s known authenticity or adulteration status. Once defined, the dataset is divided into subsets for calibration (training) and validation or prediction. This step is critical, as the partition quality directly influences the model’s ability to generalize beyond the calibration set and avoid overfitting [32].
Several strategies are used for dataset partitioning. Random sampling (RS) is simple but often fails to capture the data’s full variability. The Kennard–Stone (KS) algorithm [13,23], which maximizes the Euclidean distance between selected samples, and the SPXY method, which considers both spectral information (X) and response variables (Y) to achieve balanced partitions, are robust alternatives [22,99]. Recent extensions, such as kernel-based SPXY (KSPXY), further improve representativeness by accounting for nonlinear relationships [103,104]. The right partitioning approach strengthens model robustness and reliability, ensuring that NIR–chemometric tools are effective in detecting food fraud under real industrial conditions [32].
3.3.1. Qualitative Classification Models
Qualitative classification in the context of food authenticity aims to discriminate between authentic and adulterated samples or between different product classes based on their spectral signatures [13,36]. In the reviewed studies, both classical statistical methods and advanced ML algorithms, including deep neural networks, have been employed—each adapted to the complexity of the evaluated matrices and adulterants. Table 3 presents the most representative techniques applied for this purpose, along with their respective advantages, limitations, and application contexts.
Table 3.
Qualitative prediction models applied in NIR-based food authenticity studies on powdered products.
PLS-DA is a widely applied qualitative model for detecting food adulteration. It is noted for its balance between accuracy, robustness, and interpretative simplicity. In multiple studies, binary PLS-DA models achieved outstanding performance, with sensitivities and specificities above 94%, as reported in the authentication of adulterated paprika [82], Peruvian maca [46], and baobab powder [72]. These models were able to discriminate subtle adulterations even with a limited number of latent variables, demonstrating high efficacy as screening tools for quality control. However, the performance of PLS-DA can vary depending on the classification problem complexity. In multiclass studies or with intermediate adulteration levels (40–60%), such as those involving grated coconut [106] or buckwheat [99], a decline in accuracy and sensitivity was observed. In such scenarios, techniques such as SVM or hierarchical models—e.g., Hierarchical PLS-DA in cinnamon—proved to be more effective, particularly when combined with advanced preprocessing and feature selection strategies [13]. Nevertheless, PLS-DA remained competitive in studies such as that by Teye y Amuah [105], where it outperformed models such as RF, LDA, and SVM in the classification of adulterated rice varieties.
SVM-based qualitative classification models have demonstrated outstanding performance in food adulteration detection studies using NIR spectroscopy. Their ability to integrate with variable selection algorithms and optimized preprocessing strategies has enabled the construction of highly accurate and robust models. Yu et al. [24] reported that the Autoscale–CARS–CV–SVM model achieved 100% precision, recall, and F1 score in detecting adulteration in buckwheat flour, outperforming PLS-DA across all key performance indicators. Similarly, Chen et al. [66] achieved 100% accuracy by combining SVM with CARS in adulterated ginger and 97.91% accuracy when combined with SPA, demonstrating the versatility of SVM across different dimensionality reduction strategies.
SVM also proved to be effective in multiclass studies and in settings with significant spectral variability. Boadu et al. [69] found that an SVM model using SNV + SD preprocessing was the most effective for classifying roasted Robusta coffee, with an F1 score of 0.97, outperforming neural networks (NN), RF, and LDA. Similarly, Amsaraj et al. [81] confirmed that SVM was the most accurate model for turmeric authentication, reaching 100% accuracy with full-spectrum data and 93% with only 20 variables. Its combination with RCGA further enhanced performance even when using low-resolution portable instruments, where other models, such as XGBoost, failed to accurately classify samples.
Although in some studies, such as that by Teye and Amuah [105], SD-PLSDA outperformed SD-PLSDA in powdered adulterated rice samples, SVM still maintained high metrics (≈96–97%) and was consistently more stable than less sophisticated models such as LDA. Overall, its implementation has been particularly valuable in studies requiring high sensitivity, especially for subtle adulteration levels (<5%) or in multiclass scenarios with imbalanced classes, as evidenced by Millatina et al. [42] and Essuman et al. [98]. SVM is a highly effective, adaptable, and powerful technique for qualitative classification in complex spectral systems.
With moderate success, LDA models have been used for the qualitative classification of adulterated samples using NIR spectroscopy, standing out for their simplicity, computational efficiency, and visual interpretability. In several studies, LDA demonstrated highly positive results when combined with specific preprocessing methods. For instance, Zaukuu et al. [64] achieved accuracies above 97% in classifying adulteration in melon seed powder and up to 100% in validation sets using SG preprocessing. Similarly, Chen et al. [66] reported that LDA combined with SPA reached 100% accuracy in powdered ginger using only 13 variables, outperforming even CARS- and SVM-based configurations.
However, the performance of LDA is highly dependent on spectral preprocessing and experimental design. Boadu et al. [69] found that LDA was the least effective model compared to PLS-DA, SVM, RF, and neural networks, yielding F1 scores ≤ 0.71. Similares cases were reported in adulterated rice [105] and shrimp powder [92], where performance declined considerably in multiclass scenarios or under intermediate adulteration levels. This sensitivity was also observed by Tao et al. [41], who reported that LDA models lost accuracy relative to PLS-DA as the number of classes increased in complexity.
RF models are robust and versatile tools for the qualitative classification of adulterated samples using NIR and VIS-NIR spectroscopy. Their ability to handle high collinearity and spectral noise datasets has been validated in multiple studies. In the geographical classification of African Robusta coffee, RF achieved competitive metrics (F1 = 0.94–0.96), although it was outperformed by SVM and PLS-DA in some specific scenarios [69]. Similarly, in turmeric adulterated with starch, RF combined with SNV and PCA yielded high accuracies and greater robustness compared to other classifiers such as KNC, highlighting the importance of preprocessing in optimizing performance [71]. In studies involving complex mixtures, such as chili powder, rice, and cocoa, RF consistently maintained high performance, particularly in well-tuned configurations. Essuman et al. [98] reported high accuracy (up to 87.5%) and specificity (100%) in detecting adulteration with kola nut, although performance decreased against more challenging adulterants such as pear seed. On the other hand, Millatina et al. [42] highlighted RF’s equivalence to SVM in classifying adulteration in cocoa, with perfect accuracy and Kappa values, in addition to the interpretability advantage of tree structures for identifying key variables.
In multiclass or multi-instrument applications—such as curcumin authenticity studies—RF achieved 95–98% accuracy although it was outperformed by SVM when using lower-resolution spectral devices [81]. Although RF does not always lead in absolute accuracy, its balance of performance, stability, and interpretability makes it a reliable classifier in environments with high spectral variability, especially when chemical traceability and informative band selection are required.
SIMCA models and their variants, such as DD-SIMCA and PCA-SIMCA, have shown remarkable utility in food authentication and detection of adulteration using NIR spectroscopy. In the study by Netto et al. [78], DD-SIMCA combined with FD preprocessing achieved 100% sensitivity and specificity for almond flour adulteration, outperforming the classical SIMCA and OCPLS. In portable applications, OCPLS + MicroNIR exhibited strong performance although SIMCA with SNV showed low specificity (72.2%). In binary classification contexts, DD-SIMCA proved to be the most effective model for detecting cinnamon adulteration with nutshells, surpassing PLS-DA in both sensitivity and specificity when dealing with challenging adulterated samples [13]. Similarly, FT-IR + DD-SIMCA achieved better performance than portable NIR in studies involving cumin, underscoring the critical role of instrumentation and preprocessing in model performance [93].
The hierarchical SIMCA approach is effective in more complex scenarios. Ejeahalaka and On [78] reported high accuracy with three-level models applied to milk powder adulterated with melamine, successfully detecting fraud at concentrations as low as 0.01%. Similarly, SIMCA models applied to fortified milk accurately distinguished between fresh and aged samples [108], and in black pepper and cumin, SIMCA achieved higher sensitivity than supervised methods like PLS-DA, though with moderate specificity [109]. Finally, Rukundo y Danao [74] demonstrated that the effectiveness of PCA-SIMCA heavily depends on the calibration design; including adulteration levels within the model is essential to ensure robustness against real adulterated samples.
The KNN model has variable performance in food authentication tasks using NIR spectroscopy. In the study by Moghaddam et al. [80], KNN achieved results comparable to PLS-DA in binary classification of protein supplements, reaching 100% sensitivity and specificity when appropriate preprocessing methods, such as SNV or MSC, were applied. However, its performance was considerably less stable in multiclass classification, with significant drops in sensitivity (down to 60%) when SNV-DT combinations were used without parameter optimization. This highlighted the higher sensitivity of the model to preprocessing choices compared to more robust classifiers. In contrast, in the work of Lanjewar et al. [71], KNN was the least effective algorithm for detecting starch-adulterated turmeric, yielding precision metrics below 50% under schemes like SG-PCA. Compared with models such as Random Forest or Extra Trees, which performed remarkably well with SNV-PCA, KNN revealed substantial limitations in contexts with high spectral collinearity and multiple adulteration levels. These findings suggest that while KNN can be competitive in simple, well-preprocessed tasks, it is not a reliable option for complex or multiclass scenarios.
CNNs in food adulteration detection have shown promising results. Ku et al. [97] reported that the CNN model achieved an overall classification accuracy of 92.8% for adulterated cinnamon samples, exhibiting outstanding performance for pure classes and low-level adulteration (10%). However, performance declined for intermediate adulteration levels (20% and 30%), indicating reduced sensitivity to mixtures with subtle spectral differences and suggesting the need for optimization to improve discrimination in borderline concentrations. In a more recent study, Sadeghi et al. [39] integrated the NIR spectra with the RGB image data in a CNN model to detect adulterants in turmeric, achieving high classification metrics. Sensitivity ranged from 0.774 (at 20% adulteration) to 1.000 (for 0% and 25% classes), whereas specificity remained high across all levels (0.967–1.000). The model performed particularly well at the extremes of the adulteration range (0% and 30%), where the spectral differences were more pronounced. The confusion matrix and receiver operating characteristic (ROC) analysis confirmed that most samples were correctly classified with minimal errors, validating the CNN model’s ability to handle complex spectral scenarios with high precision.
Emerging classification and variable selection techniques include DTC, ETC, XGBoost, OCPLS, OPLS-DA, SDPC, and WSP. Their performance varies depending on the type of adulterant, preprocessing strategy, and spectral characteristics of the dataset.
For instance, DTC and ETC achieved high accuracy when applied to preprocessed Vis-NIR spectra and reduced with PCA for detecting starch-adulterated turmeric. According to Lanjewar et al. [71], the SNV + PCA + RFC or ETC combination outperformed other approaches, while KNN yielded a notably lower performance. These results underscore the value of tree-based classifiers in multi-concentration settings with well-structured spectral data.
XGBoost demonstrated excellent performance in detecting commercial curcumin adulteration, reaching 95–98% accuracy [81]. However, its efficacy significantly declined with low-quality instrumental spectra, indicating greater sensitivity to the signal-to-noise ratio compared to SVM or RF although its regression capability was highlighted.
The OCPLS model, designed for one-class classification, achieved 100% sensitivity and 98.3% specificity using MicroNIR (Viavi Solutions, Scottsdale, AZ, USA) and first derivative preprocessing, emerging as the most effective technique among portable devices for almond flour authentication [70]. Conversely, OPLS-DA, applied to black pepper and cumin adulteration detection, offered high specificity but poor identification of genuine samples, suggesting its complementary use alongside SIMCA [109].
Additionally, when combined with kNN, SDPC and WSP drastically reduced the number of wavelengths (from 1050 to just 1–22) without compromising accuracy. Yuan et al. [38] reported RARP and RARV values exceeding 96%, even in regions with spectral overlap, highlighting the potential of these techniques to construct compact and efficient models with strong spectral discrimination capabilities.
The choice of qualitative classification model is influenced by multiple factors, including matrix complexity, adulterant type, spectral quality, dataset size, and specific analysis goals (e.g., screening, validation, and authentication). While classical statistical models such as PLS-DA and LDA remain valuable under controlled conditions, advances in ML and DL offer more flexible and scalable solutions for real-world environments—especially when paired with robust preprocessing and variable selection strategies. The growing use of hybrid approaches and ensemble classifiers reflects a trend toward smarter and more adaptive systems for non-destructive control of food authenticity.
3.3.2. Quantitative Prediction Models
Regression models applied to NIR spectra aim to accurately and robustly estimate the adulterant concentration by capturing both linear and nonlinear relationships within highly collinear datasets. The reviewed literature reveals two predominant approaches: ML algorithms and DL methods, each with specific advantages depending on the application context. Table 4 summarizes the most commonly used models for quantitative prediction in food powder authenticity studies, outlining their typical applications, strengths, and limitations.
Table 4.
Quantitative prediction models applied in studies of the authenticity of powdered food using NIR spectroscopy.
PLS and its variants are highly effective tools for the detection and quantification of adulterants in food products, especially when combined with NIR spectroscopy. Across a wide range of matrices such as rice, flour, supplements, dairy products, and spices, PLS models have achieved R2 values above 0.97 and low prediction errors (RMSEP < 3%), enabling accurate estimation even at adulteration levels equal to or greater than 1% [14,22,42]. Particularly remarkable results were obtained in matrices with good spectral homogeneity and optimally preprocessed spectra, such as grape seed extract [73] and adulterated whey powder [80].
Extensions of PLS, such as iPLS and siPLS-PLSR, have shown additional advantages by enabling the selective use of relevant spectral intervals, reducing collinearity, and improving model interpretability. For instance, in mixtures of fats adulterated with urea, iPLS outperformed the conventional model in terms of accuracy and parsimony [78]. However, the most robust model was siPLS, which synergistically combined multiple intervals to enhance predictive capability, as demonstrated in studies on adulterated maca and premium rice [91,105]. In these cases, siPLS consistently outperformed both PLS and iPLS across all performance indicators.
However, the effectiveness of PLS models also strongly depended on the spectral quality, adulterant type, and preprocessing technique employed. For example, in complex mixtures such as whey protein adulterated with various nitrogen-based compounds, PLS models combined with SNV or MSC achieved R2 > 0.99 and RPD values > 10 [68,95]. In contrast, in matrices with greater nonlinear complexity—such as rice with varying particle sizes [100] or wheat adulterated with surrogate compounds [83], techniques such as SVR or neural networks outperformed PLS models, although they remained competitive under controlled conditions.
PLS and its variants represent a reliable, scalable, and highly accurate strategy for quantifying food product adulterants. Their versatility has been demonstrated across various analytical and instrumental settings, ranging from portable spectrometers to laboratory-grade equipment. However, optimal performance requires careful selection of preprocessing methods, a combination of relevant spectral variables, and robust cross-validation. In contexts where nonlinear relationships or high spectral heterogeneity predominate, combining PLS with complementary techniques, such as SVR or hybrid models, may be beneficial to achieve greater accuracy [39,77].
SVR has demonstrated competitive performance in detecting and quantifying food adulteration using NIR spectroscopy, particularly in contexts with high spectral complexity. In the case of high-value adulterated rice, the SPXY-MSC-CV-SVR model achieved an R2p of 0.9467 and an RPD of 4.3287, outperforming PLSR even when combined with variable selection techniques, such as SPA or CARS [100]. Similarly, the combination of SVR and IRIV outperformed PLSR in terms of accuracy, efficiency, and predictive stability in the analysis of green tea using portable spectroscopy, achieving an RPD of up to 17.32 for sugar adulteration in tea [85].
However, the SVR performance varies depending on the matrix type and instrumental configuration. SVR was more effective than PLSR for predicting GTE in grape seed extract using the NIR-S-G1 device (InnoSpectra Co., Hsinchu, Taiwan), but showed inferior performance when predicting specific compounds, such as catechin and epicatechin, with portable instruments [73]. In studies involving turmeric adulterated with Sudan I, SVR models were consistently outperformed by PLSR across all metrics [65], indicating limitations in scenarios where the spectrum-concentration relationship is essentially linear or where the spectra exhibit high redundancy.
Additionally, in a study on buckwheat flour adulteration, the effectiveness of chemometric models was found to depend on the samples’ geographical origin. While SVR models were more accurate in samples from Sichuan and Shanxi—regions characterized by greater spectral complexity—achieving R2p values above 0.9957, the PLSR model showed the best performance in samples from Inner Mongolia [83]. In contrast, a multispectroscopic analysis of turmeric showed that SVR yielded intermediate performance levels, outperforming ensemble models such as Random Forest and XGBoost [81].
SVR is a powerful and adaptable technique that is especially useful in nonlinear contexts or with complex spectra. However, its effectiveness heavily depends on preprocessing, variable selection, and data quality, making it advisable to compare it with other ML techniques and classical linear models for each specific application.
Compared with other multivariate methods, PCR has generally shown inferior results in studies on the detection and quantification of food adulteration using NIR and Vis-NIR spectroscopy. In the case of turmeric adulterated with Sudan I, PCR exhibited a higher root mean square error (RMSE) than PLS, and although the differences were not statistically significant according to the Diebold-Mariano test, they were significant according to the F-test, casting doubt on its comparative effectiveness [65].
In applications aimed at predicting adulteration levels in flours, such as mixtures of brown rice with white rice, PCR proved to be less effective than PLSR, showing lower accuracy and robustness against spectral variability [77]. In studies on legumes—for example, detecting pea and bitter vetch flour in mixtures with chickpea flour—PCR performed the worst, with errors two to three times higher than those obtained by MPLSR, indicating poor fitting and generalization capacity [86].
Similarly, PCR was the least effective model in the prediction of adulteration with corn flour in chickpea flour across all evaluated metrics. Its lower RPD and higher prediction error were clearly outperformed by more sophisticated methods, such as MPLSR and PLSR, confirming its limited performance in scenarios requiring high sensitivity and precision [87]. Despite its simplicity, these findings suggest that PCR is not the best choice for food authenticity control applications—especially when more robust and accurate alternatives are available.
The performance of the RFR algorithm in food authenticity studies has been variable, with results ranging from outstanding to significantly limited depending on sample type, spectral preprocessing, and variable selection strategy. In a study by Lanjewar et al. [71], RFR demonstrated exceptional performance in detecting starch-adulterated turmeric, achieving remarkable metrics such as a validation R2 of 0.999, an RMSEv of 0.391 mg/w, and an RPD of 92.3 after combining SNV preprocessing and dimensionality reduction via PCA. These values significantly outperformed those of other models, such as DTR and KNR, establishing RFR as a reliable tool for detecting adulteration.
In a multi-instrument comparative analysis of commercial turmeric authenticity, Amsaraj et al. [81] reported that RF achieved prediction values (RP) ≥ 0.98 on benchtop instruments using reduced variable sets, demonstrating its ability to maintain accuracy with optimized models. However, in other cases, such as the study by Behera et al. [107] on turmeric adulterated with exhausted turmeric, RF showed lower performance compared to simpler techniques, such as linear regression, exhibiting higher standard deviation and lower explanatory power. This reflects that, while RFR is a powerful tool in scenarios with good preprocessing and optimal configuration, its effectiveness may decline when inadequate variable selection combinations are applied or when uncontrolled spectral noise conditions are encountered.
In the analysis of regression models applied to the detection and quantification of adulterants in food matrices using NIR spectroscopy, clear performance differences are evident depending on the architecture employed and the type of preprocessing applied. For example, when applied to Micro-NIR spectra, convolutional neural network models such as GoogleNet, ResNet, S-AlexNet, and Simple CNN performed remarkably well in detecting adulteration in coconut milk, achieving R2 values of 0.999 and RPD values above 30, positioning them as highly effective tools for complex and nonlinear scenarios [84]. However, their performance was compromised when using lower-resolution spectra, such as FT-NIR, highlighting the importance of the type of spectral data used.
Conversely, classical models, such as BPNN, consistently demonstrated high performance in multiclass scenarios, outperforming SVR and PLSR with R2p values above 0.97 and RPD > 4 in studies on rice adulteration [100]. Similarly, hybrid architectures, such as CNN-Regression, were also competitive, although they showed lower predictive robustness compared to PLSR when using NIR spectra without targeted variable selection [39]. In contrast, tree-based algorithms such as Random Forest Regressor (RFR) and Extra Trees Regressor (ETR) achieved outstanding performance in detecting starch-adulterated turmeric, with validation R2 up to 0.999 and RPD of 92.3 [71], although their performance was inferior in less structured scenarios, such as those evaluated by Behera et al. [107], where linear regression outperformed them.
Ensemble-based models (e.g., XGBoost, Gradient Boosted Trees, and Ensemble Tree Regression) have also demonstrated strengths in turmeric and cocoa authentication tasks, especially when combined with proper variable selection and spectral preprocessing. XGBoost, for instance, achieved RP = 0.9999 and a RMSEP of only 0.0096 using FT-NIR platforms, ranking as the best-performing model among more than five algorithms [81]. In contrast, simpler algorithms, such as Elastic Net, LASSO, and Ridge, yielded intermediate results. Although LASSO and ENet without Boruta reached RPD > 13 [42], they did not outperform more advanced nonlinear models, such as BPNN or XGBoost.
Finally, ELM, GA-PLS, MLP, and MLR architectures produced acceptable results but were generally inferior in terms of precision and comparative stability. Their utility appears to be limited to low-complexity spectral scenarios or as benchmark baseline models. In some cases, simple linear regression was surprisingly competitive when the spectrum–concentration relationships were well-defined and linear [107].
The regression model should consider spectral complexity, adulterant type, matrix characteristics, and sample size. Statistical methods, such as PLSR, offer a solid and interpretable foundation, whereas machine learning and deep learning algorithms provide greater flexibility and accuracy in nonlinear or multiclass scenarios. The emerging trend toward hybrid and optimized food quality control models suggests a technical evolution pathway that combines analytical robustness with operational scalability.
3.4. Validation
Model validation is a critical step in chemometric workflows, ensuring that predictive models are both reliable and generalizable [111]. This process can be addressed through two complementary approaches: internal and external validation.
3.4.1. Internal Validation
Internal validation ensures that predictive models are not limited to the calibration set but can be generalized to unseen data. Cross-validation (CV) is the most common approach in NIR-based fraud detection, which divides the dataset into subsets for iterative training and testing, reducing overfitting. Variants include leave-one-out (LOOCV), which is robust for small datasets, as applied by Zaukuu et al. [64] with a leave-one-sample-out strategy and by Luckas et al. [68] using leave-one-replicate-out. Another widely used method is K-fold CV, which balances efficiency and robustness by cycling through K partitions. For instance, Boadu et al. [69] emphasized its broad use in chemometrics, while Castro et al. [76] applied a 5-fold scheme to validate adulteration models.
Simpler alternatives, such as hold-out validation, exist, where the dataset is split once from the same batch into calibration and prediction subsets. Tao et al. [41] demonstrated this with a two-thirds/one-third division. Although less exhaustive, it still provides valuable insights under controlled conditions. Collectively, these strategies highlight the flexibility of internal validation methods and their role in ensuring the reliability of NIR–chemometric models for powdered food authentication.
3.4.2. External Validation
External validation is considered the most rigorous approach for assessing the predictive ability of chemometric models because it evaluates performance on independent data not used during calibration. This strategy simulates real industrial conditions, in which models must reliably predict new samples from different replicates, batches, or explicitly separated datasets. For instance, Lukacs et al. [73] applied a rotational partitioning scheme in seed powders, allocating two-thirds of replicates for training and one-third for testing. The process was repeated to ensure that all samples were included in both calibration and validation. In protein powders, the same authors implemented an independent test set, reserving one replicate for validation while calibrating with the remaining ones, thus guaranteeing a strict separation between training and prediction data.
A classical approach to external validation involves dividing the entire dataset into two independent subsets. Oliveira et al. [82] exemplified this by splitting 315 samples; 171 into a calibration set and 144 into a prediction set [, allowing the evaluation of both the PLS-DA and PLSR models with completely unseen data. These examples illustrate how external validation strengthens the credibility of NIR–chemometric studies by confirming model robustness and generalizability beyond the internal checks provided by cross-validation.
3.5. Metrics Evaluation
Different evaluation metrics are applied to assess the performance and reliability of chemometric models depending on whether the task is qualitative (classification) or quantitative (regression). For classification models, metrics such as accuracy, sensitivity, specificity, precision, and F1-score provide insight into the effectiveness of the model in discriminating between authentic and adulterated samples (Table 5). In contrast, regression models are evaluated using statistical measures like R2, RMSE, bias, SEP, RPD, and RER, which reflect prediction accuracy, error distribution, and practical utility (Table 6).
Table 5.
Evaluation Metrics for the Qualitative Models.
Table 6.
Evaluation Metrics for the Quantitative Models.
3.6. Software Packages for NIR Chemometric Analysis
NIR spectra generate large volumes of data, and their chemometric analysis requires software capable of efficiently handling this information. Such tools must allow the implementation of various preprocessing techniques, feature selection methods, robust classification and regression models, as well as the generation of graphical reports, tables, and file management functions that support the proper interpretation of the spectra. A wide range of software packages, both commercial and open-source, are available to meet these needs, offering different levels of complexity, flexibility, and cost. The choice of software largely depends on the user’s background or programming experience, as well as the available economic resources. Table 7 summarizes the most widely used packages, highlighting their main features, advantages, and limitations.
Table 7.
Software packages for NIR chemometric analysis.
Regarding the chemometric analysis, there is no universal recipe for the optimal combination of preprocessing techniques, feature selection methods, and chemometric models to detect adulterants in food products using NIR spectra. The performance of each approach depends on several factors, including the matrix under evaluation, the type of device used, the identification of spectral interferences, and the proper implementation of the chemometric models. Preprocessing techniques help correct interferences related to the sample, instrument, or packaging material, particularly in non-invasive measurements. Meanwhile, feature selection simplifies the models, reduces computational load, and enhances both efficiency and accuracy. Qualitative classification and quantitative prediction models deliver varying levels of performance depending on the analytical goal. Section 6 (Table 10) summarizes the main performance metrics reported across the reviewed case studies to support practical comparison, enabling the identification of methodological strengths and areas for improvement in future research.
4. Common Adulterants and Their Impact on Nutritional Quality and Health
The addition of adulterants to powdered foods is often driven by economic motivations, local availability, and visual similarity, which makes them difficult to detect. Frequently, matrices with similar appearance, density, or particle size to the authentic ingredients are used, posing significant risks not only to food authenticity but also to the final product’s safety and nutritional quality. Table 8 summarizes the main adulterants identified in powdered foods based on recent NIR spectroscopy and chemometric studies.
Table 8.
Adulterants in powdered foods: health and nutritional implications.
Powdered milk and protein supplements, particularly those intended for infants and athletes, have been adulterated with nitrogen-based compounds, such as melamine and urea, to simulate a higher protein content. This practice is especially dangerous because melamine can induce the formation of insoluble crystals in the urinary tract, causing severe nephropathies and even death, as evidenced by the 2008 scandal in China, which affected more than 300,000 babies. Urea addition also overloads hepatic and renal metabolism, posing a critical risk to infants and immunocompromised individuals [67,68,108].
Likewise, the substitution of sweet almonds with bitter almonds introduces dangerous levels of amygdalin, a glycoside that releases cyanide, a lethal toxin, upon metabolism in the body. Although appearance and taste may not differ significantly, the toxicity of this adulterant can trigger acute symptoms such as nausea, vomiting, respiratory distress, and, in severe cases, death by systemic poisoning. This is particularly concerning in products targeted at children or the elderly [63].
Unauthorized synthetic dyes, such as Sudan I and Metanil Yellow, detected in adulterated turmeric samples possess carcinogenic and hepatotoxic properties. The International Agency for Research on Cancer has classified Sudan I as a possible human carcinogen, while Metanil Yellow has been associated with liver damage and hematological disorders. Chronic exposure to these compounds may induce cellular mutations, hepatic metabolic disruption, and DNA damage, posing a serious risk especially for populations with high turmeric consumption due to cultural or therapeutic reasons [65,74].
The adulteration of black pepper with papaya seeds may appear harmless from a visual perspective; however, these seeds contain compounds such as benzyl isothiocyanate, whose concentrations have not been fully characterized in this context. Prolonged exposure could induce toxic effects, which have not yet been fully documented, but can potentially cause gastrointestinal discomfort or side effects when consumed in large amounts. Despite its lower lethality, adulteration constitutes deception and a potentially unquantified health risk [127].
The addition of walnut, pecan, and peanut shells to cumin poses a relevant sanitary risk, especially for individuals allergic to tree nuts. Although these residues are not toxic per se, they may contain potent allergens and contaminant compounds if not properly processed. Moreover, this adulteration degrades the functional value of cumin, altering its phytochemical profile and reducing its essential oil content, affecting its culinary and therapeutic efficacy [93].
Adulteration of nutraceutical products, such as powdered maca, by substituting it with cheap starches, such as rice or rice bran, presents a subtle yet significant threat. Although these ingredients are not toxic, they dilute the bioactive compounds characteristic of maca—such as aramides, macaense, and glucosinolates—which are responsible for its energizing, adaptogenic, and hormone-regulating effects. This substitution not only reduces the therapeutic value of maca but also alters its nutritional and sensory profile, thereby compromising its authenticity and expected efficacy in functional or medicinal contexts [46].
Similarly, adulteration in matrices such as coffee with soy [23] or pseudocereals such as buckwheat [99] and teff with common wheat [22] compromises both sensory attributes and safety for individuals with allergies or celiac disease. Although these substitutions are not generally lethal, they pose significant risks to sensitive groups, potentially triggering responses ranging from mild allergic reactions to anaphylaxis.
Adulterants in powdered foods, such as melamine, Sudan I, or bitter almonds, represent serious health risks that often go unnoticed because of their visual similarity to the authentic product. In this context, NIR spectroscopy provides a valuable solution by enabling the rapid, nondestructive quantification and detection of these compounds without the need for reagents. However, its application must go beyond basic quality control. It is crucial that it focuses on identifying adulterations with high health impact and integrates it into surveillance systems that prioritize consumer protection. In doing so, NIR can evolve into a strategic tool for detecting food fraud and preventing real public health threats.
5. NIR Devices: Capabilities and Limitations for Food Fraud Detection
In recent years, NIR spectroscopy devices have undergone significant evolution, transitioning from highly specialized benchtop instruments to portable solutions designed for on-site analysis without compromising analytical accuracy [13,63]. The growing demand for real-time quality control across the food supply chain has driven this transformation, particularly for products vulnerable to adulteration, such as spices, flours, and plant-based powders [70,95].
Compact and low-cost instruments have democratized access to this technology, facilitating its integration into industrial and field settings. However, challenges remain—particularly in terms of spectral resolution, environmental interferences, and low-concentration adulterant detection limits. Therefore, understanding the technical specifications, capabilities, and limitations of the different NIR devices currently available is essential to select the most appropriate tool for a given analytical context. Table 9 summarizes the key characteristics of NIR instruments reported in the recent literature.
Table 9.
Differential Characteristics of the Portable and Benchtop NIR Devices.
5.1. Portable NIR Detection Devices
5.1.1. Technical Specifications
Near-infrared (NIR) spectroscopy-based portable devices have gained prominence as versatile analytical tools for the rapid and nondestructive analysis of powdered food products. These instruments are optimized to operate within a limited spectral range, commonly between 900 and 1700 nm, which includes overtone and combination bands associated with key functional groups, such as –OH, –CH, and –NH, responsible for the characteristic interaction with NIR radiation in organic compounds present in food matrices [13,95].
Despite their compact size, these devices exhibit significant variability in terms of spectral dimensionality. Some instruments designed for low-cost or mass-use applications operate with simplified spectra of 10–20 distinct bands, strategically selected to maximize class discrimination [65]. In contrast, the more advanced versions offer up to 100 wavelengths, providing greater spectral information richness. However, their spectral resolution, typically between 10 and 20 nm, is lower than that of benchtop systems, which may limit their ability to detect subtle changes in complex mixtures [63,70].
Regarding optical configuration, portable devices predominantly employ diffuse reflectance geometries, ideal for powdered samples due to their ability to capture signals from irregular surfaces without prior preparation [95]. Miniaturized halogen lamps or broadband NIR LEDs are the most common light sources, while detectors, mostly based on InGaAs technology, offer efficient response within the operational range with reduced energy consumption [13]. Compatibility with various sample formats —from powders directly applied to the optical window to samples in translucent plastic containers— adds operational flexibility, although it introduces challenges related to sample homogeneity and positioning consistency [65].
5.1.2. Operational Advantages
The main strength of portable devices is their deployability at any point in the supply chain, from warehouses to farms. This feature, combined with their high analysis speed —usually under one minute per sample—makes them ideal tools for rapid and preliminary decision-making [13,63].
Moreover, their minimal sample preparation requirements —no fine grinding, liquid homogenization, or prior dissolution needed—are crucial in contexts where time and resources are limited [23,63]. This technical accessibility has facilitated their incorporation into production, commercial, and logistics environments, requiring minimal user training.
A recent study demonstrated that the precision of a portable NIR device can be competitive with that of benchtop equipment in certain matrices. For example, a Micro-NIR portable spectrometer outperformed a benchtop FT-NIR instrument in detecting adulteration in coconut milk, achieving RPD values up to 39.35 and RMSE below 0.4%, even without complex spectral preprocessing [84]. These findings reinforce the usefulness of the proposed method as a cost-effective, adaptable, and efficient screening technology for real-time non-destructive control.
5.1.3. Limitations
Despite their operational advantages, portable devices have structural limitations that may compromise analytical performance. The main drawback is their low spectral resolution (typically between 10 and 20 nm), which restricts their ability to identify low-level adulterations or highly complex mixtures [43]. This limitation also results in the loss of key spectral bands, reducing precision compared to benchtop equipment.
Additionally, their performance can be affected by environmental conditions, such as intense natural light, dust, or mechanical vibrations, which generate spectral noise and reduce reproducibility. For example, Song et al. [14] reported difficulties with portable devices due to environmental interference, although with appropriate preprocessing (SG + SNV) and PLSR models, R2p values up to 0.991 were achieved for protein prediction in dietary supplements.
Comparative studies reinforce this gap: Lukacs et al. [73] found that PLSR models built with spectra from a benchtop NIR spectrometer (XDS) significantly outperformed those generated with portable devices in terms of accuracy (R2p = 0.993; RMSEP = 0.264%), which was attributed to their higher resolution and extended spectral range. Similarly, the limited capacity of portable devices to implement complex multiclass models or recalibrate against variations in sample composition reduces their applicability in exploratory studies or environments with high batch variability [63]. Therefore, while portable NIR devices are suitable as screening and rapid monitoring tools, their use should be understood as complementary—not substitutive—to high-precision spectrometers in regulatory contexts, official validation, or advanced research.
5.2. Benchtop NIR Devices
5.2.1. Technical Specifications
Benchtop devices based on near-infrared (NIR) spectroscopy represent the reference standard in terms of analytical capacity, precision, and spectral stability. Unlike their portable counterparts, these instruments operate over an extended spectral range, typically covering 900–2500 nm, encompassing the full set of overtone and combination bands in the NIR region associated with O–H, C–H, and N–H bonds [43,97,108]. This broad spectral coverage enables the detection of secondary signals from minor compounds, which is essential in authentication studies and quality analysis.
The spectral resolution of these devices is generally superior to 2 nm, and their spectral dimensionality can reach several hundred wavelengths, providing high-density continuous spectra that support precise chemometric modeling [13]. These instruments incorporate sophisticated optical systems that ensure uniform light distribution in solid samples and minimize scattering effects [24,40]. Because of this advanced infrastructure, benchtop spectrometers are highly adaptable to multi-analyte studies, capable of simultaneously quantifying multiple chemical components and detecting complex adulteration profiles using robust and stable models over time [38,95,108].
5.2.2. Technical Advantages
The main technical advantages of benchtop instruments are their high precision and reproducibility—critical aspects for generating robust predictive models [67]. These devices can produce reference spectra, i.e., spectral profiles with low noise levels and high resolution, which can be used as standards for cross-validating models developed with other types of instruments [44,68].
Recent studies have confirmed this analytical superiority. For instance, Lukacs et al. [68] demonstrated that models developed using NIRS6500 (FOSS NIRSystems, Inc., Silver Spring (Laurel), MD, USA) spectra achieved significantly higher accuracy (R2CV = 0.96; RMSECV = 0.15 g/100 g) than those generated with portable devices, particularly in melamine detection. In another study, PLSR models based on spectra from the 1100–2250 nm range reached R2P values of up to 0.993 and RMSEP as low as 0.264%, attributable to the instrument’s higher spectral resolution and coverage of critical bands [73].
Similarly, Amsaraj et al. [81] reported that in curcumin detection in turmeric, spectra obtained from benchtop devices allowed the development of models with RP = 0.9999 and RMSEP = 0.0096 using XGBoost, outperforming the performance of portable versions. Oliveira et al., [44] also demonstrated a clear advantage for benchtop devices, achieving R2P = 1.00 and RMSEP = 0.21 in the prediction of impurities in cocoa husks using PLSR models. Finally, Netto et al. [70] demonstrated that a DD-SIMCA model built from benchtop spectra achieved 100% sensitivity and specificity for adulteration levels ≥5%, confirming its utility in regulatory applications.
Additionally, these instruments show greater compatibility with advanced multivariate analysis, facilitating the application of exploratory techniques such as PCA or PLS-DA, as well as the training of supervised classification algorithms in multiclass and multivariable scenarios [67,81]. This analytical capacity, combined with their instrumental stability, enables the development of robust and transferable models for authenticity monitoring in highly complex food products.
5.2.3. Limitations
Despite their analytical advantages, the logistical and operational limitations of benchtop spectrophotometers restrict their applicability in direct production contexts or field inspections [14]. One of the most evident barriers is their high acquisition and maintenance costs, which hinders their adoption in resource-limited supply chains or small-scale industries [70]. Furthermore, their stationary nature prevents mobile use, as they require controlled environmental conditions, stable electrical infrastructure, and trained operators for proper functioning [13]. These requirements limit their utility in scenarios such as sanitary inspections, point-of-sale control, or on-site authenticity verification.
Finally, benchtop devices offer less operational flexibility than portable instruments. Each analysis typically requires rigorous sample conditioning, precise cleaning of the reading cell, and manual adjustment of measurement parameters, which significantly increases the analysis time. In contrast, portable devices enable faster evaluations with minimal preparation, making them more suitable for immediate decision-making in the field, albeit with generally lower precision [44,68].
In addition to the technical differences between portable and benchtop NIR instruments, highlighting their performance in real-world applications is important. Table 10 presents numerous studies in which both types of devices have been used to detect adulterants in powdered foods. Portable instruments have shown good performance in practical scenarios, such as the detection of metanil yellow in turmeric [74] or nuts in cumin [93], with accuracies above 90%. Benchtop devices have demonstrated higher accuracy in more complex matrices, such as in the detection of dyes in turmeric [81] or impurities in cocoa [42], reaching R2p values close to 1.00 and minimal errors. These cases illustrate how the choice of instrument should be based not only on technical criteria but also on the context of use, adulterant type, and required analytical rigor.
6. Selected Case Studies
NIR spectroscopy has proven to be a versatile, rapid, and accurate analytical strategy for detecting adulterants in powdered foods. Through the systematic analysis of various studies—organized by sample type—it is possible to identify patterns in equipment usage, common adulterants, applied chemometric models, and achieved detection levels can be identified. These data are detailed in Table 10.
Table 10.
Applications of NIR spectroscopy and chemometric models in adulterant detection in powdered foods classified by food category, adulterant, and type of model applied.
Table 10.
Applications of NIR spectroscopy and chemometric models in adulterant detection in powdered foods classified by food category, adulterant, and type of model applied.
| Category | Matrix | Adulterant | Device Type | Spectral Range | Chemometric | Results | Source |
|---|---|---|---|---|---|---|---|
| Spices and seasoning powders | Turmeric (Curcuma longa) | Corn, rice, and wheat | Portable | 833–2500 | SD-DT-SNV-PCA-CNN-1D | R2p = 0.848; MSEp = 16.017 | [39] |
| Turmeric (Curcuma longa) | Superior quality starch | Benchtop | 400–1050 | SNV-PCA-RFR | R2p = 0.999; RMSEp = 0.391 | [71] | |
| Turmeric (Curcuma longa) | Carcinogenic dye of Sudan I (1-[(2,4-dimetilfenil)azo]-2-naftalenol) | Benchtop | 900–1700 | VIP-PLSR | R2p = 0.979; RMSEp = 0.0093 | [65] | |
| Turmeric (Curcuma longa) | Other Curcuma species, cheap starches, sawdust, and chemical adulterants: metanil yellow, lead chromate, Sudan red, acid orange, aniline, and chalk powder. | Benchtop | 868–2540 | SNV-RCGA-XGBoost | R2p = 0.999; RMSEp = 0.0096 | [81] | |
| Turmeric (Curcuma longa) | Metanil Yellow (illegal dye) | Portable | 780–2500 | SG-PCA-SIMCA | Accuracy = 97.4% | [74] | |
| Turmeric (Curcuma longa) | Spent turmeric | Portable | 400 -1000 | PCA-SVM | Accuracy > 90.5% | [107] | |
| Cinnamon | Shells of peanut, pecan, and walnut | Portable | 900–1700 | Hierarchical PLS-DA | Sensibilidad = 0.8–0.9 | [13] | |
| Cinnamon | Coffee and corn bran are used | Benchtop | 1100–2000 | SG-PLSR | R2p = 0.994; RMSEp = 0.031 | [75] | |
| Cinnamon | Hazelnut | Benchtop | 1000–2500 | CNN | Accuracy = 92.8% | [97] | |
| Jengibre (Zingiber officinale) | Bean | Benchtop | 1000–1700 | MSC-PLS | Rp = 0.99; RMSEp = 0.65 | [40] | |
| Jengibre (Zingiber officinale) | Corn | Portable | 900–1700 | SG-SNV-Rfrog-PLSR | R2p = 0.956; RMSEp = 0.022 | [66] | |
| Paprika | Pedicel, peduncle, and seed cake | Benchtop | 1100–2500 | SG-PLSR | R2cv = 0.978–0.971; RMSEcv = 5.76–6.23 | [76] | |
| Paprika | Potato and acacia gum; annatto or achiote | Benchtop | 900–1700 | SNV-FD-PLSR | R2p = 0.968; RMSEp = 0.0017 | [82] | |
| Chili pepper (Capsicum annum) | Avocado seed and kola nut | Portable | 740–1070 | PLS-DA | Accuracy = 91.25% | [98] | |
| Cumin (Cuminum cyminum L.) | Walnut, peanut, and pecan | Portable | 900–1700 | PLSR | RPD = 3.61–4.39; RMSEp = 0.003–0.006 | [93] | |
| Black pepper (Piper nigrum) and cumin extract | Cassava, corn | Benchtop | 1100–2500 | Autoscaling-PLSR | R = 0.95; RMSE = 0.003–0.005 | [109] | |
| Cereals and Pseudo-cereal powders | Tartary buckwheat (Fagopyrum tataricum) | Whole wheat, oats, soy, barley, and sorghum | Benchtop | 900–1700 | Autoscales-CARS-SVM | Accuracy = 100%; F1 score = 100% | [24] |
| Tartary buckwheat (Fagopyrum tatari-cum) | Common buckwheat (Fagopyrum esculentum) | Benchtop | 900–1700 | SNV-DT-CARS-PSO-SVR | R2p = 0.99; RMSEp = 0.0002 | [83] | |
| Durum wheat (Triticum durum) | Common wheat (Triticum aestivum) | Benchtop | 900–1650 | Baseline-PLSR | R2p = 0.867; RMSEp = 0.009 | [110] | |
| Commercial wheat (Five Roses, Canadá) | Cassava | Portable | 1200–2100 | SG-FD-PLS-DA | Accuracy = 93.83% | [41] | |
| Wheat | (1) Talc powder and (2) benzoyl peroxide | Benchtop | 680–2600 | (1) CARS–PLSR (2) SNV-PLSR | (1) R2p = 0.996; RPD = 15.35 (2) R2P = 0.964; RPD = 5.42 | [88] | |
| Rice var. (Wuchang, Thai fragrant) | Rice var. South Japonica, Song Japonica, Jiangxi silk, and Yunhui | Benchtop | 900–1700 | Back Propagation Neural Network (BPNN) | R2p = 0.973; RMSEp = 0.071 | [100] | |
| Brown rice | Rice | Portable | 400–1000 | SG-PLSR | R2p = 0.96; RMSEp = 0.004 | [77] | |
| Premium Jasmine 85 variety rice | Rice var. Agra (lower demand variety) | Portable | 740–1070 | Si-PLS | R2p = 0.936; RMSEp = 0.156 | [105] | |
| Teff (Eragrostis tef) | Rice, oats, whole wheat, and rye | Benchtop | 1100–2500 | MSC-SD-PLSR | R2p = 0.974; RMSEp = 0.07 | [22] | |
| Quinoa (Chenopodium quinoa Willd) | Wheat, rice, corn, cassava, and buckwheat | Portable | 900–1700 | VIP-PLSR | R2p = 0.98; RMSEp = 0.0002 | [102] | |
| powdered dairy products | Whey protein concentrate (WPC), vanilla flavor | Maltodextrin, rice, and milk | Benchtop | 1100–2300 | SG-SNV-PLSR | R2p = 0.99; RMSEp = 0.023 | [14] |
| Supplements: whey, pea, glutamine, BCAA, and creatine | Melamine | Portable | 900–1700 | SNV-PLS | R2p = 0.998; RMSEp = 0.098 | [67] | |
| Supplements: WPC | Maltodextrin, milk, and whey protein concentrate | Benchtop | 1000–2500 | SNV-PLSR | R2p = 0.977–0.995; RMSEp = 2.473–5.343 | [80] | |
| Protein (whey, beef, and pea) | Melamine, urea, glycine, and taurine | Benchtop | 1100–2200 | SG-SNV-PLSR | R2cv = 0.95 ± 1.0; RMSEcv = 0.18–0.68 | [68] | |
| High-quality commercial milk powder | Low-quality milk | Benchtop | 1100–2498 | SNV-NDF-kNN | Accuracy = 97.4% | [38] | |
| Infant formula milk powder | Melamine | Portable | 980–1621 | SG-VN-EMSC-PCA-LR | Accuracy = 100% | [49] | |
| Skimmed milk powder (SMP) | Melamine and Urea | Benchtop | 850–2500 | SG-EMSC-iPLS-PLSR | R2p = 1.0; RMSEp = 0.0016 | [78] | |
| Powdered fruits and their derivatives | Almond (Prunus dulcis) | Bitter almond (Prunus amygdalus var. amara) extract | Portable | 740–1070 | SG-SD-SNV-PLSR | R2p = 0.93; RMSEp = 0.079 | [63] |
| Almond (Prunus dulcis) | Cassava, oats, peanuts, and commercial flours | Benchtop | 900–1700 | SG-FD-OCPLS | Accuracy = 98.5%; Especificidad = 98.3% | [70] | |
| Melon seeds (Cucumeropsis mannii) | Corn, cassava, and soy | Portable | 900–1700 | SG-LDA | Accuracy = 99.05% | [64] | |
| Coconut milk | Corn and cassava | Benchtop | 908–1676 | SNV-GoogleNet/ResNet | R2p = 0.999; RMSEp < 0.0046 | [84] | |
| Grape seed extract | Pine bark extract (PBE) and green tea extract (GTE) | Benchtop | 400–2500 | SG-MSC-PLSR | R2p = 0.993; RMSEp = 0.02 | [73] | |
| Baobab | Rice, wheat, and corn | Portable | 900–1700 | SG-MC-PLSR | R2p = 0.98; RMSEp = 0.0274 | [72] | |
| Dehydrated coconut powder (DCP) | Coconut milk | Portable | 400–2400 | Raw-PLSR | R2p = 0.973; SEP = 9.681 | [106] | |
| GBF (GBF) | Wheat | Benchtop | 400–2500 | SD-SG-DT-PLS | R2p = 0.979; RMSEp = 0.0243 | [90] | |
| Cocoa and its powdered derivatives | Cocoa powder | Carob, cocoa husk, foxtail millet, soybean, and wheat | Benchtop | 400–2500 | Boruta-PLSR | R2p = 1.0; RMSEp < 0.0001 | [42] |
| Cocoa husk powder | Leaves, pods, stem fragments, and cocoa nibs | Portable | 900–1700 | SD-VIP-PLSR | R2p = 0.99; RMSEp < 0.0074 | [43] | |
| Cocoa powder | Cocoa husk | Portable | 900–1700 | SG-FD-TD-EMCVS-PLSR | R2p = 0.939; RMSEp = 0.0069 | [44] | |
| Tubers | Maca (Lepidium meyenii): red, black, and yellow | Soy and corn products | Portable | 900–1700 | SG-PLSR | R2cv = 0.952; RMSEcv = 0.068 | [45] |
| Maca (Lepidium meyenii) | Rice and rice bran | Portable | 900–1700 | MSC-MC-SD-VIP-PLS-DA | Sensibilidad = 1.0; Especificidad = 1.0 | [46] | |
| Maca (Lepidium meyenii Walp.) | Turnip and radish | Benchtop | 400–2500 | SD-MSC-siPLS | R = 0.977; RMSEp = 0.0579 | [91] | |
| Coffee and tea powder | Coffee var. Caturra | Toasted soybean, barley, chicory, and corn | Portable | 900–1700 | IWO-SVM | Accuracy = 92.25%; Especificidad = 99.42% | [23] |
| Green tea | Sugar, rice | Portable | 900–1700 | SNV-IRIV-SVR | R2p = 0.998; RMSEp = 0.67 | [85] | |
| Legumes | Chickpeas and other legumes | Pea (Pisum sativum L.) and grass pea (Lathyrus sativus L.) | Benchtop | 400–2498 | SNV-DT-FD-MPLSR | R2c = 0.99; SEC < 0.905% | [86] |
| Chickpea | Pea (Pisum sativum L.) and grass pea (Lathyrus sativus L.) | Benchtop | 400–2498 | SNV-DT-FD-MPLSR | R2c = 0.99; SEC < 1.092 | [87] | |
| Others | Insect protein | Proteins from fly (BSFL), cricket (A. domesticus), and mealworm (T. molitor) | Benchtop | 800–2500 | PLS | Q2 = 0.991–0.997; RMSEcv = 10.8–17.1 | [95] |
| Shrimp (Caridea sp.) | Immature shrimp and shrimp heads | Portable | 900–1700 | SG-MSC-PLSR | R2cv = 0.823; RPD = 2.99 | [92] |
Most studies using NIR spectroscopy for the detection of adulteration have focused on plant-based powdered foods, with an emphasis on matrices such as spices and seasonings, cereals and pseudocereals, dairy products and protein supplements, and fruit derivatives, tubers, and legumes. The main cases reported in the recent scientific literature are presented and analyzed below.
6.1. Powdered Spices and Seasonings
Powdered spices and seasonings are highly susceptible to adulteration because of their high commercial value, easily replicable color and texture, and global distribution. Turmeric (Curcuma longa) is one of the products most frequently studied in this context. Several studies have evaluated its adulteration with cereals, starches, and unauthorized dyes, obtaining highly satisfactory results through NIR spectroscopy combined with advanced algorithms. For example, the use of an SD-DT-SNV-PCA-CNN-1D model enabled the detection of adulterants such as corn, rice, and wheat with an R2p = 0.848 [39], whereas a SNV-PCA-RFR-based approach achieved an R2p = 0.999 for commercial starches [71]. In the case of adulteration with Sudan I, a common carcinogenic dye, the VIP-PLSR model showed excellent performance (R2p = 0.979; RMSEp = 0.0093) [65]. Similarly, Amsaraj et al. [81] reported an SNV-RCGA-XGBoost model with R2p = 0.999 and RMSEp = 0.0096 for the identification of multiple chemical and plant-based adulterants. Other approaches, such as SIMCA [62] and PCA-SVM [107], also demonstrated effectiveness in detecting spent or illegally pigmented turmeric, with accuracy levels exceeding 90%.
Adulteration with nutshells, flours, and hazelnuts has been detected in cinnamon. Cruz Tirado et al. [13] used a hierarchical PLS-DA model that achieved sensitivities of 0.8–0.9. Coqueiro et al. [75] achieved an R2p = 0.994 (RMSEp = 0.031) for the detection of coffee and corn bran, while a CNN model obtained 92.8% accuracy for hazelnut adulteration [97].
Powdered ginger, particularly its adulteration with beans and corn, has also been studied. Models such as MSC-PLS [40] and SG-SNV-Rfrog-PLSR [66] reported high R2 values (≥0.95) and low RMSEs, confirming their applicability to complex matrices. In paprika, the SG-PLSR and SNV-FD-PLSR combinations enabled high-precision detection of adulterants such as seeds, gums, and colorants [76,82]. Essuman et al. [98] applied a PLS-DA model to adulterate chili samples with avocado seeds and kola nuts, achieving 91.25% accuracy.
Adulterants such as nutshells, starches, and flours have also been evaluated in cumin and black pepper. In cumin, Cruz-Tirado et al. [93] developed an SG-SNV-PLSR model with RPD values between 3.61 and 4.39 and minimal prediction errors (RMSEp ≤ 0.006), while Lima et al. [109] reported an autoscaling-PLSR model for cumin and black pepper with an R2 = 0.95, confirming its ability to discriminate even in complex mixtures.
The reviewed studies demonstrate that NIR spectroscopy, combined with advanced chemometric models, such as PLSR, CNN, SVM, and XGBoost, enables effective and nondestructive detection of adulteration in powdered spices and seasonings.
6.2. Powdered Cereals and Pseudocereals
Powdered cereals and pseudocereals—such as buckwheat, rice, teff, and quinoa—are frequently adulterated with flours of lower nutritional value, including common wheat, cassava, oats, and corn. NIR spectroscopy coupled with advanced chemometric models has proven to be highly effective for detecting these adulterants in complex matrices.
In Tartary buckwheat (Fagopyrum tataricum), Yu et al. [24] employed an Autoscales-CARS-SVM model that achieved perfect classification (accuracy = 100%; F1-score = 1.0) when detecting whole wheat, oats, soy, barley, and sorghum mixtures. In addition, Chai et al. [83] applied an SNV-DT-CARS-PSO-SVR approach to distinguish Tartary buckwheat from common buckwheat, obtaining outstanding accuracy (R2p = 0.99; RMSEp = 0.0002). Unuvar et al. [110] used a Baseline-PLSR model for durum wheat, reaching an R2p of 0.867, demonstrating its utility in simpler adulteration scenarios.
Various strategies have been employed to detect adulteration in rice, both among varieties and with external matrices. Chen et al. [100] applied a BPNN model to differentiate premium rice varieties (Wuchang and Thai fragrant) adulterated with lower-value types, achieving R2p = 0.973 and RMSEp = 0.071. Rahmawati et al. [77] evaluated adulterated brown rice using SG-PLSR, reaching R2p = 0.96 and RMSEp = 0.004. Similarly, Teye et al. [105] implemented a Si-PLS model to identify substitutions between Jasmine 85 and Agra varieties, achieving R2p = 0.936 and RMSEp = 0.156.
Casarin et al. [22] also studied the pseudocereal teff (Eragrostis tef), who developed an MSC-SD-PLSR model to detect adulteration with rice, oats, and wheat, achieving R2p = 0.974 and RMSEp = 0.07. For quinoa (Chenopodium quinoa Willd), Wang et al. [102] reported exceptional performance using VIP-PLSR, with R2p = 0.98 and RMSEp = 0.0002, when detecting adulteration with wheat, rice, corn, cassava, and buckwheat.
These studies highlight the ability of NIR spectroscopy to discriminate between spectrally similar matrices and the critical role of proper preprocessing, variable selection, and optimal model choice in achieving high sensitivity and generalization—even in scenarios involving multiple adulterants at low concentrations.
6.3. Powdered Dairy Products and Supplements
Powdered dairy products and protein supplements represent a high-risk category in terms of adulteration due to their high commercial value and the ease with which they can be altered by adding nitrogenous substances such as melamine, urea, glycine, or maltodextrin. NIR spectroscopy, combined with both classical and advanced chemometric algorithms, has shown remarkable effectiveness in detecting such adulterations with high precision and without requiring destructive sample preparation.
Song et al. [14] applied an SG-SNV-PLSR model to detect mixtures with maltodextrin, milk, and wheat in flavored whey proteins, achieving an R2p = 0.99 and a very low RMSEp of 0.023. Similar results were obtained from Shutevska et al. [67], who used SNV-PLS to identify melamine in whey and pea protein supplements, achieving R2p = 0.998. Moghaddam et al. [80], for their part, evaluated adulterations involving multiple matrices and reported robust performance with R2p values ranging from 0.977 to 0.995, though with a greater spread in prediction errors (RMSEp = 2.473–5.343). However, the R2p values were not significant.
Lukacs et al. [68] extended the analysis to more complex mixtures of animal and plant-based proteins (whey, beef, and pea) adulterated with melamine, urea, glycine, and taurine. Their models, validated through cross-validation (R2cv = 0.95 ± 1.0; RMSEcv = 0.18–0.68), demonstrated the approach’s robustness. In commercial dairy products, Yuan et al. [38] applied an SNV-NDF-kNN model to discriminate high-quality milk from lower-purity versions, achieving an accuracy of 97.4%.
Particular attention must be paid to the detection of adulteration in infant formulas, where health risks are especially high. Ting et al. [49] used a multistage model (SGauss-VN-EMSC-PCA-LR) to detect melamine in infant milk powder, achieving 100% accuracy. Similarly, Ejeahalaka et al. [78] reported outstanding results for skimmed milk adulterated with melamine and urea, using an SG-EMSC-iPLS-PLSR model that achieved R2p = 1.0 and RMSEp = 0.0016.
These results confirm that NIR spectroscopy-based models are highly effective for detecting adulterants in powdered dairy products and protein supplements, even at low concentrations. Furthermore, they constitute key tools for rapid and nondestructive monitoring in regulatory and commercial contexts.
6.4. Plant-Based Products and Nuts
Powders derived from fruits and nuts, such as almond, melon, baobab, dehydrated coconut, coconut milk, and green banana, are frequently adulterated with low-cost ingredients, such as cassava, corn, rice, oats, or even flours from other plant sources. Adulteration compromises the authenticity, nutritional value, and functionality of these products, especially in contexts where they are marketed as functional foods or supplements.
In sweet almond (Prunus dulcis), Giussani et al. [63] used an SG-SD-SNV-PLSR model to detect substitution with bitter almond, achieving an R2p of 0.93 and an RMSEp of 0.079. Netto et al. [70] used SG-FD-OCPLS to identify mixtures with cassava, oat, and peanut flours, and other sources, reaching an accuracy of 98.5% and specificity of 98.3%. Zaukuu et al. [64] reported a precision of 99.05% using SG-LDA on melon seed samples adulterated with corn, cassava, and soy.
Coconut milk, a matrix of growing interest due to its use in vegan and functional foods, was evaluated by Sitorus et al. [84], who employed convolutional neural networks (GoogleNet/ResNet) with SNV preprocessing, obtaining outstanding results (R2p = 0.999; RMSEp < 0.0046). In grape seed extracts, Lukacs et al. [73] detected adulteration with compounds such as pine bark or green tea extracts using SG-MSC-PLSR, achieving R2p = 0.993.
Baobab fruit, which is highly valued for its antioxidant content, was analyzed by Yegon et al. [72], who applied SG-MC-PLSR to detect mixtures with rice, wheat, and corn, obtaining an R2p = 0.98. In the case of dehydrated coconut, Pandiselvam et al. [106] used a Raw-PLSR model to identify substitution with coconut milk, with results of R2p = 0.973 and SEP = 9.681. Finally, Ndlovu et al. [94] used an SD-SG-DT-PLS model in adulterated green banana with wheat, achieving R2p = 0.979 and RMSEp = 0.0243.
These studies highlight the utility of NIR spectroscopy combined with supervised models, such as PLSR, OCPLS, LDA, and deep neural networks, for the detection of multicomponent adulteration. The combination of appropriate spectral preprocessing and advanced algorithms has enabled the development of robust models, even in the presence of multiple adulterants and batch-to-batch variability, thereby consolidating this technique as an effective and nondestructive tool for authenticating powdered plant-derived products.
6.5. Cocoa, Coffee, and Derivatives
Cocoa powder and its derivatives are products of high sensory and economic value, making them particularly vulnerable to adulteration with low-cost inputs such as carob, cocoa husk, roasted cereals, soy, and foxtail millet. Owing to their visual similarity, these substances can go unnoticed through conventional inspection, highlighting the need for advanced spectroscopic methods for detection.
Millatina et al. [42] used a PLSR-based model over a wide spectral range (400–2500 nm) to detect multiple mixtures in cocoa powder, achieving outstanding performance (R2p = 1.0; RMSEp < 0.0001), demonstrating the ability of the technique to discriminate highly complex adulterations. In studies focused on cocoa husk powder, Oliveira et al. [43] applied SD-VIP-PLSR and SG-FD-TD-EMCVS-PLSR models, achieving coefficients of determination of 0.99 and 0.939, respectively, with very low prediction errors (RMSEp < 0.0074 and 0.0069), even when distinguishing between plant fragments such as leaves, stems, and nibs.
These results confirm that NIR spectroscopy, combined with variable selection algorithms and feature engineering techniques such as Boruta, EMCVS, and VIP, offers an effective, nondestructive, and sensitive solution for the authentication of cocoa powder. Its ability to detect fraud even when adulterants have physical or chemical similarity to the original matrix underscores its applicability in high-fidelity monitoring supply chains.
6.6. Tubers, and Other Powdered Foods
In recent years, NIR spectroscopy has been successfully applied to non-conventional matrices such as Andean tubers (e.g., maca), legumes (chickpea, pea), and alternative proteins such as insects or shrimp, demonstrating its versatility in the quality control of emerging or functional foods.
Zaukuu et al. [45] used an SG-PLSR model to detect adulteration with soy and corn in red, black, and yellow cultivars of maca (Lepidium meyenii), achieving remarkable accuracy (R2cv = 0.952; RMSEcv = 0.068). De Carvalho Rodrigues et al. [46] used a combination of spectral preprocessing and the MSC-MC-SD-VIP-PLS-DA model to distinguish between maca adulterated with rice and rice bran, achieving 100% sensitivity and specificity. Zeng et al. [91] also reported good results (R = 0.977; RMSEp = 0.0579) when using siPLS to discriminate mixtures with turnip and radish.
Zhang et al. [23] developed an IWO-SVM model to detect adulteration of Caturra coffee with roasted cereals and soy, reaching 92.25% accuracy and 99.42% specificity in coffee and tea-derived products. Similarly, Li et al. [85] evaluated green tea samples adulterated with sugar and rice using SVR combined with variable selection (IRIV), achieving R2p = 0.998 and RMSEp = 0.67. Legumes have also been studied. Bala et al. [86,87] used SNV-DT-FD-MPLSR models on chickpea and pea samples adulterated with Lathyrus sativus or corn, obtaining R2c = 0.99 in both cases, with SEC below 1.1%.
Finally, promising results have been achieved in matrices of animal and alternative origin such as insect proteins (BSFL, crickets, mealworms) or shrimp. Ni et al. [95] applied PLS to samples adulterated with various insect species, obtaining Q2 = 0.991–0.997 and RMSEcv between 10.8 and 17.1. Similarly, Zaukuu et al. [92] used SG-MSC-PLSR to detect the presence of heads and immature shrimp in shrimp powder, achieving R2cv = 0.823 and an RPD = 2.99, which are acceptable metrics for discriminative applications.
These studies demonstrate that NIR spectroscopy, complemented by robust algorithms and appropriate preprocessing techniques, enables authenticity analysis across a wide range of non-traditional matrices. This significantly expands the technology’s reach toward functional ingredients, alternative proteins, and innovative foods with growing global market presence.
7. Current Challenges and Future Trends
The thematic evolution of recent literature on the detection of adulterants in powdered foods using NIR spectroscopy reflects a substantial shift in research priorities (See Figure 3). Trend analysis (2020–2025) shows a transition from classical statistical approaches toward more integrated models combining artificial intelligence and digital tools.
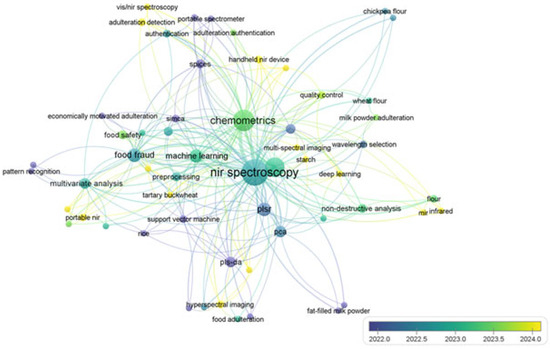
Figure 3.
Co-occurrence Map of Author Keywords in Food Adulteration Detection Using NIR Spectroscopy (2020–2025) Studies. Figure was generated in VOSviewer [1.6.20].
7.1. Evolution of Thematic Trends
During the initial years of the analyzed period, the most frequent terms were associated with traditional chemometric models, such as PLSR, PCA, and PLS-DA, all with publication peaks between 2021 and 2023. These algorithms served as the analytical foundation for classifying and quantifying adulterants in coffee, turmeric, milk powder, and cereals.
From 2023 onwards, and especially in 2024, the most recurrent terms shifted toward practical and operational applications, highlighting “nir spectroscopy” (29 mentions), “adulteration” (23 mentions), and “food fraud” (11 mentions), indicating a growing focus on real-time authenticity validation and risk assessment related to food fraud.
Simultaneously, terms such as “chemometric” (21 mentions) remain central to methodology, while “curcumin” reflects the interest in specific, high-value plant-based matrices. The notable emergence of “machine learning” in 2024 marks a significant methodological inflection, anticipating broader adoption of more complex algorithms capable of self-calibration and adaptation to new forms of adulteration.
This shift in trends demonstrates an evolution from methodological approaches toward practical applications in the detection of food fraud. Although interest in machine learning and real-time validation is increasing, greater effort is still needed to transfer these advances into industrial environments. Future studies must incorporate field validations and regulatory considerations to achieve a tangible impact on food safety.
7.2. Emerging Topics and Gaps
Trend analysis reveals several emerging areas of particular relevance. Among them, the sustained growth of supervised ML models and deep neural networks stands out, both of which have demonstrated high predictive capacity in complex matrices [63]. Likewise, notable progress has been made in studies focused on real-time authentication using portable NIR spectroscopy integrated into mobile platforms, opening new possibilities for rapid and decentralized inspection [41]. Another expanding line of research involves the analysis of food products with high economic vulnerability and added value, such as spices, supplements, and gluten-free flours, which have become frequent targets of fraud.
However, significant gaps exist. Key concepts, such as blockchain, calibration transfer, Internet of Things (IoT), and spectral digital twins, which are essential for advancing automated chemical traceability and interoperability between devices, still lack a consolidated presence in the literature. Although spectroscopic tools have evolved technically, their integration into intelligent digital environments is still in an early phase. Bridging this gap will be crucial for implementing robust, scalable, and adaptable authentication solutions that meet the demands of the modern food industry.
7.3. Future Projections
Based on the observed evolution, future NIR spectroscopy research applied to food adulteration detection is expected to move toward greater technological and operational integration. A stronger link between NIR and decentralized digital platforms, such as the IoT and blockchain, is anticipated. This would enable the implementation of more secure, automated, and real-time chemical traceability systems. Additionally, data fusion from multiple sources—such as NIR spectra, RGB images, and sensory measurements—will become increasingly important for enhancing the accuracy and robustness of authentication models. The development of self-adjusting and transferable models capable of maintaining performance across different devices, laboratories, or manufacturers is another key focus. Finally, the progressive incorporation of NIR spectroscopy into predictive regulatory control systems is foreseen, enabling continuous, remote verification of food authenticity without the need for specialized laboratories.
8. Conclusions
Near-infrared (NIR) spectroscopy, combined with advanced chemometric techniques, is a powerful, nondestructive, and versatile alternative to traditional methods for detecting adulterants in powdered foods. Compared with conventional techniques, such as chromatography or wet chemistry—which are often labor-intensive, destructive, and require elaborate sample preparation—NIR enables rapid, real-time, and cost-effective screening with minimal handling. Its ability to analyze complex food matrices without altering their physical integrity makes it particularly valuable for quality control, authentication, and fraud prevention across the entire supply chain.
The literature reviewed from 2020 to 2025 demonstrates that the integration of NIR with machine learning algorithms (e.g., PLSR, SVR, SVM, XGBoost, and CNN), supported by effective spectral preprocessing (e.g., SNV, derivatives, and EMSC), has resulted in highly accurate models that frequently exceed 95% accuracy—even in cases involving multi-component or low-level adulteration. However, significant challenges persist. Equipment heterogeneity affects model transferability and reproducibility across platforms, including differences in resolution, detector sensitivity, and spectral range. Detecting subtle adulterations still requires careful model tuning, optimized preprocessing, and extensive validation. The lack of standardized methodologies and regulatory harmonization further constrains the broader implementation of NIR technologies, especially in small-scale industries and low-resource environments.
To address these limitations and fully unlock the potential of NIR spectroscopy, future development must focus on its integration with intelligent digital infrastructures. The convergence of NIR with IoT systems, cloud-based analytics, and blockchain-enabled traceability will allow for real-time, adaptive, and interconnected monitoring solutions. This transition from laboratory-bound analysis to portable, scalable, and connected platforms marks a technological advancement and a strategic imperative for ensuring transparency, authenticity, and safety in modern food systems. When appropriately deployed, NIR spectroscopy stands not merely a tool for detection—it becomes a cornerstone technology in the global fight against food fraud.
Funding
This research was funded by CONCYTEC & PROCIENCIA—Peru, under the grant “E033-2023-01-BM Fase 2”, Contract N° PE501084298-2023-PROCIENCIA and the grant “E077-2023-01-BM”, Contract N° PE501094295-2024-PROCIENCIA.
Institutional Review Board Statement
Not applicable.
Informed Consent Statement
Not applicable.
Data Availability Statement
No new data were created or analyzed in this study. Data sharing is not applicable to this article.
Conflicts of Interest
The authors declare no conflict of interest.
Abbreviations
| B | |
| BPNN | Back Propagation Neural Network |
| BSFL | Black Soldier Fly Larvae |
| C | |
| CARS | Competitive Adaptive Reweighted Sampling |
| C-H | Carbon–Hydrogen bond |
| CNN | Convolutional Neural Network |
| CNN-1D | One-Dimensional Convolutional Neural Network |
| CV | Cross-Validated |
| D | |
| DD-SIMCA | Data-Driven Soft Independent Modeling of Class Analogy |
| DT-PLS | Definition not provided |
| DT | Detrending |
| DTC | Decision Tree Classifier |
| DTR | Decision Tree Regressor |
| DNA | Deoxyribonucleic acid |
| E | |
| ELM | Extreme Learning Machine |
| EMCVS | Extended MC-based Variable Selection |
| EMSC | Extended Multiplicative Signal Correction |
| ETC | Extremely Randomized Trees Classifier |
| ETR | Extra Trees Regressor |
| F | |
| FAO | Food and Agriculture Organization |
| FD | First Derivative |
| FT-IR | Fourier Transform Infrared Spectroscopy |
| FT-NIR | Fourier Transform Near Infrared Spectroscopy |
| G | |
| GTE | Green Tea Extract |
| H | |
| HPLC | High-Performance Liquid Chromatography |
| I | |
| IARC | International Agency for Research on Cancer |
| IoT | Internet of Things |
| IRIV | Iteratively Retained Informative Variables |
| IWO | Invasive Weed Optimization |
| K | |
| KNC | K-Nearest Centroid |
| KNN | K-Nearest Neighbors |
| KNR | K-Nearest Neighbors Regression |
| KS | Kennard-Stone Sampling |
| KSPXY | kernel distance-based sample set partition based on joint x-y distances |
| L | |
| LASSO | Least Absolute Shrinkage and Selection Operator |
| LDA | Linear Discriminant Analysis |
| M | |
| MAE | Mean Absolute Error |
| MC | Mean Centering |
| MIR | Mid-Infrared Spectroscopy |
| MLP | Multilayer Perceptron |
| MLR | Multiple Linear Regression |
| MPLSR | Modified Partial Least Squares Regression |
| MSC | Multiplicative Scatter Correction |
| N | |
| N-H | Nitrogen–hydrogen bond |
| NIR | Near-Infrared Spectroscopy |
| NN | Neural Network |
| O | |
| OCPLS | One-Class Partial Least Squares |
| O-H | Oxygen–hydrogen bond |
| OPLS-DA | Orthogonal Partial Least Squares Discriminant Analysis |
| P | |
| PCA | Principal Component Analysis |
| PCR | Principal Component Regression |
| PLS-DA | Partial Least Squares Discriminant Analysis |
| PLS | Partial Least Squares |
| PSO | Particle Swarm Optimization |
| R | |
| RARP | Recognition-Accuracy Rate in Prediction |
| RARV | Recognition-Accuracy Rate in Validation |
| RCGA | Real-Coded Genetic Algorithm |
| RER | Range Error Ratio |
| RFC | Random Forest Classifier |
| RFR | Random Forest Regression |
| RGB | Red-Green-Blue |
| RMSE | Root Mean Square Error |
| RMSECV | Root Mean Square Error of Cross-Validation |
| RMSEP | Root Mean Square Error of Prediction |
| ROBPCA | Robust Principal Component Analysis |
| ROC | Receiver Operating Characteristic |
| RP | Reflectance Profile |
| RPD | Residual Predictive Deviation |
| S | |
| SD | Second Derivative |
| SDG | Sustainable Development Goals |
| SDPC | Successive Derivative Preprocessing and Classification |
| SEC | Standard Error of Calibration |
| SEP | Standard Error of Prediction |
| SG | Savitzky–Golay |
| SIMCA | Soft Independent Modeling of Class Analogy |
| SNR | Signal-to-Noise Ratio |
| SNV | Standard Normal Variate |
| SPA | Successive Projections Algorithm |
| SPXY | Sample Set Partitioning based on joint X–Y distances |
| SVM | Support Vector Machine |
| SVR | Support Vector Regression |
| T | |
| TD | Third Derivative |
| V | |
| VIP | Variable Importance in Projection |
| VIS-NIR | Visible and Near-Infrared Spectroscopy |
| VN | Vector Normalization |
| W | |
| WSP | Wavelength Step-by-step Phase-out |
| X | |
| XDS | Xenon Discharge Source |
References
- FAO. “Food Fraud”—No Internationally Agreed Definition. 2023 Nov [Cited 2025 Mar 4]. Available online: https://www.fao.org/food-safety/news/news-details/en/c/1661886/ (accessed on 1 March 2025).
- Kshetri, N. Blockchain’s Role in Enhancing Quality and Safety and Promoting Sustainability in the Food and Beverage Industry. Sustainability 2023, 15, 16223. [Google Scholar] [CrossRef]
- Giannakas, K.; Yiannaka, A. Food Fraud: Causes, Consequences, and Deterrence Strategies. Annu. Rev. Resour. Econ. 2023, 15, 85–104. Available online: https://www.annualreviews.org/content/journals/10.1146/annurev-resource-101422-013027 (accessed on 1 March 2025). [CrossRef]
- Everstine, K.; Hellberg, R.S.; Sklare, S.A. Introduction to food fraud. In Food Fraud: A Global Threat with Public Health and Economic Consequences; Academic Press: Cambridge, MA, USA, 2021; pp. 1–7. [Google Scholar]
- Su, G.; Yu, C.; Liang, S.; Wang, W.; Wang, H. Multi-omics in food safety and authenticity in terms of food components. Food Chem. 2024, 437, 137943. [Google Scholar] [CrossRef]
- Aslam, N.; Fatima, R.; Altemimi, A.B.; Ahmad, T.; Khalid, S.; Hassan, S.A.; Aadil, R. Overview of industrial food fraud and authentication through chromatography technique and its impact on public health. Food Chem. 2024, 460, 140542. [Google Scholar] [CrossRef]
- Vignesh, T.; Selvakumar, D.; Jayavel, R. Detecting ferric oxide adulteration in chilli Powder: A Multimodal analytical approach for enhanced food safety. Microchem. J. 2025, 208, 112332. [Google Scholar] [CrossRef]
- Everstine, K.D.; Chin, H.B.; Lopes, F.A.; Moore, J.C. Database of Food Fraud Records: Summary of Data from 1980 to 2022. J. Food Prot. 2024, 87, 100227. [Google Scholar] [CrossRef] [PubMed]
- Brevett, C.A.S.; Cox, J.A. Intentional Adulteration of Foods with Chemicals: Snapshot for 2009–2022. J. Food Prot. 2024, 87, 100305. [Google Scholar] [CrossRef]
- Manning, L. Fraud in the food system: Critiquing the ‘bad apple’ perspective. Trends Food Sci. Technol. 2024, 149, 104563. [Google Scholar] [CrossRef]
- Maritano, V.; Barge, P.; Biglia, A.; Comba, L.; Ricauda Aimonino, D.; Tortia, C.; Gay, P. Anticounterfeiting and Fraud Mitigation Solutions for High-value Food Products. J. Food Prot. 2024, 87, 100251. [Google Scholar] [CrossRef]
- Cozzolino, D.; Dayananda, B.; Chapman, J. Food adulteration. In Chemometrics: Data Treatment and Applications; Elsevier: Amsterdam, The Netherlands, 2024; pp. 273–291. [Google Scholar]
- Cruz-Tirado, J.P.; Fossati, F.; Haughey, S.A.; Elliott, C.T.; Siche, R.; Barbin, D. Nutshell detection in cinnamon powder using a portable NIR spectrometer and hierarchical modelling. J. Food Compos. Anal. 2025, 140, 107226. [Google Scholar] [CrossRef]
- Song, W.; Yun, Y.H.; Lv, Y.; Zhang, C.; Tang, X.; Wang, H.; Wang, Z. Authentication and quality assessment of whey protein-based sports supplements using portable near-infrared spectroscopy and hyperspectral imaging. Food Res. Int. 2025, 203, 115807. [Google Scholar] [CrossRef]
- González-Gómez, L.; Gañán, J.; Morante-Zarcero, S.; Pérez-Quintanilla, D.; Sierra, I. Atropine and scopolamine occurrence in spices and fennel infusions. Food Control 2023, 146, 109555. [Google Scholar] [CrossRef]
- Schleiffer, M.; Speiser, B. Presence of pesticides in the environment, transition into organic food, and implications for quality assurance along the European organic food chain—A review. Environ. Pollut. 2022, 313, 120116. [Google Scholar] [CrossRef] [PubMed]
- Zhao, S.; Huang, X.; Chen, G.; Qin, H.; Xu, B.; Luo, Y.; Liao, Y.; Wang, S.; Yan, S.; Zhao, J. Causal inference and mechanism for unraveling the removal of four pesticides from lettuce (Lactuca sativa L.) via ultrasonic processing and various immersion solutions. Ultrason. Sonochemistry 2024, 108, 106937. [Google Scholar] [CrossRef] [PubMed]
- Soniya, M.; Maisnam, G.; Barak, D.; Sudha, P.; Pathma, J. Dietary intake of pesticides through fruits. In Current Developments in Biotechnology and Bioengineering: Pesticides: Human Health, Environmental Impacts and Management; Elsevier: Amsterdam, The Netherlands, 2023; pp. 139–166. [Google Scholar]
- Perez, M.; Domínguez-López, I.; López-Yerena, A.; Vallverdú Queralt, A. Current strategies to guarantee the authenticity of coffee. Crit. Rev. Food Sci. Nutr. 2023, 63, 539–554. Available online: https://www.tandfonline.com/doi/abs/10.1080/10408398.2021.1951651 (accessed on 1 March 2025). [CrossRef]
- Ferreira, G.; Tucker, J.; Rakola, E.; Skorbiansky, S.R. Fraud in organic foods. In Food Fraud: A Global Threat with Public Health and Economic Consequences; Academic Press: Cambridge, MA, USA, 2021; pp. 335–350. [Google Scholar]
- Soon, J.M.; Abdul Wahab, I.R. Global food recalls and alerts associated with labelling errors and its contributory factors. Trends Food Sci. Technol. 2021, 118, 791–798. [Google Scholar] [CrossRef]
- Casarin, P.; Giopato Viell, F.L.; Good Kitzberger, C.S.; dos Santos, L.D.; Melquiades, F.; Bona, E. Determination of the proximate composition and detection of adulterations in teff flours using near-infrared spectroscopy. Spectrochim. Acta A Mol. Biomol. Spectrosc. 2025, 334, 125955. Available online: https://www.sciencedirect.com/science/article/pii/S1386142525002616 (accessed on 2 March 2025). [CrossRef]
- Zhang, F.; Yu, X.; Li, L.; Song, W.; Dong, D.; Yue, X.; Chen, S.; Zeng, Q. Research on Rapid and Non-Destructive Detection of Coffee Powder Adulteration Based on Portable Near-Infrared Spectroscopy Technology. Foods 2025, 14, 536. [Google Scholar] [CrossRef] [PubMed]
- Yu, Y.; Chai, Y.; Yan, Y.; Li, Z.; Huang, Y.; Chen, L.; Dong, H. Near-infrared spectroscopy combined with support vector machine for the identification of Tartary buckwheat (Fagopyrum tataricum (L.) Gaertn) adulteration using wavelength selection algorithms. Food Chem. 2025, 463, 141548. [Google Scholar] [CrossRef]
- Singh, N.; Yadav, S.S. Nanotechnological advancement in spices adulteration detection and authenticity validation. Food Control 2025, 167, 110806. [Google Scholar] [CrossRef]
- Al-Khatib, M.; Haji, M.; Haouari, M.; Kharbeche, M. Building resilience in the infant formula milk supply chain. Food Control 2024, 165, 110641. [Google Scholar] [CrossRef]
- Neves, D.; Caldas, E. Dietary supplements: International legal framework and adulteration profiles, and characteristics of products on the Brazilian clandestine market. Regul. Toxicol. Pharmacol. 2015, 73, 93–104. [Google Scholar] [CrossRef]
- Bayen, S.; Elliott, C.; Arlorio, M.; Ballin, N.Z.; Birse, N.; Brockmeyer, J.; Chahal, S.; Corradini, M.; Hanner, R.; Hann, S.; et al. Towards a harmonized approach for food authenticity marker validation and accreditation. Trends Food Sci. Technol. 2024, 149, 104550. [Google Scholar] [CrossRef]
- Kanwal, N.; Musharraf, S.G. Analytical approaches for the determination of adulterated animal fats and vegetable oils in food and non-food samples. Food Chem. 2024, 460, 140786. [Google Scholar] [CrossRef]
- Jiang, Y.; Wei, S.; Ge, H.; Zhang, Y.; Wang, H.; Wen, X.; Guo, C.; Wang, S.; Chen, Z.; Li, P. Advances in the Identification Methods of Food-Medicine Homologous Herbal Materials. Foods 2025, 14, 608. [Google Scholar] [CrossRef]
- Kaloo, I.; Naqash, S.; Majid, D.; Makroo, H.A.; Dar, B.N. Traditional analytical methods in food industry: Current challenges and issues in food analysis. In Green Chemistry in Food Analysis: Conventional and Emerging Approaches; Elsevier: Amsterdam, The Netherlands, 2024; pp. 1–22. [Google Scholar]
- Shi, S.; Zhang, K.; Tian, N.; Jin, Z.; Liu, K.; Huang, L.; Tian, X.; Cao, C.; Zhang, Y.; Jiang, Y. Spectroscopic techniques combined with chemometrics for rapid detection of food adulteration: Applications, perspectives, and challenges. Food Res. Int. 2025, 211, 116459. Available online: https://www.sciencedirect.com/science/article/pii/S0963996925007975 (accessed on 2 March 2025). [CrossRef] [PubMed]
- Usman, I.; Sana, S.; Afzaal, M.; Imran, A.; Saeed, F.; Ahmed, A.; Shah, Y.A.; Munir, M.; Ateeq, H.; Afzal, A.; et al. Advances and challenges in conventional and modern techniques for halal food authentication: A review. Food Sci. Nutr. 2024, 12, 1430–1443. [Google Scholar] [CrossRef] [PubMed]
- Czarnecki, M.A.; Morisawa, Y.; Ozaki, Y. Hydrogen Bonding from Perspective of Overtones and Combination Modes: Near-Infrared Spectroscopic Study. In Spectroscopy and Computation of Hydrogen-Bonded Systems; John Wiley and Sons: Hoboken, NJ, USA, 2022; pp. 233–260. Available online: https://onlinelibrary.wiley.com/doi/full/10.1002/9783527834914.ch9 (accessed on 2 March 2025).
- Ozaki, Y.; Morisawa, Y. Principles and Characteristics of NIR Spectroscopy. In Near-Infrared Spectroscopy: Theory, Spectral Analysis, Instrumentation, and Applications; Springer: Berlin/Heidelberg, Germany, 2021; pp. 11–35. Available online: https://link.springer.com/chapter/10.1007/978-981-15-8648-4_2 (accessed on 2 March 2025).
- Caballero-Agosto, E.R.; Sierra-Vega, N.O.; Rolon-Ocasio, Y.; Hernandez-Rivera, S.P.; Infante-Degró, R.A.; Fontalvo-Gomez, M.; Pacheco-Londoño, L.C.; Infante-Castillo, R. Detection and quantification of corn starch and wheat flour as adulterants in milk powder by near- and mid-infrared spectroscopy coupled with chemometric routines. Food Chem. Adv. 2024, 4, 100582. [Google Scholar] [CrossRef]
- Lanjewar, M.G.; Morajkar, P.P.; Parab, J.S. Portable system to detect starch adulteration in turmeric using NIR spectroscopy. Food Control 2024, 155, 110095. [Google Scholar] [CrossRef]
- Yuan, L.; Chen, X.; Huang, Y.; Chen, J.; Pan, T. Spectral separation degree method for Vis-NIR spectroscopic discriminant analysis of milk powder adulteration. Spectrochim. Acta A Mol. Biomol. Spectrosc. 2023, 301, 122975. [Google Scholar] [CrossRef] [PubMed]
- Sadeghi, A.; Khani, S.; Sabourian, R.; Hajimahmoodi, M.; Ghasemi, J.B. Integrating CNNs and chemometrics for analyzing NIR spectra and RGB images in turmeric adulterant detection. J. Food Compos. Anal. 2025, 141, 107324. [Google Scholar] [CrossRef]
- Chikri, M.; Srata, L.; Farres, S.; Tmimi, Y.; Fethi, F. The development of a green analytical method to monitor adulteration in ginger using visible and near-infrared spectroscopy combined with chemometric tools. Moroc. J. Chem. 2025, 13, 122–132. [Google Scholar]
- Tao, F.; Liu, L.; Kucha, C.; Ngadi, M. Rapid and non-destructive detection of cassava flour adulterants in wheat flour using a handheld MicroNIR spectrometer. Biosyst. Eng. 2021, 203, 34–43. [Google Scholar] [CrossRef]
- Millatina, N.R.N.; Calle, J.L.P.; Barea-Sepúlveda, M.; Setyaningsih, W.; Palma, M. Detection and quantification of cocoa powder adulteration using Vis-NIR spectroscopy with chemometrics approach. Food Chem. 2024, 449, 139212. [Google Scholar] [CrossRef]
- Oliveira, M.M.; Ferreira, M.V.S.; Kamruzzaman, M.; Barbin, D.F. Prediction of impurities in cocoa shell powder using NIR spectroscopy. J. Pharm. Biomed. Anal. Open 2023, 2, 100015. [Google Scholar] [CrossRef]
- Oliveira, M.M.; Badaró, A.T.; Esquerre, C.A.; Kamruzzaman, M.; Barbin, D.F. Handheld and benchtop vis/NIR spectrometer combined with PLS regression for fast prediction of cocoa shell in cocoa powder. Spectrochim. Acta A Mol. Biomol. Spectrosc. 2023, 298, 122807. [Google Scholar] [CrossRef]
- Zaukuu, J.L.Z.; Adams, Z.S.; Donkor-Boateng, N.A.; Mensah, E.T.; Bimpong, D.; Amponsah, L.A. Non-invasive prediction of maca powder adulteration using a pocket-sized spectrophotometer and machine learning techniques. Sci. Rep. 2024, 14, 10426. [Google Scholar] [CrossRef]
- De Carvalho Rodrigues, H.; Da Silva Paulino, H.F.; Valderrama, P.; Março, P.H. The use of chemometrics to discriminate sample adulteration in different levels: The case of peruvian maca. Braz. J. Anal. Chem. 2021, 8, 107–115. [Google Scholar] [CrossRef]
- Czaja, T.P.; Engelsen, S.B. Why nothing beats NIRS technology: The green analytical choice for the future sustainable food production. Spectrochim. Acta A Mol. Biomol. Spectrosc. 2025, 325, 125028. [Google Scholar] [CrossRef] [PubMed]
- Ozaki, Y.; Morita, S.; Morisawa, Y. Spectral Analysis in the NIR Spectroscopy. In Near-Infrared Spectroscopy: Theory, Spectral Analysis, Instrumentation, and Applications; Springer: Berlin/Heidelberg, Germany, 2021; pp. 63–82. Available online: https://link.springer.com/chapter/10.1007/978-981-15-8648-4_4 (accessed on 3 March 2025).
- Ting, D.F.; Pui, L.P.; Solihin, M.I. Feasibility of fraud detection in milk powder using a handheld near-infrared spectroscopy. In AIP Conference Proceedings; American Institute of Physics: Shah Alam, Malaysia, 2020. [Google Scholar]
- Attia, H.; Mahnashi, Y.; Qaid, A.; Mohamed, N.E.; Qureshi, K.K. Near-infrared spectroscopy for glucose detection in aqueous solution. Results Opt. 2024, 16, 100738. [Google Scholar] [CrossRef]
- Faith Ndlovu, P.; Samukelo Magwaza, L.; Zeray Tesfay, S.; Ramaesele Mphahlele, R. Destructive and rapid non-invasive methods used to detect adulteration of dried powdered horticultural products: A review. Food Res. Int. 2022, 157, 111198. [Google Scholar] [CrossRef] [PubMed]
- Li, S.; Zhang, Z.; Zhang, Z.; Zhou, S.; Liu, M.; Li, X.; Zheng, Z.; Sun, J. Comparative analysis of spectral variable selection methods for NIR-based multi-component detection of Xanthoceras sorbifolium Bunge seed kernels. Microchem. J. 2025, 212, 113128. [Google Scholar]
- Li, F.; Zhang, J.; Wang, Y. Vibrational Spectroscopy Combined with Chemometrics in Authentication of Functional Foods. Crit. Rev. Anal. Chem. 2024, 54, 333–354. Available online: https://www.tandfonline.com/doi/abs/10.1080/10408347.2022.2073433 (accessed on 3 March 2025).
- Czarnecki, M.A.; Béc, K.B.; Grabska, J.; Hofer, T.S.; Ozaki, Y. Overview of Application of NIR Spectroscopy to Physical Chemistry. In Near-Infrared Spectroscopy: Theory, Spectral Analysis, Instrumentation, and Applications; Springer: Berlin/Heidelberg, Germany, 2021; pp. 297–330. Available online: https://link.springer.com/chapter/10.1007/978-981-15-8648-4_13 (accessed on 3 March 2025).
- Martins, R.C.; Barroso, T.G.; Jorge, P.; Cunha, M.; Santos, F. Unscrambling spectral interference and matrix effects in Vitis vinifera Vis-NIR spectroscopy: Towards analytical grade ‘In Vivo’ sugars and acids quantification. Comput. Electron. Agric. 2022, 194, 106710. [Google Scholar] [CrossRef]
- Nagy, M.M.; Wang, S.; Farag, M.A. Quality analysis and authentication of nutraceuticals using near IR (NIR) spectroscopy: A comprehensive review of novel trends and applications. Trends Food Sci. Technol. 2022, 123, 290–309. [Google Scholar] [CrossRef]
- Fatemi, A.; Singh, V.; Kamruzzaman, M. Identification of informative spectral ranges for predicting major chemical constituents in corn using NIR spectroscopy. Food Chem. 2022, 383, 132442. [Google Scholar] [CrossRef]
- Reda, R.; Saffaj, T.; Bouzida, I.; Saidi, O.; Belgrir, M.; Lakssir, B.; El Hadrami, E. Optimized variable selection and machine learning models for olive oil quality assessment using portable near infrared spectroscopy. Spectrochim. Acta A Mol. Biomol. Spectrosc. 2023, 303, 123213. [Google Scholar]
- Munnaf, M.A.; Mouazen, A.M. Removal of external influences from on-line vis-NIR spectra for predicting soil organic carbon using machine learning. Catena 2022, 211, 106015. [Google Scholar]
- Yang, J.; Li, J.; Hu, J.; Yang, W.; Zhang, X.; Xu, J.; Zhang, Y.; Luo, X.; Ting, K.; Lin, T. An interpretable deep learning approach for calibration transfer among multiple near-infrared instruments. Comput. Electron. Agric. 2022, 192, 106584. [Google Scholar] [CrossRef]
- Mokari, A.; Guo, S.; Bocklitz, T. Exploring the Steps of Infrared (IR) Spectral Analysis: Pre-Processing, (Classical) Data Modelling, and Deep Learning. Molecules 2023, 28, 6886. [Google Scholar] [CrossRef]
- Zhang, W.; Kasun, L.C.; Wang, Q.J.; Zheng, Y.; Lin, Z. A Review of Machine Learning for Near-Infrared Spectroscopy. Sensors 2022, 22, 9764. [Google Scholar] [CrossRef]
- Giussani, B.; Monti, M.; Riu, J. From spectroscopic data variability to optimal preprocessing: Leveraging multivariate error in almond powder adulteration of different grain size. Anal. Bioanal. Chem. 2024, 417, 1393–1405. [Google Scholar] [CrossRef] [PubMed]
- Zaukuu, J.L.Z.; Nkansah, A.A.; Mensah, E.T.; Agbolegbe, R.K.; Kovacs, Z. Non-destructive authentication of melon seed (Cucumeropsis mannii) powder using a pocket-sized near-infrared (NIR) spectrophotometer with multiple spectral preprocessing. J. Food Compos. Anal. 2024, 134, 106425. [Google Scholar]
- Kar, S.; Tudu, B.; Bandyopadhyay, R. Statistical machine learning techniques applied to NIR spectral data for rapid detection of sudan dye-I in turmeric powders with optimized pre-processing and wavelength selection. J. Food Sci. Technol. 2024, 61, 1955–1964. [Google Scholar] [CrossRef] [PubMed]
- Chen, R.; Li, S.; Cao, H.; Xu, T.; Bai, Y.; Li, Z.; Leng, X.; Huang, Y. Rapid quality evaluation and geographical origin recognition of ginger powder by portable NIRS in tandem with chemometrics. Food Chem. 2024, 438, 137931. [Google Scholar]
- Shutevska, K.; Bajatovska, A.M.; Anastasova, L.; Zhivikj, Z.; Zafirova Gjorgievska, M.; Spasikj, S.; Ivanovska, T.P.; Makreski, P.; Geskovski, N. Rapid quantification models for assessing melamine adulteration in sport nutrition supplements via benchtop and portable NIRS instruments. Spectrochim. Acta A Mol. Biomol. Spectrosc. 2024, 317, 124370. [Google Scholar]
- Lukacs, M.; Zaukuu, J.L.Z.; Bazar, G.; Pollner, B.; Fodor, M.; Kovacs, Z. Comparison of Multiple NIR Spectrometers for Detecting Low-Concentration Nitrogen-Based Adulteration in Protein Powders. Molecules 2024, 29, 781. [Google Scholar]
- Boadu, V.G.; Teye, E.; Lamptey, F.P.; Amuah, C.L.Y.; Sam-Amoah, L.K. Novel authentication of African geographical coffee types (bean, roasted, powdered) by handheld NIR spectroscopic method. Heliyon 2024, 10, e35512. [Google Scholar] [CrossRef]
- Netto, J.M.; Honorato, F.A.; Celso, P.G.; Pimentel, M.F. Authenticity of almond flour using handheld near infrared instruments and one class classifiers. J. Food Compos. Anal. 2023, 115, 104981. [Google Scholar]
- Lanjewar, M.G.; Asolkar, S.; Parab, J.S.; Morajkar, P.P. Detecting starch-adulterated turmeric using Vis-NIR spectroscopy and multispectral imaging with machine learning. J. Food Compos. Anal. 2024, 136, 106700. [Google Scholar]
- Yegon, D.; Ojijo, N.K.; Tybussek, T.; Owino, W. Application of portable near-infrared spectroscopy for rapid detection and quantification of adulterants in baobab fruit pulp. Int. J. Food Sci. Technol. 2023, 58, 1465–1473. [Google Scholar]
- Lukacs, M.; Vitalis, F.; Bardos, A.; Tormási, J.; Bec, K.B.; Grabska, J.; Gillay, Z.; Tömösközi-Farkas, R.; Abrankó, L.; Albanese, D.; et al. Comparison of Multiple NIR Instruments for the Quantitative Evaluation of Grape Seed and Other Polyphenolic Extracts with High Chemical Similarities. Foods 2024, 13, 4164. [Google Scholar] [CrossRef]
- Rukundo, I.R.; Danao, M.C. Identifying turmeric powder by source and metanil yellow adulteration levels using near-infrared spectra and PCA-SIMCA modeling. J. Food Prot. 2020, 83, 968–974. [Google Scholar]
- Coqueiro, J.S.; Beatriz Sales de Lima, A.; Cardim de Jesus, J.; Rodrigues Silva, R.; Passini Barbosa Ferrão, S.; Soares Santos, L. Ensuring authenticity of cinnamon powder: Detection of adulteration with coffee husk and corn meal using NIR, MIR spectroscopy and chemometrics. Food Control 2024, 166, 110681. [Google Scholar] [CrossRef]
- Castro, W.; Oblitas, J.; Nuñez, L.; Yoplac, I.; Avila-George, H.; De-la-Torre, M. Adulterant estimation in paprika powder using deep learning and chemometrics through near-infrared spectroscopy. Neural Comput. Appl. 2024, 36, 14263–14273. [Google Scholar] [CrossRef]
- Rahmawati, L.; Zahra, A.M.; Listanti, R.; Masithoh, R.E.; Hariadi, H.; Adnan; Syafutri, M.; Lidiasari, E.; Amdani, R.; Puspitahati; et al. Necessity of Log(1/R) and Kubelka-Munk transformation in chemometrics analysis to predict white rice flour adulteration in brown rice flour using visible-near-infrared spectroscopy. Food Sci. Technol. 2023, 43. [Google Scholar] [CrossRef]
- Kene Ejeahalaka, K.; On, S.L.W. Effective detection and quantification of chemical adulterants in model fat-filled milk powders using NIRS and hierarchical modelling strategies. Food Chem. 2020, 309, 125785. [Google Scholar] [CrossRef]
- Lukacs, M.; Bazar, G.; Pollner, B.; Henn, R.; Kirchler, C.G.; Huck, C.W.; Kovacs, Z. Near infrared spectroscopy as an alternative quick method for simultaneous detection of multiple adulterants in whey protein-based sports supplement. Food Control 2018, 94, 331–340. [Google Scholar] [CrossRef]
- Nobari Moghaddam, H.; Tamiji, Z.; Amini, M.; Khoshayand, M.R.; Kobarfrad, F.; Sadeghi, N.; Hajimahmoodi, M. Development of non-destructive methods for the assessment of authenticity of sports whey protein supplements. Food Addit. Contam. Part A 2024, 41, 339–351. [Google Scholar] [CrossRef] [PubMed]
- Amsaraj, R.; Ranjan, R.; Rachaiah, B.; Mutturi, S. Multi-instrument spectroscopic study for authentication of curcumin content in commercial turmeric powders using machine learning algorithms. J. Food Compos. Anal. 2024, 134, 106543. [Google Scholar] [CrossRef]
- Oliveira, M.; Cruz-Tirado, J.; Roque, J.; Teófilo, R.; Barbin, D. Portable near-infrared spectroscopy for rapid authentication of adulterated paprika powder. J. Food Compos. Anal. 2020, 87, 103403. [Google Scholar]
- Chai, Y.; Yu, Y.; Zhu, H.; Li, Z.; Dong, H.; Yang, H. Identification of common buckwheat (Fagopyrum esculentum Moench) adulterated in Tartary buckwheat (Fagopyrum tataricum (L.) Gaertn) flour based on near-infrared spectroscopy and chemometrics. Curr. Res. Food Sci. 2023, 7, 100573. [Google Scholar] [CrossRef] [PubMed]
- Sitorus, A.; Lapcharoensuk, R. Exploring Deep Learning to Predict Coconut Milk Adulteration Using FT-NIR and Micro-NIR Spectroscopy. Sensors 2024, 24, 2362. [Google Scholar] [PubMed]
- Li, L.; Jin, S.; Wang, Y.; Liu, Y.; Shen, S.; Li, M.; Ma, Z.; Ning, J.; Zhang, Z. Potential of smartphone-coupled micro NIR spectroscopy for quality control of green tea. Spectrochim. Acta A Mol. Biomol. Spectrosc. 2021, 247, 119096. [Google Scholar]
- Bala, M.; Sethi, S.; Sharma, S.; Mridula, D.; Kaur, G. Non-destructive determination of grass pea and pea flour adulteration in chickpea flour using near-infrared reflectance spectroscopy and chemometrics. J. Sci. Food Agric. 2023, 103, 1294–1302. [Google Scholar] [PubMed]
- Bala, M.; Sethi, S.; Sharma, S.; Mridula, D.; Kaur, G. Prediction of maize flour adulteration in chickpea flour (besan) using near infrared spectroscopy. J. Food Sci. Technol. 2022, 59, 3130–3138. [Google Scholar] [CrossRef]
- Shi, S.; Feng, J.; Ma, Y.; Cao, C.; Li, L.; Jiang, Y. Rapid determination of two illegal additives in wheat flour by near-infrared spectroscopy and different key wavelength selection algorithms. LWT 2023, 189, 115437. Available online: https://www.sciencedirect.com/science/article/pii/S0023643823010162#sec2 (accessed on 3 March 2025). [CrossRef]
- Sampaio, P.S.; Castanho, A.; Almeida, A.S.; Oliveira, J.; Brites, C. Identification of rice flour types with near-infrared spectroscopy associated with PLS-DA and SVM methods. Eur. Food Res. Technol. 2020, 246, 527–537. [Google Scholar]
- Ndlovu, P.F.; Magwaza, L.S.; Tesfay, S.Z.; Mphahlele, R.R. Rapid spectroscopic method for quantifying gluten concentration as a potential biomarker to test adulteration of green banana flour. Spectrochim. Acta A Mol. Biomol. Spectrosc. 2021, 262, 120081. [Google Scholar]
- Zeng, M.N.; Zheng, S.Y. Near infrared spectroscopy combined with chemometrics to detect and quantify adulteration of maca powder. J. Near Infrared Spectrosc. 2021, 29, 108–115. [Google Scholar]
- Zaukuu, J.L.Z.; Zimmermann, E.; Acquah, B.B.; Kwofie, E.D. Novel Detection Techniques for Shrimp Powder Adulteration Using Near Infrared Spectroscopy in Tandem Chemometric Tools and Multiple Spectral Preprocessing. Food Anal. Methods 2023, 16, 819–831. [Google Scholar] [CrossRef]
- Cruz-Tirado, J.P.; de França, R.L.; Tumbajulca, M.; Barraza-Jáuregui, G.; Barbin, D.F.; Siche, R. Detection of cumin powder adulteration with allergenic nutshells using FT-IR and portable NIRS coupled with chemometrics. J. Food Compos. Anal. 2023, 116, 105044. [Google Scholar]
- Ndlovu, P.F.; Magwaza, L.S.; Tesfay, S.Z.; Mphahlele, R.R. Vis-NIR spectroscopic and chemometric models for detecting contamination of premium green banana flour with wheat by quantifying resistant starch content. J. Food Compos. Anal. 2021, 102, 104035. [Google Scholar] [CrossRef]
- Ni, D.; Nelis, J.L.D.; Dawson, A.L.; Bourne, N.; Juliano, P.; Colgrave, M.L.; Juhász, A.; Bose, U. Application of near-infrared spectroscopy and chemometrics for the rapid detection of insect protein adulteration from a simulated matrix. Food Control 2024, 159, 110268. [Google Scholar]
- Zaukuu, J.L.Z.; Attipoe, N.Q.; Korneh, P.B.; Mensah, E.T.; Bimpong, D.; Amponsah, L.A. Detection of bissap calyces and bissap juices adulteration with sorghum leaves using NIR spectroscopy and VIS/NIR spectroscopy. J. Food Compos. Anal. 2025, 141, 107358. Available online: https://www.sciencedirect.com/science/article/pii/S0889157525001723?via%3Dihub#sec0010 (accessed on 3 March 2025). [CrossRef]
- Ku, H.H.; Liao, Y.C.; Chi, C.H. Deep Learning Applied on Cinnamon Powder Adulteration Detection. In Proceedings of the 2023 IEEE 6th International Conference on Knowledge Innovation and Invention, ICKII 2023, Hokkaido, Japan, 11–13 August 2023; pp. 324–327. [Google Scholar]
- Ken Essuman, E.; Teye, E.; Sam-Amoah, L.K.; Amuah, C.L.Y. Rapid and non-destructive prediction of adulterated chilli powder by employing pocket-sized NIR spectrometer and chemometrics. Infrared Phys. Technol. 2023, 135, 104961. [Google Scholar]
- Yu, Y.; Chai, Y.; Li, Z.; Li, Z.; Ren, Z.; Dong, H.; Chen, L. Quantitative predictions of protein and total flavonoids content in Tartary and common buckwheat using near-infrared spectroscopy and chemometrics. Food Chem. 2025, 462, 141033. [Google Scholar]
- Chen, M.; Song, J.; He, H.; Yu, Y.; Wang, R.; Huang, Y.; Li, Z. Quantitative Analysis of High-Price Rice Adulteration Based on Near-Infrared Spectroscopy Combined with Chemometrics. Foods 2024, 13, 3241. [Google Scholar]
- Luqing, L.; Lingdong, W.; Jingming, N.; Zhengzhu, Z. Detection and quantification of sugar and glucose syrup in roasted green tea using near infrared spectroscopy. J. Near Infrared Spectrosc. 2015, 23, 317–325. [Google Scholar] [CrossRef]
- Wang, Z.; Wu, Q.; Kamruzzaman, M. Portable NIR spectroscopy and PLS based variable selection for adulteration detection in quinoa flour. Food Control 2022, 138, 108970. [Google Scholar] [CrossRef]
- Li, C.; Chen, H.; Zhang, Y.; Hong, S.; Ai, W.; Mo, L. Improvement of NIR prediction ability by dual model optimization in fusion of NSIA and SA methods. Spectrochim. Acta A Mol. Biomol. Spectrosc. 2022, 276, 121247. Available online: https://www.sciencedirect.com/science/article/pii/S1386142522003961?via%3Dihub (accessed on 4 March 2025).
- Chen, W.; Chen, H.; Feng, Q.; Mo, L.; Hong, S. A hybrid optimization method for sample partitioning in near-infrared analysis. Spectrochim. Acta A Mol. Biomol. Spectrosc. 2021, 248, 119182. Available online: https://www.sciencedirect.com/science/article/pii/S1386142520311616?via%3Dihub (accessed on 4 March 2025).
- Teye, E.; Amuah, C.L.Y. Rice varietal integrity and adulteration fraud detection by chemometrical analysis of pocket-sized NIR spectra data. Appl. Food Res. 2022, 2, 100218. [Google Scholar] [CrossRef]
- Pandiselvam, R.; Mahanti, N.K.; Manikantan, M.R.; Kothakota, A.; Chakraborty, S.K.; Ramesh, S.V.; Beegum, P.S. Rapid detection of adulteration in desiccated coconut powder: Vis-NIR spectroscopy and chemometric approach. Food Control 2022, 133, 108588. [Google Scholar] [CrossRef]
- Behera, A.R.; Suresh, H.; Kumar, A.; Selvaraja, S.K.; Pratap, R. Detection of spent turmeric adulteration in powdered Curcuma longa using Vis-NIR spectroscopy and machine learning. In Proceedings of the 2020 5th IEEE International Conference on Emerging Electronics, ICEE 2020, New Delhi, India, 26–28 November 2020. [Google Scholar]
- Ejeahalaka, K.K.; Mclaughlin, P.; On, S.L.W. Monitoring the composition, authenticity and quality dynamics of commercially available Nigerian fat-filled milk powders under inclement conditions using NIRS, chemometrics, packaging and microbiological parameters. Food Chem. 2021, 339, 127844. [Google Scholar] [CrossRef] [PubMed]
- Lima, A.B.S.D.; Batista, A.S.; Jesus, J.C.D.; Silva, J.D.J.; Araújo, A.C.M.D.; Santos, L.S. Fast quantitative detection of black pepper and cumin adulterations by near-infrared spectroscopy and multivariate modeling. Food Control 2020, 107, 106802. [Google Scholar] [CrossRef]
- Unuvar, A.; Boyaci, I.H.; Yazar, S.; Koksel, H. Rapid detection of common wheat flour addition to durum wheat flour and pasta using spectroscopic methods and chemometrics. J. Cereal Sci. 2023, 109, 103604. [Google Scholar]
- Ezenarro, J.; Schorn-García, D. How Are Chemometric Models Validated? A Systematic Review of Linear Regression Models for NIRS Data in Food Analysis. J. Chemom. 2025, 39, e70036. [Google Scholar] [CrossRef]
- Lackey, H.E.; Sell, R.L.; Nelson, G.L.; Bryan, T.A.; Lines, A.M.; Bryan, S.A. Practical Guide to Chemometric Analysis of Optical Spectroscopic Data. J. Chem. Educ. 2023, 100, 2608–2626. Available online: https://pubs.acs.org/doi/abs/10.1021/acs.jchemed.2c01112 (accessed on 4 March 2025). [CrossRef]
- Lubenchenko, A.V.; Ivanov, D.A.; Lukiantsev, D.S. Application of MatLab for Processing X-ray Photoelectron Spectroscopy Spectra. In Proceedings of the 2020 5th International Conference on Information Technologies in Engineering Education, Inforino 2020—Proceedings, Moscow, Russia, 1 April 2020. [Google Scholar]
- Reis, L.; Bispo, J.; Cardoso, J.M.P. Compiler techniques for efficient MATLAB to OpenCL code generation. In Proceedings of the IWOCL 2017: 5th International Workshop on OpenCL, Toronto, ON, Canada, 16–18 May 2017. Part F127755. [Google Scholar] [CrossRef]
- Amelin, V.G.; Emel’yanov, O.E.; Shogah, Z.A.C.; Tret’yakov, A.V. Detection and Identification of Starch and Flour Adulteration by Digital Colorimetry and Fourier-Transform Near-IR Spectroscopy. J. Anal. Chem. 2024, 79, 1515–1523. Available online: https://link.springer.com/article/10.1134/S1061934824700916 (accessed on 4 March 2025).
- Garrido-Varo, A.; Garcia-Olmo, J.; Fearn, T. A note on Mahalanobis and related distance measures in WinISI and The Unscrambler. J. Near Infrared Spectrosc. 2019, 27, 253–258. [Google Scholar] [CrossRef]
- Wan, J.; Chen, Y.C.; Morris, A.J.; Thennadil, S.N. A Comparative Investigation of the Combined Effects of Pre-Processing, Wavelength Selection, and Regression Methods on Near-Infrared Calibration Model Performance. Appl. Spectrosc. 2017, 71, 1432–1446. [Google Scholar] [CrossRef]
- Kazeminy, A.; Hashemi, S.; Williams, R.L.; Ritchie, G.E.; Rubinovitz, R.; Sen, S. A Comparison of near Infrared Method Development Approaches Using a Drug Product on Different Spectrophotometers and Chemometric Software Algorithms. J. Near Infrared Spectrosc. 2009, 17, 233–245. [Google Scholar] [CrossRef]
- Whitfield, M.B.; Chinn, M.S. Near infrared spectroscopic data handling and chemometric analysis with the R statistical programming language: A practical tutorial. J. Near Infrared Spectrosc. 2017, 25, 363–380. [Google Scholar] [CrossRef]
- Arianti, N.D.; Saputra, E.; Sitorus, A. An automatic generation of pre-processing strategy combined with machine learning multivariate analysis for NIR spectral data. J. Agric. Food Res. 2023, 13, 100625. Available online: https://www.sciencedirect.com/science/article/pii/S2666154323001321?getft_integrator=scopus&pes=vor&utm_source=scopus (accessed on 4 March 2025). [CrossRef]
- Andresen, M.A. R (Statistical Software). In The Encyclopedia of Research Methods in Criminology and Criminal Justice: Volume II: Parts 5–8; John Wiley and Sons: Hoboken, NJ, USA, 2021; pp. 865–866. ISBN 1119110726/9781119110729. [Google Scholar]
- Torniainen, J.; Afara, I.O.; Prakash, M.; Sarin, J.K.; Stenroth, L.; Töyräs, J. Open-source python module for automated preprocessing of near infrared spectroscopic data. Anal. Chim. Acta 2020, 1108, 1–9. Available online: https://www.sciencedirect.com/science/article/pii/S000326702030204X?via%3Dihub (accessed on 5 March 2025). [CrossRef]
- Bhardwaj, P.; Choudhury, C.; Batra, P. Automating Data Analysis with Python: A Comparative Study of Popular Libraries and their Application. In Proceedings of the International Conference on Technological Advancements in Computational Sciences, ICTACS 2023, Tashkent, Uzbekistan, 1–3 November 2023; pp. 1243–1248. [Google Scholar]
- Lindstrom, G. Programming with Python. IT Prof. 2005, 7, 10–16. [Google Scholar]
- Deo, A.K.A.; Gupta, S.; Kundu, R.; Jaiswal, P.; Fatma, T.; Dehury, M.K. Performance and Metrics Analysis between Python3 via Mojo. In Proceedings of the 2nd International Conference on Sustainable Computing and Smart Systems, ICSCSS 2024—Proceedings, Coimbatore, India, 10–12 July 2024; pp. 1291–1297. [Google Scholar]
- Parrenin, L.; Lorbieski, R.; Jaraceski, J.C.; Danjou, C.; Agard, B. A Decision support tool to analyze food properties from near infrared spectroscopy. In Proceedings of the 2023 15th IEEE International Conference on Industry Applications, INDUSCON 2023—Proceedings, Sao Bernardo do Campo, Brazil, 22–24 November 2023; pp. 1498–1503. [Google Scholar]
- Chiranjeevi, M.; Govindaraj, P.; Karthikbabu, H.; Aala, S.; Chinnadurai, S. See Beyond the Spice: Detecting Black Pepper Adulteration with HSI and Machine Learning. In Proceedings of the 2nd International Conference on Emerging Trends in Information Technology and Engineering, ic-ETITE 2024, Vellore, India, 22–23 February 2024. [Google Scholar]
- Liu, F.; He, Y.; Wang, L.; Maybank, S.J.; Ding, M.; Wahl, F.; Zhu, Y. Application of effective wavelengths and BP neural network for the discrimination of varieties of instant milk tea powders using visible and near infrared spectroscopy. In Proceedings of the SPIE—The International Society for Optical Engineering, Wuhan, China, 15 November 2007. [Google Scholar]


Disclaimer/Publisher’s Note: The statements, opinions and data contained in all publications are solely those of the individual author(s) and contributor(s) and not of MDPI and/or the editor(s). MDPI and/or the editor(s) disclaim responsibility for any injury to people or property resulting from any ideas, methods, instructions or products referred to in the content. |
© 2025 by the authors. Licensee MDPI, Basel, Switzerland. This article is an open access article distributed under the terms and conditions of the Creative Commons Attribution (CC BY) license (https://creativecommons.org/licenses/by/4.0/).