Article

Nutrition Knowledge Varies by Food Group and Nutrient Among Adults

by
Abigail A. Glick
1,
Donna M. Winham
1,*,
Michelle M. Heer
1,
Andrea M. Hutchins
2 and
Mack C. Shelley
3
1
Department of Food Science & Human Nutrition, Iowa State University, Ames, IA 50011, USA
2
Department of Human Physiology & Nutrition, University of Colorado Colorado Springs, Colorado Springs, CO 80918, USA
3
Departments of Political Science and Statistics, Iowa State University, Ames, IA 50011, USA
*
Author to whom correspondence should be addressed.
Foods 2025, 14(4), 606; https://doi.org/10.3390/foods14040606
Submission received: 28 December 2024 / Revised: 25 January 2025 / Accepted: 10 February 2025 / Published: 12 February 2025
(This article belongs to the Section Food Nutrition)

Abstract

:
The United States Dietary Guidelines for Americans (DGA) have provided recommendations for healthy eating patterns to meet nutrient needs and reduce chronic disease risk for decades. However, few Americans fully meet these guidelines, especially regarding five shortfall nutrients, and the vegetable, fruit, pulse, whole grain, and dairy food groups. Nutrition knowledge is a modifiable factor associated with improved dietary behavior, yet it is unclear whether individuals with nutrition-related chronic diseases possess greater knowledge. The study objectives were to (1) describe knowledge of 10 nutrient sources across six food groups, and (2) determine predictive factors for nutrient source and food group knowledge. A national sample of 930 adults from an online panel answered demographic, nutrition-disease knowledge, desired benefits from foods, chronic disease status questions, and identified the presence or absence of 10 nutrients in six food groups. Respondents were 77% White, 51% women, and 70% married, with a mean age of 45 years. Nutrition-disease knowledge was higher for those who were older, women, and highly educated. Having a nutrition-related disease, e.g., heart disease, was not predictive of nutrient-disease knowledge. Whole grains had the highest average nutrient knowledge score (6.26 ± 2.5; range 0–10), while vegetables had the lowest (4.89 ± 2.3). Fat food sources were the best known (3.98 ± 1.5; range 0–6), and folate was the least recognized (2.16 ± 1.4). General linear models of survey variables for the six food groups explained 10.2% to 19.4% of nutrient knowledge variation and described 4.7% to 27.1% of differences in food-source scores for the 10 nutrients. Nutrient-disease knowledge had the most significant influence on nutrient source scores. Gaps in understanding nutrient sources suggest the public needs more applied education.

1. Introduction

For several decades, the United States (US) Dietary Guidelines for Americans (DGA) have provided recommendations for healthy eating patterns across the lifespan to meet nutrient needs and reduce chronic disease risk [1]. Despite this messaging, few Americans meet the recommendations for all food groups or specific nutrients. Diets across all age groups consistently show lower than recommended intakes of dairy, pulses (legumes, beans, and peas), whole grains, fruits, and vegetables [1]. These food groups often contain nutrient-rich items, with multiple micronutrients, fewer added sugars, saturated fat, and sodium [2]. The DGA recommends limiting the latter nutrients because they can contribute to chronic disease risks and obesity [1].
The DGA recommends macronutrients, protein, carbohydrates, and fat for health maintenance and the prevention of chronic disease. Protein is essential for muscle mass, organ integrity, and cellular functions [3]. Adequate protein intakes are of particular concern for people with chronic conditions, including type 2 diabetes and osteoporosis [3,4]. Limits on saturated fat and added sugar intakes are advised to prevent excessive weight gain and to reduce cardiovascular disease (CVD) and the risk of type 2 diabetes [3,5].
Many Americans have difficulty consuming enough dietary fiber, calcium, vitamin D, and potassium [1]. The inadequate intake of these nutrients is concerning because of their essential roles in healthy physiology and chronic disease reduction [1]. Fiber aids gastrointestinal function, blood lipid regulation, glucose metabolism, and weight maintenance. Thus, adequate fiber consumption is recommended for individuals with certain digestive issues, CVD, type 2 diabetes, and for weight management [3,5]. Calcium, vitamin D, and potassium are important nutrients for many functions but are most known for bone development and reducing the risk of osteoporosis [1,4]. Potassium intakes are linked with controlling blood pressure and reducing CVD risk [3,5]. Iron insufficiency is alarming for infants and children due to its importance in cognitive development and adequate blood-carrying capacity. Iron and folate intakes lag among pre-menopausal females [6,7]. Both micronutrients are essential in supporting fetal development. Iron deficiency anemia contributes to fatigue and poor health among women [7].
Other researchers have identified predictive factors that may influence nutrition knowledge. Higher education levels, elevated socioeconomic status, being a woman, older age [8], having successfully modified dietary intakes before, e.g., weight loss [9], children in the household, diagnosed with a nutrition-related chronic disease [10], and culture or ethnicity [11] are related to nutrition knowledge. Individuals who have more resources and time to devote to food acquisition and preparation have more positive nutrition behaviors than those with limited resources [12].
Consumers with higher nutrition knowledge may have greater intakes of nutritious foods [8,13]. Public health messaging that increases nutrition knowledge correlates positively with improved dietary behaviors [14]. However, there are different types of nutrition knowledge that may, or may not, empower consumers to make healthy decisions. Awareness of nutrition knowledge messaging does not always mean consumers know which foods to eat [15]. For example, in a study of young adult African Americans, 77% knew heart disease risk was associated with dietary cholesterol intake, but only 37% knew that animal products contained cholesterol [16]. In an Australian study, 15.9% of participants scored high on nutrition knowledge, but the association with knowledge and intake of iron-rich foods was insignificant [7]. The knowledge that certain foods are high in particular nutrients can be tested. Yet many nutrition ‘knowledge’ questions fail to ask if respondents know the connections between those components and the potential for chronic disease. Consumers may be aware vitamin C is high in citrus fruits, yet knowledge about the function of vitamin C in disease protection is often limited to reducing cold symptoms [17]. Knowledge about the linkages between nutrients and a disease state may be insufficient for consumers to make actionable choices. People may recognize the health messages (e.g., “consume less sodium”, “eat more fiber”, etc.), but not know how to actually implement the changes in their daily diet [18]. A third component of nutrition knowledge is self-assessment of nutrient intake compared to health recommendations. In a national survey, nearly 67% of respondents felt they met dietary fiber recommendations, but only 5% did [19]. Middle-aged American women who self-reported as low carbohydrate dieters were found to consume more carbohydrates and fat than their non-dieter peers [20]. In turn, nutrition knowledge does not always translate into healthy behavior due to resource limitations, family priorities, and other social or environmental restrictions [21].
This study examined consumer awareness of food group sources for 10 nutrients of concern within the DGA. The objectives were to (1) describe knowledge of 10 nutrients within six food groups; and (2) determine which factors (demographics, nutrition-disease knowledge, presence of a nutrition-related disease, intentions to increase or decrease a given nutrient, and self-perceptions of health and diet) were predictive of food group, and individual nutrient knowledge scores. We hypothesized that persons with higher nutrition-disease knowledge, older age, more years of education, and who express interest in limiting or increasing nutrients in their diet will have higher food group and nutrient food source knowledge [18].

2. Materials and Methods

2.1. Study Design and Sample Recruitment

A sample of 1474 adults aged 18–80 who lived on the US mainland in November 2023 started the online survey. The proprietary survey panel service (Survey Monkey® Audience, San Mateo, CA, USA) solicited respondents to match age, gender, and regional quotas for national representativeness. The company provided a small monetary incentive for participant completion of the surveys. Of the 1474 responses provided, 37 did not meet the selection criteria for location or age and did not advance in the survey. Ninety-five cases failed one or both of two integrity checks. Sixty-eight respondents were removed for ‘speeding’ or submitting the survey in under 30% of the completion time median (11 min × 30% = 3.3 min [22]. Participants with missing or conflicting demographic data with that of the Survey Monkey account holder (n = 83), pertinent research questions (n = 52), nutrient or food group responses (n = 149), or conflicting or nonsensical responses (n = 60) were excluded. The final sample for analysis was 930.

2.2. Survey Development

The online survey included demographics, health and diet quality, food acquisition and desired diet attributes, nutrition-disease knowledge, and identification of 10 nutrients across six food groups. Data on consumption of nutrient-rich foods and the health belief model predictors were reported elsewhere [10]. Age, gender, race, ethnicity, marital status, household size and composition, and education questions came from validated surveys [23,24,25,26]. Participants ranked their health status and diet quality using a 5-point Likert scale (poor = 1, excellent = 5) [24,25]. One or more nutrition-related chronic disease conditions diagnosed by a medical professional (high blood pressure, high cholesterol, heart disease, type 2 diabetes, gastrointestinal disorder, or ‘other’) were reported [23]. Participants were asked which, if any, health benefits they wanted from foods [27]. The five options with known nutrition involvement were weight loss, blood glucose control, digestive, cardiovascular, and bone health. More than one option could be selected. Participants were asked if they were trying to limit six nutrients (sugar, carbohydrates, sodium, saturated fat, calories, and cholesterol) [23,26]. A second question inquired about nutrients they were trying to eat enough of (protein, fiber, vitamin D, vitamin C, calcium, iron, potassium, and folate) [23]. These are nutrients associated with DGA recommendations to limit or increase, respectively, for better health [1].
For food acquisition, participants identified if they or another person were the main food shopper and meal preparer [26]. Main shopper and main food preparer represent control over food provisioning. Self-reported health and diet quality variables characterize beliefs in personal health knowledge and behavior. Use of vitamins and/or supplements in the past 6 months was indicated (yes/no) [23]. Seven questions from validated instruments were included relevant to disease and health (dietary fat, fiber, calories, salt, folate, fruit, and vegetable consumption) [27,28].

2.3. Food Group and Nutrient Knowledge Matrix

Two sets of matrix questions with check boxes to indicate the presence of nutrients found in six food groups were completed. Respondents were asked, “In general, which nutrients—if any—might be found in foods from these categories?” No serving size or portion information was provided. The six food groups of milk and milk products (dairy), meat, pulses, whole grains, fruits, and vegetables were presented in randomized row order for each participant [1,29]. Multiple checkbox responses per food group row were allowed with options for ‘none of these nutrients’ and ‘not sure’ available. The columns for the first matrix set were carbohydrates, protein, fat, iron, and calcium. The second matrix set columns were fiber, vitamin D, folate or folic acid, potassium, and vitamin C. The column order was not randomized.
Overall coding for the presence or absence of a nutrient in a food group was based upon commonly consumed items within that group having at least 10% of the daily value for the nutrient. Coding for the presence of fat was based on “low fat” labeling claims from the US Code of Federal Regulations for food labeling [29]. The presence of carbohydrates was from the diabetes carbohydrate counting system of one “carbohydrate choice” [30]. Coding of all other nutrients was derived from the US code of Federal Regulations criteria for food labeling claims for “good source”, “contains”, or “provides” [29]. Serving size and nutrient content of commonly consumed foods within each food group were analyzed using data from the DGA [1], US Department of Agriculture, FoodData Central interactive website [31], and the National Institutes of Health Dietary Supplement Fact Sheets [32]. Flour fortification with folic acid was considered when assessing the presence of folic acid in the whole grain food group. Three Registered Dietitian Nutritionists reviewed the categorization of nutrients included within the food groups. No changes were recommended.

2.4. Data Analysis and Transformations

All statistical analyses and transformations were conducted via IBM SPSS (version 26.0, IBM, Armonk, NY, USA). Binomial items were coded 0/1. Respondents who reported having at least one chronic disease condition or risk factor were coded by the value 1 for the presence of a nutrition-related disease or condition. The correct answers to the seven questions on nutrition-disease knowledge were totaled to create a summary score. The normally distributed nutrition-knowledge score was split at the midpoint value of 3, or the 47th percentile, to create a dichotomous variable used in table display. The correct responses to the nutrient matrix questions were summed as a composite score for the six food groups and 10 nutrients.
A general linear regression model was chosen for analysis because it accommodated binomial and continuous independent variables to predict a continuous outcome, in addition to its flexible modeling of different distributions [33,34]. The initial general linear models (GLMs) included 13 core items (Table 1). They were built as a linear model examining the interaction between terms using a type 3 sum of squares [33]. Decisions to include other variables in the GLMs were based on the DGA and common dietetics-based medical nutrition therapy recommendations [1]. For example, the GLM for the pulse food group included the 13 core variables, three nutrients to increase (fiber, protein, and folate), and two health benefits (CVD and diabetes/blood sugar management) [35]. A similar process was employed for the 10 individual nutrient knowledge scores. Other variables were added, including the appropriate binomial nutrient(s) to limit or to increase and, if applicable, the desired health benefit that related to that nutrient (Table 1) [1]. All variables were examined for collinearity when modeled together, maintaining a Variance Inflation Factor (VIF) of less than 10 [33,34]. All models displayed include only variables that significantly affected the outcome variable. Reported R2 values are the adjusted value.

3. Results

3.1. National Sample Characteristics

The 2022 US Census distributions for age categories were approximated among the 930 survey respondents: 18–25 (8.8% vs. 8.7% nationally), 26–34 (15.6% vs. 12.3%), and 55–64 (12.9% vs. 12.9%) [36]. There were proportionally more respondents in the 35–54 category (50.4% vs. 25.7%) and fewer individuals within the 65+ group (12.3% vs. 17.4%) comparison to the US overall. The racial and ethnic distribution for respondents was higher for non-Hispanic Whites (73.1% vs. 58.4% nationally), with fewer Hispanics or Latinos (8.5% vs. 19.5%), Asians (8.0% vs. 6.4%), and African Americans (6.2% vs. 13.7%) than in the general US population [37]. In comparing the regional distribution of responses to the US, more respondents were in the Northeast (26.9% vs. 17.1%) and about the same for the Midwest (21.4% vs. 20.6%). There were fewer responses in the West (19.8% vs. 23.6%) and South (31.9% vs. 38.6%) than regional percentages for the US overall [36].

3.2. Nutrition-Disease Knowledge Questions

Each of the seven nutrition-disease knowledge questions and the summary means by the low vs. high score binomial are shown in Table 2 [27,28]. Over 60% of respondents were aware that eating less salt, more fiber, and less red meat protected against heart disease, but 12–27% were not sure of these health messages. About 25% of the respondents erroneously chose cholesterol in the diet rather than saturated fats as a cause of elevated blood cholesterol. Only 44% thought that not eating fruits and vegetables could cause chronic diseases. Recognition of folate or folic acid deficiency as a cause of congenital neural tube defects (NTDs) was known by over 37%, but 35% were unsure of the nutrient deficiency responsible for this condition. Thirty-eight percent of respondents incorrectly thought sugar had more calories than fat (29%), and almost 19% were unsure of which nutrient option had the most calories.

3.3. Demographics, Health Conditions, Desired Benefits from Food

Table 3 displays demographic, health, and food acquisition variables and contrasts by the nutrition-disease knowledge binomial score. Older respondents, women, and smaller households were more likely to be in the higher nutrition-disease knowledge category (all p < 0.001). Those with lower nutrition-disease knowledge were likelier to have children in the household, self-report excellent health, and self-report excellent diet quality (all p < 0.001).
Table 4 displays the frequency distributions for the presence of nutrition-related disease conditions, vitamin use, benefits desired from foods, and nutrients limited or increased by the nutrition-disease knowledge binomial. Respondents who desired digestive health, weight loss or management, or CVD benefits, were trying to limit sugar and saturated fat, and increase protein and fiber were more likely to have higher nutrition-disease knowledge. Respondents with lower nutrition-disease knowledge were likelier to report trying to increase vitamin C.

3.4. Predictors of the Nutrition-Disease Knowledge Score

The nutrition-disease knowledge score is a central factor and the main predictor of food group and nutrient knowledge scores. The initial GLM for its prediction had an R2 value of 0.130 (Table 5). Non-significant variables were removed sequentially in order of the least contribution to the GLM. The most parsimonious model, which retained properties of equal variance and goodness of fit (R2 = 0.133), had seven items. Age, education, seeking CVD benefits, wanting to increase fiber (all p < 0.001), and identifying as a woman (p = 0.014) had positive influences on the nutrition-disease knowledge score. Wanting to limit cholesterol and a high self-reported health negatively influenced nutrition-disease knowledge (both p = 0.001).

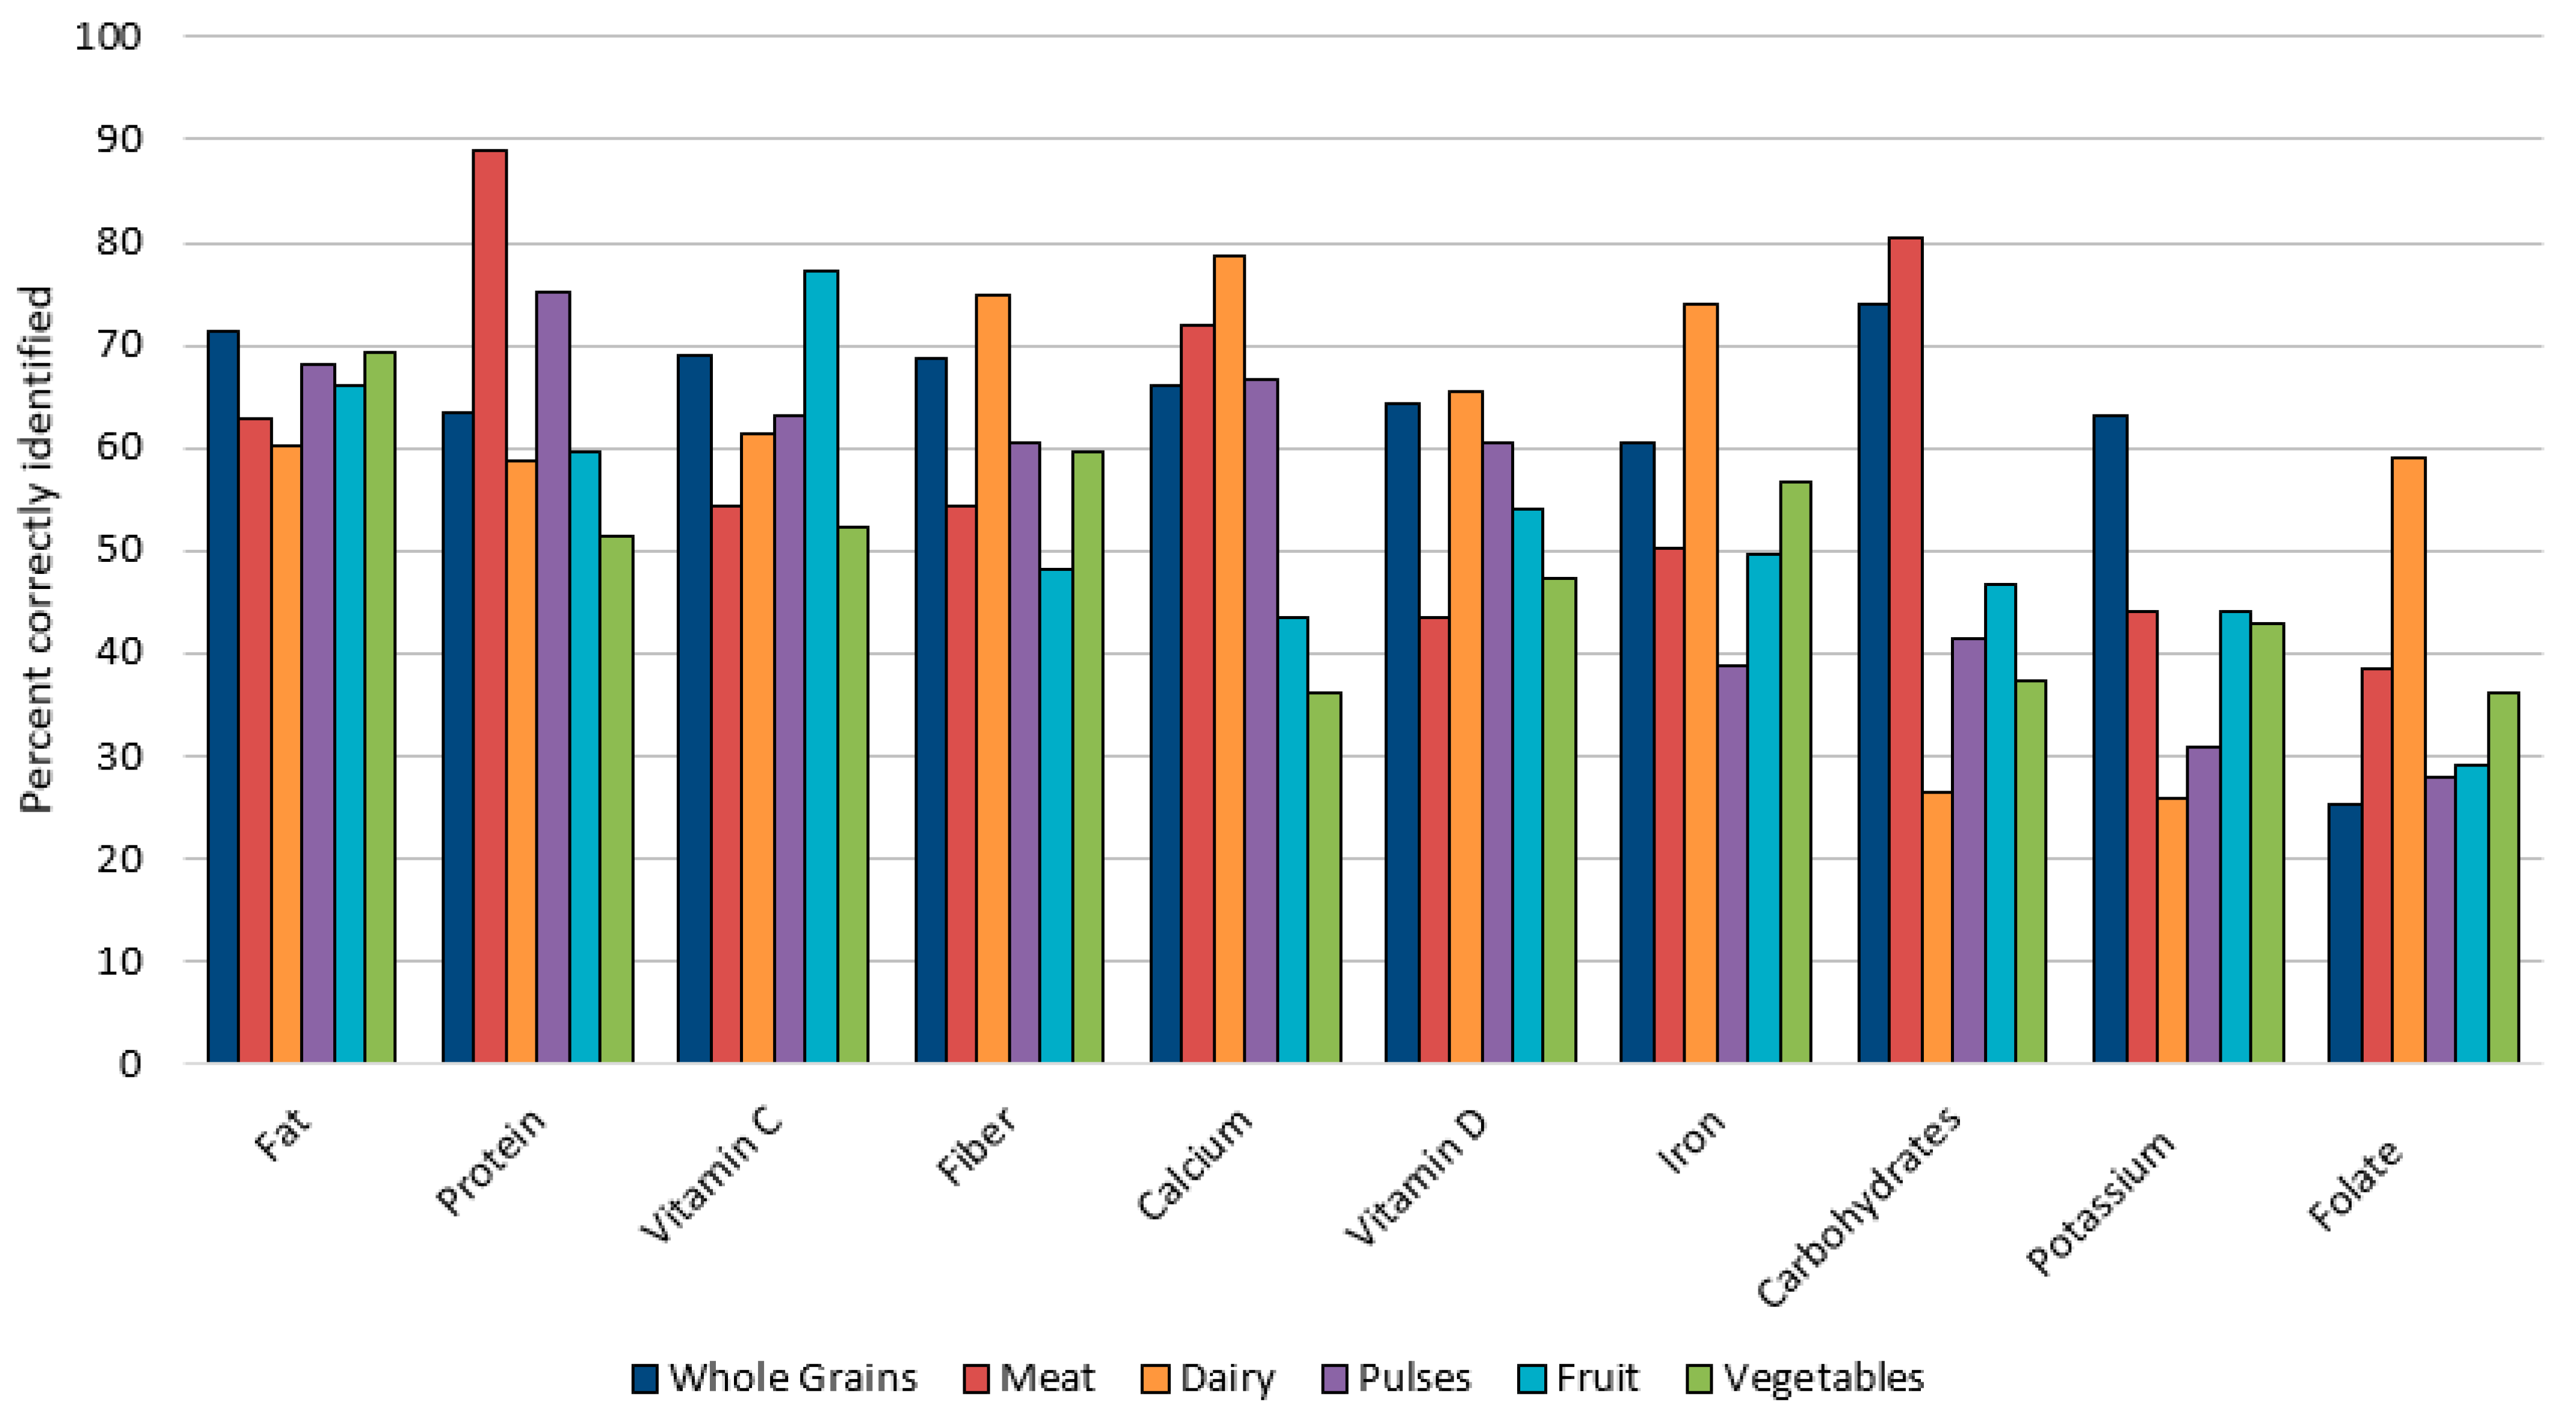
3.5. Food Group Nutrition Knowledge and Nutrient Source Awareness

Figure 1 shows the percentage of respondents correctly identifying the presence or absence of the 10 nutrients across the six food groups. The nutrients are displayed from left to right by the overall percentage identified correctly across the six food groups. The food groups are shown in order of highest average knowledge score for all nutrients.
The mean food group scores were highest for whole grains (6.26 ± 2.5) and lowest for vegetables (4.89 ± 2.3), with the other four food groups ranging between 5.89 and 5.15 (Table 6). The percentage who indicated ‘not sure’ was over 10% for at least five of the 10 nutrients over the six food groups. The percentage who indicated ‘not sure’ was highest for the content of some nutrients in meat (29.8%), fruit (22.7%), and vegetables (19.4%). All food group and nutrient-source mean knowledge scores were significantly different by the nutrient-disease knowledge binomial. Pulses and folate nutrient knowledge were significantly different by presence of a nutrition-related disease (p = 0.001; p < 0.001).
Summaries of the final GLM for the food group scores are presented in Table 7. Nutrition-disease knowledge positively influenced all food group GLMs (p < 0.001), while the effect of other variables differed between food groups. Food group results are described in order of greatest variability explained. The GLM explained 19% (R2 = 0.194) of the pulse nutrient knowledge scores variation. Other significant predictors were a desire to increase fiber, having a nutrition-related disease, being a woman, acting as the main meal preparer, and trying to increase protein. Vegetable nutrient knowledge scores had an R2 value of 0.162, and other significant predictors were education level, increasing fiber, and increasing potassium. A similar pattern emerged for the fruit food group with other predictors of higher education, decreasing sugar, increasing fiber, and being the main meal preparer adding to the R2 value of 0.145. The predictive GLM for dairy (R2 = 0.140) included seeking bone health benefits, identifying as White, and higher self-reported diet quality, all of which positively influenced dairy knowledge. Whole grains (R2 = 0.107) included the positive predictor variables of children in the household and a nutrition-related condition, while increased self-reported health negatively predicted whole grains nutrient knowledge. Lastly, married marital status positively predicted meat knowledge (R2 = 0.077), while older age negatively influenced nutrient-source knowledge for meat.
Table 8 includes the most parsimonious GLMs for predicting knowledge of the sources of macronutrients (carbohydrates, protein, fat, and fiber). Like the food group GLMs, the nutrient-disease knowledge score positively influenced the 10 individual nutrient models (all p < 0.001). The fiber GLM had the largest R2 value (0.271), with predictor variables including a desire for digestive benefits from food, increased age, increasing fiber within the diet, and interest in weight loss management. Other positive predictors for carbohydrate source knowledge (R2 of 0.230) were education level, an interest in weight loss management, identifying as White, and trying to limit carbohydrate intake. Children in the household were negatively associated with food group knowledge of carbohydrate and fiber sources. In the protein GLM (R2 = 0.155), the positive predictor variables were trying to increase protein, higher education, being married, and interest in weight loss management. However, negative predictors were older age, children in the household, and interest in limiting cholesterol. The fat GLM had R2 value of 0.106; besides nutrient-disease knowledge, higher education was a positive predictor. Negative influences on knowledge included having a nutrition-related disease condition, children in the household, and higher self-perceived health status.
Table 9 shows the GLMs for micronutrient knowledge. Nutrient-disease knowledge plays the most significant role for all nutrients (p < 0.001). For the vitamin C model, the second predictor was being a woman, and it had the relatively higher R2 value of 0.183 compared to other nutrients. The folate GLM had a R2 value of 0.121, and its other predictor variables included self-reported diet quality, desire to increase dietary folate, children in the household, a nutrition-related disease condition, and the main meal preparer, all of which positively influenced folate knowledge. The potassium model (R2 = 0.105) included trying to increase potassium, seeking bone health benefits from the diet, higher education, and presence of children in the household, which all positively influenced knowledge. The iron GLM had R2 of 0.081, and other predictor variables included seeking energy benefits from food, higher education, being the main meal preparer, and identifying as White. The vitamin D model (R2 = 0.077) included the two predictor variables of nutrient-disease knowledge and self-reported diet quality. The latter was negatively associated with the vitamin D source knowledge. The calcium model (R2 = 0.047) positive predictor variables were nutrient-disease knowledge and having children in the household. Trying to increase calcium in the diet and older age were negative influences on calcium knowledge scores.

4. Discussion

The study objective was to examine consumer awareness of 10 nutrients in six food groups based on the DGA. We aimed to (1) describe knowledge of nutrient sources and food groups to determine awareness gaps; and (2) determine which factors (demographics, nutrition-disease knowledge, presence of a nutrition-related disease, intentions to increase or decrease a given nutrient, and self-perceptions of health and diet) were predictive of the six food groups and 10 individual nutrient knowledge scores. It was hypothesized that nutrient knowledge would be higher among persons with higher levels of nutrition-disease knowledge and those who are older, have higher education, and express interest in limiting or increasing specific nutrients in their diet.
For the first objective, respondent knowledge was highly variable across food groups and nutrients. Participants had the highest score (63%—6.3 out of 10) for the nutrient content of whole grains. This observation suggests potential success in whole grain nutrition education and marketing. Over two-thirds of participants recognized that whole grains contained carbohydrates and fiber. The USDA School Nutrition Standards require that 80% of grains served in school meals be whole [38]. Parental viewing or engagement with child nutrition programs may be one avenue for their knowledge. A recent systematic review supports this theory, suggesting that institutional lunch interventions with school-aged children positively affect their guardians [39]. However, that does not necessarily mean improved consumption overall, as only 7.9% of adults met the DGA requirement for whole grain intakes in an analysis of National Health and Nutrition Examination Survey (NHANES) data [40].
Nutrient knowledge scores for the meat and dairy food groups were similar to whole grains, at 59%. Over 80% of participants knew meat contained protein and did not have carbohydrates. However, 37% did not realize that meat contained fat. This finding is similar to confusion over animal foods (meat) being a source of cholesterol observed among young adult African Americans [16]. Schupp et al. documented that 84.4% of survey consumers correctly ranked regular ground beef as higher in fat than pork chops or skinless chicken breast [41]. While the current study did not ask about specific types and cuts of meat, over a third of respondents not knowing that meat is a source of fat is concerning. DGA and public health recommendations have emphasized lowering meat intake to reduce chronic disease risk from high fat and greater caloric consumption [1,18,42]. For dairy, about 59–76% knew protein, fat, vitamin D, and calcium were present. This awareness is consistent with messaging about dairy from the DGA and other research [1,4]. However, the low knowledge that dairy products could contain carbohydrates is alarming considering the high prevalence of type 2 diabetes and metabolic syndrome in the US [43,44]. Persons with abnormal glucose metabolism must be aware that fluid milk and many dairy products contain carbohydrate content [45,46].
Food group nutrient knowledge scores were closer to 50% for pulses, fruits, and vegetables. Pulses were recognized for their protein content by 75% of respondents, but fewer recognized their fiber content (61%) compared to whole grains (69%). Most pulses have higher fiber than whole grain products for comparable serving sizes [47]. The vitamin C content of fruits was widely recognized (77%), but knowledge levels of other nutrients were less than 48%. The vegetable knowledge score was the lowest among respondents (49%). Awareness of fiber and iron content in vegetables was only about 50%. The lack of awareness of nutrient density in these food groups suggests campaigns and messaging have been less successful. Education of clients and public health campaigns may focus on particular foods to consume or recommended food patterns rather than specific nutrients in those foods that make them desirable for disease prevention [48]. Results from NHANES data indicate only 10% of US adults meet the recommended intake of 4.5 cups of fruits and vegetables per day [49].
Regarding individual nutrients, knowledge scores were relatively low, with the highest scores of 40% (4/10) for sources of fat and protein. Scores declined from 38% to 21% for the other eight nutrients. The lowest scores were for the identification of carbohydrates, potassium, and folate, with less than half identified correctly. While research is limited on consumer knowledge of carbohydrate sources, it is evident there may be bias against carbohydrates due to fad diets, thus leading to misinformation on the function of this macronutrient [20,50]. Our results suggest a specific misunderstanding of carbohydrate content of dairy, fruit, and vegetables. While we did not compare knowledge levels adjusted by the presence of type 2 diabetes alone, previous studies have suggested individuals with this condition had lower nutrition knowledge [3,51,52]. Siopsis et al. report that while nutrition awareness among persons with type 2 diabetes did not correspond with diet quality, there was a moderate correlation with their self-efficacy score [53]. That study suggests dietary knowledge may enhance the self-efficacy of persons with type 2 diabetes when choosing beneficial foods to consume [53].
Folate, a nutrient of public health concern for women of reproductive age because of its link to fetal neural tube defects, was another nutrient with low food-source knowledge scores. Public health recommendations are “that all persons capable of becoming pregnant get 400 micrograms of folic acid daily” [54]. Other research has shown messaging has successfully increased folic acid supplementation during child-bearing years [54,55]. However, our results indicate individuals lack sufficient knowledge of dietary sources of folate. One recent study examined the relationship between folate and folic acid intake from the diet with overall nutrition knowledge and found that individuals with moderate to high nutrition knowledge were five times more likely to have higher folate consumption [56]. Education programs, especially those focused on at-risk groups such as pregnant women, can also increase folate consumption through food or supplements. However, even after exposure to education campaigns, increased consumption of folate-containing foods or supplements can be variable. Not tailoring the education program to the specific population may account for the variability in adherence to the recommendations [57]. Thus, nutrition knowledge and education on risk factors may increase folate consumption.
Participants had low knowledge of potassium food sources, a shortfall nutrient for many Americans. Potassium is essential for blood pressure regulation, thereby lowering the risk of heart attack and stroke, and critical for bone metabolism, thus reducing the risk of osteoporosis, among other benefits [1]. A previous study of potassium consumption in the US found that intake was lower than recommended amounts [58]. However, prior to 2018, potassium was not required to be present on nutrition facts labels. An analysis of over 6000 labels in 2013 found fewer than 10% provided the potassium content [59]. Since 2018, potassium is required to be on the nutrition facts label, yet public knowledge may still lag due to its previous absence. The emphasis on overall diet patterns in educational campaigns (e.g., Dietary Approaches to Stop Hypertension) may also be responsible for the lack of knowledge of the nutrients in the recommended foods. While campaigns tend to focus on foods to consume more or less of (e.g., eat more fruits and vegetables), they can minimize the reason behind the recommendation (e.g., fruits and vegetables are high in potassium and low in sodium). Therefore, no enhancement of knowledge of food sources of nutrients occurs, even though intake may increase [48].
For our second objective, our study results support both hypotheses that individuals with higher nutrient-disease knowledge and more education had higher food group nutrient and nutrient-source knowledge across all categories. However, when comparing the explained variance of the GLMs across food groups and nutrients, some models, such as those for meat, calcium, vitamin D, and iron explained little of the variation. Since the predictive variables included were theoretically influential in other studies, the model’s weakness may represent a lack of knowledge of these food groups and nutrients. The desire to increase or limit nutrients positively influenced knowledge in most cases. However, there were unexpected conflicts, with reported interest in limiting cholesterol and increasing calcium not being predictive in the respective GLMs for these nutrients. Limited differences in demographic variables such as gender and race were seen when predicting nutrient and food group knowledge, but these variables were antecedents to the nutrition-disease knowledge variable. Women did have higher knowledge of pulse nutrients and vitamin C sources. Identifying as White compared to non-White was predictive of higher dairy, carbohydrate, and iron knowledge. Older age was positively associated with knowledge of certain nutrients such as fiber but primarily was predictive of lower knowledge scores for meat, protein, and calcium. Individuals with a nutrition-related disease had higher knowledge scores for pulses, whole grain, and folate, and lower scores for fat knowledge. Prevention or management of about half of the nutrition-related diseases reported (CVD, type 2 diabetes) is based on monitoring fat intakes. Having a nutrition-related disease lacks significance in the majority of predictive knowledge models. This observation suggests participants may be unable to connect most nutrients and food groups as causes of their chronic diseases [18].
While predictors such as being a woman, higher education, identifying as White, and positive diet modifications agree with previous research, the lack of associations with increasing age, wanting to increase calcium, and wanting to limit cholesterol disagree with earlier studies on nutrition knowledge [8,9,11]. The desire to decrease cholesterol may indicate these individuals are basing dietary recommendations on outdated information. Recommendations that are more recent suggest CVD risk is not significantly correlated with dietary cholesterol, but rather with saturated fat content of the diet [42]. Thus, the limitations on dietary cholesterol have been removed from the DGA [60]. In the current study, age was positively associated with fiber knowledge, which agrees with previous findings [61], suggesting messaging regarding the importance of fiber has been successful. Men and people who identified as non-White had lower nutrient food-source knowledge than shown in other studies with pulses [62]. If greater age, being male, and of non-White ethnic background are negatively associated with knowledge of specific nutrients and food groups, further research is needed. Characterizing perceptions about these items is critical to guide tailored educational interventions to inform people [63]. Some considerations would be cultural, economic, and socially appropriate suggestions or information. If possible, for one-on-one counseling, plans should incorporate intrapersonal-related factors such as taste preferences [63,64].
The GLMs also included variables of interest for respective nutrients. While variables for beneficial diet modifications yielded an overall positive trend for improved nutrient knowledge, a few did not yield significant results or had a negative impact on food source knowledge. Contrary to expectations, respondents who said they were interested in modifying intakes of a particular nutrient were not always knowledgeable of the sources of that nutrient [18,20]. For example, reporting that one was limiting saturated fat and cholesterol intake in the diet was not significantly associated with fat source knowledge. Paradoxically, the desire to increase dietary calcium negatively predicted calcium food-source knowledge. While these results conflicted across various nutrients, it is known that intentions to change diet are not always predictive of behavior or knowledge. One study found that university students who had intentions of eating healthier did not have adequate knowledge of recommendations for their sex and age cohorts. Furthermore, they lacked coping self-efficacy to make these changes regardless of their intentions [65]. Ultimately, while intentions to improve certain nutrients proved to be a positive indicator of nutrition knowledge, our findings support previous work that suggests intentions alone may not be enough without self-efficacy and social support [9,10,15,20].

5. Limitations

While there are many strengths to this study, there are also several limitations. Self-reported data were collected from national survey online panelists. Despite the use of two data reliability checks, and exclusion of other cases with incomplete or nonsensical responses, bias may exist in these data due to social desirability in responses, or self-selection because of interest in the topic. Survey instruments assume participants understand the questions in the survey instrument and answer accurately [64]. Further research should include focus groups or observational studies to reduce response bias for which participants are randomly sampled. Data on several topics relevant to nutrition knowledge were not collected. These include participant’s source of nutrition knowledge, health literacy level, income, dietary intakes, use of food nutrition labels, and knowledge of serving recommendations [8,9,12]. For those with a nutrition-related disease, information on nutrition education and time since diagnosis was not asked. Thus, it is not clear if having a diagnosis of a nutrition-related disease, and subsequent treatment or lifestyle changes to manage the disease result in increased nutrition knowledge.

6. Conclusions

This study provides quantitative evidence of the level of knowledge for food groups, macronutrients, and micronutrients, to aid health promotion and disease prevention across the life cycle. Higher nutrition knowledge for whole grains, fats, protein, and vitamin C was observed compared to other items evaluated. Knowledge was much lower for identification of nutrients in fruits and vegetables, and food group sources of carbohydrates, folate, and potassium. Survey participants showed disconnect between their expressed intention to increase or decrease a nutrient and the sources of that nutrient. Persons with a nutrition-related disease did not consistently appear to have greater nutrition-disease knowledge. Nutrition knowledge alone may not improve health behavior, but it is certainly a limiting factor in decision-making. Public health nutrition professionals, including registered dietitians, should be aware of these omissions in understanding [35,66]. Although lack of knowledge appears wide spread across demographics, potential high priority target groups for nutrition education are men, people who identify as non-White, and those with lower education. Health promotion and nutrition education should include clear information on the nutrients as well as the food groups that consumers or clients need to know to reduce cognitive gaps in knowledge and application [18]. Future research can build upon the information presented in this study through improved theoretical models leading to better predictive measuring.

Author Contributions

Conceptualization, D.M.W., A.M.H., A.A.G. and M.M.H.; methodology, D.M.W., A.A.G. and M.M.H.; formal analysis, D.M.W., A.A.G. and M.C.S.; investigation, D.M.W.; resources, D.M.W.; data curation, D.M.W.; writing—original draft preparation, A.A.G.; writing—review and editing, A.A.G., D.M.W., M.M.H., A.M.H. and M.C.S.; visualization, D.M.W.; supervision, D.M.W.; project administration, D.M.W.; funding acquisition, D.M.W. and M.C.S. All authors have read and agreed to the published version of the manuscript.

Funding

This research was funded by the US Department of Agriculture, Agricultural Research, agreement number 58-3060-0-050, National Consumer Survey of Pulse Consumption and Views, (Pulse Crop Health Initiative), and by the Iowa Agriculture and Home Economics Experiment Station, Ames, Iowa, Project No. IOW05648, W4150 Multistate project—Breeding Phaseolus Beans for Resilience, Sustainable Production, and Enhanced Nutritional Value, sponsored by the Hatch Act and State of Iowa. D.M.W., A.A.G. and M.M.H. received funding support from the US Department of Agriculture, Agricultural Research, award number 2022-51181-38323, Development of Genomic Resources to Accelerate Lima Bean Breeding for Consumer Quality and Agronomic Traits.

Institutional Review Board Statement

The study was conducted in accordance with the Declaration of Helsinki and approved by the Ethics Committee of the Iowa State University (22-353) on 30 May 2023.

Informed Consent Statement

Informed consent was obtained from all subjects involved in this study.

Data Availability Statement

The data presented in this study are available on request from the corresponding author. The data are not publicly available due to privacy restrictions.

Conflicts of Interest

The authors declare no conflicts of interest.

References

  1. United States Department of Agriculture. Dietary Guidelines for Americans 2020–2025. USDA. 2020. Available online: https://www.dietaryguidelines.gov/sites/default/files/2020-12/Dietary_Guidelines_for_Americans_2020-2025.pdf (accessed on 12 October 2023).
  2. Drewnowski, A. Defining nutrient density: Development and validation of the nutrient rich foods index. J. Am. Coll. Nutr. 2009, 28, 421S–426S. [Google Scholar] [CrossRef] [PubMed]
  3. Petroni, M.L.; Brodosi, L.; Marchignoli, F.; Sasdelli, A.S.; Caraceni, P.; Marchesini, G.; Ravaioli, F. Nutrition in Patients with Type 2 Diabetes: Present Knowledge and Remaining Challenges. Nutrients 2021, 13, 2748. [Google Scholar] [CrossRef]
  4. Polzonetti, V.; Pucciarelli, S.; Vincenzetti, S.; Polidori, P. Dietary intake of vitamin D from dairy products reduces the risk of osteoporosis. Nutrients 2020, 12, 1743. [Google Scholar] [CrossRef]
  5. Casas, R.; Castro-Barquero, S.; Estruch, R.; Sacanella, E. Nutrition and Cardiovascular Health. Int. J. Mol. Sci. 2018, 19, 3988. [Google Scholar] [CrossRef] [PubMed]
  6. Rogers, L.M.; Cordero, A.M.; Pfeiffer, C.M.; Hausman, D.B.; Tsang, B.L.; De-Regil, L.M.; Rosenthal, J.; Razzaghi, H.; Wong, E.C.; Weakland, A.P.; et al. Global folate status in women of reproductive age: A systematic review with emphasis on methodological issues. Ann. N. Y. Acad. Sci. 2018, 1431, 35–57. [Google Scholar] [CrossRef]
  7. Leonard, A.J.; Chalmers, K.A.; Collins, C.E.; Patterson, A.J. The effect of nutrition knowledge and dietary iron intake on iron status in young women. Appetite 2014, 81, 225–231. [Google Scholar] [CrossRef]
  8. Spronk, I.; Kullen, C.; Burdon, C.; O’Connor, H. Relationship between nutrition knowledge and dietary intake. Br. J. Nutr. 2014, 111, 1713–1726. [Google Scholar] [CrossRef]
  9. Koch, F.; Hoffmann, I.; Claupein, E. Types of Nutrition Knowledge, Their Socio-Demographic Determinants and Their Association with Food Consumption: Results of the NEMONIT Study. Front. Nutr. 2021, 8, 630014. [Google Scholar] [CrossRef]
  10. Glick, A.A.; Winham, D.M.; Heer, M.M.; Shelley, M.C.; Hutchins, A.M. Health belief model predicts likelihood of eating nutrient-rich foods among US adults. Nutrients 2024, 16, 2335. [Google Scholar] [CrossRef] [PubMed]
  11. Wang, Y.; Chen, X. How much of racial/ethnic disparities in dietary intakes, exercise, and weight status can be explained by nutrition- and health-related psychosocial factors and socioeconomic status among US adults? J. Am. Diet. Assoc. 2011, 111, 1904–1911. [Google Scholar] [CrossRef]
  12. VanKim, N.A.; Erickson, D.J.; Laska, M.N. Food shopping profiles and their association with dietary patterns: A latent class analysis. J. Acad. Nutr. Diet. 2015, 115, 1109–1116. [Google Scholar] [CrossRef]
  13. Dissen, A.R.; Policastro, P.; Quick, V.; Byrd-Bredbenner, C. Interrelationships Among Nutrition Knowledge, Attitudes, Behaviors and Body Satisfaction. Health Educ. 2011, 111, 283–295. [Google Scholar] [CrossRef]
  14. Ruxton, C.H.; Ruani, M.A.; Evans, C.E. Promoting and disseminating consistent and effective nutrition messages: Challenges and opportunities. Proc. Nutr. Soc. 2023, 82, 394–405. [Google Scholar] [CrossRef]
  15. Sapp, S.G.; Weng, C.Y. Examination of the health-belief model to predict the dietary quality and body mass of adults. Int. J. Consum. Stud. 2007, 31, 189–194. [Google Scholar] [CrossRef]
  16. Winham, D.M.; Jones, K.M. Knowledge of young African American adults about heart disease: A cross-sectional survey. BMC Public Health 2011, 11, 248. [Google Scholar] [CrossRef] [PubMed]
  17. Cerullo, G.; Negro, M.; Parimbelli, M.; Pecoraro, M.; Perna, S.; Liguori, G.; Rondanelli, M.; Cena, H.; D’Antona, G. The long history of vitamin C: From prevention of the common cold to potential aid in the treatment of COVID-19. Front. Immunol. 2020, 11, 574029. [Google Scholar] [CrossRef]
  18. Lin, C.T.J.; Yen, S.T. Knowledge of dietary fats among US consumers. J. Am. Diet. Assoc. 2010, 110, 613–618. [Google Scholar] [CrossRef]
  19. Quagliani, D.; Felt-Gunderson, P. Closing America’s Fiber Intake Gap. Am. J. Lifestyle Med. 2016, 11, 80–85. [Google Scholar] [CrossRef]
  20. Collins, C.B.; Winham, D.M.; Hutchins, A.M. Dietary intakes, attitudes toward carbohydrates of postmenopausal women following low carbohydrate diets. Can. J. Diet. Pract. Res. 2009, 70, 44–47. [Google Scholar] [CrossRef]
  21. Palmer, S.M.; Knoblauch, S.T.; Winham, D.M.; Hiller, M.B.; Shelley, M.C. Putting knowledge into practice: Low-income women talk about food choice decisions. Int. J. Environ. Res. Public Health 2020, 17, 5092. [Google Scholar] [CrossRef] [PubMed]
  22. Greszki, R.; Meyer, M.; Schoen, H. Exploring the effects of removing “too fast” responses and respondents from web surveys. Public Opin. Q. 2015, 79, 471–503. [Google Scholar] [CrossRef]
  23. Lin, C.T.; Zhang, Y.; Carlton, E.; Lo, S. 2014 FDA Health and Diet Survey Center for Food Safety and Applied Nutrition Food and Drug Administration. 2016. Available online: https://downloads.regulations.gov/FDA-2004-N-0258-0161/content.pdf (accessed on 20 October 2023).
  24. Green, S.H.; Glanz, K. Development of the Perceived Nutrition Environment Measures survey. Am. J. Prev. Med. 2015, 49, 50–61. [Google Scholar] [CrossRef] [PubMed]
  25. Townsend, M.S.; Kaiser, L.L. Development of a Tool to Assess Psychosocial Indicators of Fruit and Vegetable Intake for 2 Federal Programs. J. Nutr. Educ. Behav. 2005, 37, 170–184. [Google Scholar] [CrossRef]
  26. Lando, A.; Verrill, L.; Wu, F. FSANS FDA’s Food Safety and Nutrition Survey 2019 Survey. 2021. Available online: https://www.fda.gov/media/146532/download?attachment (accessed on 4 March 2024).
  27. International Food Information Council Foundation (IFIC). 2023 Food and Health Survey. Available online: https://foodinsight.org/2023-food-and-health-survey/ (accessed on 4 March 2024).
  28. Jones, A.M.; Lamp, C.; Neelon, M.; Nicholson, Y.; Schneider, C.; Swanson, P.W.; Zidenberg-Cherr, S. Reliability and validity of nutrition knowledge questionnaire for adults. J. Nutr. Educ. Behav. 2015, 47, 69–74. [Google Scholar] [CrossRef]
  29. Food Labeling, 21 CFR §101. 2024. Available online: https://www.ecfr.gov/current/title-21/chapter-I/subchapter-B/part-101 (accessed on 20 October 2023).
  30. Carb Choices. Centers for Disease Control. Available online: https://www.cdc.gov/diabetes/healthy-eating/carbohydrate-lists-starchy-foods.html (accessed on 24 September 2023).
  31. United States Department of Agriculture, Food Data Central. Available online: https://fdc.nal.usda.gov/ (accessed on 20 October 2023).
  32. United States Department of Health & Human Services. National Institutes of Health. Office of Dietary Supplements. Dietary Supplement Fact Sheets. Available online: https://ods.od.nih.gov/factsheets/list-all/ (accessed on 20 October 2023).
  33. IBM. GLM Model. SPSS Statistics. 30 September 2024. Available online: https://www.ibm.com/docs/en/spss-statistics/saas?topic=analysis-glm-model (accessed on 21 January 2025).
  34. Laerd Statistics. Ordinal Logistic Regression Using SPSS Statistics. Statistical Tutorials and Software Guides. 2015. Available online: https://statistics.laerd.com/ (accessed on 10 October 2024).
  35. Winham, D.M.; Hutchins, A.M.; Thompson, S.V.; Dougherty, M.K. Arizona registered dietitians show gaps in knowledge of bean health benefits. Nutrients 2018, 10, 52. [Google Scholar] [CrossRef]
  36. US Census Bureau. Quick Facts. Population Estimates 1 July 2023. Available online: http://www.census.gov/quickfacts/fact/table/US/PST045222 (accessed on 12 November 2023).
  37. Kaiser Family Foundation. State Health Facts. Available online: https://www.kff.org/other/state-indicator/distribution-by-age/?currentTimeframe=0&sortModel=%7B%22colId%22:%22Location%22,%22sort%22:%22asc%22%7D (accessed on 29 June 2024).
  38. Food and Nutrition Service. US Department of Agriculture. Available online: http://www.fns.usda.gov/cn/school-nutrition-standards-updates/whole-grains (accessed on 24 November 2024).
  39. Abderbwih, E.; Mahanani, M.R.; Deckert, A.; Antia, K.; Agbaria, N.; Dambach, P.; Kohler, S.; Horstick, O.; Winkler, V.; Wendt, A.S. The Impact of School-Based Nutrition Interventions on Parents and Other Family Members: A Systematic Literature Review. Nutrients 2022, 14, 2399. [Google Scholar] [CrossRef] [PubMed]
  40. Albertson, A.M.; Reicks, M.; Joshi, N.; Gugger, C.K. Whole grain consumption trends and associations with body weight measures in the United States: Results from the cross sectional National Health and Nutrition Examination Survey 2001–2012. Nutr. J. 2016, 15, 8. [Google Scholar] [CrossRef]
  41. Schupp, A.R.; Downer, R.; Gillespie, J.M.; Reed, D. Consumer Knowledge of Selected Nutrient Content of Nine Fresh Meat Cuts. J. Agribus. 1999, 17, 161–168. [Google Scholar] [CrossRef]
  42. Kennedy, J.; Alexander, P.; Taillie, L.S.; Jaacks, L.M. Estimated effects of reductions in processed meat consumption and unprocessed red meat consumption on occurrences of type 2 diabetes, cardiovascular disease, colorectal cancer, and mortality in the USA: A microsimulation study. Lancet Planet. Health 2024, 8, e441–e451. [Google Scholar] [CrossRef] [PubMed]
  43. Liang, X.; Or, B.; Tsoi, M.F.; Cheung, C.L.; Cheung, B.M. Prevalence of metabolic syndrome in the United States National Health and Nutrition Examination Survey 2011–2018. Postgrad. Med. J. 2023, 99, 985–992. [Google Scholar] [CrossRef] [PubMed]
  44. Wang, L.; Li, X.; Wang, Z.; Bancks, M.P.; Carnethon, M.R.; Greenland, P.; Feng, Y.Q.; Wang, H.; Zhong, V.W. Trends in prevalence of diabetes and control of risk factors in diabetes among US adults, 1999–2018. Jama 2021, 326, 704–716. [Google Scholar] [CrossRef] [PubMed]
  45. Han, C.Y.; Chan, C.G.B.; Lim, S.L.; Zheng, X.; Woon, Z.W.; Chan, Y.T.; Bhaskaran, K.; Tan, K.F.; Mangaikarasu, K.; Chong, M.F.-F. Diabetes-related nutrition knowledge and dietary adherence in patients with type 2 diabetes mellitus: A mixed-methods exploratory study. Proc. Singapore Healthc. 2020, 29, 81–90. [Google Scholar] [CrossRef]
  46. Breen, C.; Ryan, M.; Gibney, M.J.; O’Shea, D. Diabetes-related nutrition knowledge and dietary intake among adults with type 2 diabetes. Br. J. Nutr. 2015, 114, 439–447. [Google Scholar] [CrossRef] [PubMed]
  47. Rebello, C.J.; Greenway, F.L.; Finley, J.W. Whole grains and pulses: A comparison of the nutritional and health benefits. J. Agric. Food Chem. 2014, 62, 7029–7049. [Google Scholar] [CrossRef] [PubMed]
  48. Jones, L.M.; Moss, K.O.; Mitchell, J.; Still, C.; Hawkins, J.; Tang, E.; Wright, K.D. Challenges to dietary hypertension self-management as described by a sample of African American older adults. Worldviews Evid.-Based Nurs. 2022, 19, 64–72. [Google Scholar] [CrossRef]
  49. Bowman, S.A. Dietary Data Brief No. 46. Impact of Fruit and Vegetable Intakes on Food and Nutrient Intakes of Adults: What We Eat in America, NHANES 2017–2018. 2022 Oct. In FSRG Dietary Data Briefs [Internet]; United States Department of Agriculture (USDA): Beltsville, MD, USA, 2010. Available online: https://www.ncbi.nlm.nih.gov/books/NBK588577/ (accessed on 10 February 2025).
  50. Rounsefell, K.; Gibson, S.; McLean, S.; Blair, M.; Molenaar, A.; Brennan, L.; Truby, H.; McCaffrey, T.A. Social media, body image and food choices in healthy young adults: A mixed methods systematic review. Nutr. Diet. 2020, 77, 19–40. [Google Scholar] [CrossRef]
  51. Kowall, B.; Rathmann, W.; Stang, A.; Bongaerts, B.; Kuss, O.; Herder, C.; Roden, M.; Quante, A.; Holle, R.; Huth, C.; et al. Perceived risk of diabetes seriously underestimates actual diabetes risk: The KORA FF4 study. PLoS ONE 2017, 12, e0171152. [Google Scholar] [CrossRef] [PubMed]
  52. Wang, C.; O’Neill, S.M.; Rothrock, N.; Gramling, R.; Sen, A.; Acheson, L.S.; Rubinstein, W.S.; Nease, D.E., Jr.; Ruffin, I.V.M.T. Comparison of risk perceptions and beliefs across common chronic diseases. Prev. Med. 2009, 48, 197–202. [Google Scholar] [CrossRef]
  53. Siopis, G.; Colagiuri, S.; Allman-Farinelli, M. People with type 2 diabetes report dietitians, social support, and health literacy facilitate their dietary change. J. Nutr. Educ. Behav. 2021, 53, 43–53. [Google Scholar] [CrossRef] [PubMed]
  54. Rofail, D.; Colligs, A.; Abetz, L.; Lindemann, M.; Maguire, L. Factors contributing to the success of folic acid public health campaigns. J. Public Health 2012, 34, 90–99. [Google Scholar] [CrossRef] [PubMed]
  55. Centers for Disease Control and Prevention. Improving Folic Acid Intake. Folic Acid. Published 17 May 2024. Available online: https://www.cdc.gov/folic-acid/health-equity/index.html (accessed on 24 November 2024).
  56. Sicinska, E.; Kubiak, K.; Madej, D.; Granda, D.; Kaluza, J. Main sources and predictive factors of folate intake in female university students. Nutrition 2024, 120, 112359. [Google Scholar] [CrossRef]
  57. Feyisa, J.W.; Siu, J.Y.M.; Bai, X. Effectiveness of Health Education Interventions in Enhancing Iron-Folic Acid Supplement Utilization Among Pregnant Women: Systematic Review and Meta-analysis. Nutr. Rev. 2024, nuae196. [Google Scholar] [CrossRef] [PubMed]
  58. Cogswell, M.E.; Zhang, Z.; Carriquiry, A.L.; Gunn, J.P.; Kuklina, E.V.; Saydah, S.H.; Yang, Q.; Moshfegh, A.J. Sodium and potassium intakes among US adults: NHANES 2003–2008. Am. J. Clin. Nutr. 2012, 96, 647–657. [Google Scholar] [CrossRef] [PubMed]
  59. Curtis, C.J.; Niederman, S.A.; Kansagra, S.M. Availability of potassium on the Nutrition Facts panel of US packaged foods. JAMA Intern. Med. 2013, 173, 828–829. [Google Scholar] [CrossRef]
  60. Johnson, S.A.; Kirkpatrick, C.F.; Miller, N.H.; Carson, J.A.S.; Handu, D.; Moloney, L. Saturated fat intake and the prevention and management of cardiovascular disease in adults: An Academy of Nutrition and Dietetics evidence-based nutrition practice guideline. J. Acad. Nutr. Diet. 2023, 123, 1808–1830. [Google Scholar] [CrossRef] [PubMed]
  61. Gustafson, C.R.; Rose, D.J. US Consumer Identification of the Health Benefits of Dietary Fiber and Consideration of Fiber When Making Food Choices. Nutrients 2022, 14, 2341. [Google Scholar] [CrossRef]
  62. Heer, M.M.; Winham, D.M. Food behaviors, health, and bean nutrition awareness among low-income men: A pilot study. Int. J. Environ. Res. Public Health 2020, 17, 1039. [Google Scholar] [CrossRef] [PubMed]
  63. Winham, D.M. Culturally tailored foods and cardiovascular disease prevention. Am. J. Lifestyle Med. 2009, 3 (Suppl. S1), 64S–68S. [Google Scholar] [CrossRef]
  64. McLeod, M.R.; Chionis, L.; Gregg, B.; Gianchandani, R.; Wolfson, J.A. Knowledge and attitudes of lower Michigan primary care physicians towards dietary interventions: A cross-sectional survey. Prev. Med. Rep. 2022, 27, 101793. [Google Scholar] [CrossRef] [PubMed]
  65. Matthews, J.I.; Doerr, L.; Dworatzek, P.D.N. University Students Intend to Eat Better but Lack Coping Self-Efficacy and Knowledge of Dietary Recommendations. J. Nutr. Educ. Behav. 2016, 48, 12–19.e1. [Google Scholar] [CrossRef] [PubMed]
  66. Alhuthali, H.M.; Alzahrani, H.A.; Ataya, E.F.; Almehmadi, M.; Alsaiari, A.A.; Alrehaili, A.A.; Bakhuraysah, M.M.; Alsaeedi, F.A.; Alsalmi, O.; Altalhi, W.; et al. Enhancing knowledge and practices toward Vitamin D deficiency through implementing awareness programs among medical science female students. Eur. J. Inflamm. 2023, 21, 1721727X231223365. [Google Scholar] [CrossRef]
Figure 1. Percentage of adults correctly identifying the presence or absence of 10 nutrients across six food groups.
Foods 14 00606 g001
Table 1. Variables used in general linear models for food group and nutrient knowledge scores.
Variables Included in All Food Group and Nutrient General Linear Models
Continuous Age, nutrition-disease knowledge score, years of education, self-reported health status, self-reported dietary quality
Binomial Gender, children in household, race, nutrition-related disease condition, marital status, vitamin use, main shopper, main food preparer
Food Group and Nutrient Additional Variables:
PulsesIncreasing fiber, folate, protein, seeking diabetes management and cardiovascular disease (CVD) benefits
Whole GrainsIncreasing fiber and seeking digestive health benefits
FruitIncreasing fiber, folate, vitamin C, potassium, decreasing sugar and carbohydrates
VegetablesIncreasing, fiber, folate, vitamin C, potassium, and iron
DairyIncreasing vitamin D, calcium, and seeking bone health benefits
MeatIncreasing protein and decreasing saturated fat and cholesterol
CarbohydratesWeight loss management, diabetes management, limiting carbohydrates, and limiting sugar
FatWeight loss management, diabetes management, limiting carbohydrates, limiting cholesterol, limiting saturated fat, and increasing protein
ProteinWeight loss management, diabetes management, limiting cholesterol, limiting saturated fat, and limiting calories
FiberWeight loss management, diabetes management, increasing fiber, seeking CVD benefits, and digestive benefits
IronIncreasing iron and seeking energy benefits
CalciumIncreasing calcium and seeking bone health benefits
Vitamin CIncreasing vitamin C
FolateIncreasing folate
Vitamin DIncreasing vitamin D and seeking bone health benefits
PotassiumIncreasing potassium and seeking bone health benefits
Table 2. Responses to nutrition-disease questions by binomial nutrition-disease knowledge score among US adults aged 18–80 years.
Total
(n = 930)
Nutrition-Disease knowledge Score 0–3
(47.5%; 442)
Nutrition-Disease Knowledge Score 4–7
(52.5%; 488)
p
Foods 14 00606 i001 % Foods 14 00606 i002
Eating less salt protects against heart disease
Yes—Correct
No
Not sure

79.1
8.2
12.7

64.9 a
13.8 a
21.3 a

92.0 b
3.1 b
4.9 b
<0.001
Eating more fiber protects against heart disease
Yes—Correct
No
Not sure

63.7
8.7
27.6

43.7 a
14.7 a
41.6 a

81.8 b
3.3 b
15.0 b
<0.001
Eating more meat protects against heart disease
No—Correct
Yes
Not sure

60.6
19.2
20.1

33.7 a
32.6 a
33.7 a

85.0 b
7.2 b
7.8 b
<0.001
Item in foods that raises blood cholesterol level
Saturated fats—Correct
Cholesterol in the diet
Polyunsaturated fats
Antioxidants
Not sure

46.2
24.6
14.8
4.8
9.5

21.3 a
34.8 a
18.8 a
8.4 a
16.7 a

68.9 b
15.4 b
11.3 b
1.6 b
2.9 b
<0.001
Not eating fruits/vegetables can cause disease
True—Correct
False

43.9
56.1

23.5 a
76.5 a

62.3 b
37.7 b
<0.001
Nutrient that helps prevent neural tube defects
Folic acid or folate—Correct
Iron
Vitamin A
Vitamin D
Not sure

37.3
9.1
9.1
8.7
35.7

16.3 a
13.3 a
15.1 a
13.8 a
41.5 a

56.4 b
5.5 b
3.7 b
4.1 b
30.3 b
<0.001
Item that has the most calories
1 g of fat—Correct
1 g of sugar
1 g of protein
1 g of fiber
Not sure

29.0
38.3
8.9
4.8
18.9

14.0 a
39.4 a
14.3 a
8.6 a
23.8 a

42.6 b
37.3 a
4.1 b
1.4 b
14.5 b
<0.001
Summary score ( x ¯ ± SD)3.61 ± 1.62.19 ± 0.94.90 ± 0.9<0.001
Same subscript letters (a, b) indicate column proportions that are not significantly different. The p-value is derived from chi-square analysis.
Table 3. Demographic characteristics and perceptions of health and diet status of US adults aged 18–80 by binomial nutrition-disease knowledge score.
Total
(n = 930)
Nutrition-Disease Knowledge Score 0–3
(47.5%; 442)
Nutrition-Disease Knowledge Score 4–7
(52.5%; 488)
p
Foods 14 00606 i003 mean ± standard deviation Foods 14 00606 i004
Age in years 45.1 ± 14.441.8 ± 13.648.1 ± 14.4<0.001
Total household size3.1 ± 1.4 3.4 ± 1.32.9 ± 1.30.001
Foods 14 00606 i005 % Foods 14 00606 i006
Gender
Men
Women

48.7
51.3

54.5 a
45.5 a

43.4 b
56.6 b
<0.001
Marital Status
Single/Divorced/Widowed
Married/Living w/partner

28.6
70.4

29.6
70.4

27.7
72.3
1 n.s.
Children in household
No children
One child+ in household

49.2
50.8

41.4 a
58.6 a

56.4 b
43.6 b
<0.001
Race/Ethnicity
Other
White

23.2
76.8

25.8
74.2

20.9
79.1
n.s.
Years of Education
9–12th grade and/or GED
Some college, no degree
Associates degree, Tech school
Bachelor’s degree
Masters, Doctoral, Professional degree

14.5
13.7
13.8
32.5
25.5

17.0
12.2
12.4
32.8
25.6

12.3
15.2
15.0
32.2
25.4
n.s.
Self-reported health
Poor–Fair
Good
Very good
Excellent

17.1
42.7
28.9
11.3

15.6 a
41.2 a
26.9 a
16.3 a

18.4 a
44.1 a
30.7 a
6.8 b
<0.001
Self-reported diet quality
Poor–Fair
Good
Very good
Excellent

21.1
42.2
26.1
10.6

19.5 a
39.1 a
25.3 a
16.1 a

22.5 a
44.9 a
26.8 a
5.7 b
<0.001
Vitamin and/or supplement use
No
Yes

23.5
76.5

23.1
76.9

24.0
76.0
n.s.
Main food shopper
No
Yes

25.7
74.3

26.5
73.5

25.0
75.0
n.s.
Main food preparer
No
Yes

42.8
57.2

43.4
56.6

42.2
57.8
n.s.
1 n.s. = not significant; Same subscript letters (a, b) indicate column proportions that are not significantly different. The p-value is derived from chi-square analysis.
Table 4. Nutrition-related disease conditions, desired health benefits of foods, and types of nutrient intakes altered by low vs. high nutrition-disease knowledge among adults aged (18–80) (n = 930).
TotalNutrition-Disease Knowledge 0–3
(47.5%; 442)
Nutrition-Disease Knowledge 4–7
(52.5%; 488)
p
Foods 14 00606 i007 % Foods 14 00606 i008
Binomial nutrition-related disease presence
No
Yes

44.4
55.6

45.5
54.5

43.4
56.6
1 n.s.
Nutrition-related disease conditions
High blood pressure
High cholesterol
Diabetes
Gastrointestinal disorder
Heart disease

29.8
25.4
17.7
14.7
6.5

28.3
25.3
19.7
10.2 a
7.9

31.1
25.4
16.0
18.9 b
5.1

n.s.
n.s.
n.s.
<0.001
n.s.
Health benefits wanted from foods
Weight loss or management
Digestive or gut health
Heart/cardiovascular health
Bone health
Diabetes or blood sugar management
None of these

49.4
49.9
40.3
35.3
24.7
9.8

45.9 a
41.2 a
33.3 a
36.0
21.9
12.7 a

52.5 b
57.8 b
46.7 b
34.6
27.3
7.2 b

0.049
<0.001
<0.001
n.s.
n.s.
0.006
Trying to limit or eat less nutrients
Sugar
Carbohydrates
Sodium
Saturated fat
Calories
Cholesterol
No, not limiting any nutrients

54.9
37.2
36.5
32.2
34.1
31.9
13.8

45.9 a
37.3
33.7
28.3 a
34.6
33.9
14.3

63.1 b
37.1
38.9
35.7 b
33.6
30.1
13.3

<0.001
n.s.
n.s.
0.017
n.s.
n.s.
n.s.
Trying to eat more nutrients
Protein
Fiber
Vitamin D
Vitamin C
Calcium
Iron
Potassium
Folate
No, not increasing any nutrients

45.5
40.8
42.5
39.2
29.7
25.9
19.7
13.0
16.9

38.5 a
31.9 a
43.7
42.8 a
30.5
27.8
19.5
12.0
18.7

51.8 b
48.8 b
41.4
36.1 b
28.9
24.2
19.9
13.9
15.2

<0.001
<0.001
n.s.
0.037
n.s.
n.s.
n.s.
n.s.
n.s.
1 n.s. = not significant. Same subscript letters (a, b) indicate column proportions that are not significantly different. The p-value is derived from chi-square analysis.
Table 5. Parameter estimates of a general linear model: measuring the strength of predictor variables on nutrition-disease knowledge (n = 930).
VariableBeta (p-Value)Partial Eta SquaredObserved Power
Age0.023 (<0.001)0.045>0.999
Education0.162 (<0.001)0.0200.991
Seeking cardiovascular disease benefits0.490 (<0.001)0.0220.996
Increasing fiber0.494 (<0.001)0.0230.997
Limiting cholesterol−0.364 (0.001)0.0110.904
Self-reported health status −0.181 (0.001)0.0110.893
Gender (woman)0.249 (0.014)0.0060.689
Model adjusted R2 = 0.133, F value = 21.362, partial eta squared = 0.103, observed power > 0.999, and general linear model p-value < 0.001.
Table 6. Percentage of adults aged 18–80 who correctly identified or were not sure of the presence or absence of 10 nutrients in six food groups with mean scores for correct placement (n = 930).
Whole GrainsMeatDairyPulsesFruitVegetablesNutrient-Source Score
x ¯ ± SD
FAT 3.98 ± 1.51
Nutrient source NoYesYesNoNoNo
% Correct71.362.760.268.166.069.2
% Not sure7.73.12.79.122.719.4
PROTEIN 3.97 ± 1.42
Nutrient sourceNoYesYesYesNoNo
% Correct63.588.958.875.159.651.4
% Not sure7.73.12.79.122.719.4
VITAMIN C 3.78 ± 1.57
Nutrient sourceNoNoNoNoYesYes
% Correct68.954.461.563.277.352.4
% Not sure16.229.816.020.37.212.2
FIBER 3.66 ± 1.70
Nutrient sourceYesNoNoYesYesYes
% Correct68.654.374.860.548.159.6
% Not sure16.229.816.020.37.212.2
CALCIUM 3.63 ± 1.46
Nutrient sourceNoNoYesNoNoNo
% Correct66.271.978.866.643.536.1
% Not sure7.73.12.79.122.719.4
VITAMIN D 3.35 ± 1.61
Nutrient sourceNoNoYesNoNoNo
% Correct64.443.565.460.653.947.3
% Not sure16.229.816.020.37.212.2
IRON 3.30 ± 1.25
Nutrient sourceNoYesNoYesNoYes
% Correct 60.650.374.038.849.756.6
% Not sure 7.73.12.79.122.719.4
CARBOHYDRATES 3.06 ± 1.58
Nutrient sourceYesNoYesYesYesYes
% Correct73.980.326.541.446.737.3
% Not sure 7.73.12.79.122.719.4
POTASSIUM 2.50 ± 1.38
Nutrient sourceNoNoYesYesYesYes
% Correct63.044.025.830.844.142.9
% Not sure16.229.816.020.37.212.2
FOLATE 2.16 ± 1.37
Nutrient sourceYesNoNoYesYesYes
% Correct25.238.658.927.829.136.1
% Not sure16.229.816.020.37.212.2
FOOD GROUP SCORE
x ¯ ± SD
6.26 ± 2.515.89 ± 2.265.85 ± 2.155.33 ± 2.305.15 ± 2.514.89 ± 2.30
Table 7. Parameter estimates of a general linear model: measuring the strength of predictor variables on food group nutrient knowledge (n = 930).
Nutrient Knowledge ScoreBeta (p Value)Partial Eta SquaredObserved PowerAdjusted R2
PULSES 0.194
          Nutrition-Disease Knowledge0.479 (<0.001)0.119>0.999
          Increasing Fiber0.575 (<0.001)0.0160.974
          Nutrition-Related Condition0.415 (0.003)0.0100.852
          Gender0.388 (0.005)0.0080.796
          Main Meal Preparer0.344 (0.014) 0.0070.691
          Increasing Protein0.309 (0.031)0.0050.580
VEGETABLES
          Nutrition-Disease Knowledge0.452 (<0.001)0.104>0.9990.162
          Education0.235 (<0.001)0.0230.997
          Increasing Fiber0.505 (0.001)0.0130.932
          Increasing Potassium0.447 (0.012)0.0070.713
FRUIT
          Nutrition-Disease Knowledge0.490 (<0.001)0.099>0.9990.145
          Education0.154 (0.006)0.0080.789
          Trying to limit sugar0.387 (0.015)0.0060.686
          Trying to increase fiber0.388 (0.016)0.0060.673
          Main meal preparer0.325 (0.03600.0050.557
DAIRY
          Nutrition-Disease Knowledge0.432 (<0.001)0.110>0.9990.140
          Seeking Bone Health Benefits0.519 (<0.001)0.0150.960
          Race/Ethnicity0.579 (<0.001)0.0150.961
          Self-Reported Diet Quality0.149 (0.034)0.0050.563
WHOLE GRAINS
          Nutrition-Disease Knowledge0.440 (<0.001)0.081>0.9990.102
          Has Children in the Household0.387 (0.015)0.0060.681
          Nutrition-Related Disease 0.373 (0.018)0.0060.654
          Self-reported health status−0.197 (0.023)0.0060.624
MEAT
          Nutrition-Disease Knowledge0.392 (<0.001)0.075>0.9990.077
          Age−0.014 (0.005)0.0080.796
          Marital status0.392 (0.013)0.0070.698
The p-value is derived from comparison of the computed F statistic to the F-distribution under the null hypothesis.
Table 8. Parameter estimates of a general linear model: measuring the strength of predictor variables on food group macronutrient knowledge (n = 930).
Food Group Macronutrient Knowledge ScoreBeta (p Value)Partial Eta SquaredObserved PowerAdjusted R2
FIBER 0.271
          Nutrition-disease knowledge0.410 (<0.001)0.158>0.999
          Digestive benefits0.359 (<0.001)0.0140.948
          Age0.011 (0.002)0.0110.882
          Increasing fiber0.326 (0.001)0.0110.892
          Interested in weight loss 0.271 (0.005)0.0080.794
          Children in the household−0.255 (0.012)0.0070.713
CARBOHYDRATES 0.230
          Nutrition-disease knowledge0.352 (<0.001)0.140>0.999
          Education0.139 (<0.001)0.0180.984
          Interested in weight loss 0.385 (<0.001)0.0180.983
          Race0.437 (<0.001)0.0170.980
          Children in the household−0.352 (<0.001)0.0150.966
          Eating fewer carbohydrates 0.261 (0.008)0.0080.759
PROTEIN 0.155
          Nutrition-disease knowledge0.274 (<0.001)0.095>0.999
          Age−0.12 (<0.001)0.0140.951
          Trying to increase protein0.342 (<0.001)0.0160.970
          Children in the household−0.318 (0.001)0.0110.895
          Education0.101 (0.002)0.0100.876
          Limiting cholesterol−0.221 (0.020)0.0060.641
          Marital status (married)0.233 (0.026)0.0050.603
          Interested in weight loss 0.174 (0.046)0.0040.514
FAT 0.106
          Nutrition-disease knowledge0.263 (<0.001)0.079>0.999
          Education0.088 (0.014)0.0060.689
          Nutrition-related disease −0.226 (0.018)0.0060.661
          Children in the household−0.189 (0.049)0.0040.505
          Self-reported health status−0.104 (0.053)0.0040.490
          Interested in weight loss 0.153 (0.105)0.0030.368
The p-value is derived from comparison of the computed F statistic to the F-distribution under the null hypothesis.
Table 9. Parameter estimates of a general linear model: measuring the strength of predictor variables on food group micronutrient knowledge (n = 930).
Food Group Micronutrient Knowledge ScoreBeta (p Value)Partial Eta SquaredObserved PowerAdjusted R2
VITAMIN C0.183
          Nutrition-disease knowledge0.399 (<0.001)0.171>0.999
          Gender0.249 (<0.001)0.0080.754
FOLATE0.121
          Nutrition-disease knowledge0.207 (<0.001)0.063>0.999
          Self-reported Diet Quality0.174 (<0.001)0.0150.966
          Trying to increase Folate0.508 (<0.001)0.0170.977
          Children in the Household0.260 (0.001)0.0100.847
          Nutrition Related Condition0.229 (0.002)0.0080.759
          Main Meal Preparer0.200 (0.020)0.0060.631
POTASSIUM0.105
          Nutrition-disease knowledge0.219 (<0.001)0.067>0.999
          Increasing Potassium0.417 (<0.001)0.0160.968
          Seeking Bone Health Benefits0.267 (0.003)0.0090.833
          Education0.082 (0.010)0.0070.734
          Children in the Household0.189 (0.030)0.0050.581
IRON0.081
          Nutrition-disease knowledge0.178 (<0.001)0.053 >0.999
          Seeking Energy Benefits0.226 (0.005)0.0090.804
          Education0.061 (0.035)0.0050.560
          Main Meal Preparer0.154 (0.054)0.0040.486
          Race (White)0.181 (0.055)0.0040.458
VITAMIN D0.077
          Nutrition-disease knowledge0.265 (<0.001)0.072>0.999
          Self-reported Diet Quality −0.115 (0.031)0.0050.577
CALCIUM0.047
          Nutrition-disease knowledge0.123 (<0.001)0.0180.985
          Increasing Calcium−0.384 (<0.001)0.0150.959
          Children in the Household0.343 (<0.001)0.0130.931
          Age−0.008 (0.021)0.0060.636
The p-value is derived from comparison of the computed F statistic to the F-distribution under the null hypothesis.
Disclaimer/Publisher’s Note: The statements, opinions and data contained in all publications are solely those of the individual author(s) and contributor(s) and not of MDPI and/or the editor(s). MDPI and/or the editor(s) disclaim responsibility for any injury to people or property resulting from any ideas, methods, instructions or products referred to in the content.

