
Characterization of Key Aroma Compounds in Dongpo Pork Dish and Their Dynamic Changes During Storage
 , and
, and
Abstract
:1. Introduction
2. Materials and Methods
2.1. Sample Preparation
2.2. Quantitative Descriptive Sensory Analysis
2.3. GC×GC-MS Analysis
2.4. OAV Analysis
2.5. GC-O-MS Analysis
2.6. Aroma Recombination and Omission Tests
2.7. Storage Experiments of DPD
2.8. Statistical Analysis
3. Results and Discussion
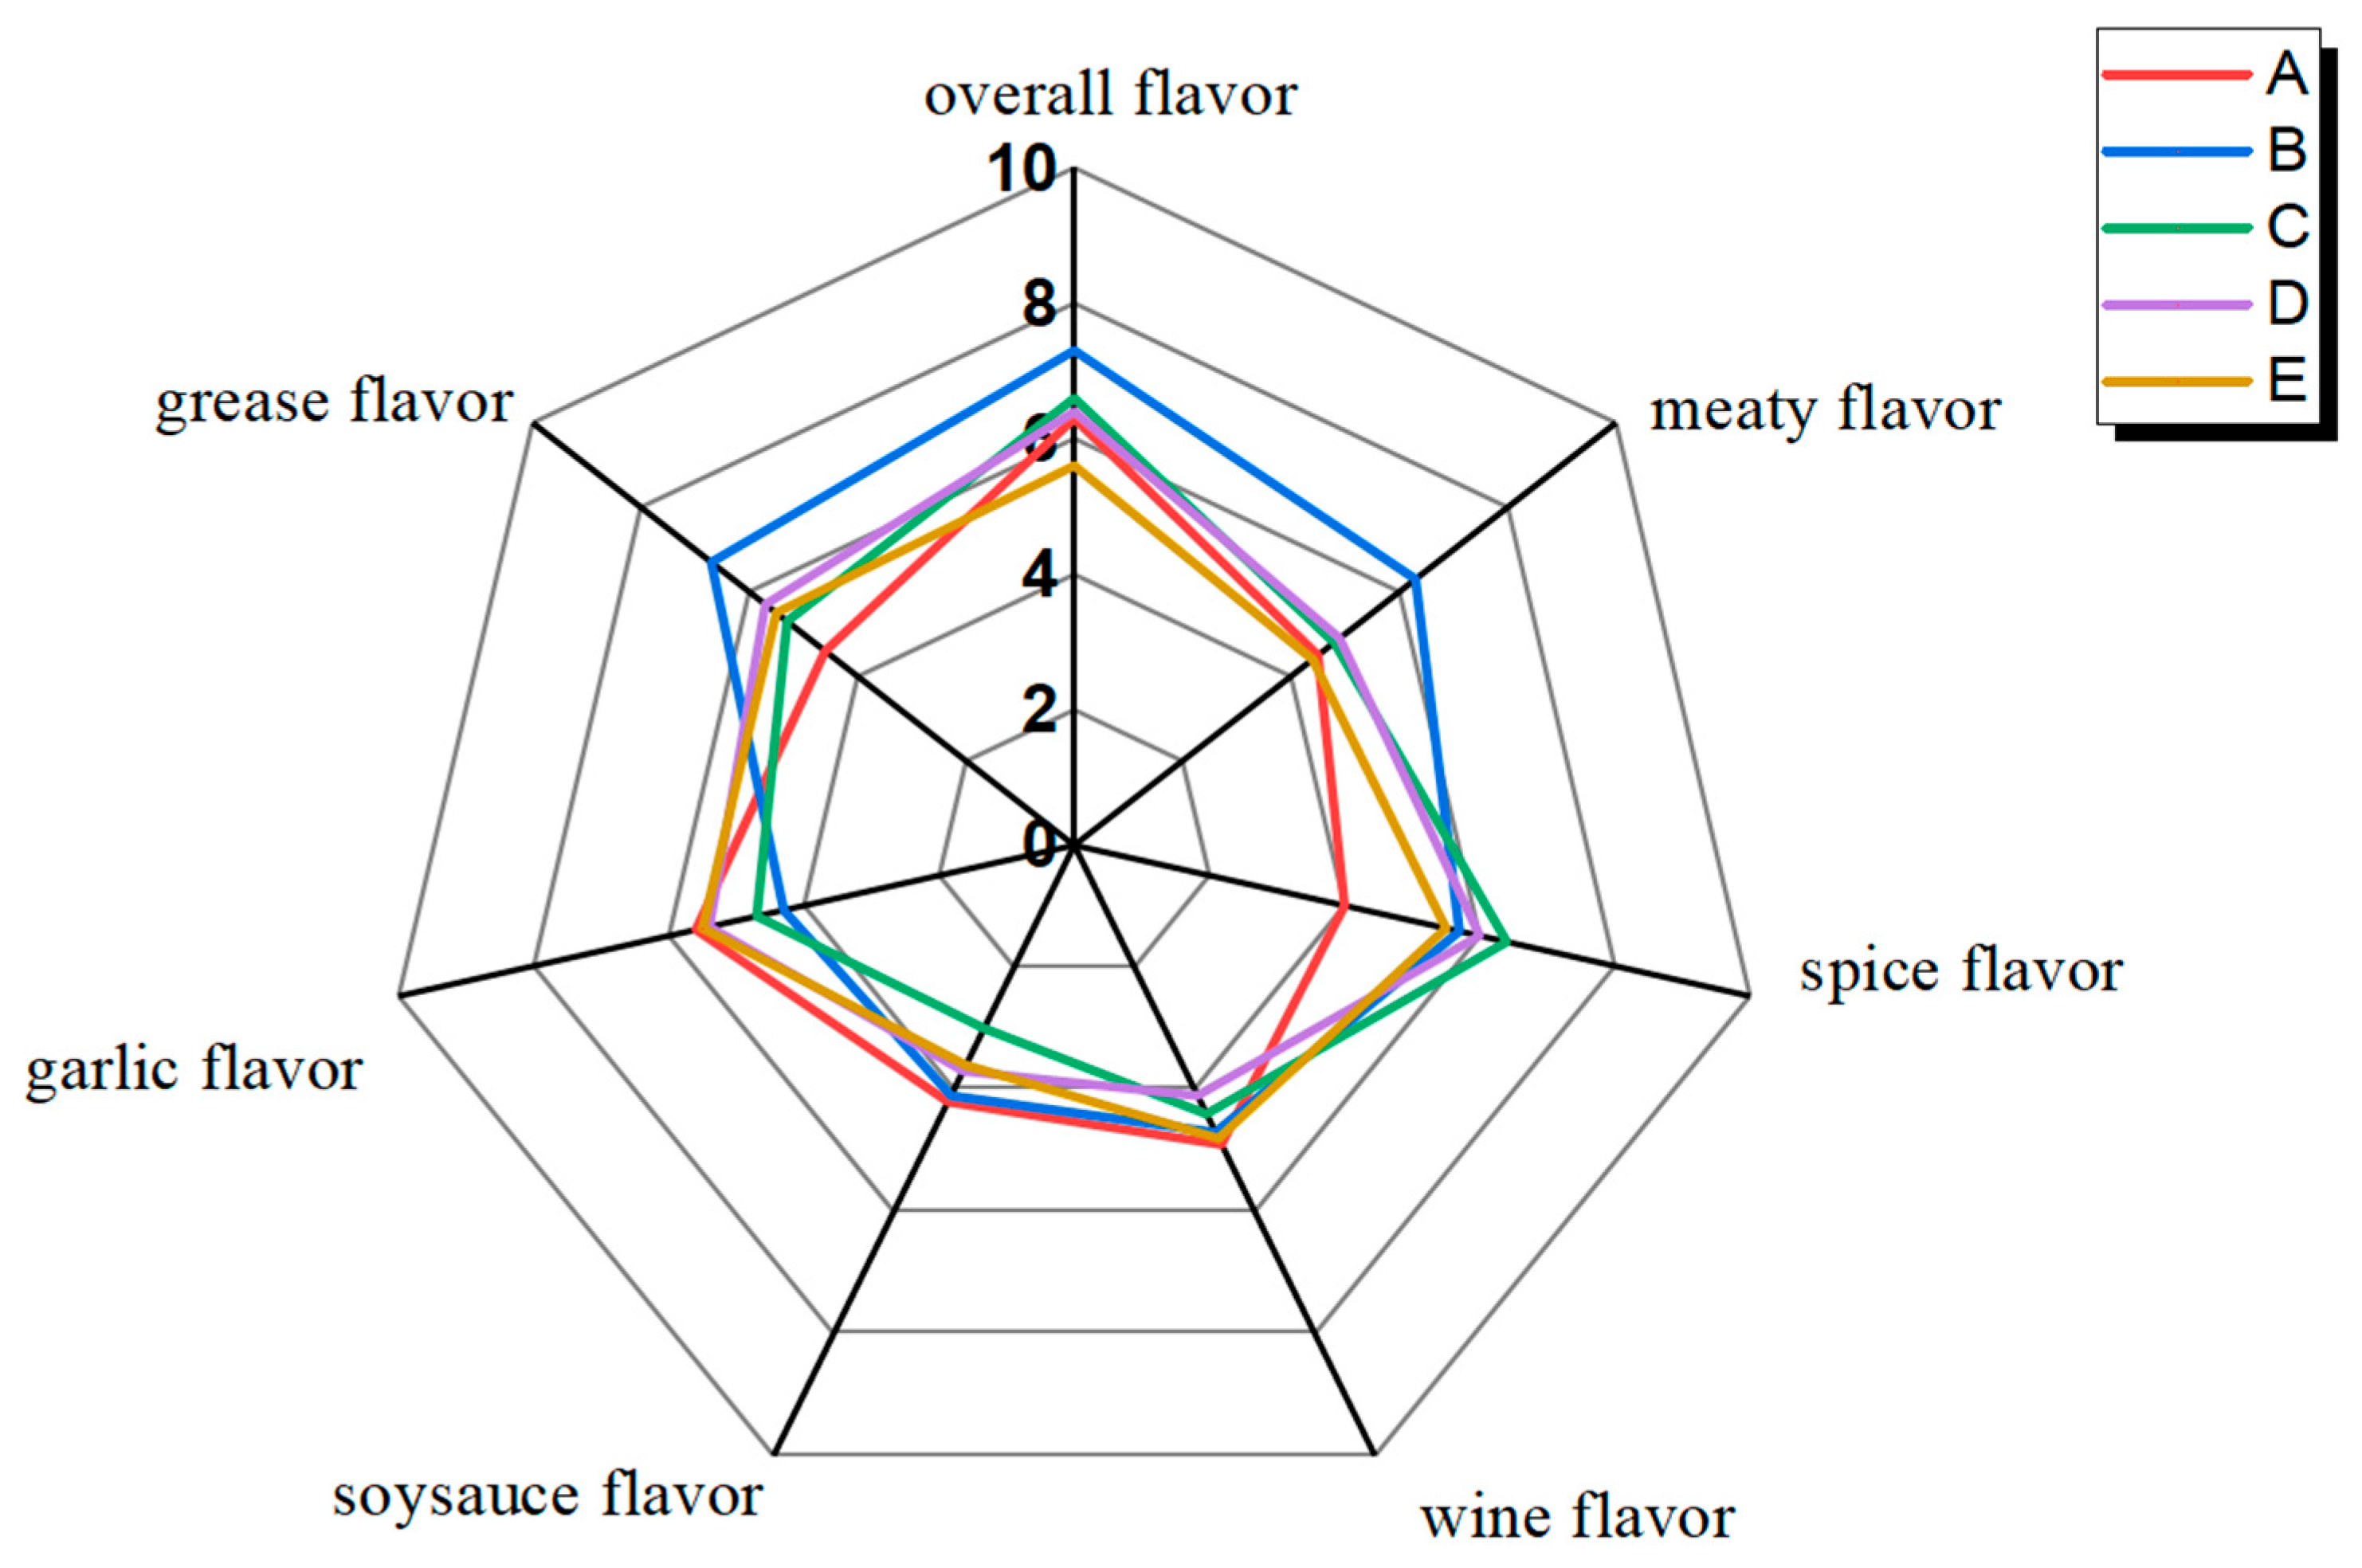
3.1. Aroma Characteristics of DPD from Different Companies
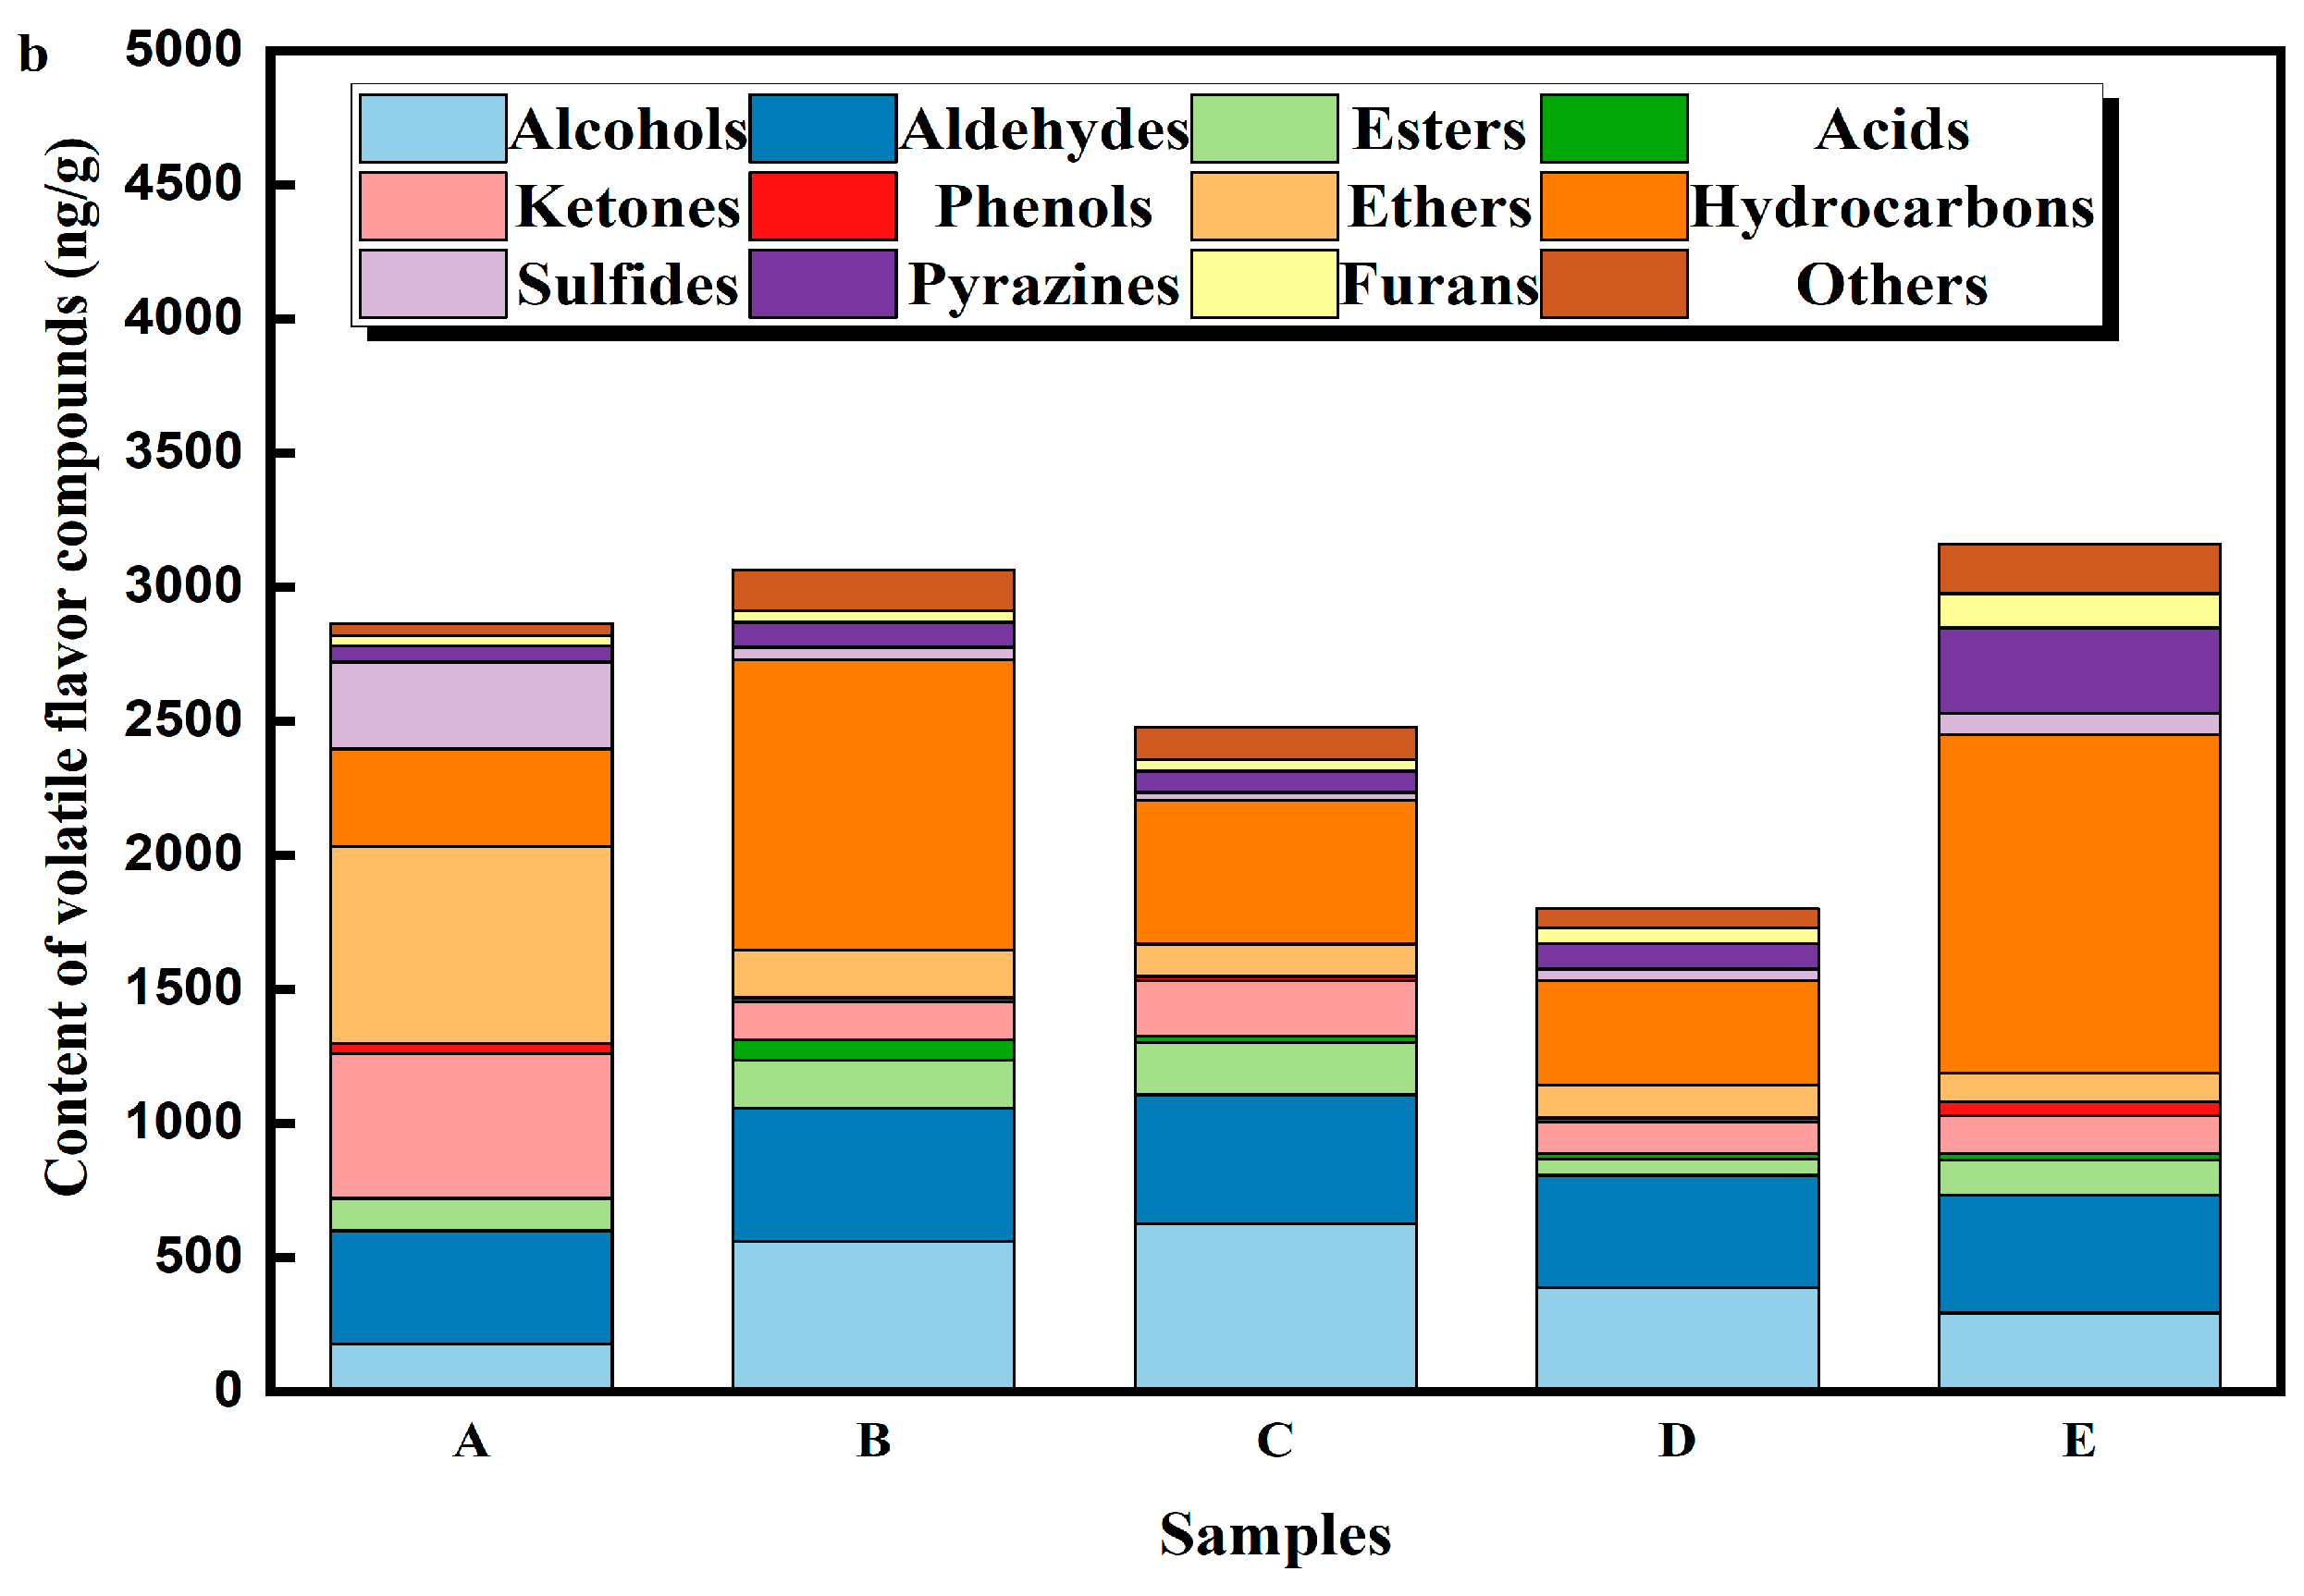
3.2. Volatile Compound Profiles of DPD Based on GC×GC-MS
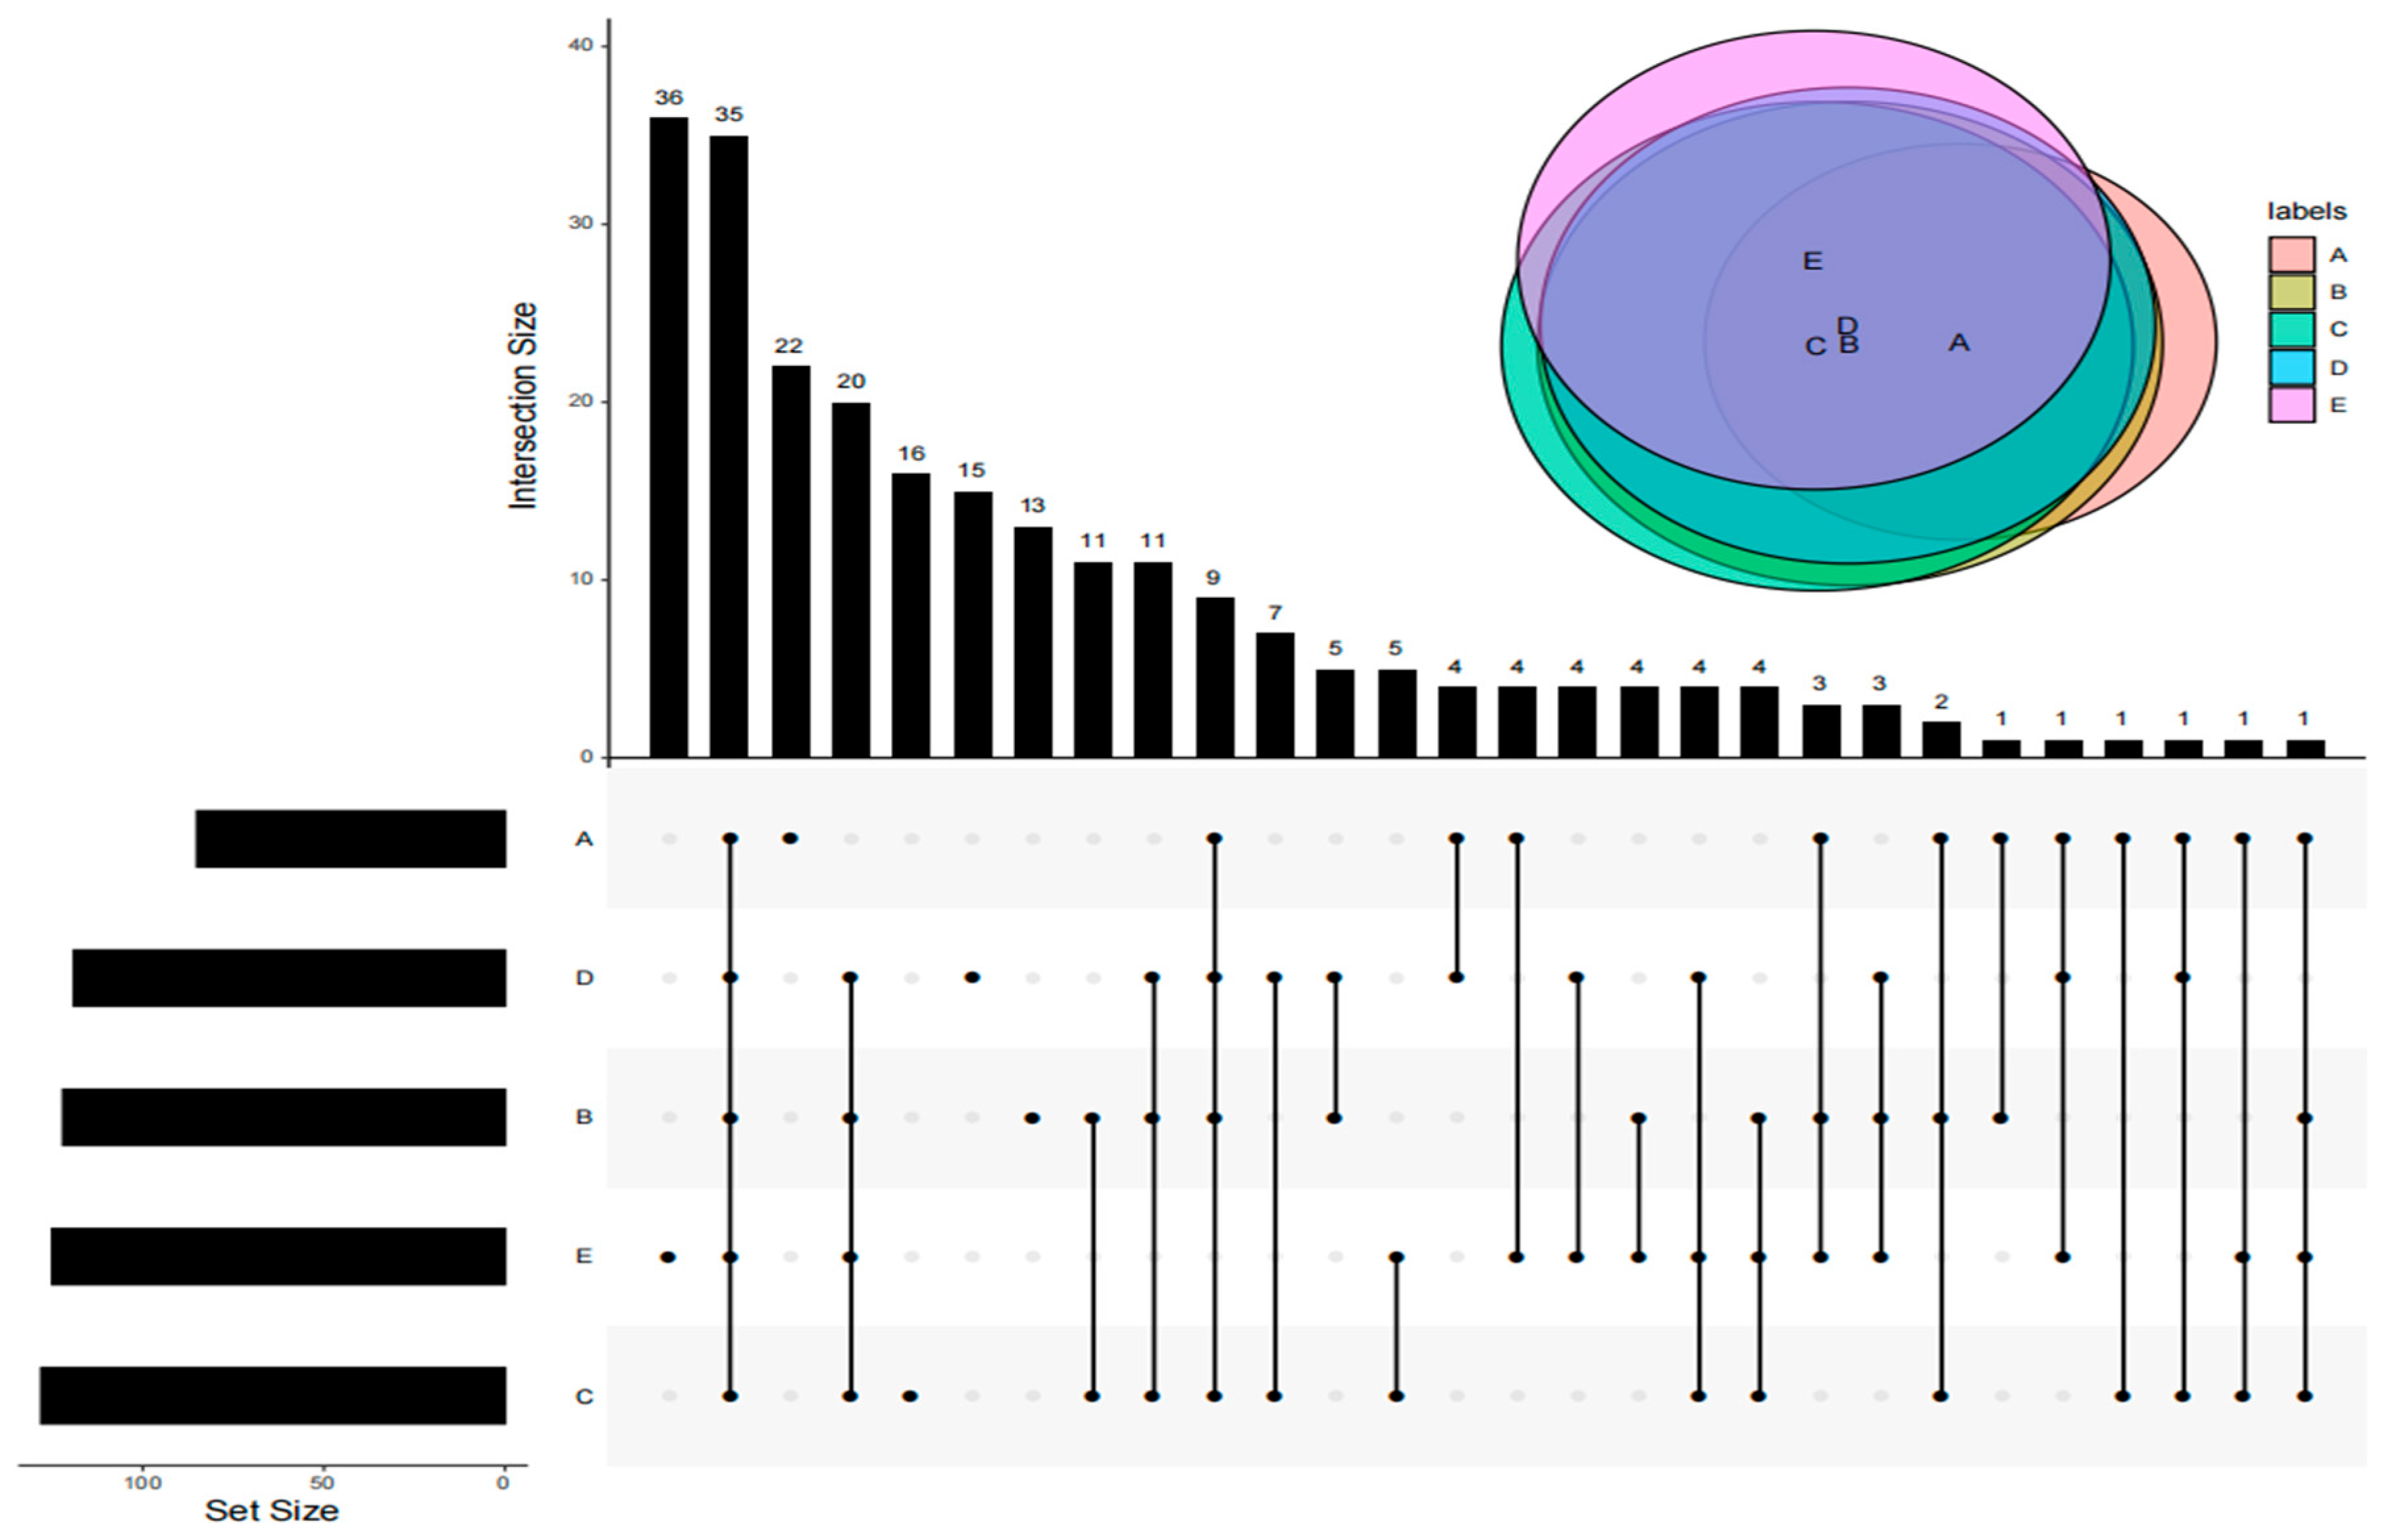
3.3. Analysis of Shared VOCs of DPD from Different Companies
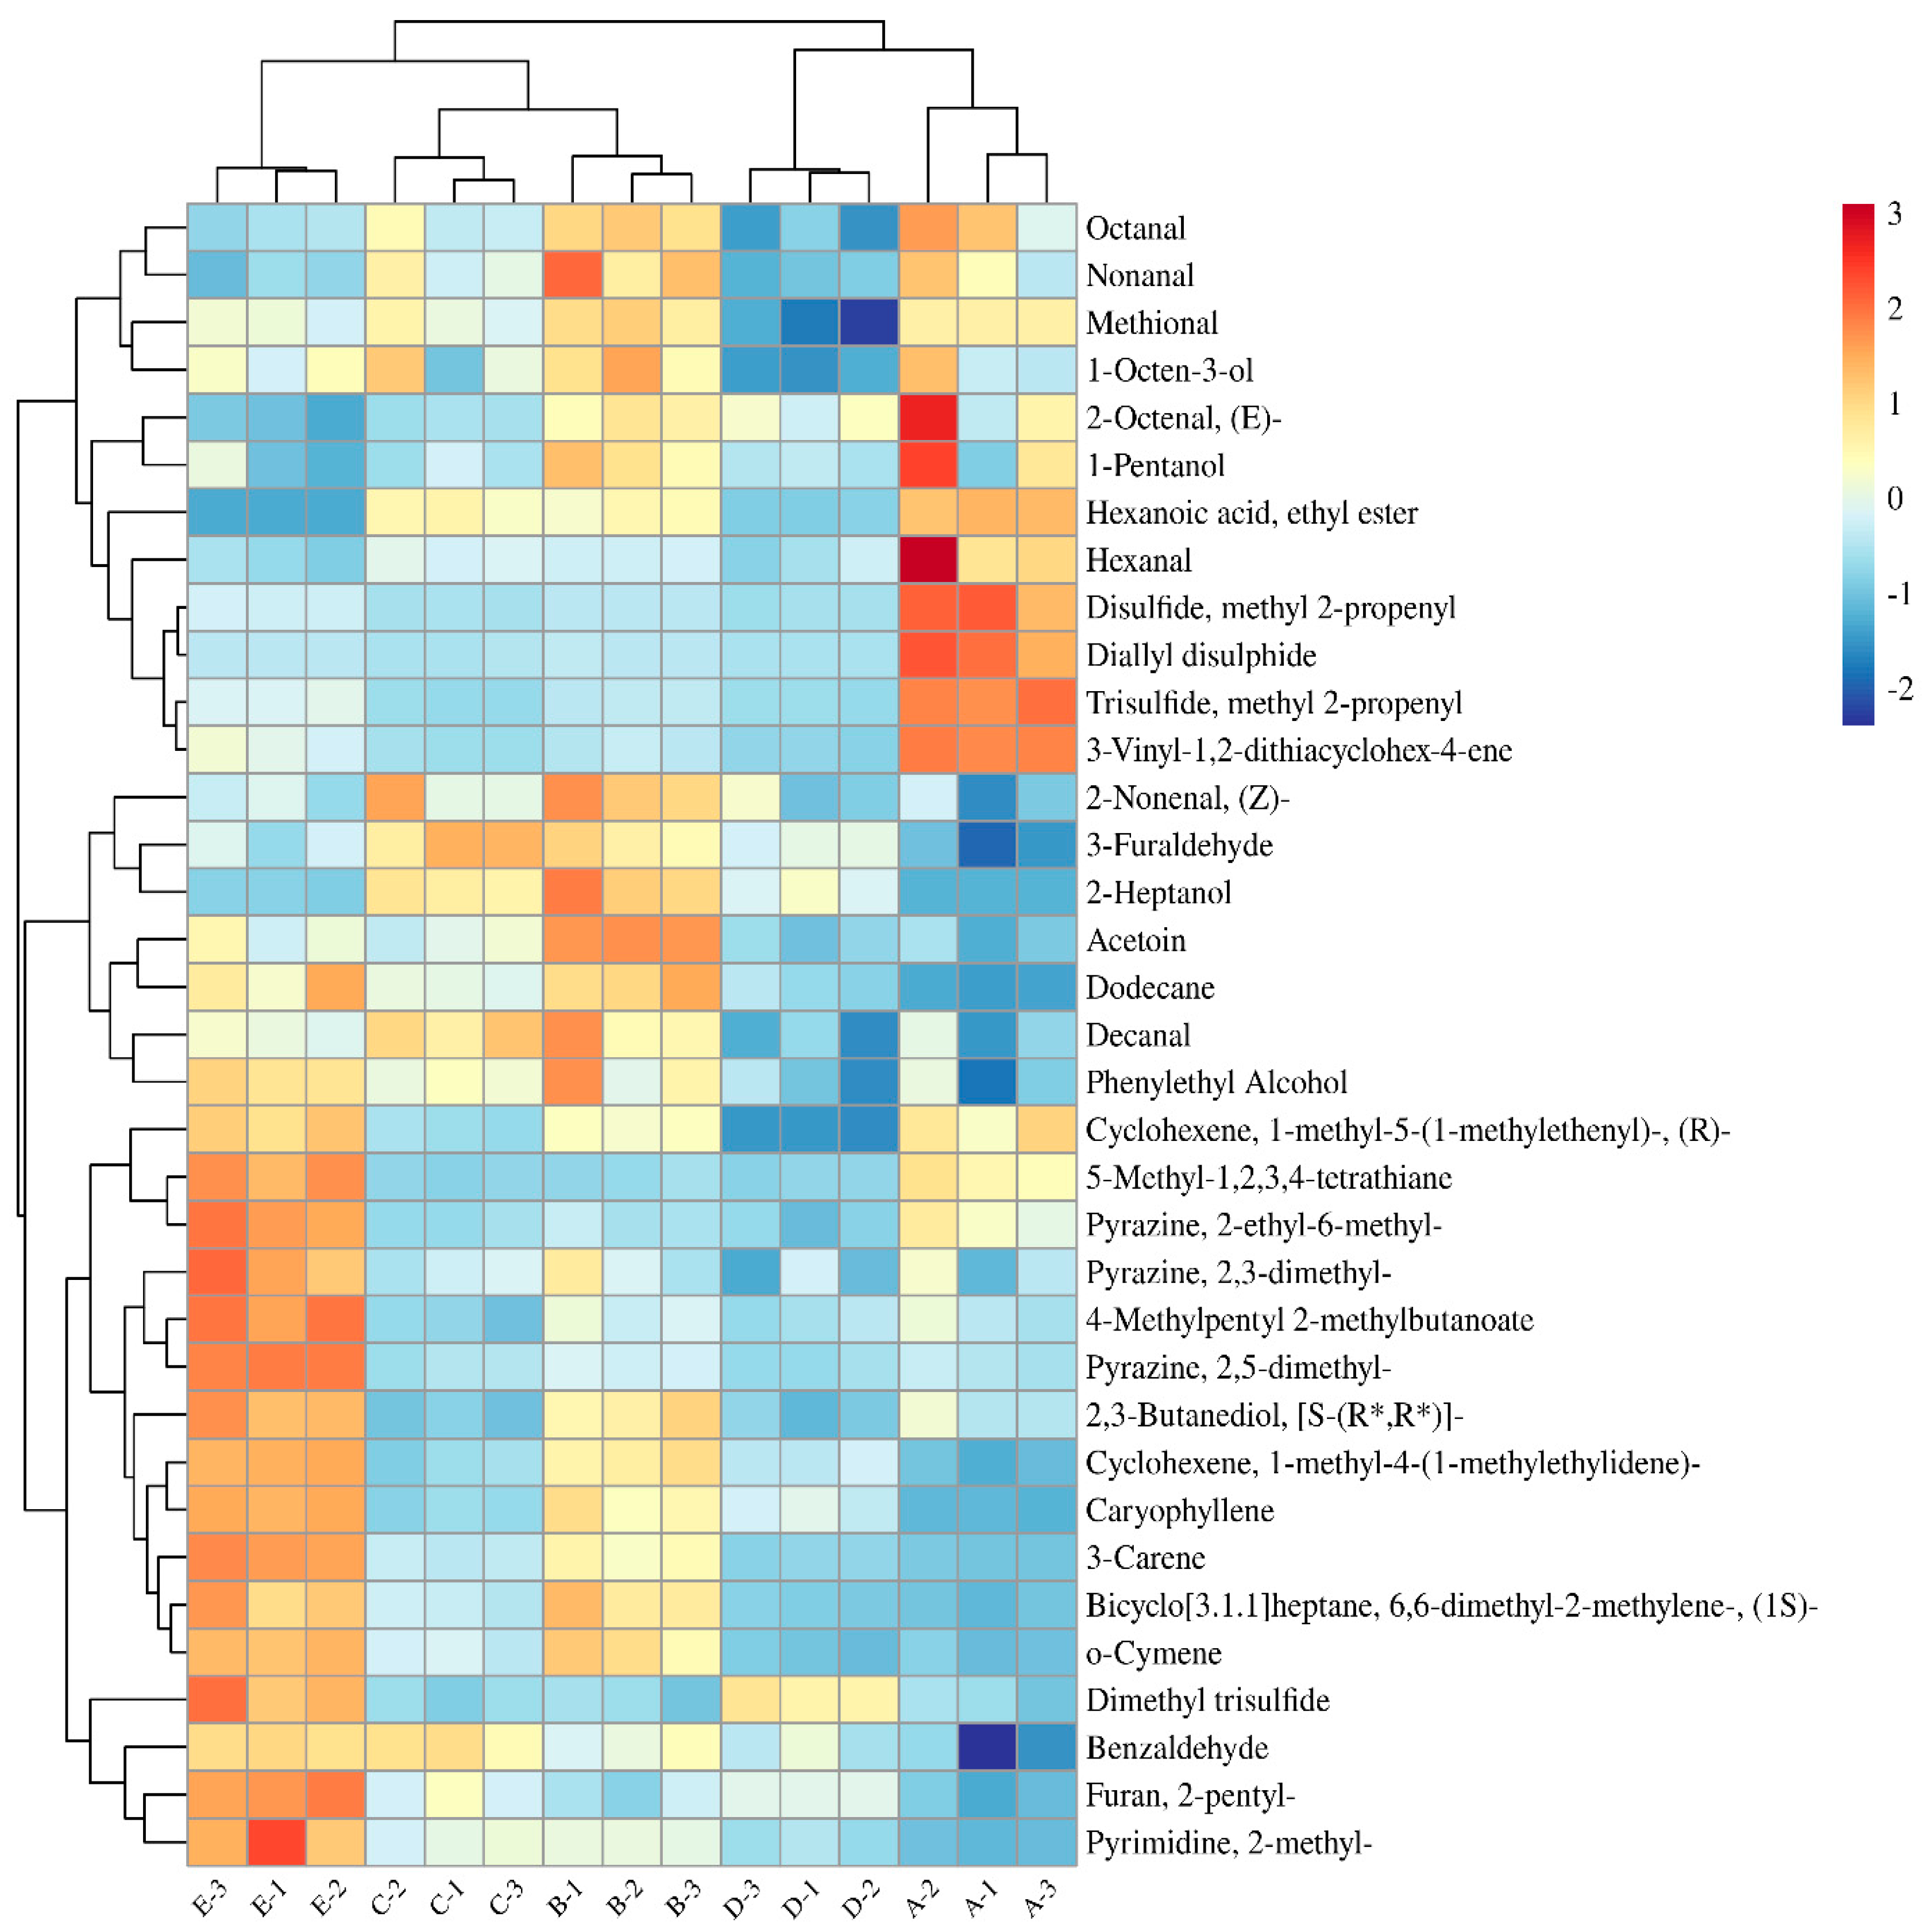
3.4. Identification of Aroma-Active Compounds Using OAV and GC-O-MS Analysis
3.5. Identification of Key Aroma Compounds Using Aroma Recombination and Omission Tests
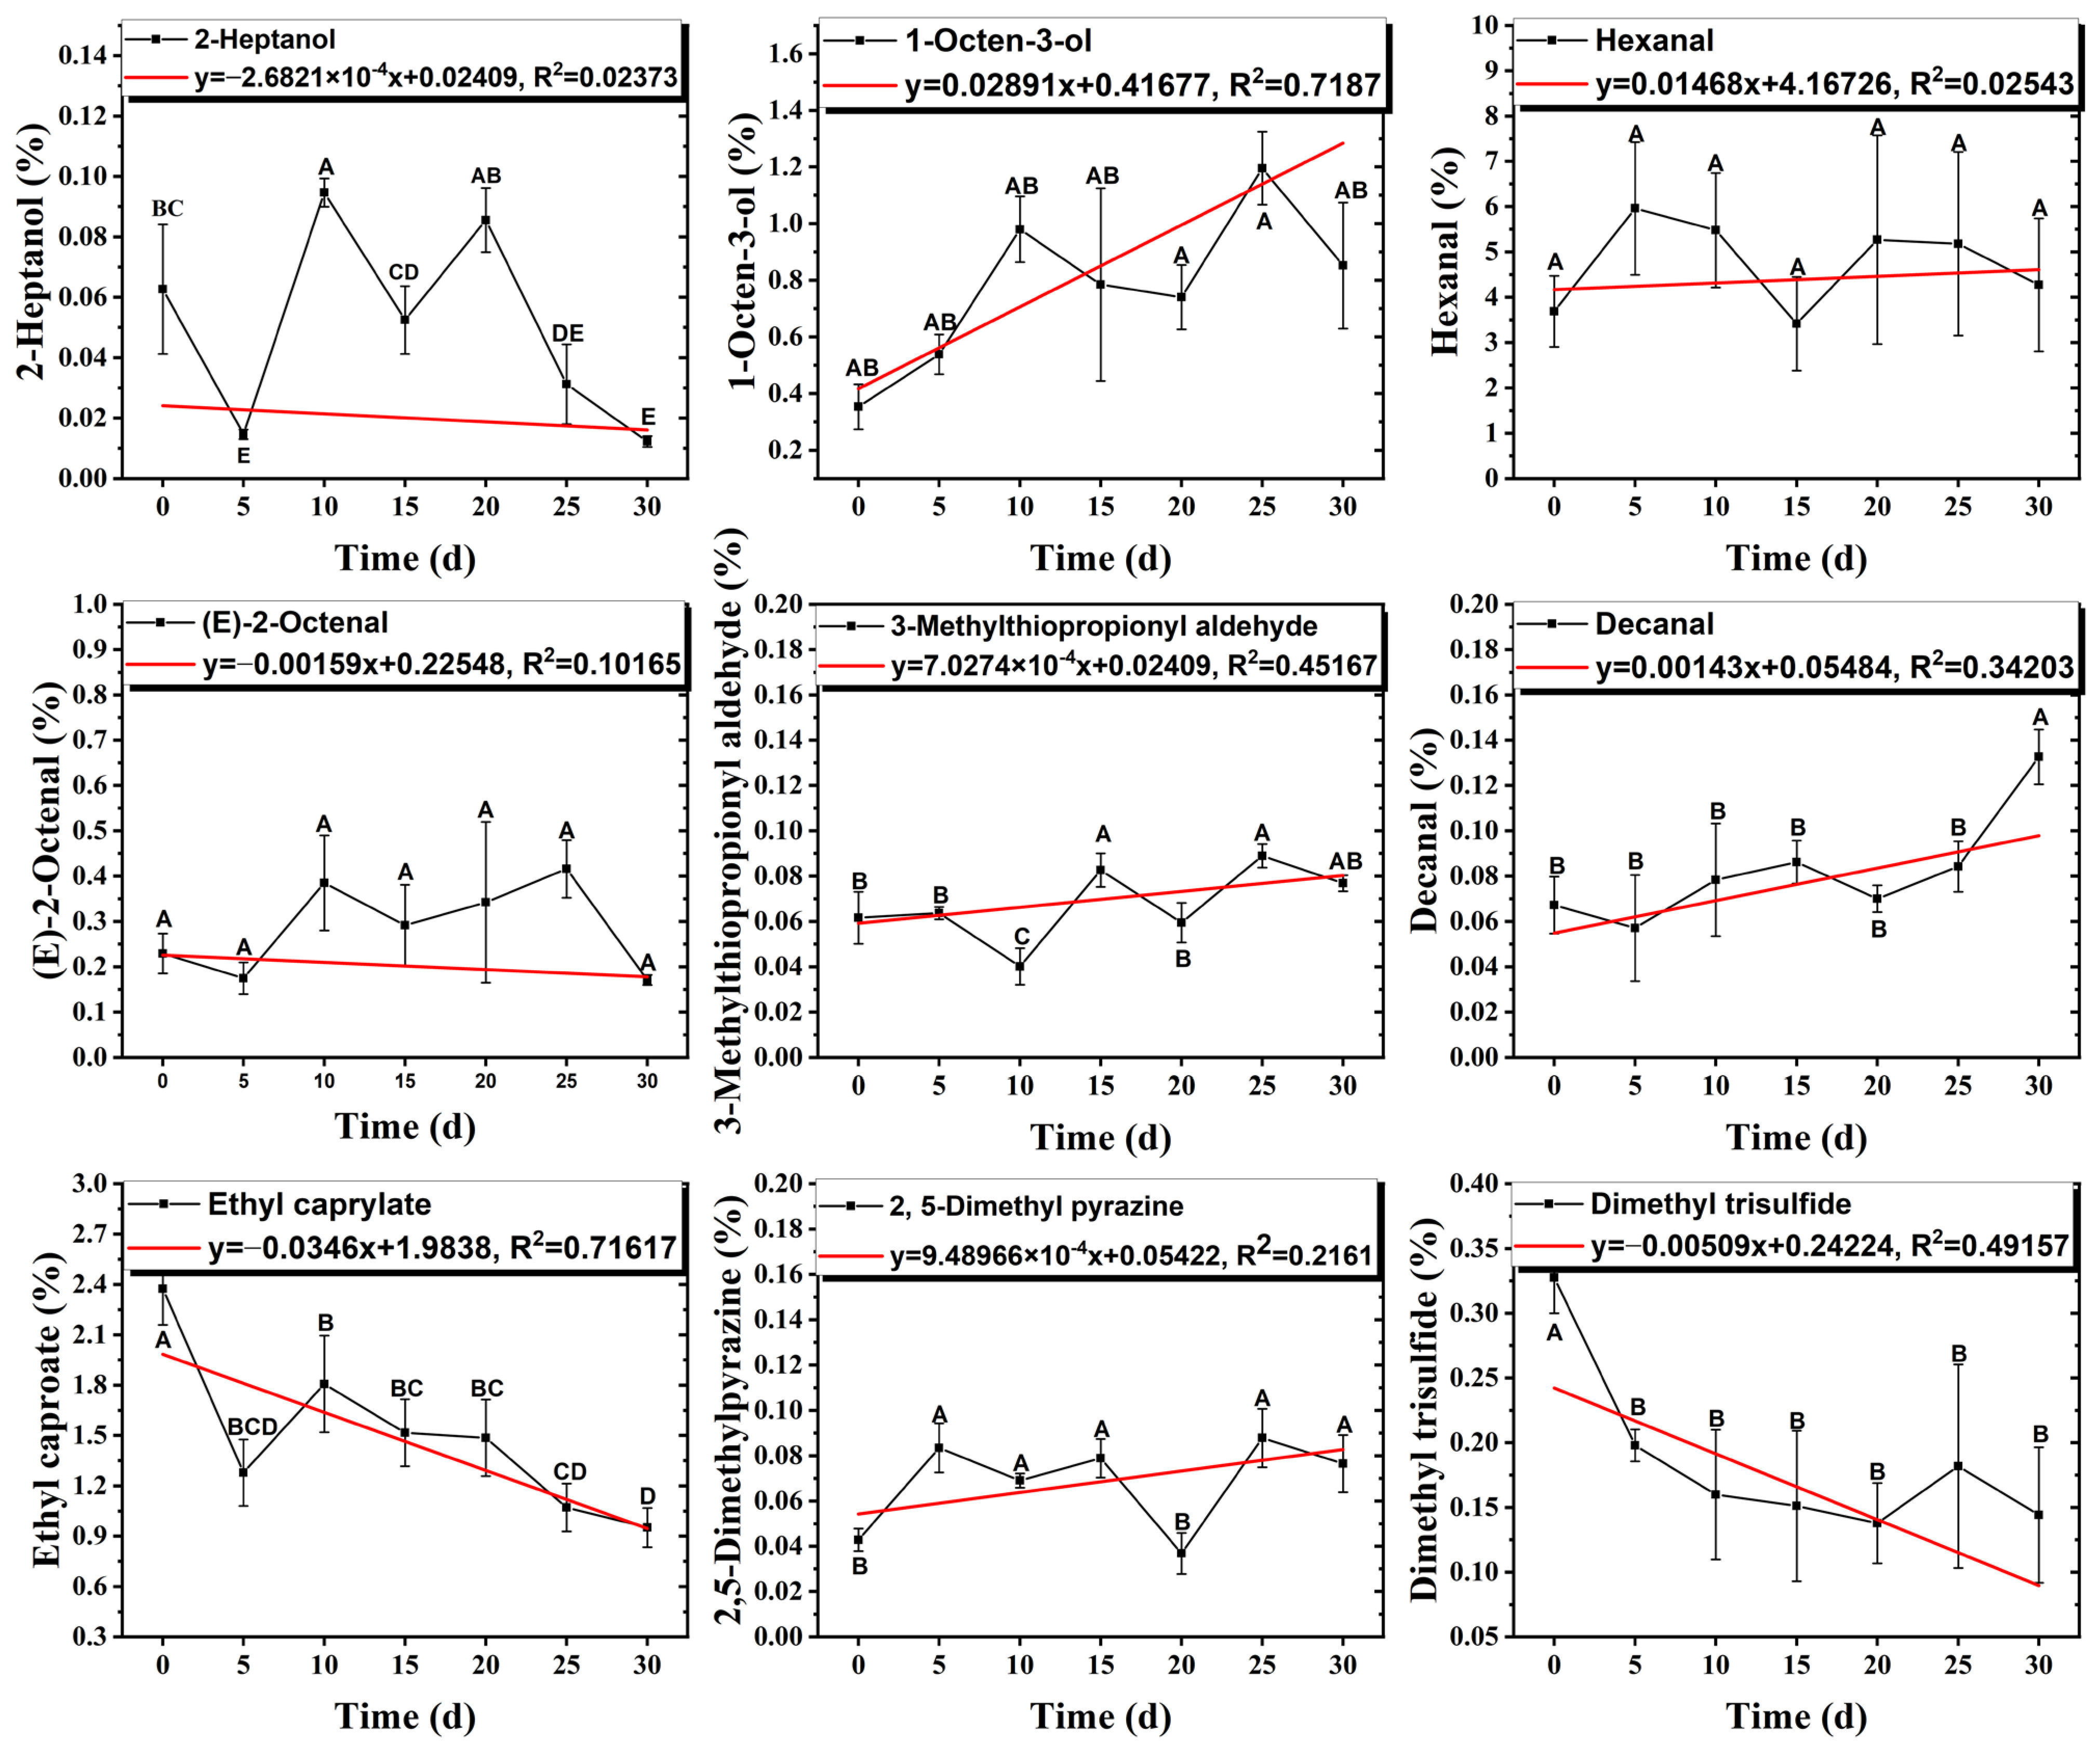
3.6. Changes in the Contents of Key Aroma Compounds During Storage
4. Conclusions
Supplementary Materials
Author Contributions
Funding
Institutional Review Board Statement
Informed Consent Statement
Data Availability Statement
Acknowledgments
Conflicts of Interest
Abbreviations
| DPD | Dongpo pork dish |
| QDA | Quantitative descriptive analysis |
| GC×GC-MS | Two-dimensional gas chromatography-mass spectrometry |
| GC-O-MS | Gas chromatography-olfactometry-mass spectrometry |
| GC-MS | Gas chromatography-mass spectrometry |
| AI | Aroma intensity |
| OAV | Odor activity value |
References
- Xu, J.; Zhang, M.; Wang, Y.; Bhandari, B. Novel technologies for flavor formation in the processing of meat products: A review. Food Rev. Int. 2023, 39, 802–826. [Google Scholar] [CrossRef]
- Fu, Y.; Cao, S.; Yang, L.; Li, Z. Flavor formation based on lipid in meat and meat products: A review. J. Food Biochem. 2022, 46, e14439. [Google Scholar] [CrossRef] [PubMed]
- Tan, F.; Wang, P.; Zhan, P.; Tian, H. Characterization of key aroma compounds in flat peach juice based on gas chromatography-mass spectrometry-olfactometry (GC-MS-O), odor activity value (OAV), aroma recombination, and omission experiments. Food Chem. 2022, 366, 130604. [Google Scholar] [CrossRef] [PubMed]
- Liu, H.; Hui, T.; Fang, F.; Ma, Q.; Li, S.; Zhang, D.; Wang, Z. Characterization and discrimination of key aroma compounds in pre-and postrigor roasted mutton by GC-O-MS, GC E-Nose and aroma recombination experiments. Foods 2021, 10, 2387. [Google Scholar] [CrossRef]
- De Santis, D. Food Flavor Chemistry and Sensory Evaluation. Foods 2024, 13, 634. [Google Scholar] [CrossRef]
- Borràs, E.; Ferré, J.; Boqué, R.; Mestres, M.; Aceña, L.; Busto, O. Data fusion methodologies for food and beverage authentication and quality assessment—A review. Anal. Chim. Acta 2015, 891, 1–14. [Google Scholar] [CrossRef]
- Wang, S.; Chen, H.; Sun, B. Recent progress in food flavor analysis using gas chromatography–ion mobility spectrometry (GC–IMS). Food Chem. 2020, 315, 126158. [Google Scholar] [CrossRef]
- Liu, Z.; Phillips, J.B. Comprehensive two-dimensional gas chromatography using an on-column thermal modulator interface. J. Chromatogr. Sci. 1991, 29, 227–231. [Google Scholar] [CrossRef]
- Yu, M.; Yang, P.; Song, H.; Guan, X. Research progress in comprehensive two-dimensional gas chromatography-mass spectrometry and its combination with olfactometry systems in the flavor analysis field. J. Food Compos. Anal. 2022, 114, 104790. [Google Scholar] [CrossRef]
- Li, W.; Zheng, L.; Xiao, Y.; Li, L.; Wang, N.; Che, Z.; Wu, T. Insight into the aroma dynamics of Dongpo pork dish throughout the production process using electronic nose and GCŨGC-MS. LWT 2022, 169, 113970. [Google Scholar] [CrossRef]
- Zhao, G.; Yuan, Y.; Zhou, H.; Zhao, L.; Jiang, Y. Determination of volatile compounds in different parts of grass carp using GC× GC-MS combined with chemometrics. Food Biosci. 2023, 56, 103403. [Google Scholar] [CrossRef]
- Zhao, Y.; Zhan, P.; Geng, J.; He, W.; Wang, P.; Tian, H. Sensomics-assisted key aroma molecules decoding of ginger-infused stewed beef. LWT 2023, 190, 115555. [Google Scholar] [CrossRef]
- DB51/T 2435-2017; Technical Specification for Sichuan Cuisine Dongpo Meat Cooking Process. China—Sichuan Provincial Local Standard: Chengdu, China, 2017.
- Wang, X.; Fan, C.; Wang, X.; Feng, T.; Zhang, X.; Yu, J.; Cui, H.; Xia, S. Microwave heating and conduction heating pork belly: Influence of heat transfer modes on volatile compounds and aroma attributes. Food Biosci. 2023, 52, 102438. [Google Scholar] [CrossRef]
- ISO 6658:2017-07; Sensory analysis—Methodology—General guidance. Technical Committee ISO/TC 34, Food Products, Subcommittee SC 12, Sensory Analysis. ISO: Geneva, Switzerland, 2017.
- Zhong, A.; Chen, W.; Hu, L.; Wu, Z.; Xiao, Y.; Li, K.; Li, Z.; Wang, Y.; Wang, C. Characterisation of key volatile compounds in fermented sour meat after fungi growth inhibition. LWT 2022, 165, 113662. [Google Scholar] [CrossRef]
- Nie, R.; Zhang, C.; Liu, H.; Wei, X.; Gao, R.; Shi, H.; Zhang, D.; Wang, Z. Characterization of key aroma compounds in roasted chicken using SPME, SAFE, GC-O, GC–MS, AEDA, OAV, recombination-omission tests, and sensory evaluation. Food Chem. X 2024, 21, 101167. [Google Scholar] [CrossRef]
- Jiang, K.; Xu, K.; Wang, J.; Meng, F.; Wang, B. Based on HS-SPME-GC-MS combined with GC-O-MS to analyze the changes of aroma compounds in the aging process of Citri Reticulatae Pericarpium. Food Biosci. 2023, 54, 102798. [Google Scholar] [CrossRef]
- Wang, L.; Wu, L.; Xiang, D.; Huang, H.; Han, Y.; Zhen, P.; Shi, B.; Chen, S.; Xu, Y. Characterization of key aroma compounds in aged Qingxiangxing baijiu by comparative aroma extract dilution analysis, quantitative measurements, aroma recombination, and omission studies. Food Chem. 2023, 419, 136027. [Google Scholar] [CrossRef]
- Zhang, Z.; He, S.; Zhang, L.; Li, X.; Jin, R.; Liu, Q.; Chen, S.; Wang, J.; Sun, H. The potential application of vegetable oils in the D-xylose and L-cysteine Maillard reaction system for meaty aroma production. Food Res. Int. 2022, 155, 111081. [Google Scholar] [CrossRef]
- Yang, X.; Liu, J.; Wan, P.; Guo, D.; Chen, D.-W. Use of egg yolk to imitate meat aroma. Food Chem. 2022, 371, 131112. [Google Scholar] [CrossRef]
- Zhang, L.; Hu, Y.; Wang, Y.; Kong, B.; Chen, Q. Evaluation of the flavour properties of cooked chicken drumsticks as affected by sugar smoking times using an electronic nose, electronic tongue, and HS-SPME/GC-MS. LWT 2021, 140, 110764. [Google Scholar] [CrossRef]
- Wang, S.; Chen, H.; Sun, J.; Zhang, N.; Wang, S.; Sun, B. Effects of cooking methods on aroma formation in pork: A comprehensive review. Food Chem. X 2023, 20, 100884. [Google Scholar] [CrossRef] [PubMed]
- Hoa, V.-B.; Seol, K.-H.; Seo, H.-W.; Kang, S.; Kim, Y.; Seong, P.; Moon, S.; Kim, J.; Cho, S. Investigation of physicochemical and sensory quality differences in pork belly and shoulder butt cuts with different quality grades. Food Sci. Anim. Resour. 2021, 41, 224. [Google Scholar] [CrossRef] [PubMed]
- Cheng, L.; Li, X.; Tian, Y.; Wang, Q.; Li, X.; An, F.; Luo, Z.; Shang, P.; Liu, Z.; Huang, Q. Mechanisms of cooking methods on flavor formation of Tibetan pork. Food Chem. X 2023, 19, 100873. [Google Scholar] [CrossRef]
- Ahamed, Z.; Seo, J.-K.; Eom, J.-U.; Yang, H.-S. Optimization of volatile compound extraction on cooked meat using HS-SPME-GC-MS, and evaluation of diagnosis to meat species using volatile compound by multivariate data analysis. LWT 2023, 188, 115374. [Google Scholar] [CrossRef]
- Zhang, M.; Zhou, C.; Zhang, C.; Xu, K.; Lu, L.; Huang, L.; Zhang, L.; Li, H.; Zhu, X.; Lai, Z.; et al. Analysis of Characteristics in the Macro-Composition and Volatile Compounds of Understory Xiaobai White Tea. Plants 2023, 12, 4102. [Google Scholar] [CrossRef]
- Wu, T.; Wang, P.; Zhang, Y.; Zhan, P.; Zhao, Y.; Tian, H.; He, W. Identification of muttony-related compounds in cooked mutton tallows and their flavor intensities subjected to phenolic extract from thyme (Thymus vulgaris L.). Food Chem. 2023, 427, 136666. [Google Scholar] [CrossRef]
- He, Z.-G.; Zhang, Y.; Yang, M.-D.; Zhang, Y.-Q.; Cui, Y.-Y.; Du, M.-Y.; Zhao, D.; Sun, H. Effect of different sweeteners on the quality, fatty acid and volatile flavor compounds of braised pork. Front. Nutr. 2022, 9, 961998. [Google Scholar] [CrossRef]
- Gąsior, R.; Wojtycza, K.; Majcher, M.A.; Bielińska, H.; Odrzywolska, A.; Bączkowicz, M.; Migdał, W. Key aroma compounds in roasted White Kołuda Goose. J. Agric. Food Chem. 2021, 69, 5986–5996. [Google Scholar] [CrossRef]
- Chang, Y.; Wang, S.; Chen, H.; Zhang, N.; Sun, J. Characterization of the key aroma compounds in pork broth by sensory-directed flavor analysis. J. Food Sci. 2021, 86, 4932–4945. [Google Scholar] [CrossRef]
- Zhang, J.; Zhong, L.; Wang, P.; Song, J.; Shi, C.; Li, Y.; Oyom, W.; Zhang, H.; Zhu, Y.; Wen, P. HS-SPME-GC-MS Combined with Orthogonal Partial Least Squares Identification to Analyze the Effect of LPL on Yak Milk’s Flavor under Different Storage Temperatures and Times. Foods 2024, 13, 342. [Google Scholar] [CrossRef]
- Lyte, J.M.; Legako, J.F.; Martin, J.N.; Thompson, L.; Surowiec, K.; Brooks, J. Volatile compound characterization of modified atmosphere packaged ground beef held under temperature abuse. Food Control 2016, 59, 1–6. [Google Scholar] [CrossRef]
- Bi, J.; Li, Y.; Yang, Z.; Lin, Z.; Chen, F.; Liu, S.; Li, C. Effect of different cooking times on the fat flavor compounds of pork belly. J. Food Biochem. 2022, 46, e14184. [Google Scholar] [CrossRef] [PubMed]
- Wang, Y.; Zhang, H.; Cui, J.; Gao, S.; Bai, S.; You, L.; Ji, C.; Wang, S. Dynamic changes in the water and volatile compounds of chicken breast during the frying process. Food Res. Int. 2024, 175, 113715. [Google Scholar] [CrossRef]
- Qiu, D.; Gan, R.; Feng, Q.; Shang, W.; He, Y.; Li, C.; Shen, X.; Li, Y. Flavor formation of tilapia byproduct hydrolysates in Maillard reaction. J. Food Sci. 2024, 89, 1554–1566. [Google Scholar] [CrossRef]
- Yao, W.; Cai, Y.; Liu, D.; Chen, Y.; Li, J.; Zhang, M.; Chen, N.; Zhang, H. Analysis of flavor formation during production of Dezhou braised chicken using headspace-gas chromatography-ion mobility spec-trometry (HS-GC-IMS). Food Chem. 2022, 370, 130989. [Google Scholar] [CrossRef]
- Wen, R.; Sun, F.; Li, X.-A.; Chen, Q.; Kong, B. The potential correlations between the fungal communities and volatile compounds of traditional dry sausages from Northeast China. Food Microbiol. 2021, 98, 103787. [Google Scholar] [CrossRef]
- Jiang, F.; Zhang, J.; Zhang, R.; Zhang, W. Effects of ultrasound-assisted vacuum tumbling on the flavor of spiced beef. Food Biosci. 2024, 58, 103652. [Google Scholar] [CrossRef]
- Hu, G.; Cai, K.; Li, Y.; Hui, T.; Wang, Z.; Chen, C.; Xu, B.; Zhang, D. Significant inhibition of garlic essential oil on benzo [a] pyrene formation in charcoal-grilled pork sausages relates to sulfide compounds. Food Res. Int. 2021, 141, 110127. [Google Scholar] [CrossRef]
- Shi, Y.; Chen, G.; Chen, K.; Chen, X.; Hong, Q.; Kan, J. Assessment of fresh star anise (Illicium verum Hook. f.) drying methods for influencing drying characteristics, color, flavor, volatile oil and shikimic acid. Food Chem. 2021, 342, 128359. [Google Scholar] [CrossRef]
- Gopinath, A.; Yadav, S.A.; Ranjithkumar, D. Evaluation of Comparative metabolomic profile in Cardamom elettaria and Amomum subulatum fruits. Orient. J. Chem. 2023, 39, 1690. [Google Scholar] [CrossRef]
- Gooderham, N.J.; Cohen, S.M.; Eisenbrand, G.; Fukushima, S.; Guengerich, F.P.; Hecht, S.S.; Rietjens, I.M.; Rosol, T.J.; Davidsen, J.M.; Harman, C.L.; et al. FEMA GRAS assessment of natural flavor complexes: Clove, cinnamon leaf and West Indian bay leaf-derived flavoring ingredients. Food Chem. Toxicol. 2020, 145, 111585. [Google Scholar] [CrossRef] [PubMed]
- Kunihiro, K.; Kikuchi, Y.; Nojima, S.; Myoda, T. Characteristic of aroma components and antioxidant activity of essential oil from Ocimum tenuiflorum leaves. Flavour Fragr. J. 2022, 37, 210–218. [Google Scholar] [CrossRef]
- Jiang, H.; Zhang, M.; Ye, J.; Qian, M.; Li, X.; Zhao, W.; Bai, W. HS-SPME-GC-MS and OAV analyses of characteristic volatile flavour compounds in salt-baked drumstick. LWT 2022, 170, 114041. [Google Scholar] [CrossRef]
- Yang, X.; Pei, Z.; Du, W.; Xie, J. Characterization of Volatile Flavor Compounds in Dry-Rendered Beef Fat by Different Solvent-Assisted Flavor Evaporation (SAFE) Combined with GC–MS, GC–O, and OAV. Foods 2023, 12, 3162. [Google Scholar] [CrossRef]
- Zhao, Q.; Shen, Q.; Guo, R.; Wu, J.; Dai, Z.-Y. Characterization of flavor properties from fish (Collichthys niveatus) through enzymatic hydrolysis and the maillard reaction. J. Aquat. Food Prod. Technol. 2016, 25, 482–495. [Google Scholar] [CrossRef]
- Cui, H.; Liu, D.; Xia, X.; Yu, J.; Hayat, K.; Zhang, X.; Ho, C.-T. Flavor and texture characteristics of microwave-cooked Kung Pao Chicken by different heat conduction effects and further aroma improvement with moderate enzymatic hydrolyzed chicken fat. Food Funct. 2021, 12, 1547–1557. [Google Scholar] [CrossRef]
- Duan, Z.; Dong, S.; Sun, Y.; Dong, Y.; Gao, Q. Response of Atlantic salmon (Salmo salar) flavor to environmental salinity while culturing between freshwater and seawater. Aquaculture 2021, 530, 735953. [Google Scholar] [CrossRef]
- Hoa, V.-B.; Song, D.-H.; Min, Y.-J.; Seol, K.-H.; Kang, S.-M.; Kim, H.-W.; Moon, S.-S.; Cho, S.-H. Carcass trait, meat yield and quality characteristics of recently-synthesized Woori Heukdon and commercial LYD pigs under identical rearing condition. Anim. Biosci. 2023, 36, 943. [Google Scholar] [CrossRef]
- Zhang, K.; Zang, M.; Wang, S.; Zhang, Z.; Li, D.; Li, X.; Zhao, Y. Effects of defatting and cooking methods on pig large intestines volatile compounds by flavor omics and fatty acids. LWT 2023, 189, 115500. [Google Scholar] [CrossRef]
- Liu, H.; Wang, Z.; Zhang, D.; Shen, Q.; Pan, T.; Hui, T.; Ma, J. Characterization of key aroma compounds in Beijing roasted duck by gas chromatography–olfactometry–mass spectrometry, odor-activity values, and aroma-recombination experiments. J. Agric. Food Chem. 2019, 67, 5847–5856. [Google Scholar] [CrossRef]


| Samples | Source Information |
|---|---|
| A | Laboratory self-made |
| B | Meizhou Dongpo Restaurant |
| C | Meizhou Dongpo-Mengnanxuan Restaurant |
| D | Mingyue Dongpo Restaurant |
| E | Wangjiadu (Prepared Dishes) |
| Aroma Descriptors | Reference |
|---|---|
| Meaty | Cooked streaky pork |
| Greasy | Melted lard |
| Garlicky | Chopped garlic |
| Wine flavor | Liquor |
| Saucy | Mixture of soy sauce and dark soy sauce (1:1) |
| Spice | Spice powder |
| Compounds | Aroma Descriptors | AI | Threshold mg/kg | OAV | |||||||||
|---|---|---|---|---|---|---|---|---|---|---|---|---|---|
| 1 | 2 | 3 | 4 | 5 | 1 | 2 | 3 | 4 | 5 | ||||
| Aldehydes | Hexanal | grass, fatty | 3.0 | 2.0 | 2.7 | 2.0 | 2.0 | 0.075 | 2650.7 | 1967.5 | 2030.6 | 1802.8 | 1669.4 |
| Octanal | fruity, orange | 1.0 | 2.0 | 1.5 | 2.5 | 0 | 0.94 | 31.4 | 39.2 | 31.6 | 23.3 | 28.1 | |
| Nonanal | rose, oil | 2.0 | 3.3 | 3.0 | 2.5 | 2.0 | 0.15 | 351.1 | 540.1 | 409.3 | 288.9 | 309.4 | |
| (E)-2-Octenal | cucumber, fatty | 1.3 | 2.5 | 2.0 | 2.0 | 0 | 0.004 | 2645.5 | 2710.3 | 1641.0 | 2253.5 | 1166.8 | |
| Methional | onion, broth | 3.0 | 3.3 | 4.0 | 2.0 | 2.5 | 0.0002 | 61,838.5 | 66,480.0 | 54,595.0 | 23,730.0 | 52,270.0 | |
| 3-Furaldehyde | - | - | - | - | - | - | - | - | - | - | - | - | |
| Benzaldehyde | bitter almond | 1.7 | 2.0 | 3.0 | 0 | 2.0 | 0.06 | 828.6 | 1460.3 | 1705.1 | 1297.9 | 1777.4 | |
| Decyl aldehyde | citrus, floral | 1.0 | 3.0 | 2.5 | 1.5 | 2.7 | 0.65 | 8.2 | 16.6 | 16.7 | 5.9 | 12.2 | |
| (Z)-non-2-enal | greasy, rotting grass | - | 3.5 | 4.0 | - | - | 0.003 | 1487.9 | 3601.7 | 2841.0 | 1812.7 | 1984.67 | |
| Alcohols | 1-Pentanol | fragrance | 1.0 | 3.0 | 2.5 | 0 | 2.0 | 3 | 7.2 | 7.4 | 4.8 | 4.8 | 4.3 |
| 2-Heptanol | lemon, grass | 2.7 | 0 | 0 | 0 | 2.5 | 0.01 | 43.1 | 2297.4 | 1667.4 | 1089.2 | 369.0 | |
| 1-Octen-3-ol | mushroom, lavender | 2.0 | 2.0 | 2.0 | 2.0 | 3.0 | 0.001 | 26,573.2 | 34,213.0 | 29,329.0 | 21,092.0 | 29,721.0 | |
| Phenethyl alcohol | floral | 1.3 | 1.0 | 0 | 2.0 | 0 | - | - | - | - | - | - | |
| (S, S)-2,3-Butanediol | - | - | - | - | - | - | - | - | - | - | - | - | |
| Ketones | Acetoin | butter, fatty | 1.7 | 2.0 | 2.0 | 2.0 | 2.0 | - | - | - | - | - | - |
| Ethers | Methyl allyl disulfide | molasses, leek, shallot | 1.3 | 0 | 0 | 1.0 | 0 | - | - | - | - | - | - |
| Methyl allyl trisulfide | - | - | - | - | - | - | - | - | - | - | - | - | |
| Esters | Ethyl Hexanoate | fruity | 1.7 | 0 | 3.0 | 0 | 0 | 0.04 | 1684.9 | 1160.6 | 1186.6 | 428.4 | 167.1 |
| Butanoic acid, 2-methyl- 4-methylpentyl ester | - | - | - | - | - | - | - | - | - | - | - | - | |
| Alkanes | Dodecane | fuel | 1.3 | 3.0 | 0 | 2.0 | 0 | >13,000 | - | - | - | - | - |
| 1,2,3,4-Tetrathiane, 5-methyl- | - | - | - | - | - | - | - | - | - | - | - | - | |
| Olefins | 3-Carene | larch | 1.3 | 2.0 | 1.0 | 1.0 | 2.0 | - | - | - | - | - | - |
| (1S)- (1)-beta-Pinene | turpentine | - | 2.0 | 1.0 | - | - | 2.9 | 3.4 | 23.6 | 11.8 | 5.2 | 31.9 | |
| (R)-1-methyl-5- (1-methylvinyl) cyclohexene | - | - | - | - | - | - | - | - | - | - | - | - | |
| Terpinolene | larch, lemon | 2.3 | 2.3 | 3.0 | 2.3 | 0 | - | - | - | - | - | - | |
| 1,2-Dithiin, 3-ethenyl-3,6-dihydro- | - | - | - | - | - | - | - | - | - | - | - | - | |
| β-Caryophyllene | lilac | 1.3 | 0 | 2 | 0 | 1 | - | - | - | - | - | - | |
| Pyrazines | 2,5-Dimethyl pyrazine | fried peanuts, buttery | 2.3 | 1.0 | 2.5 | 2.0 | 2.0 | 2.6 | 15.5 | 23.0 | 16.4 | 13.8 | 65.6 |
| 2,3-Dimethylpyrazine | buttery, meaty | 1.7 | 2.5 | 2.5 | 0 | 2.0 | - | - | - | - | - | - | |
| 2-Ethyl-6-methylpyrazine | nutty, toasty | 2.3 | 0 | 2.0 | 2.0 | 0 | - | - | - | - | - | - | |
| Furans | 2-Pentylfuran | bean flavor, fruity | 1.3 | 2.0 | 2.0 | 1 | 0 | 0.1 | 273.2 | 435.3 | 589.7 | 580.9 | 1103.2 |
| Sulfides | Dimethyl trisulfide | mint, onion | 2.3 | 2.0 | 3.0 | 2.0 | 0 | 0.0025 | 5874.1 | 7032.4 | 7220.8 | 15,257.2 | 20,192.4 |
| Diallyldisulfide | molasses | 2.0 | 2.0 | 2.3 | 1.0 | 0 | 10 | 30.9 | 2.7 | 1.2 | 0.6 | 2.8 | |
| Compounds | CAS | Standard Curve | R2 |
|---|---|---|---|
| 1-Pentanol | 71-41-0 | y = 0.261x + 117,345 | 0.994 |
| 2-Heptanol | 543-49-7 | y = 0.595x + 12,010 | 0.993 |
| 1-Octen-3-ol | 3391-86-4 | y = 0.493x + 16,614 | 0.990 |
| Hexanal | 66-25-1 | y = 0.823x + 7473 | 0.999 |
| n-Octanal | 124-13-0 | y = 0.644x + 57 | 0.997 |
| Nonanal | 124-19-6 | y = 0.547x + 52,873 | 0.990 |
| (E)-2-Octenal | 2548-87-0 | y = 0.288x + 60,123 | 0.999 |
| 3-Methylthiopropanal | 3268-49-3 | y = 0.303x + 535 | 0.999 |
| Benzaldehyde | 100-52-7 | y = 0.298x + 20,557 | 0.990 |
| Decanal | 112-31-2 | y = 2.082x + 2369 | 0.998 |
| (Z)-2-Nonenal | 60784-31-8 | y = 0.032x + 1457 | 0.992 |
| Ethyl caproate | 123-66-0 | y = 0.780x + 9992 | 0.993 |
| 2-n-Pentylfuran | 3777-69-3 | y = 0.037x + 459 | 0.990 |
| 2,5-Dimethylpyrazine | 123-32-0 | y = 1.179x + 1210 | 0.998 |
| Dimethyl trisulfide | 3658-80-8 | y = 0.451x + 2321 | 0.996 |
| Diallyl disulfide | 2179-57-9 | y = 0.280x + 1840 | 0.993 |
| Compounds | CAS | RI a | Significance b | n/N c | Chemical Structures |
|---|---|---|---|---|---|
| Alcohols | *** | 12/15 | |||
| 1-Pentanol | 71-41-0 | 1153 | ns | 3/15 |  |
| 2-Heptanol | 543-49-7 | 1215 | ** | 9/15 |  |
| 1-Octen-3-ol | 3391-86-4 | 1325 | *** | 12/15 |  |
| Aldehydes | *** | 13/15 | |||
| Hexanal | 66-25-1 | 979 | ** | 8/15 | 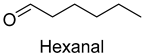 |
| Octanal | 124-13-0 | 1173 | ns | 7/15 | 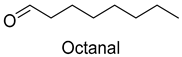 |
| Nonanal | 124-19-6 | 1277 | ns | 6/15 | 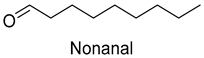 |
| (E)-2-Octenal | 2548-87-0 | 1302 | ** | 9/15 |  |
| Methional | 3268-49-3 | 1313 | ** | 9/15 | 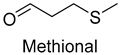 |
| Benzaldehyde | 100-52-7 | 1372 | ns | 2/15 | 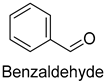 |
| Decanal | 112-31-2 | 1387 | * | 6/15 | 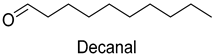 |
| (Z)-2-Nonenal | 60784-31-8 | 1414 | ns | 5/15 |  |
| Esters | *** | 13/15 | |||
| Ethyl caproate | 123-66-0 | 1122 | *** | 13/15 |  |
| Furans | ns | 5/15 | |||
| 2-Pentylfuran | 3777-69-3 | 1108 | ns | 5/15 | 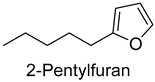 |
| Pyrazines | * | 8/15 | |||
| 2,5-Dimethylpyrazine | 123-32-0 | 1218 | * | 8/15 | 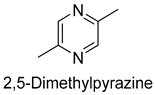 |
| Others | ** | 10/15 | |||
| Dimethyltrisulfide | 3658-80-8 | 1241 | ** | 9/15 | 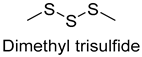 |
| Diallyl disulfide | 2179-57-9 | 1340 | ns | 3/15 | 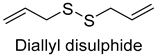 |
Disclaimer/Publisher’s Note: The statements, opinions and data contained in all publications are solely those of the individual author(s) and contributor(s) and not of MDPI and/or the editor(s). MDPI and/or the editor(s) disclaim responsibility for any injury to people or property resulting from any ideas, methods, instructions or products referred to in the content. |
© 2025 by the authors. Licensee MDPI, Basel, Switzerland. This article is an open access article distributed under the terms and conditions of the Creative Commons Attribution (CC BY) license (https://creativecommons.org/licenses/by/4.0/).
Share and Cite
Xu, M.; Kang, Y.; Wang, Y.; Li, L.; Liu, Y.; Xiang, Q.; Lin, H.; Liu, P.; Tang, J. Characterization of Key Aroma Compounds in Dongpo Pork Dish and Their Dynamic Changes During Storage. Foods 2025, 14, 1084. https://doi.org/10.3390/foods14071084
Xu M, Kang Y, Wang Y, Li L, Liu Y, Xiang Q, Lin H, Liu P, Tang J. Characterization of Key Aroma Compounds in Dongpo Pork Dish and Their Dynamic Changes During Storage. Foods. 2025; 14(7):1084. https://doi.org/10.3390/foods14071084
Chicago/Turabian StyleXu, Min, Yang Kang, Ying Wang, Lan Li, Yu Liu, Qin Xiang, Hongbin Lin, Ping Liu, and Jie Tang. 2025. "Characterization of Key Aroma Compounds in Dongpo Pork Dish and Their Dynamic Changes During Storage" Foods 14, no. 7: 1084. https://doi.org/10.3390/foods14071084
APA StyleXu, M., Kang, Y., Wang, Y., Li, L., Liu, Y., Xiang, Q., Lin, H., Liu, P., & Tang, J. (2025). Characterization of Key Aroma Compounds in Dongpo Pork Dish and Their Dynamic Changes During Storage. Foods, 14(7), 1084. https://doi.org/10.3390/foods14071084