
Gelatin–Tea Tree Essential Oil Coating Improves the Quality, Flavor, and Micromolecular Metabolites of Squid (Illex argentinus) Muscle During Cold Storage


Abstract

1. Introduction
2. Materials and Methods
2.1. Materials
2.2. Sample Pretreatment
2.3. Determination of Water-Holding Capacity
2.4. pH Assay
2.5. Determination of Total Volatile Basic Nitrogen (TVB-N)
2.6. Color Measurement
2.7. Texture Determination
2.8. Aroma Profile Analysis
2.9. Microorganism Diversity Test
2.10. Statistical Analysis
3. Results and Discussions
3.1. Changes in the Quality of Refrigerated Squid Muscle
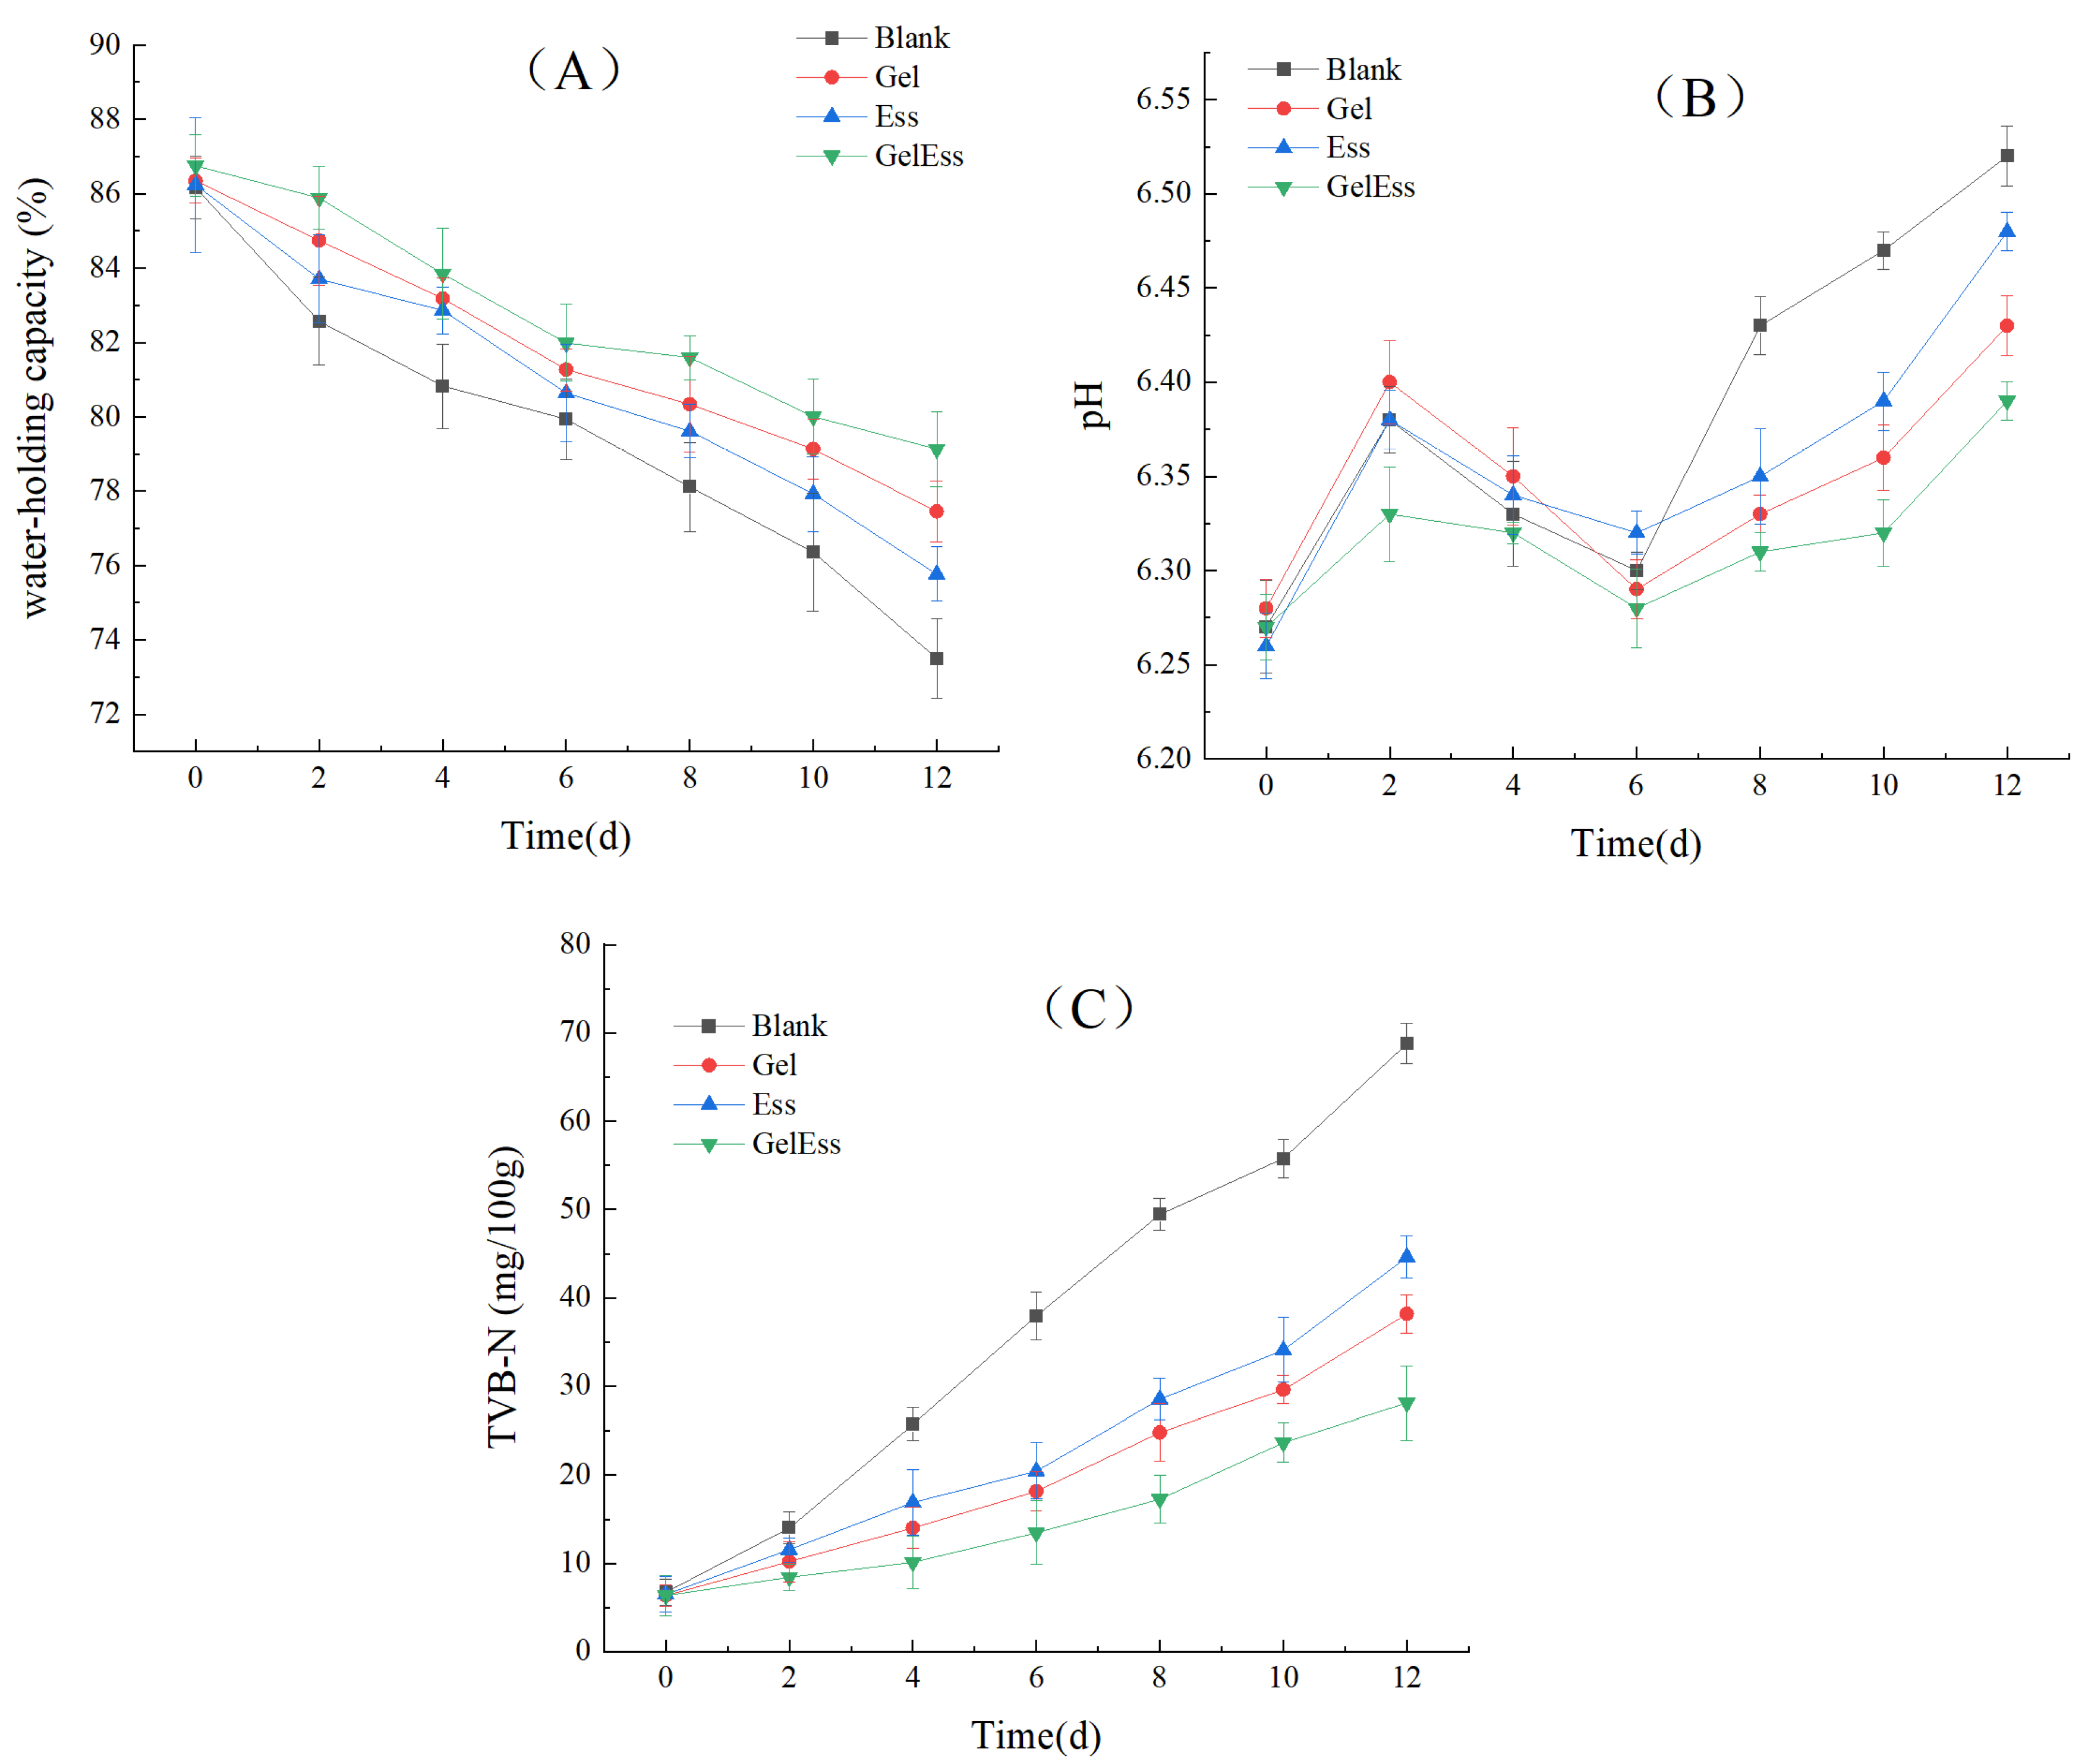
3.1.1. Water-Holding Capacity
3.1.2. pH
3.1.3. TVB-N
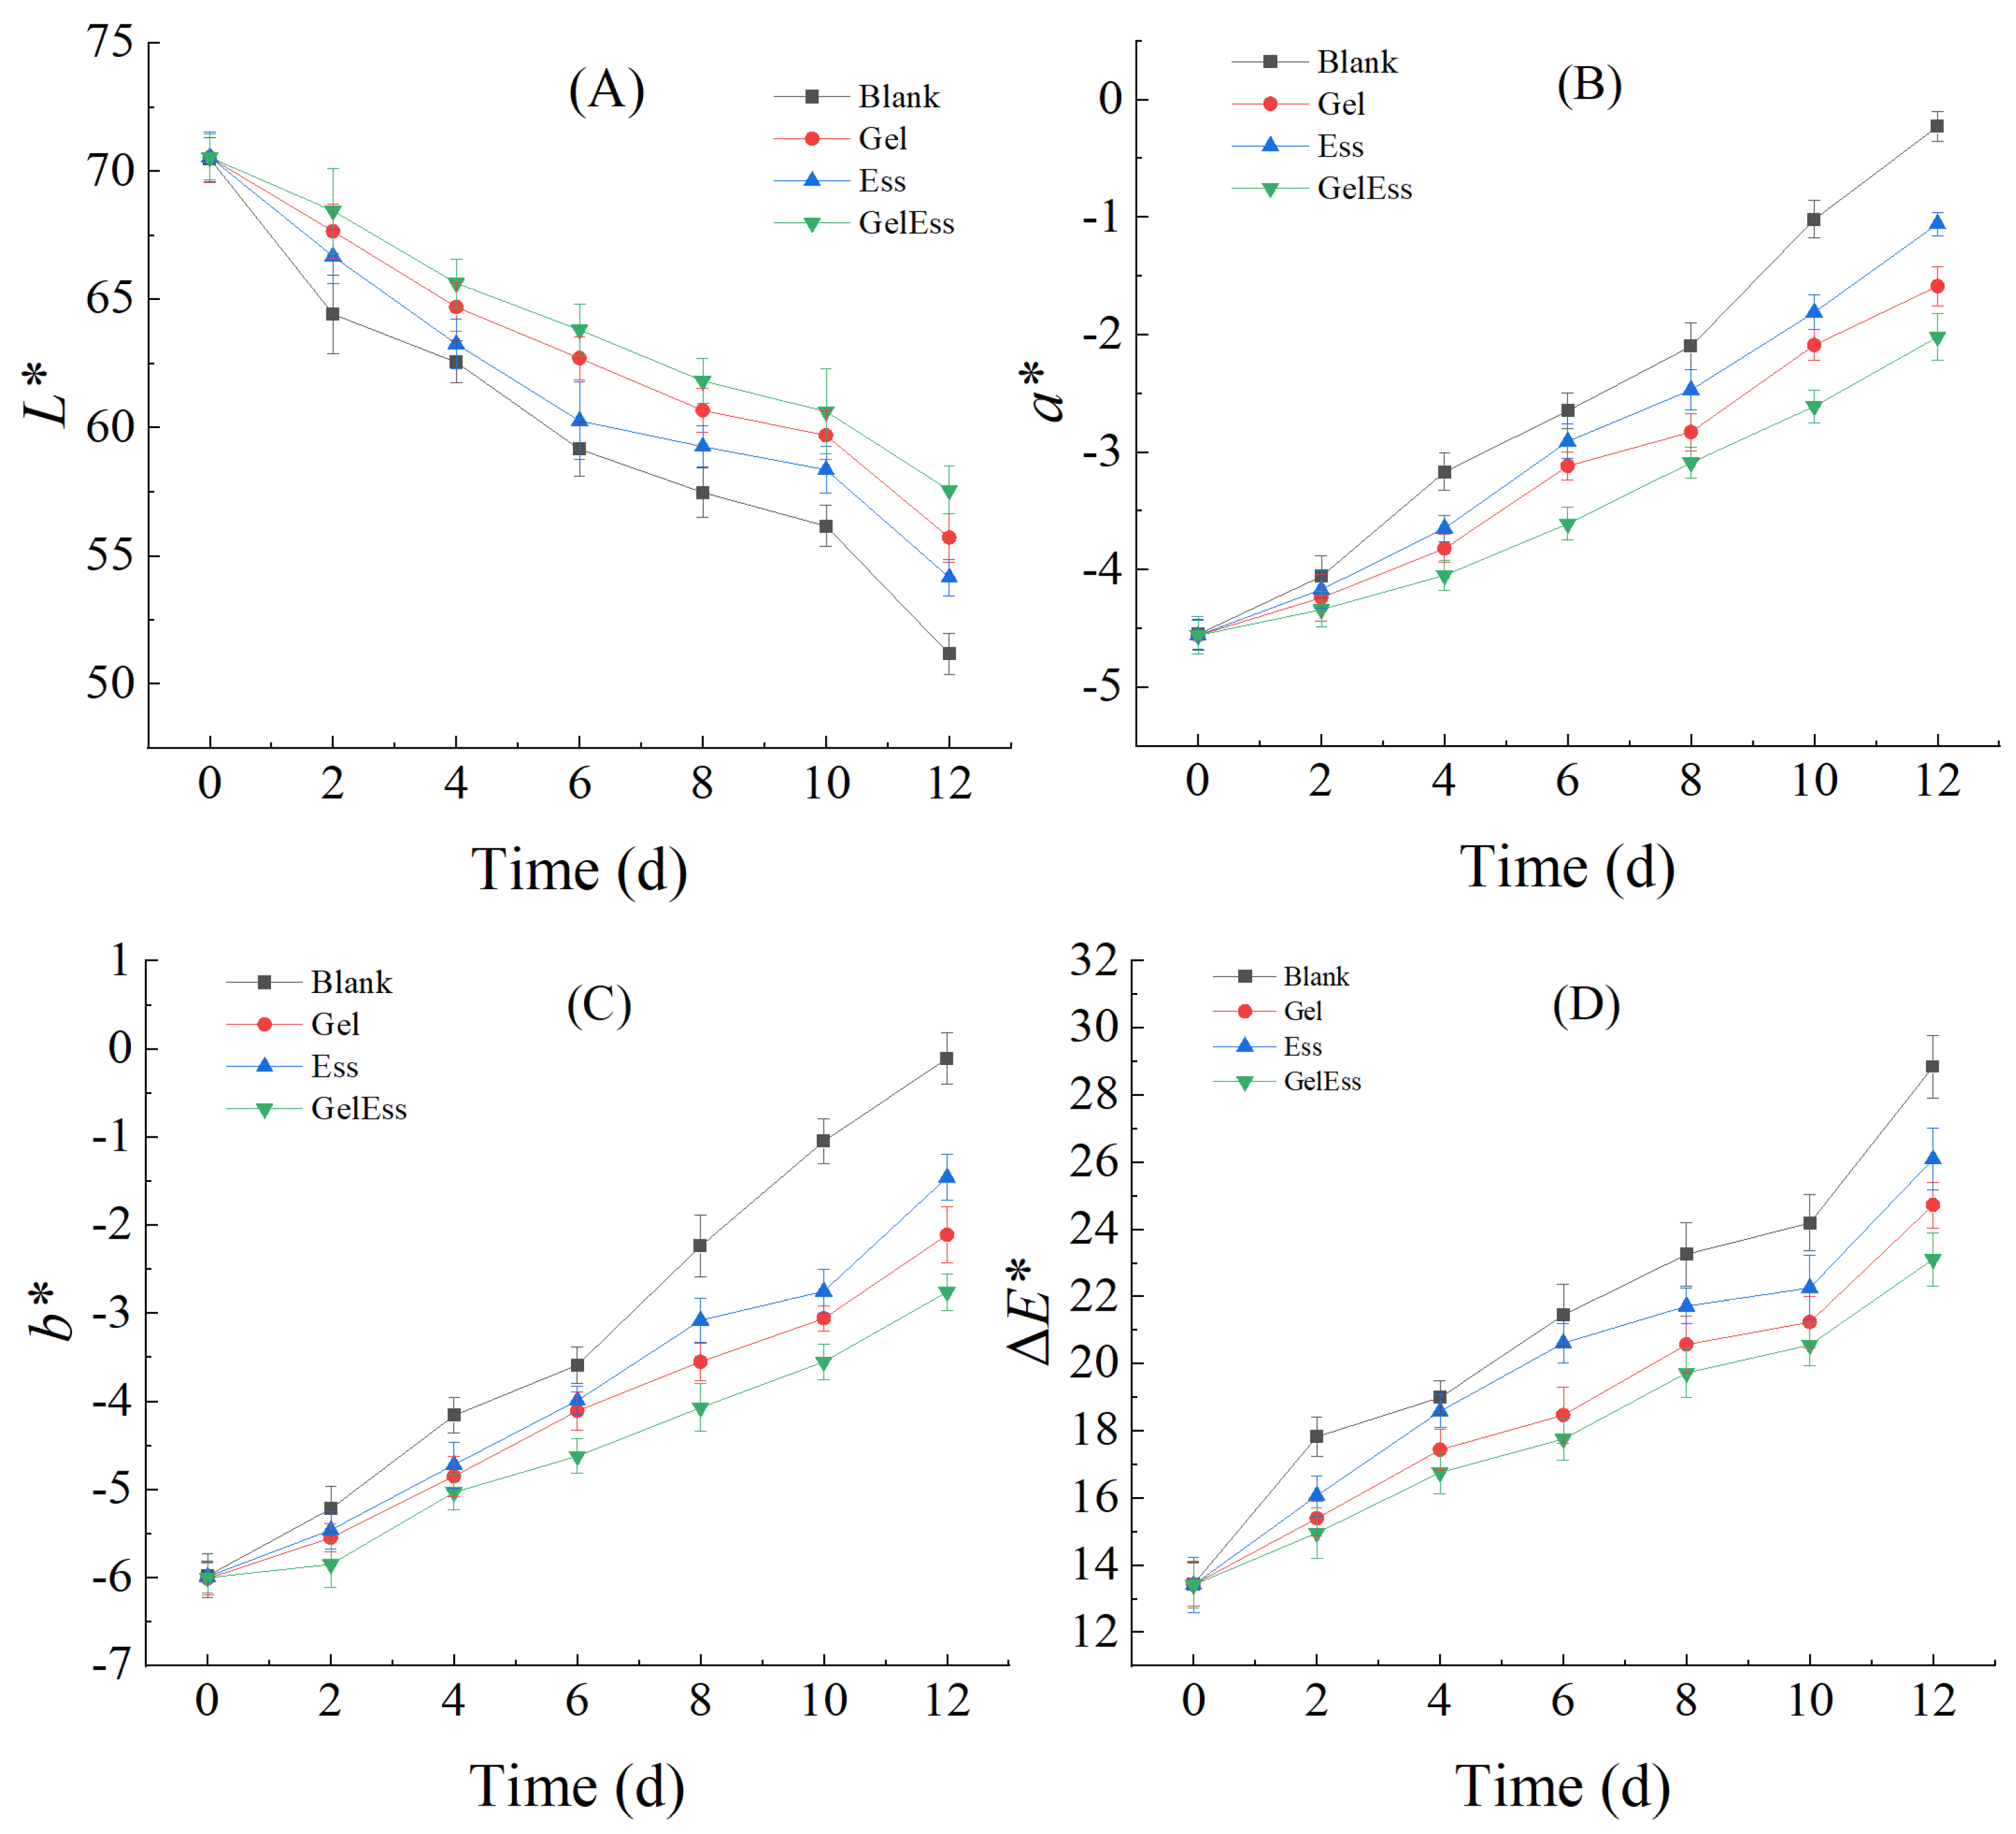
3.1.4. Color Change
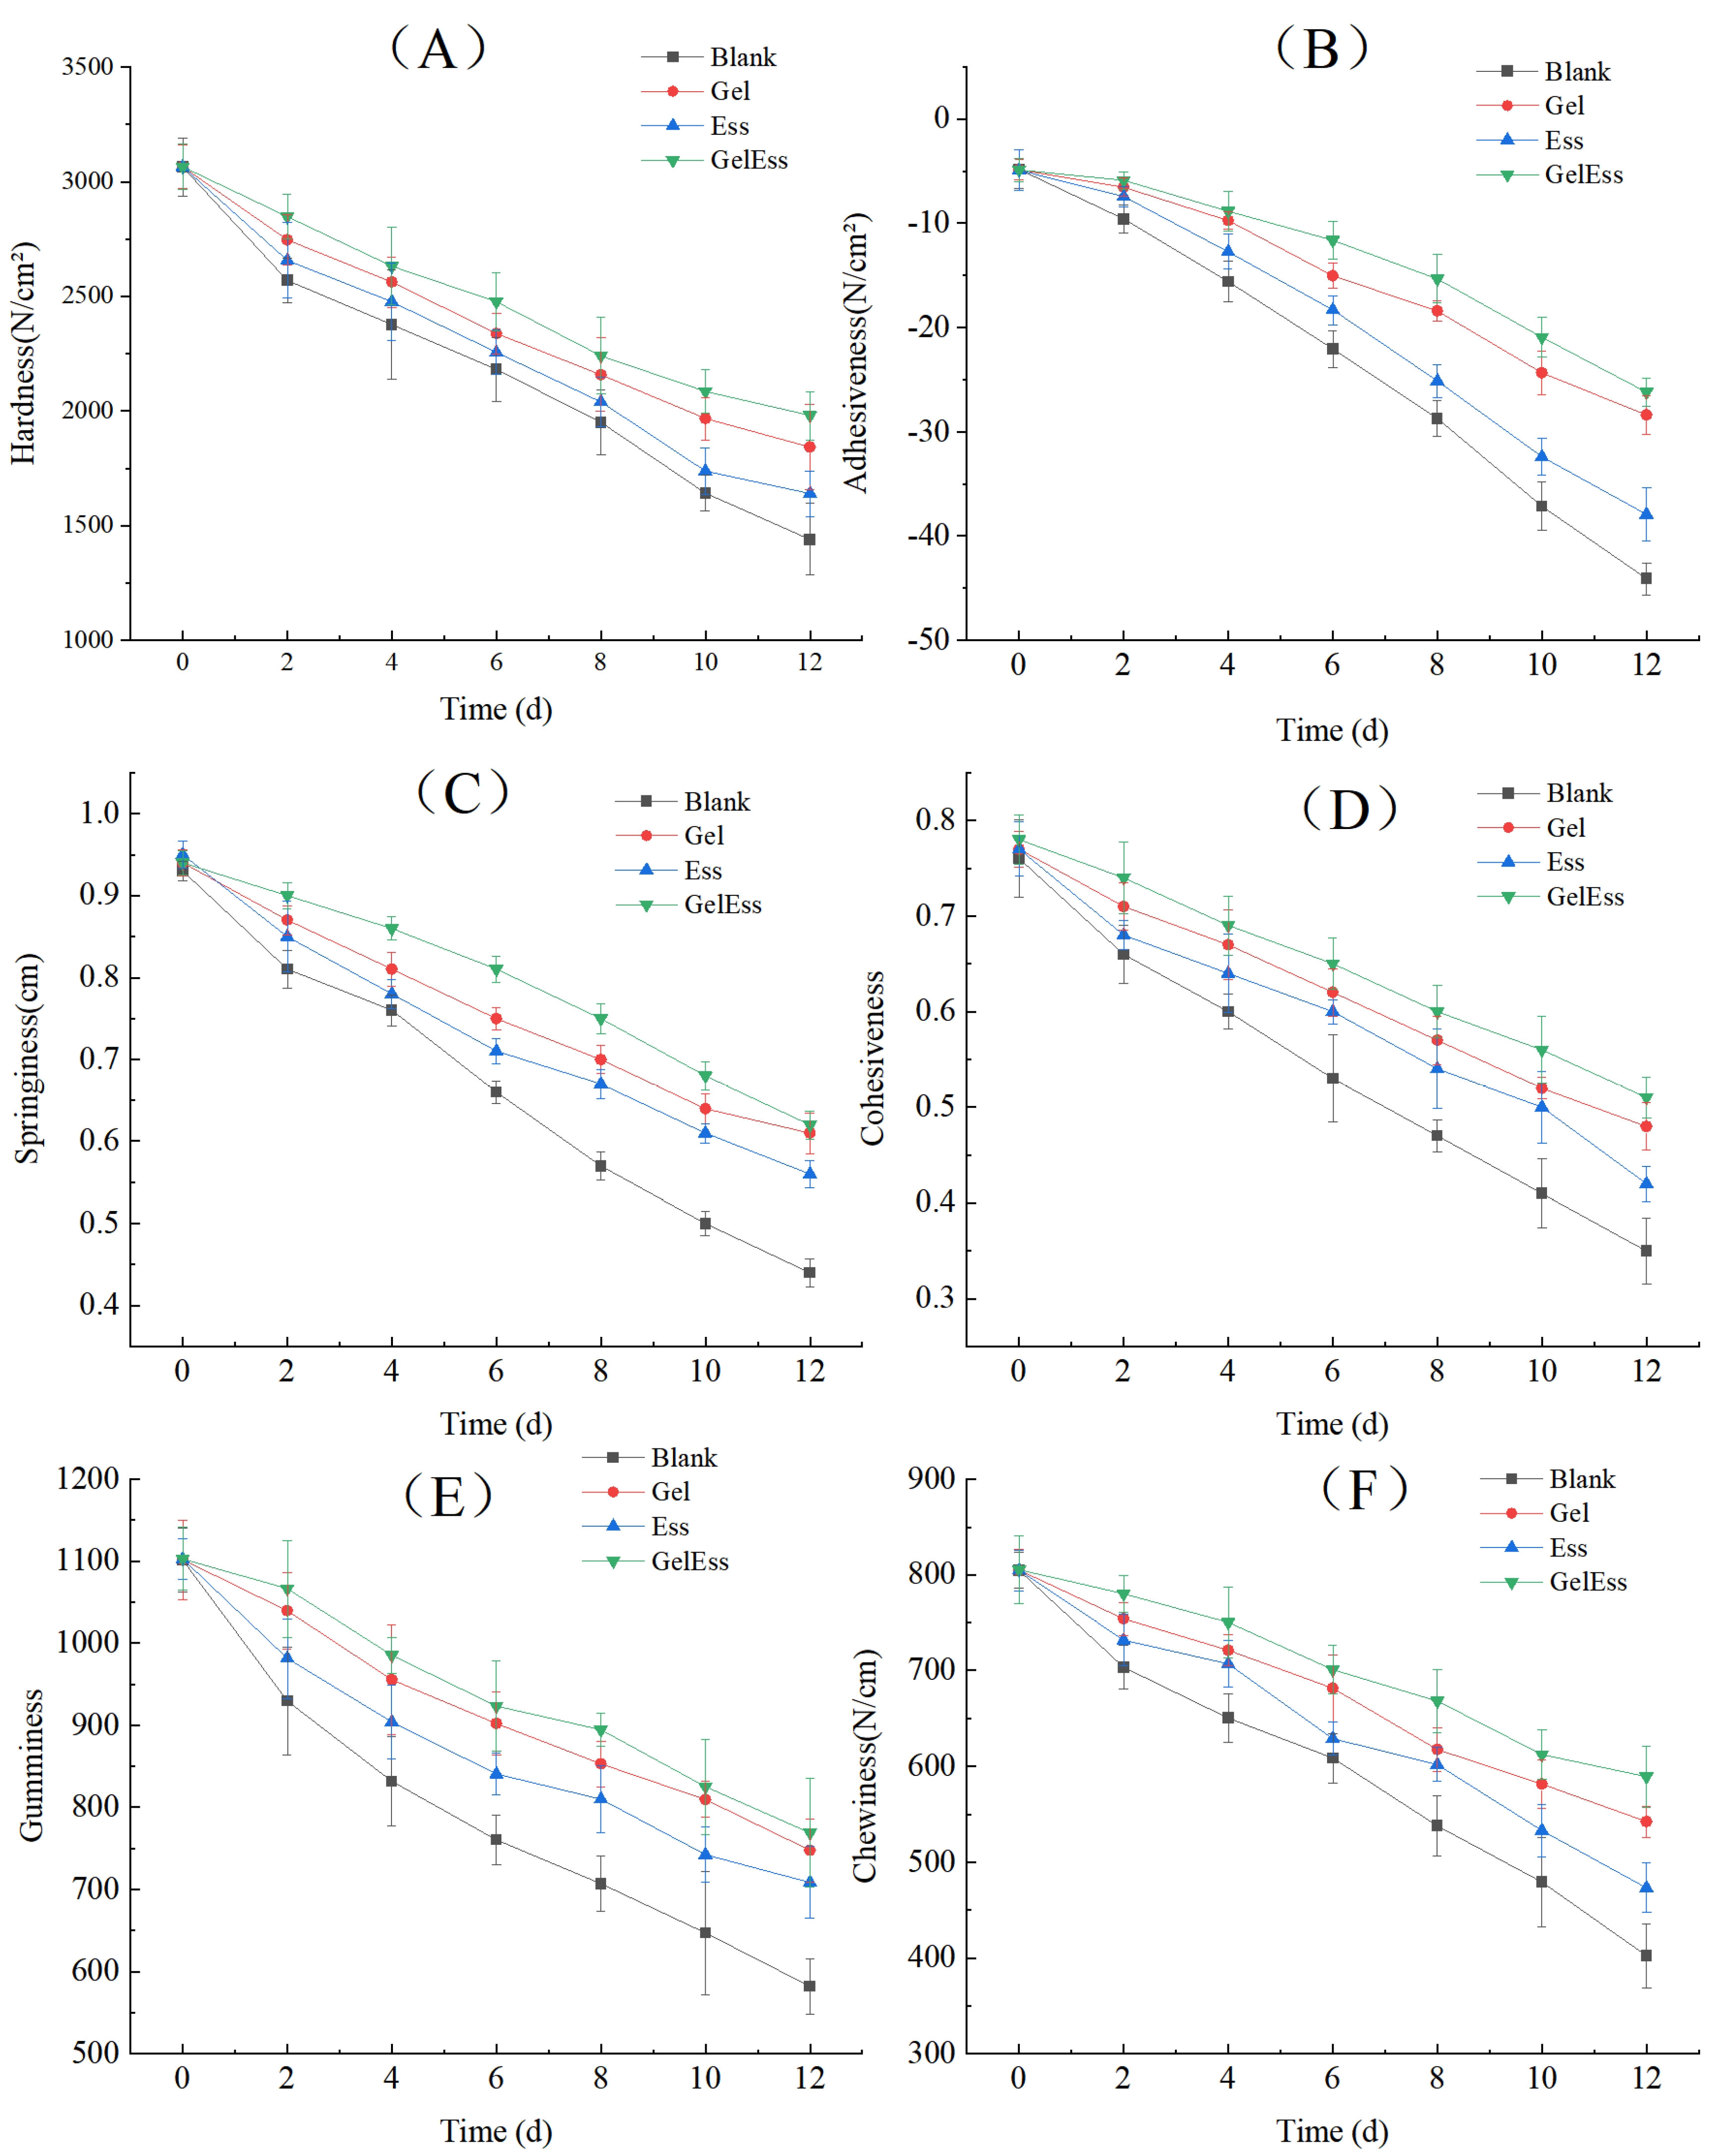
3.1.5. Texture Profile
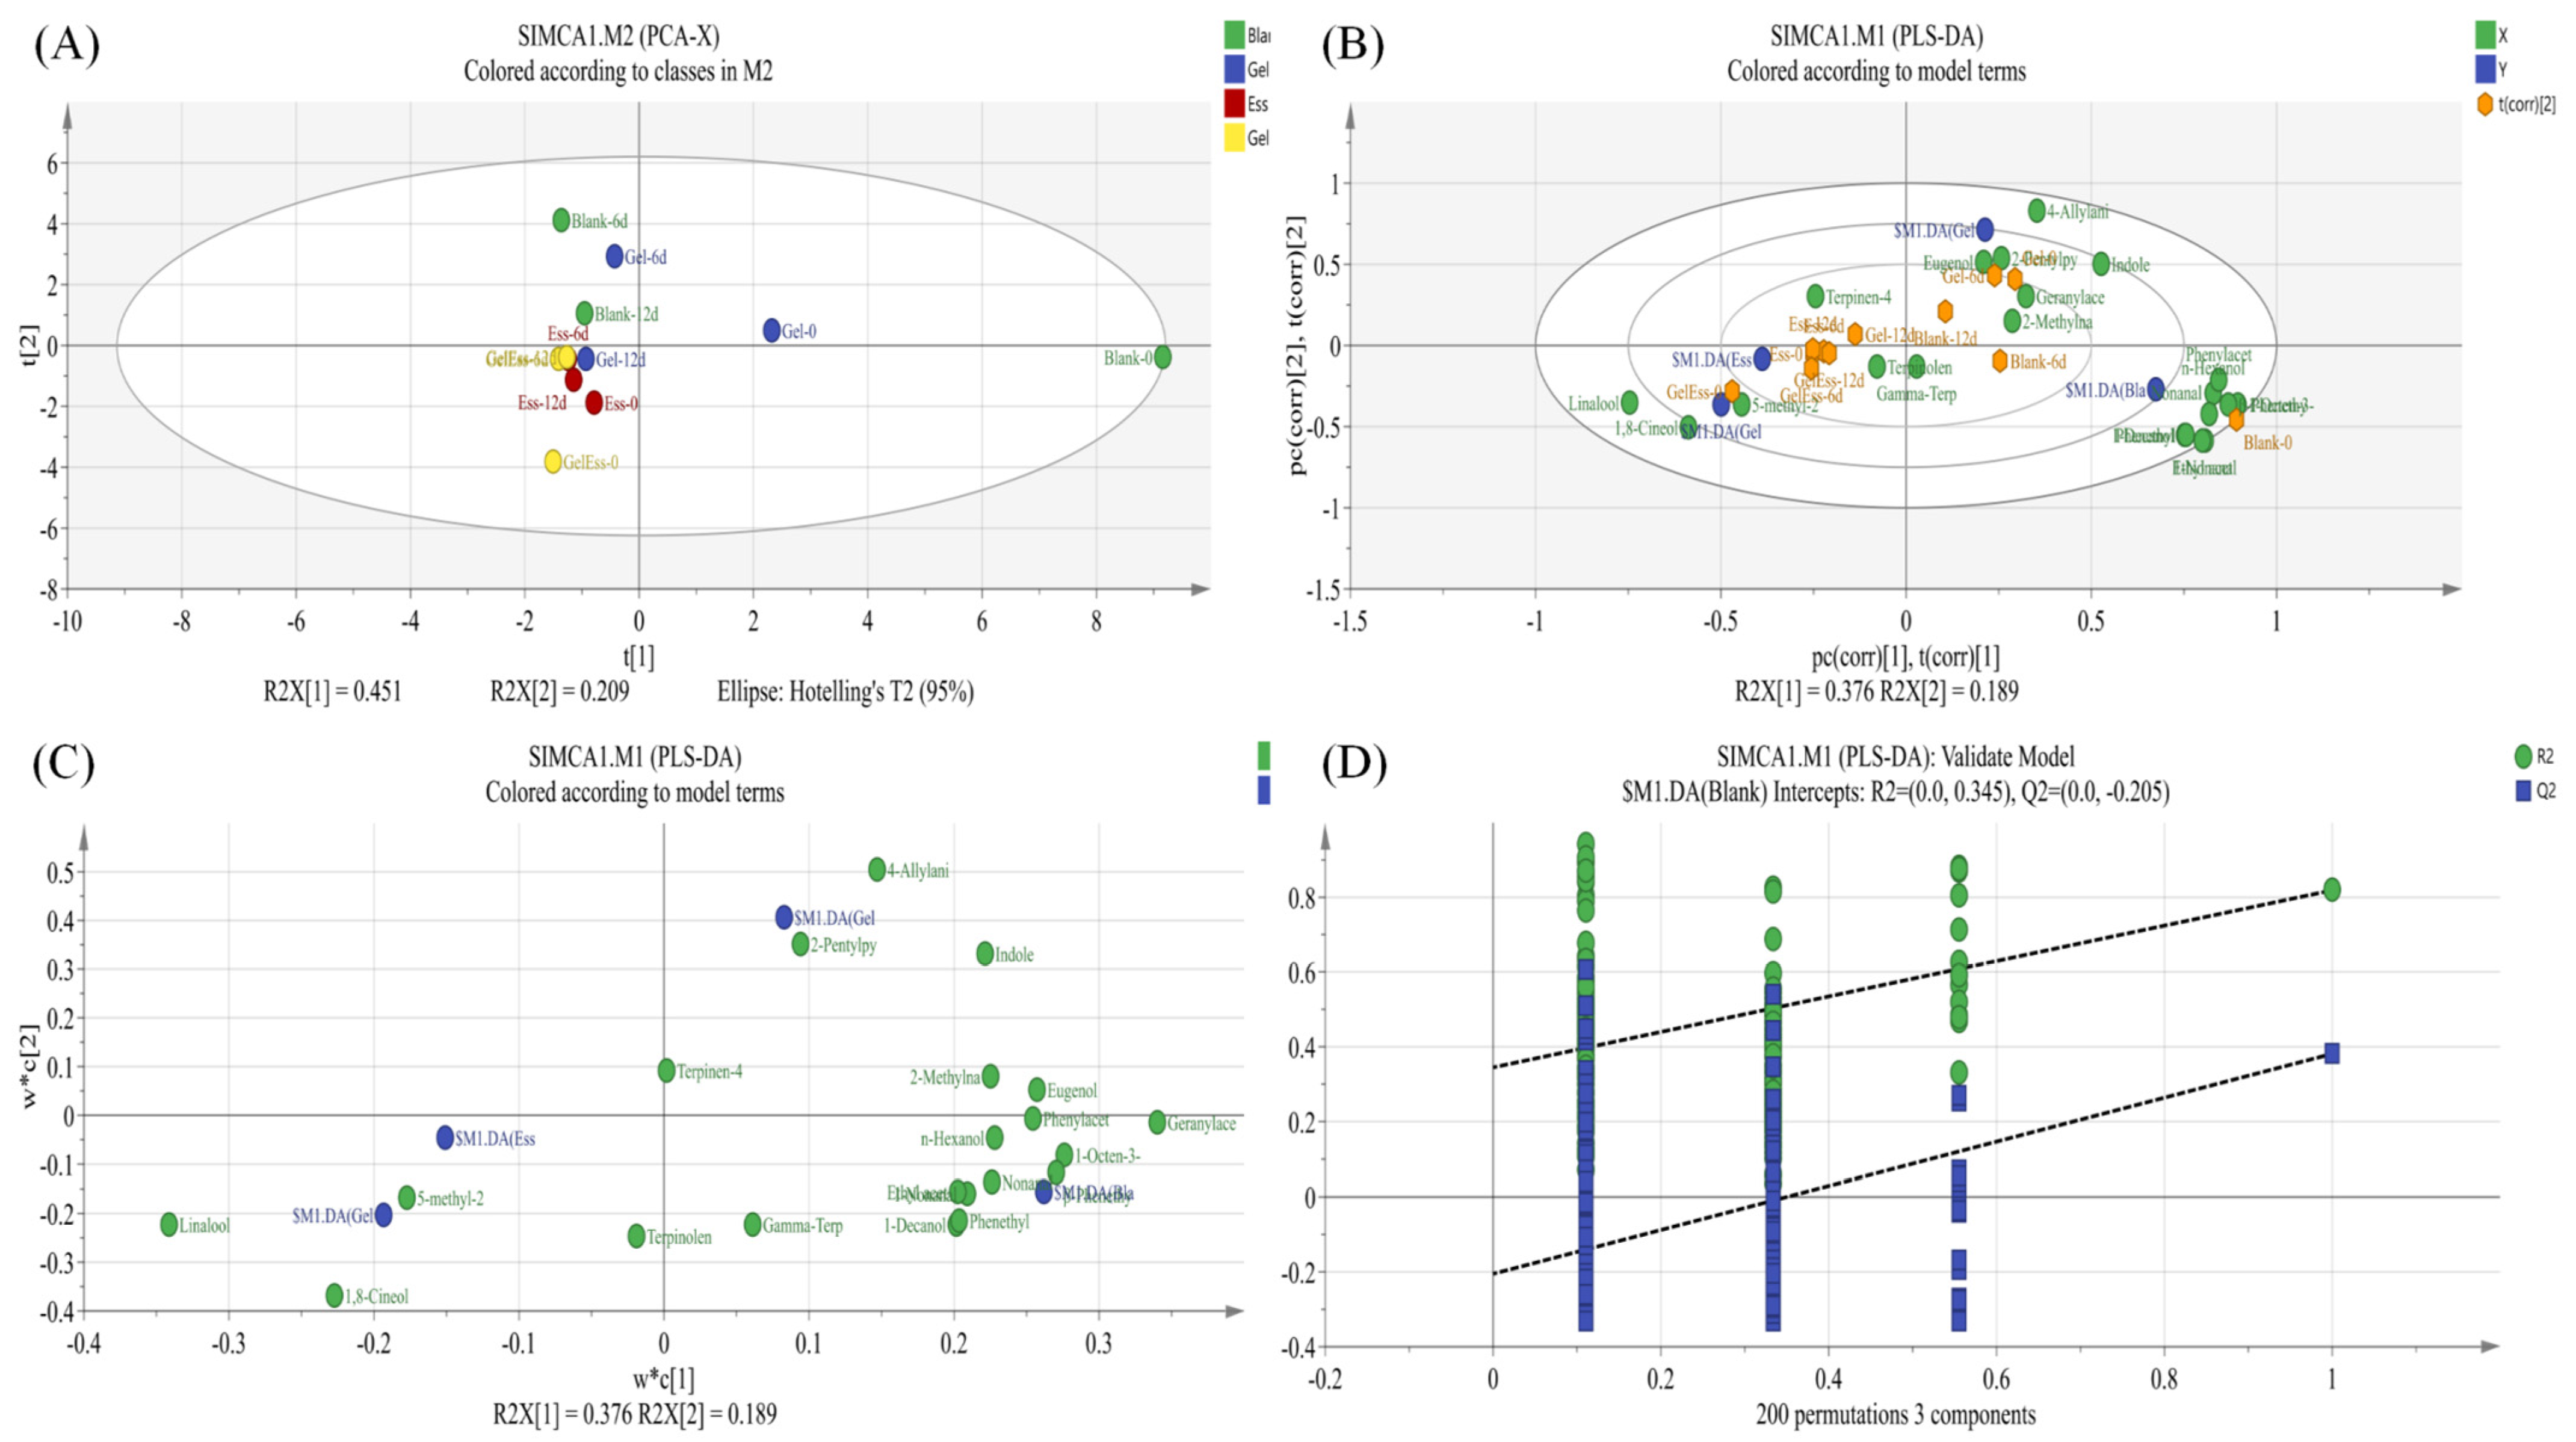
3.2. Changes in the Volatile Flavor of Refrigerated Squid Muscle
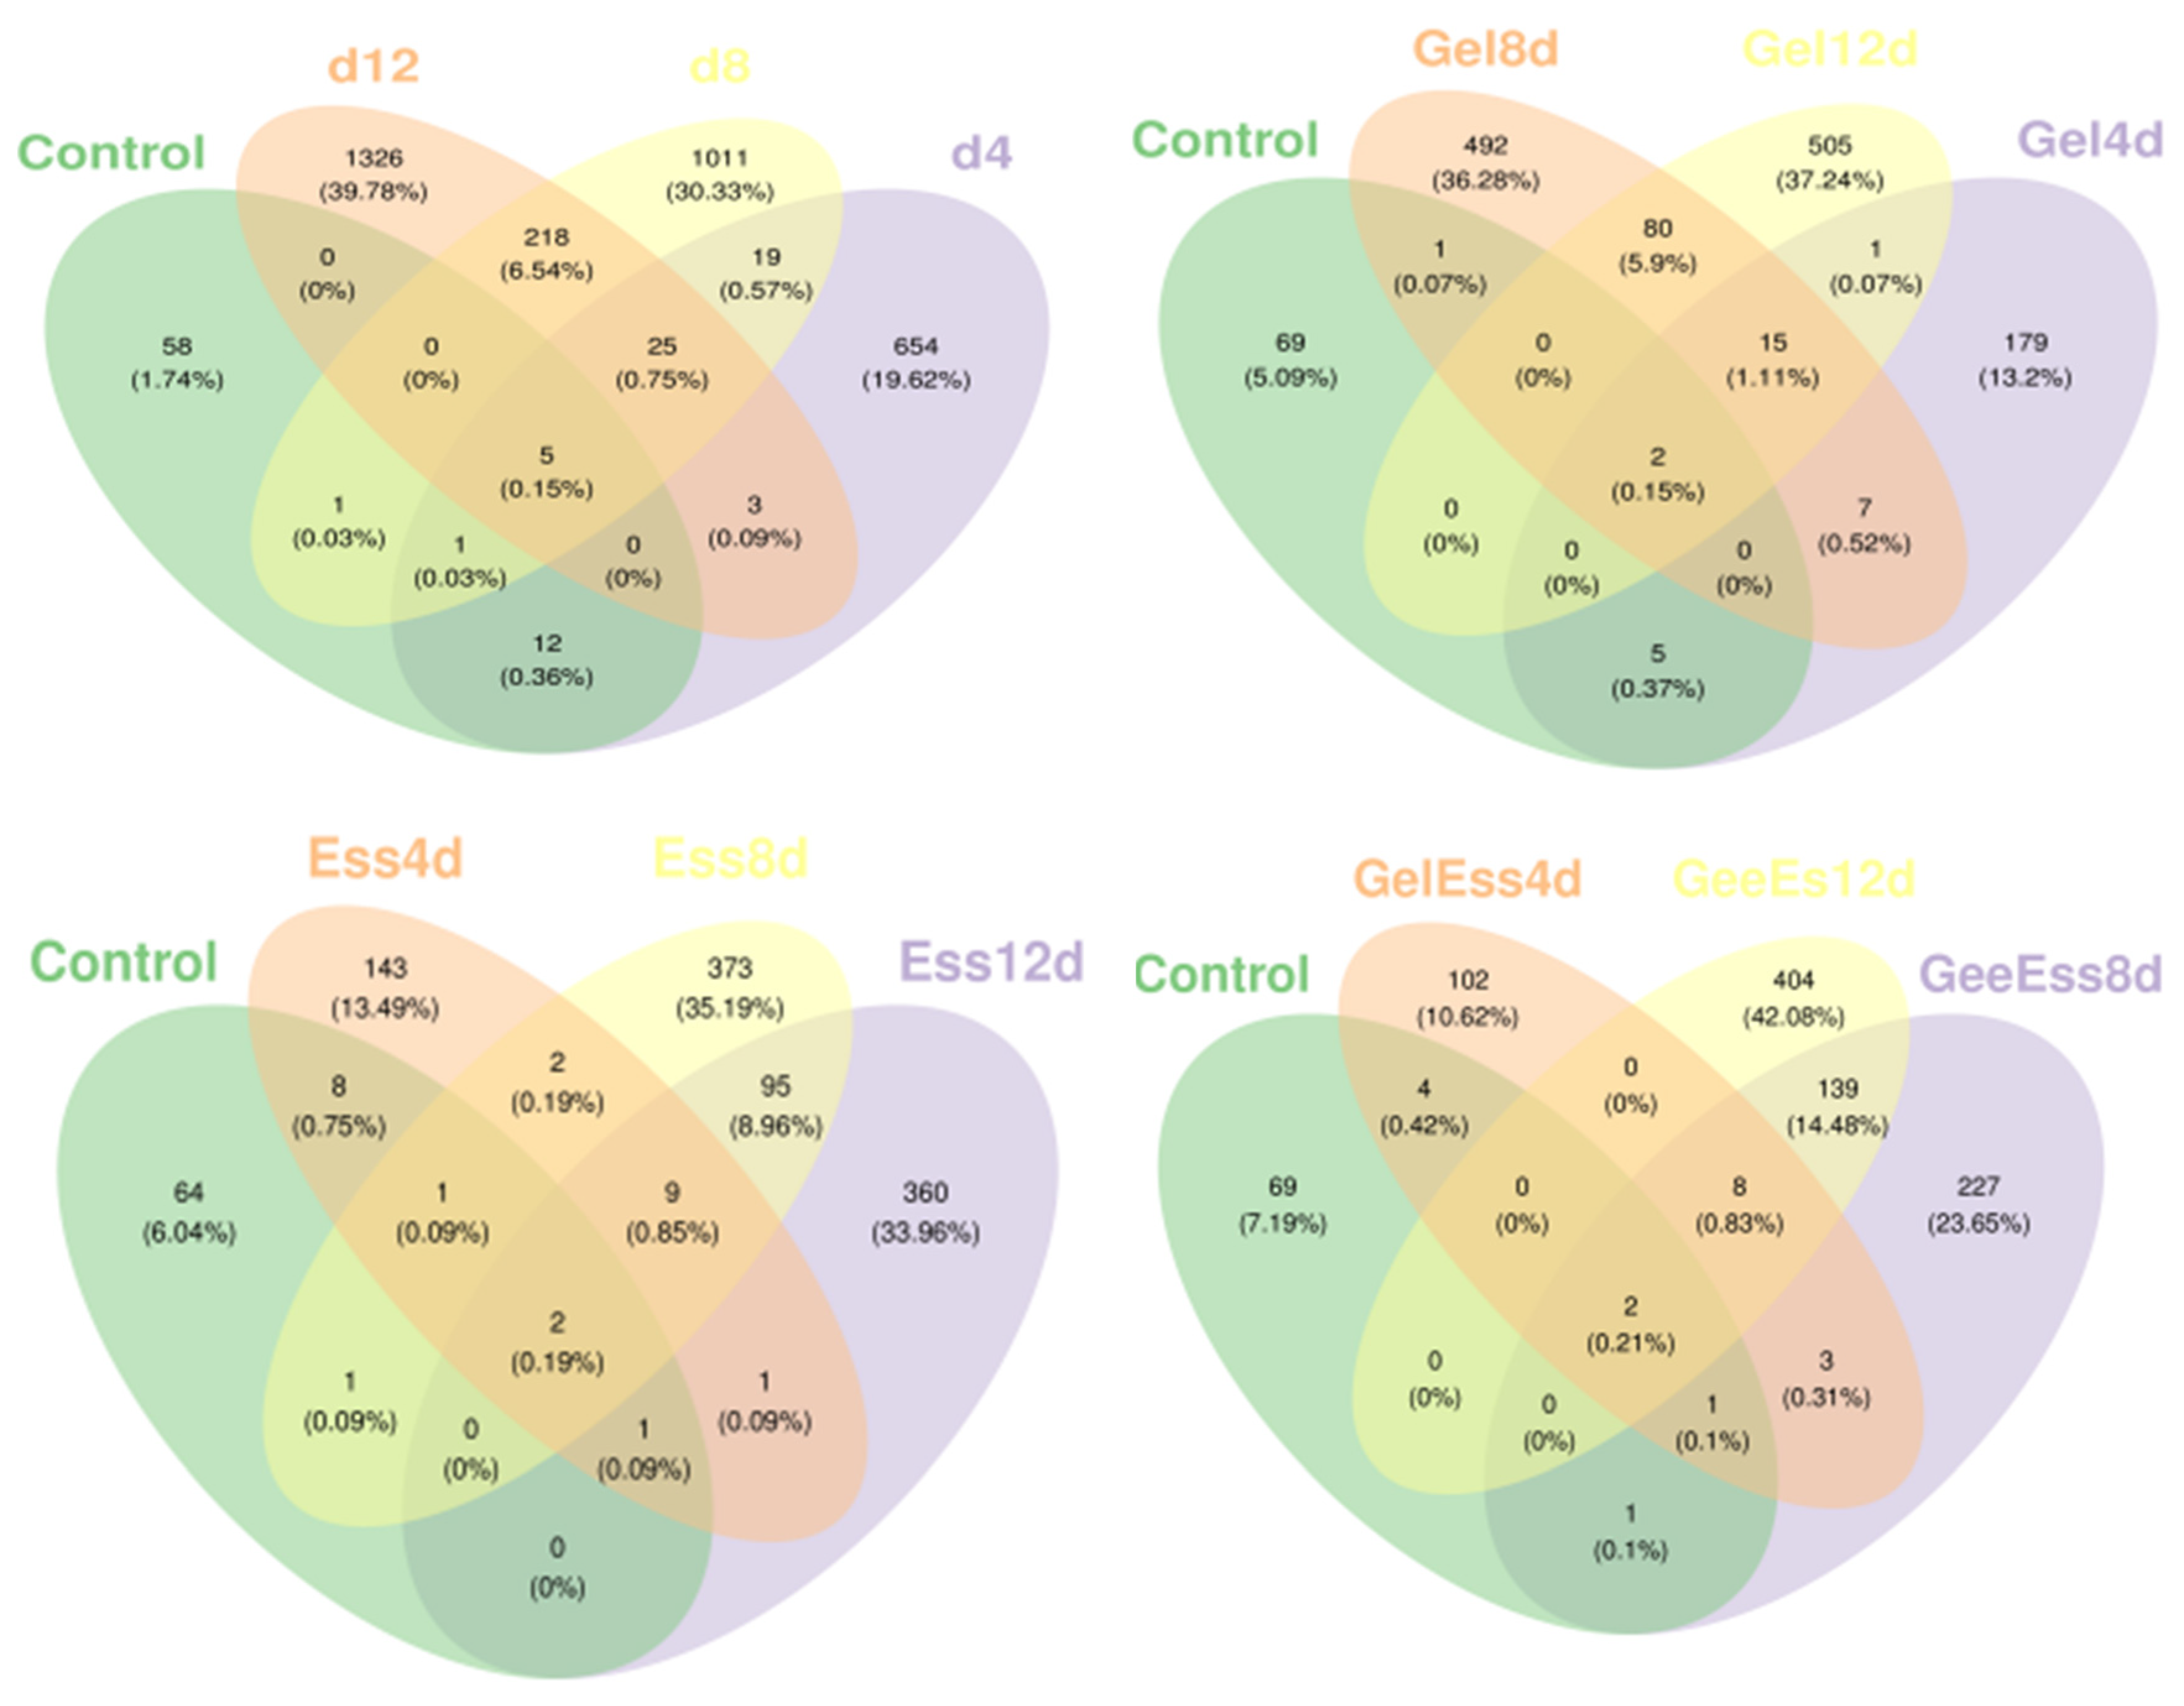
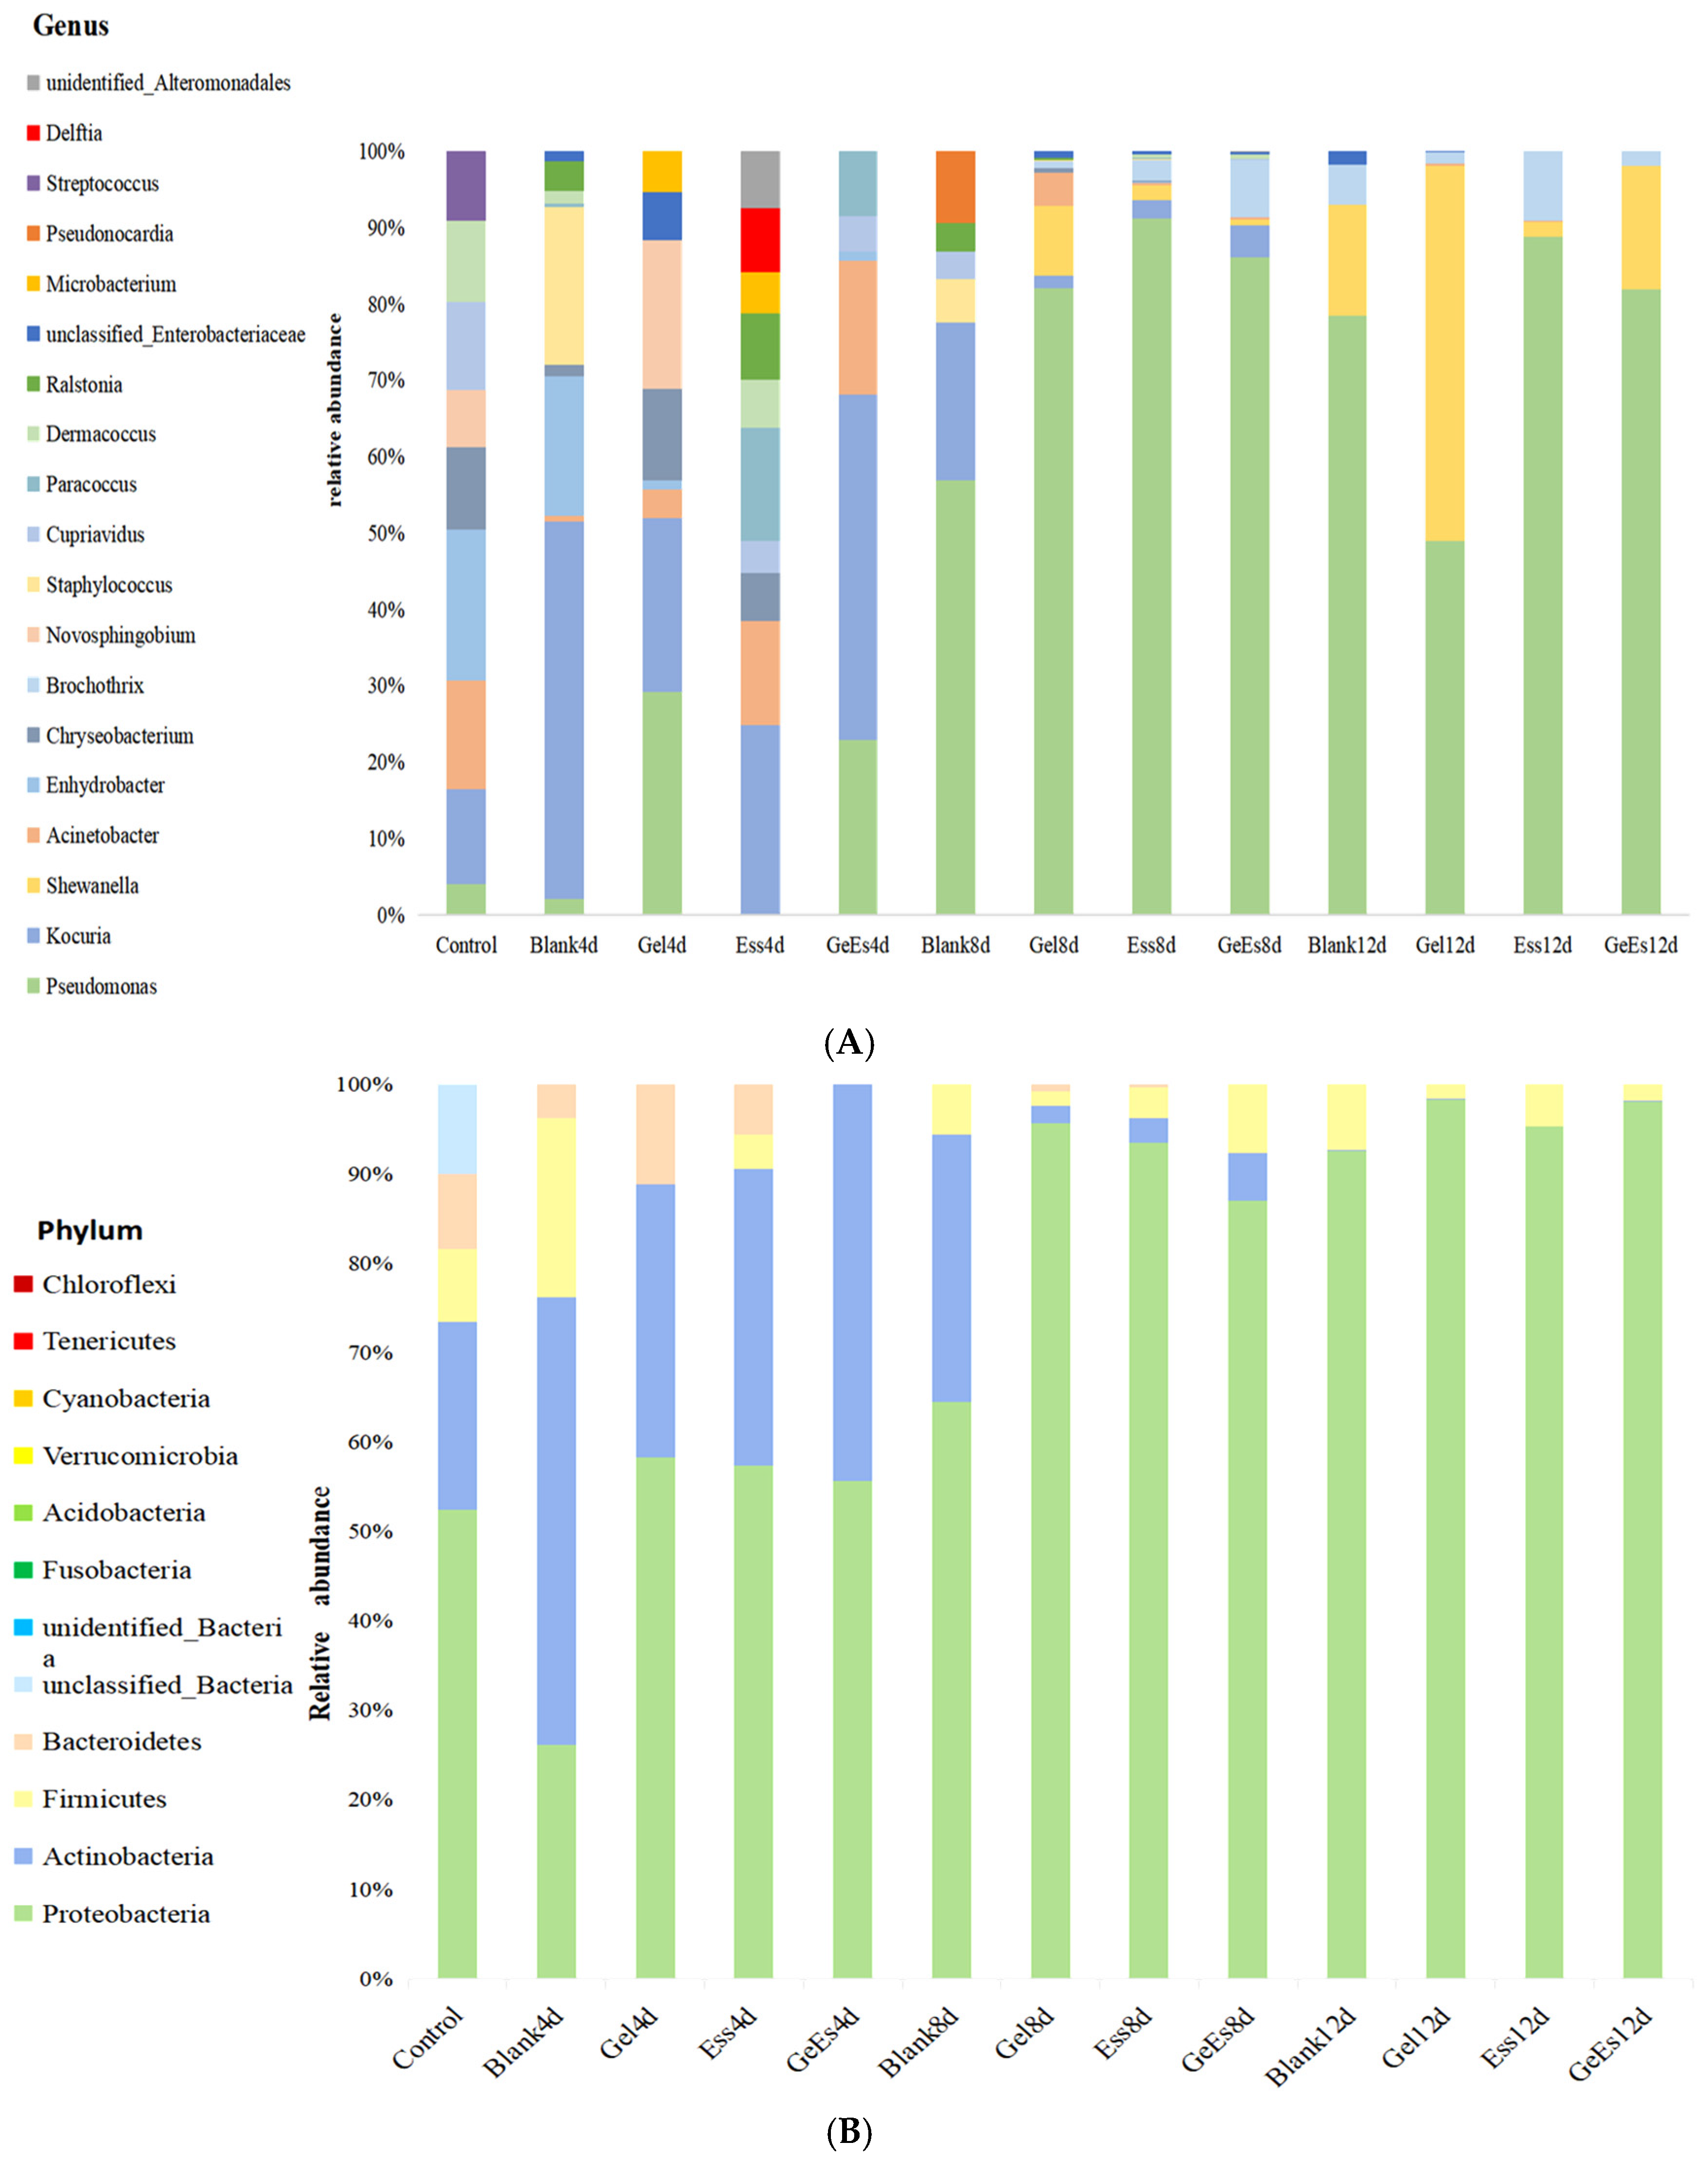
3.3. Changes in the Microorganisms of Refrigerated Squid Muscle
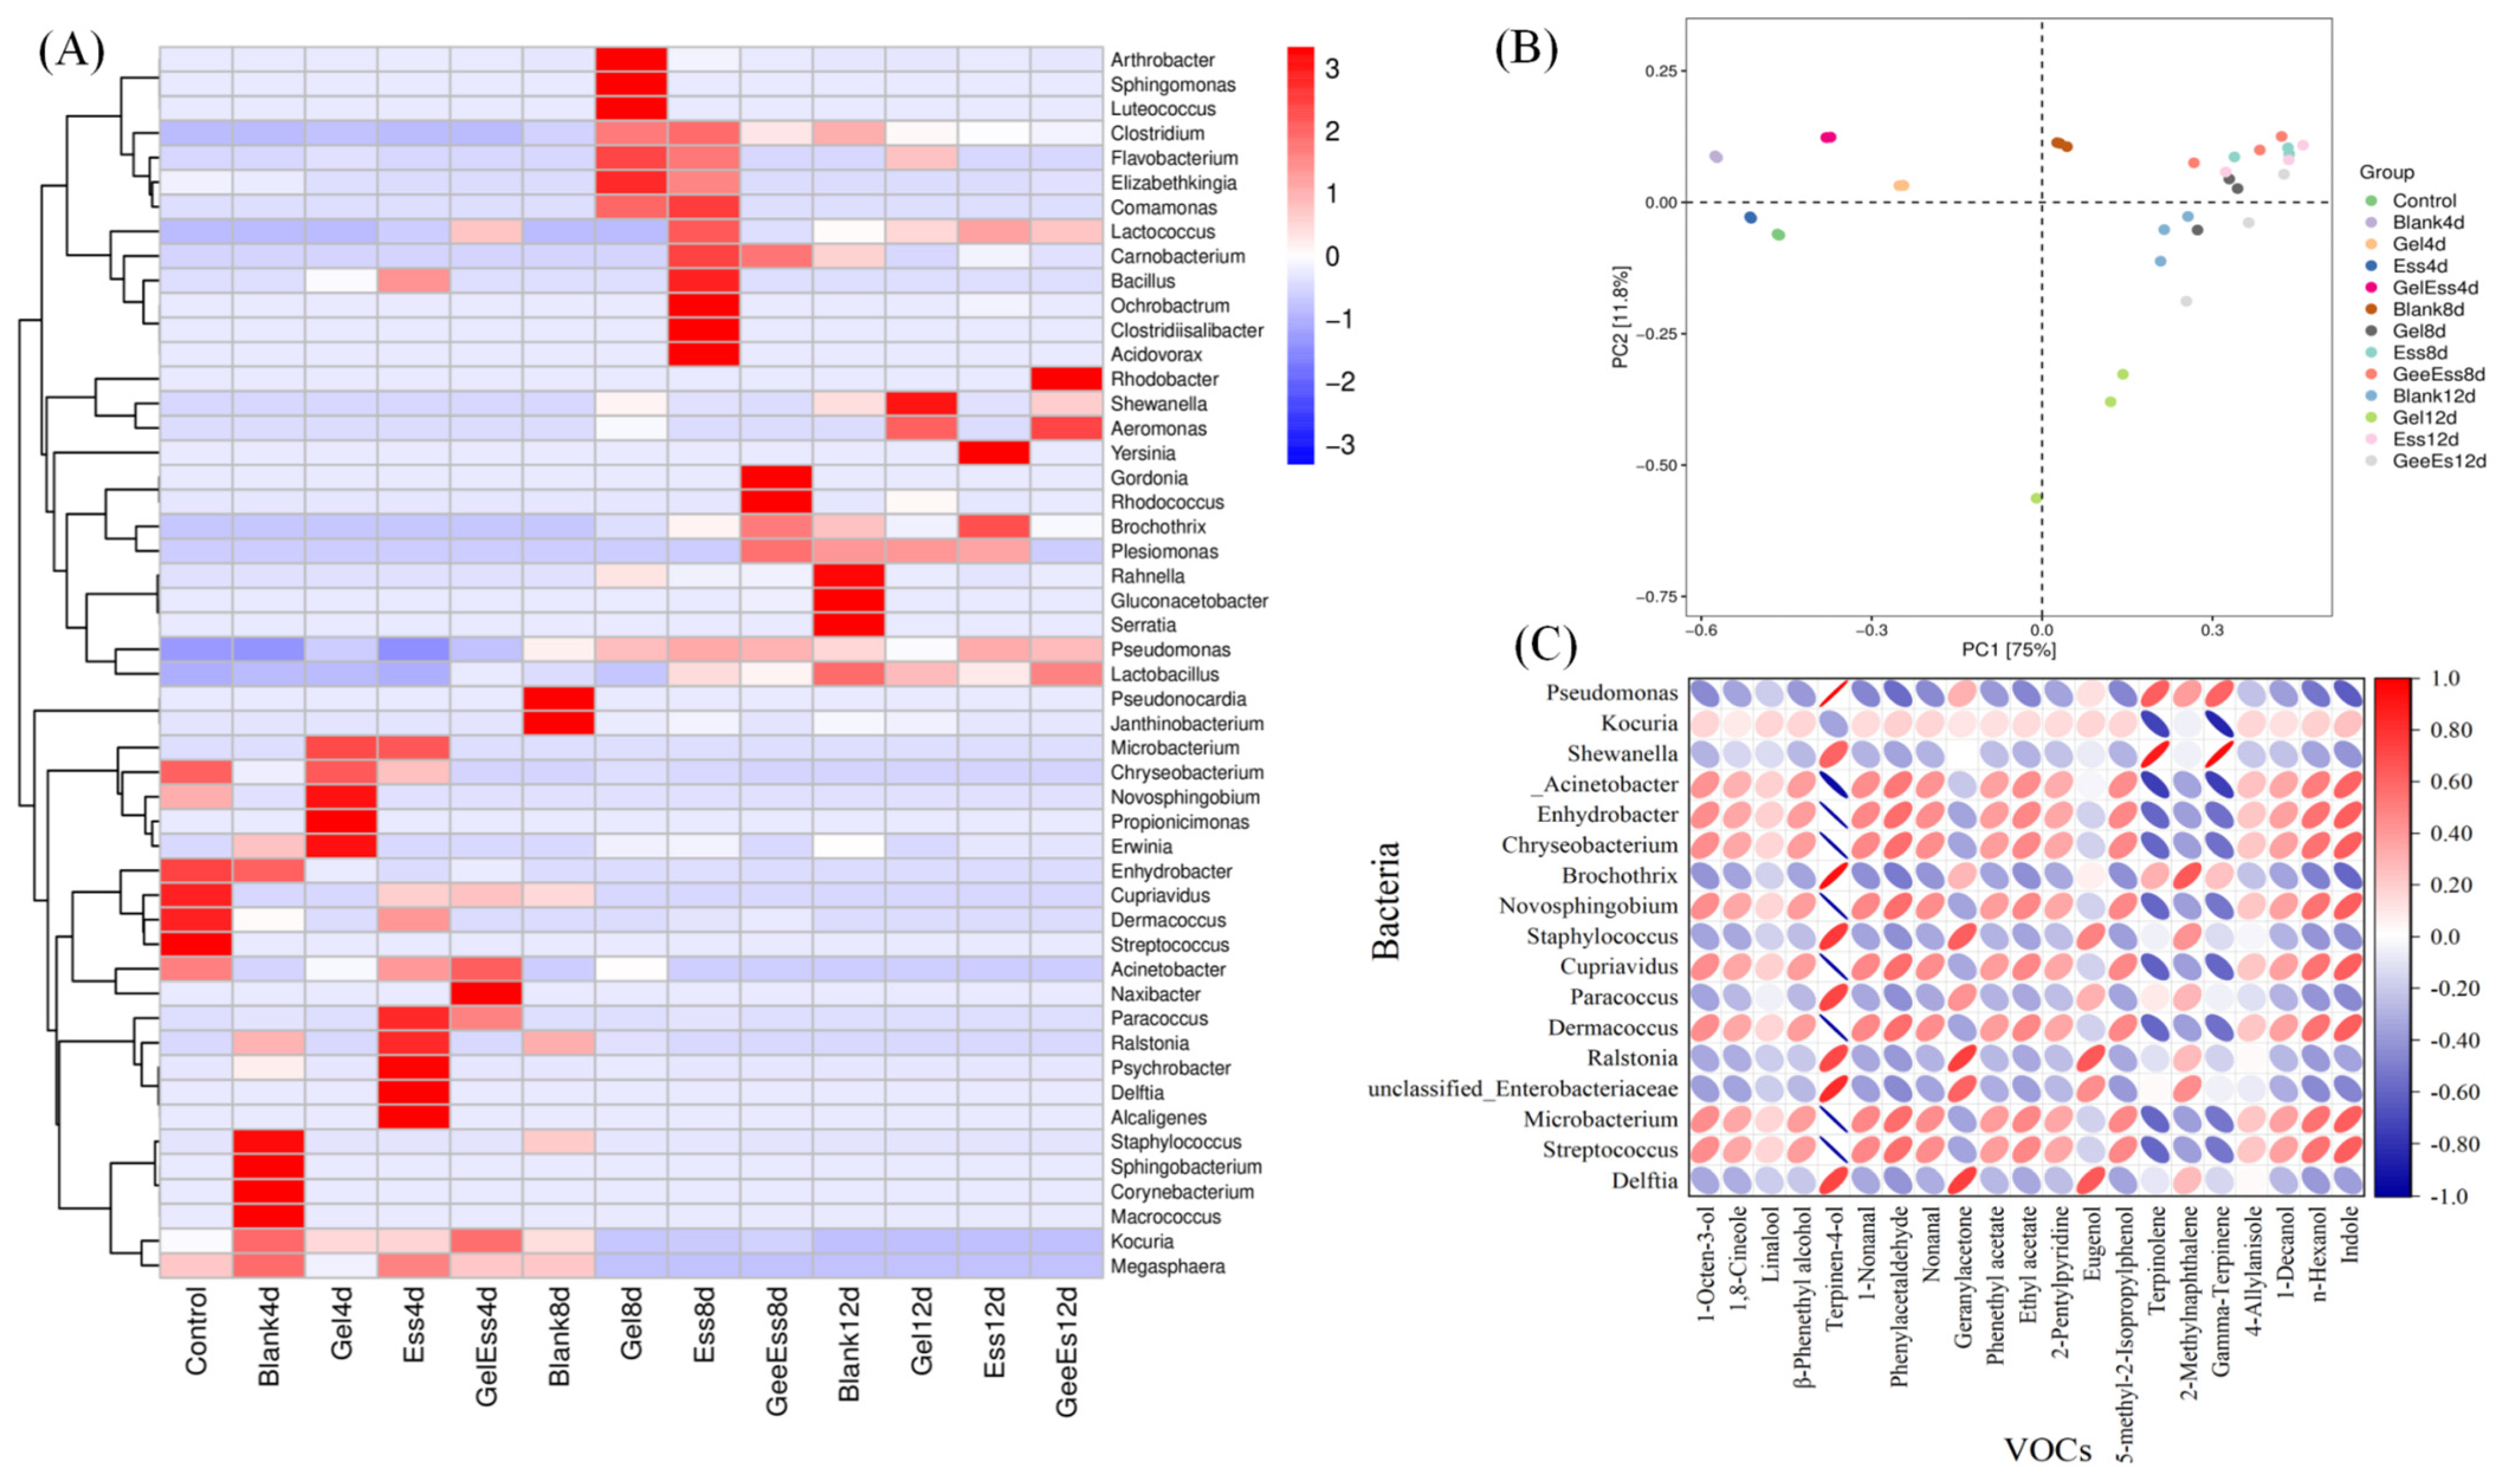
3.4. Correlation Analysis of Volatile Flavor Substances and Microorganisms in Gel + Ess Coating Squid Muscle
4. Conclusions
Supplementary Materials
Author Contributions
Funding
Institutional Review Board Statement
Informed Consent Statement
Data Availability Statement
Conflicts of Interest
References
- Yu, W.; Feng, X.L.; Wen, J.; Wu, X.C.; Fang, X.N.; Cui, J.; Feng, Z.P.; Sheng, Y.L.; Zhao, Z.F.; Liu, B.L.; et al. The potential impacts of climate change on the life history and habitat of jumbo flying squid in the southeast Pacific Ocean: Overview and implications for fisheries management. Rev. Fish Biol. Fish. 2025. [Google Scholar] [CrossRef]
- Wang, Y.P.; Zhang, H.M.; Zhang, S.F.; Niu, W.B. Squid-inspired photonic-ionic skin with anti-freezing, drying-tolerance, and antibacterial abilities for wirelessly interactive multi-sensing. Chem. Eng. J. 2023, 462, 142290. [Google Scholar] [CrossRef]
- Wang, J.X.; Xu, Z.; Lu, W.; Zhou, X.X.; Liu, S.L.; Zhu, S.C.; Ding, Y.T. Improving the texture attributes of squid meat (Sthenoteuthis oualaniensis) with slight oxidative and phosphate curing treatments. Food Res. Int. 2024, 176, 113829. [Google Scholar] [CrossRef] [PubMed]
- Wibowo, C.; Salsabila, S.; Muna, A. Advanced biopolymer-based edible coating technologies for food preservation and packaging. Compr. Rev. Food Sci. Food Saf. 2024, 23, e13275. [Google Scholar] [CrossRef]
- Yan, J.; He, S.; Chen, L. Effect of gelatin-chitosan-Cyclocarya paliurus flavonoids edible coating film on the preservation of chilled beef. LWT 2024, 199, 116138. [Google Scholar] [CrossRef]
- Liu, Y.N.; Wang, R.; Wang, D.B.; Sun, Z.L.; Liu, F.; Zhang, D.Q.; Wang, D.Y. Development of a food packaging antibacterial hydrogel based on gelatin, chitosan, and 3-phenyllactic acid for the shelf-life extension of chilled chicken. Food Hydrocoll. 2022, 127, 107546. [Google Scholar] [CrossRef]
- Zhang, L.; Yu, Y. Improving the stability of water-in-oil emulsions with medium internal phase by the introduction of gelatin. Foods 2023, 12, 2863. [Google Scholar] [CrossRef]
- Akhter, R.; Masoodi, F.A.; Wani, T.A. Chitosan, gelatin and pectin basedbionanocomposite films with rosemary essential oil as an active ingredient for future foods. Int. J. Biol. Macromol. 2024, 272, 132813. [Google Scholar] [CrossRef]
- Li, J.; Li, Z.; Deng, S.; Benjakul, S.; Zhang, B.; Huo, J. Effects of Heating Treatment on the Physicochemical and Volatile Flavor Properties of Argentinian Shortfin Squid (Illex argentinus). Foods 2024, 13, 1025. [Google Scholar] [CrossRef]
- Lin, F.; Huang, Z.; Chen, Y.; Zhou, L.; Chen, M.; Sun, J.; Lu, Z.; Lu, Y. Effect of combined Bacillomycin D and chitosan on growth of Rhizopus stolonifer and Botrytis cinerea and cherry tomato preservation. J. Sci. Food Agric. 2021, 101, 229–239. [Google Scholar] [CrossRef]
- Group, O.O.P.M. Tea tree oil gains traction in Cosmetics and Pharmaceuticals as consumers seek clean-label products. Outlooks Pest Manag. 2023, 34, 258. [Google Scholar]
- Gulzar, S.; Tagrida, M.; Prodpran, T.; Li, L.; Benjakul, S. Packaging films based on biopolymers from seafood processing wastes: Preparation, properties, and their applications for shelf-life extension of seafoods—A comprehensive review. Compr. Rev. Food Sci. Food Saf. 2023, 22, 4451–4483. [Google Scholar] [CrossRef] [PubMed]
- Lin, D.; Sun, L.C.; Chen, Y.L.; Liu, G.M.; Miao, S.; Cao, M.J. Shrimp spoilage mechanisms and functional films/coatings used to maintain and monitor its quality during storage. Trends Food Sci. Technol. 2022, 129, 25–37. [Google Scholar] [CrossRef]
- Parlapani, F.F.; Michailidou, S.; Anagnostopoulos, D.A.; Sakellariou, A.K.; Pasentsis, K.; Psomopoulos, F.; Argiriou, A.; Haroutounian, S.A.; Boziaris, I.S. Microbial spoilage investigation of thawed common cuttlefish (Sepia officinalis) stored at 2 °C using next generation sequencing and volatilome analysis. Food Microbiol. 2018, 76, 518–525. [Google Scholar] [CrossRef]
- Moniente, M.; Botello-Morte, L.; García-Gonzalo, D.; Virto, R.; Pagán, R.; Ferreira, V.; Ontañón, I. Combination of SPE and fluorescent detection of AQC-derivatives for the determination at sub-mg/L levels of biogenic amines in dairy products. Food Res. Int. 2023, 165, 112448. [Google Scholar] [CrossRef]
- Gilsenan, P.M.; Ross-Murphy, S.B. Shear creep of gelatin gels from mammalian and piscine collagens. Int. J. Biol. Macromol. 2001, 29, 53–61. [Google Scholar] [CrossRef] [PubMed]
- Domínguez-Gómez, C.X.; Nochebuena-Morando, L.E.; Aguilar-Uscanga, M.G.; López-Zamora, L. Statistical optimization of dilute acid and H2O2 alkaline pretreatment using surface response methodology and tween 80 for the enhancement of the enzymatic hydrolysis of corncob. Biomass Convers. Biorefinery 2023, 13, 6185–6196. [Google Scholar] [CrossRef]
- Yan, D.; Xu, W.J.; Yu, Q.Q.; You, J.; Gao, R.C.; Bao, Y.L. Pre-rigor salting improves gel strength and water-holding of surimi gel made from snakehead fish (Channa argus): The role of protein oxidation. Food Chem. 2024, 450, 139269. [Google Scholar] [CrossRef]
- Zheng, K.X.; Li, B.; Liu, Y.; Wu, D.; Bai, Y.H.; Xiang, Q.S. Effect of chitosan coating incorporated with oregano essential oil on microbial inactivation and quality properties of refrigerated chicken breasts. LWT 2023, 176, 114547. [Google Scholar] [CrossRef]
- Wu, J.; Song, G.; Huang, R.Y. Fish gelatin films incorporated with cinnamaldehyde and its sulfobutyl ether-β-cyclodextrin inclusion complex and their application in fish preservation. Food Chem. 2023, 418, 135871. [Google Scholar] [CrossRef]
- Aracati, M.F.; Rodrigues, L.F.; Oliveira, S.L.D.; Rodrigues, R.A.; Conde, G.; Cavalcanti, E.N.F.; Borba, H.; Charlie-Silva, I.; Fernandes, D.C.; Eto, S.F.; et al. Astaxanthin improves the shelf-life of tilapia fillets stored under refrigeration. J. Sci. Food Agric. 2022, 102, 4287–4295. [Google Scholar] [CrossRef]
- Liang, Q.X.; Hu, X.F.; Zhong, B.Z.; Huang, X.L.; Wang, H.; Yu, C.W.; Tu, Z.C.; Li, J.L. Regulating effects of low salt dry-curing pretreatment on microbiota, biochemical changes and flavor precursors of grass carp (Ctenopharyngodon idella) fillets during storage at 4 °C. Food Chem. X 2024, 21, 101188. [Google Scholar] [CrossRef] [PubMed]
- Zhao, D.; Hu, J.; Zhou, X.; Chen, W. Correlation between microbial community and flavour formation in dry-cured squid analysed by next-generation sequencing and molecular sensory analysis. Food Chem. X 2022, 15, 100376. [Google Scholar] [CrossRef]
- Li, J.L.; Peng, B.; Huang, L.; Zhong, B.Z.; Yu, C.W.; Hu, X.F.; Wang, W.Y.; Tu, Z.C. Association between flavorsand microbial communities of traditional Aspergillus-Douchi produced by a typical industrial-scale factory. LWT 2023, 176, 114532. [Google Scholar] [CrossRef]
- Zhu, W.; Guo, H.; Han, M.; Shan, C.; Bu, Y.; Li, J.; Li, X. Evaluating the effects of nanoparticles combined ultrasonic-microwave thawing on water holding capacity, oxidation, and protein conformation in jumbo squid (Dosidicus gigas) mantles. Food Chem. 2023, 402, 134250. [Google Scholar] [CrossRef] [PubMed]
- Zhang, C.; Zhang, Y.; Lin, L.; Miao, J.; Lai, K. Effects of different salt concentrations on several freshness indicators of north pacific squid (Ommastrephes sloani pacificus) during storage at 4 °C. J. Food Prot. 2020, 83, 1871–1876. [Google Scholar] [CrossRef] [PubMed]
- Zhan, Y.; Tu, C.; Jiang, H.; Benjakul, S.; Ni, J.; Dong, K.; Zhang, B. Effects of sous vide cooking on the physicochemical and volatile flavor properties of Half-Shell Scallop (Chlamys farreri) during chilled storage. Foods 2022, 11, 3928. [Google Scholar] [CrossRef]
- Zhang, K.; Li, N.; Wang, Z.; Feng, D.; Liu, X.; Zhou, D.; Li, D. Recent advances in the color of aquatic products: Evaluation methods, discoloration mechanism, and protection technologies. Food Chem. 2024, 434, 137495. [Google Scholar] [CrossRef]
- Huo, J.; Yao, H.; Li, J.; Wang, J.; Benjakul, S.; Zhang, B. Comparison of physicochemical and volatile flavor properties of neon flying squid (Ommastrephes bartramii), jumbo squid (Dosidicus gigas), and Argentine shortfin squid (Illex argentin us) during chilled storage. Front. Nutr. 2023, 10, 1195944. [Google Scholar] [CrossRef]
- Wen, R.; Dong, Z.; Lv, Y.; Liu, H.; Bayana, B.; Kong, B.; Chen, Q. Comparative evaluation of the flavour-promoting role of autochthonous yeast strains on dry sausages. LWT 2023, 184, 115032. [Google Scholar] [CrossRef]
- Gao, H.; Li, F.; Chen, X.; You, Z.; Wei, L.; Liu, Y.; Liu, P.; He, M.; Hong, M.; Zhu, H.; et al. The role of hydrogen-rich water in delaying the pulp breakdown of litchi fruit during postharvest storage. Food Chem. 2024, 453, 139694. [Google Scholar] [CrossRef] [PubMed]
- Zheng, Y.; Oellig, C.; Zhang, Y.; Liu, Y.; Chen, Y.; Zhang, Y. Characterization of the key odorants in goji wines in three levels of sweetness by applications of sensomics approach. Food Chem. 2024, 461, 140803. [Google Scholar] [CrossRef] [PubMed]
- Liu, Y.; Al-Dalali, S.; Hu, Y.; Zhao, D.; Wang, J.; He, Z. Effect of different processing steps in the production of beer fish on volatile flavor profile and their precursors determined by HS-GC-IMS, HPLC, E-nose, and E-tongue. Food Chem. X 2024, 23, 101623. [Google Scholar] [CrossRef]
- Guo, W.; Cheng, M.; Dong, X.; Liu, C.; Miao, Y.; Du, P.; Chu, H.; Li, C.; Liu, L. Analysis of flavor substances changes during fermentation of Chinese spicy cabbage based on GC-IMS and PCA. Food Res. Int. 2024, 192, 114751. [Google Scholar] [CrossRef] [PubMed]
- Gao, X.; Li, J.; Chang, C.; Gu, L.; Xiong, W.; Su, Y.; Yang, Y. Characterization of physical properties, volatile compounds and aroma profiles of different salted egg yolk lipids. Food Res. Int. 2022, 165, 112411. [Google Scholar] [CrossRef]
- Li, H.B.; Zhao, L.L.; Dai, Q.Y.; Liu, Z.B.; Pu, H.Y.; Zhu, X.L.; Yao, L.S.; Xu, D.; Hu, L.B. Blended cumin/Zanthoxylum essential oil improve the antibacterial, fresh-keeping performance and flavor of chilled fresh mutton. Meat Sci. 2023, 200, 109173. [Google Scholar] [CrossRef]
- Feng, K.; Yan, Y.J.; Sun, N.; Yang, Z.Y.; Zhao, S.P.; Wu, P.; Li, L.J. Exogenous methyl jasmonate treatment induced the transcriptional responsesand accumulation of volatile terpenoids in Oenanthe javanica (Blume) DC. Int. J. Biol. Macromol. 2024, 265, 131017. [Google Scholar] [CrossRef]
- Nilsuwan, K.; Palamae, S.; Naher, J.; Buamard, N.; Zhang, B.; Benjakul, S. Quality of refrigerated squid mantle cut treated with mint extract subjected to high-pressure processing. Foods 2024, 13, 1264. [Google Scholar] [CrossRef]
- Tian, X.; Wang, X.; Xu, W.; Gong, M.; Zhou, C.; Jiang, E.; Tang, Y.; Jia, L.; Zeng, L.; Deng, S.; et al. Penthorum chinense Pursh leaf tea debittering mechanisms via green tea manufacturing process and its influence on NAFLD-alleviation activities. Food Chem. 2024, 445, 138715. [Google Scholar] [CrossRef]
- Karatepe, P.; Akgöl, M.; Tekin, A.; Çalıcıoğlu, M.; İncili, G.K.; Hayaloğlu, A.A. Effect of Rheum ribes L. pulp enriched with eugenol or thymol on survival of foodborne pathogens and quality parameters of chicken breast fillets. Int. J. Food Microbiol. 2024, 424, 110854. [Google Scholar] [CrossRef]
- Mondéjar-López, M.; López-Jimenez, A.J.; García Martínez, J.C.; Ahrazem, O.; Gómez-Gómez, L.; Niza, E. Comparative evaluation of carvacrol and eugenol chitosan nanoparticles as eco-friendly preservative agents in cosmetics. Int. J. Biol. Macromol. 2022, 206, 288–297. [Google Scholar] [CrossRef] [PubMed]
- Chu, Y.; Ding, Z.; Xie, J. The application of ice glazing containing D-sodium erythorbate combined with vacuum packaging to maintain the physicochemical quality and sweet/umami non-volatile flavor compounds of frozen stored largeyellow croaker (Pseudosciaena crocea). Food Res. Int. 2024, 175, 113657. [Google Scholar] [CrossRef] [PubMed]
- Tan, C.; Li, P.; Shang, N. Novel perspective on the spoilage metabolism ofrefrigerated sturgeon fillets: Nonspecific spoilage dominant organisms play an important role. LWT 2023, 173, 114292. [Google Scholar] [CrossRef]

| Name. | ROAV | |||||||||||
|---|---|---|---|---|---|---|---|---|---|---|---|---|
| 0 Days | 6 Days | 12 Days | ||||||||||
| Blank | Gel | Ess | Gel + Ess | Blank | Gel | Ess | Gel + Ess | Blank | Gel | Ess | Gel + Ess | |
| 1-Decanol | 5.06 | n.d. | n.d. | n.d. | n.d. | n.d. | n.d. | n.d. | n.d. | n.d. | n.d. | n.d. |
| n-Hexanol | 4.09 | 0.01 | n.d. | 0.00 | 0.02 | 0.25 | n.d. | n.d. | n.d. | 0.00 | n.d. | n.d. |
| 1-Octen-3-ol | 52.29 | 0.09 | n.d. | n.d. | 1.03 | 71.75 | n.d. | n.d. | n.d. | 0.12 | n.d. | n.d. |
| 1,8-Cineole | n.d. | n.d. | 25.26 | 21.60 | 100.00 | n.d. | 100.00 | 100.00 | 12.37 | 5.09 | 9.23 | 15.76 |
| Linalool | 53.11 | 11.38 | 100.00 | 100.00 | n.d. | n.d. | n.d. | n.d. | 100.00 | 100.00 | 100.00 | 100.00 |
| β-Phenethylalcohol | 29.65 | 0.03 | 0.01 | 0.00 | 0.19 | 38.87 | 0.03 | 0.01 | 0.28 | 0.05 | 0.01 | 0.00 |
| Terpinen-4-ol | n.d. | n.d. | n.d. | n.d. | 0.02 | 1.75 | 0.05 | 0.02 | 0.02 | 0.02 | 0.00 | 0.01 |
| 1-Nonanal | 100.00 | n.d. | n.d. | n.d. | 0.27 | n.d. | n.d. | n.d. | n.d. | n.d. | n.d. | n.d. |
| Phenylacetaldehyde | 5.72 | 0.03 | n.d. | n.d. | 0.13 | n.d. | n.d. | n.d. | n.d. | n.d. | n.d. | n.d. |
| Nonanal | 91.30 | 0.13 | n.d. | n.d. | n.d. | 37.47 | n.d. | n.d. | 0.21 | n.d. | n.d. | n.d. |
| Geranylacetone | n.d. | 0.01 | n.d. | n.d. | 0.43 | 9.97 | n.d. | n.d. | 0.27 | 0.03 | n.d. | n.d. |
| Phenethylacetate | 24.33 | 0.00 | n.d. | n.d. | n.d. | n.d. | n.d. | n.d. | n.d. | n.d. | n.d. | n.d. |
| Ethylacetate | 2.79 | n.d. | n.d. | n.d. | n.d. | n.d. | n.d. | n.d. | n.d. | n.d. | n.d. | n.d. |
| 2-Pentylpyridine | n.d. | 99.97 | n.d. | n.d. | n.d. | n.d. | n.d. | n.d. | n.d. | n.d. | n.d. | n.d. |
| Eugenol | n.d. | n.d. | 0.02 | 0.02 | 0.33 | 32.01 | n.d. | n.d. | 0.55 | n.d. | n.d. | n.d. |
| 5-methyl-2-Isopropylphenol | n.d. | n.d. | 1.34 | 1.85 | n.d. | n.d. | n.d. | n.d. | n.d. | n.d. | n.d. | n.d. |
| Terpinolene | n.d. | n.d. | n.d. | n.d. | 0.18 | 3.34 | 0.16 | 0.13 | n.d. | 0.00 | 0.01 | 0.03 |
| 2-Methylnaphthalene | n.d. | n.d. | n.d. | n.d. | 0.86 | 34.27 | n.d. | n.d. | n.d. | 0.05 | n.d. | n.d. |
| Gamma-Terpinene | n.d. | n.d. | n.d. | n.d. | 0.13 | 1.61 | 0.07 | 0.06 | n.d. | 0.00 | 0.00 | 0.01 |
| 4-Allylanisole | n.d. | 0.08 | n.d. | n.d. | n.d. | 99.99 | n.d. | n.d. | 0.31 | n.d. | n.d. | n.d. |
| Indole | 0.27 | 0.00 | 0.00 | 0.00 | 0.05 | 7.38 | 0.03 | 0.00 | 0.01 | 0.00 | 0.00 | 0.00 |
Disclaimer/Publisher’s Note: The statements, opinions and data contained in all publications are solely those of the individual author(s) and contributor(s) and not of MDPI and/or the editor(s). MDPI and/or the editor(s) disclaim responsibility for any injury to people or property resulting from any ideas, methods, instructions or products referred to in the content. |
© 2025 by the authors. Licensee MDPI, Basel, Switzerland. This article is an open access article distributed under the terms and conditions of the Creative Commons Attribution (CC BY) license (https://creativecommons.org/licenses/by/4.0/).
Share and Cite
Zhou, H.; Li, J.; Yu, C.; Hu, M.; Zhong, B.; Tu, Z.; Peng, B. Gelatin–Tea Tree Essential Oil Coating Improves the Quality, Flavor, and Micromolecular Metabolites of Squid (Illex argentinus) Muscle During Cold Storage. Foods 2025, 14, 1160. https://doi.org/10.3390/foods14071160
Zhou H, Li J, Yu C, Hu M, Zhong B, Tu Z, Peng B. Gelatin–Tea Tree Essential Oil Coating Improves the Quality, Flavor, and Micromolecular Metabolites of Squid (Illex argentinus) Muscle During Cold Storage. Foods. 2025; 14(7):1160. https://doi.org/10.3390/foods14071160
Chicago/Turabian StyleZhou, Huijuan, Jinlin Li, Chengwei Yu, Mingming Hu, Bizhen Zhong, Zongcai Tu, and Bin Peng. 2025. "Gelatin–Tea Tree Essential Oil Coating Improves the Quality, Flavor, and Micromolecular Metabolites of Squid (Illex argentinus) Muscle During Cold Storage" Foods 14, no. 7: 1160. https://doi.org/10.3390/foods14071160
APA StyleZhou, H., Li, J., Yu, C., Hu, M., Zhong, B., Tu, Z., & Peng, B. (2025). Gelatin–Tea Tree Essential Oil Coating Improves the Quality, Flavor, and Micromolecular Metabolites of Squid (Illex argentinus) Muscle During Cold Storage. Foods, 14(7), 1160. https://doi.org/10.3390/foods14071160