
A Simulation of the Real-Time Shelf Life of Frozen Fish Products in a Bulk System Sale

 , ,
, ,  , , , and
Abstract
1. Introduction
2. Materials and Methods
2.1. Tuna
2.2. Hake
2.3. Glazing Treatment
2.4. Shelf Life Trial
2.5. Sampling and Preparation for Analysis
2.6. Determination of Peroxide Value
2.7. Determination of Total Volatile Basic Nitrogen (TVB-N)
2.8. Determination of Biogenic Amines
2.9. Determination of Volatile Compounds
2.10. Statistical Analysis
3. Results and Discussion
3.1. Results of Statistical Analysis
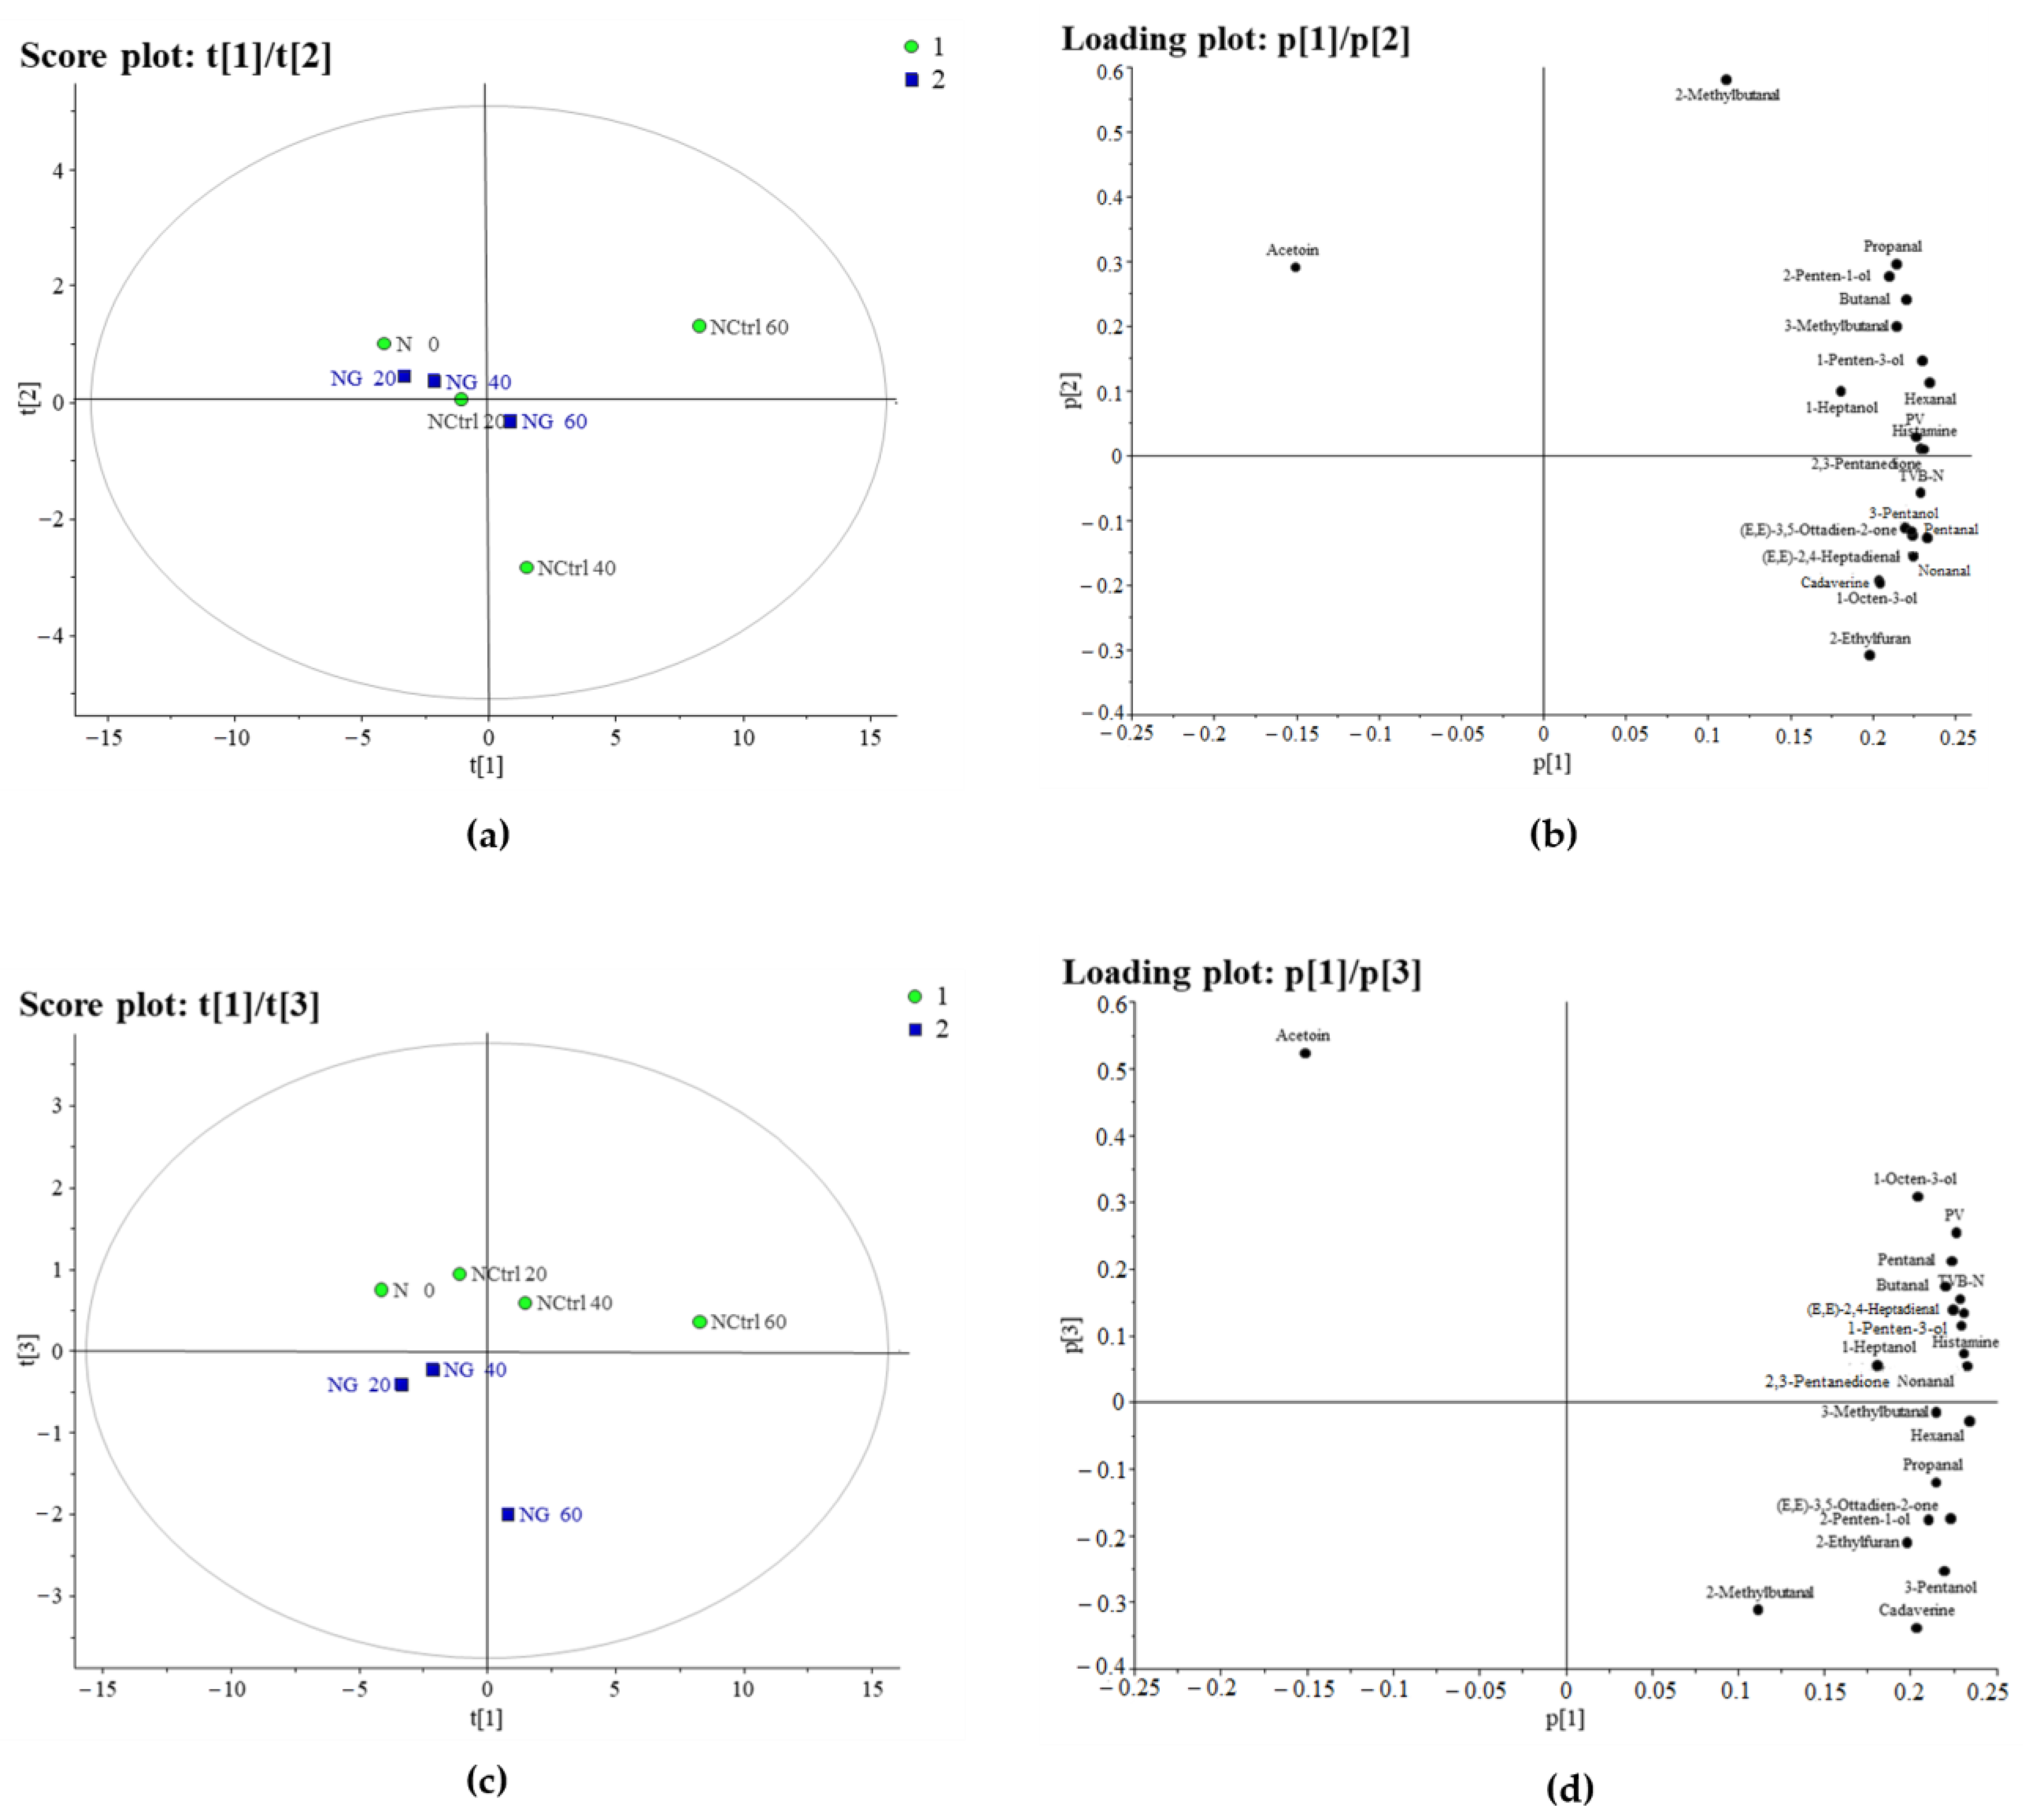
3.1.1. PCA of Hake
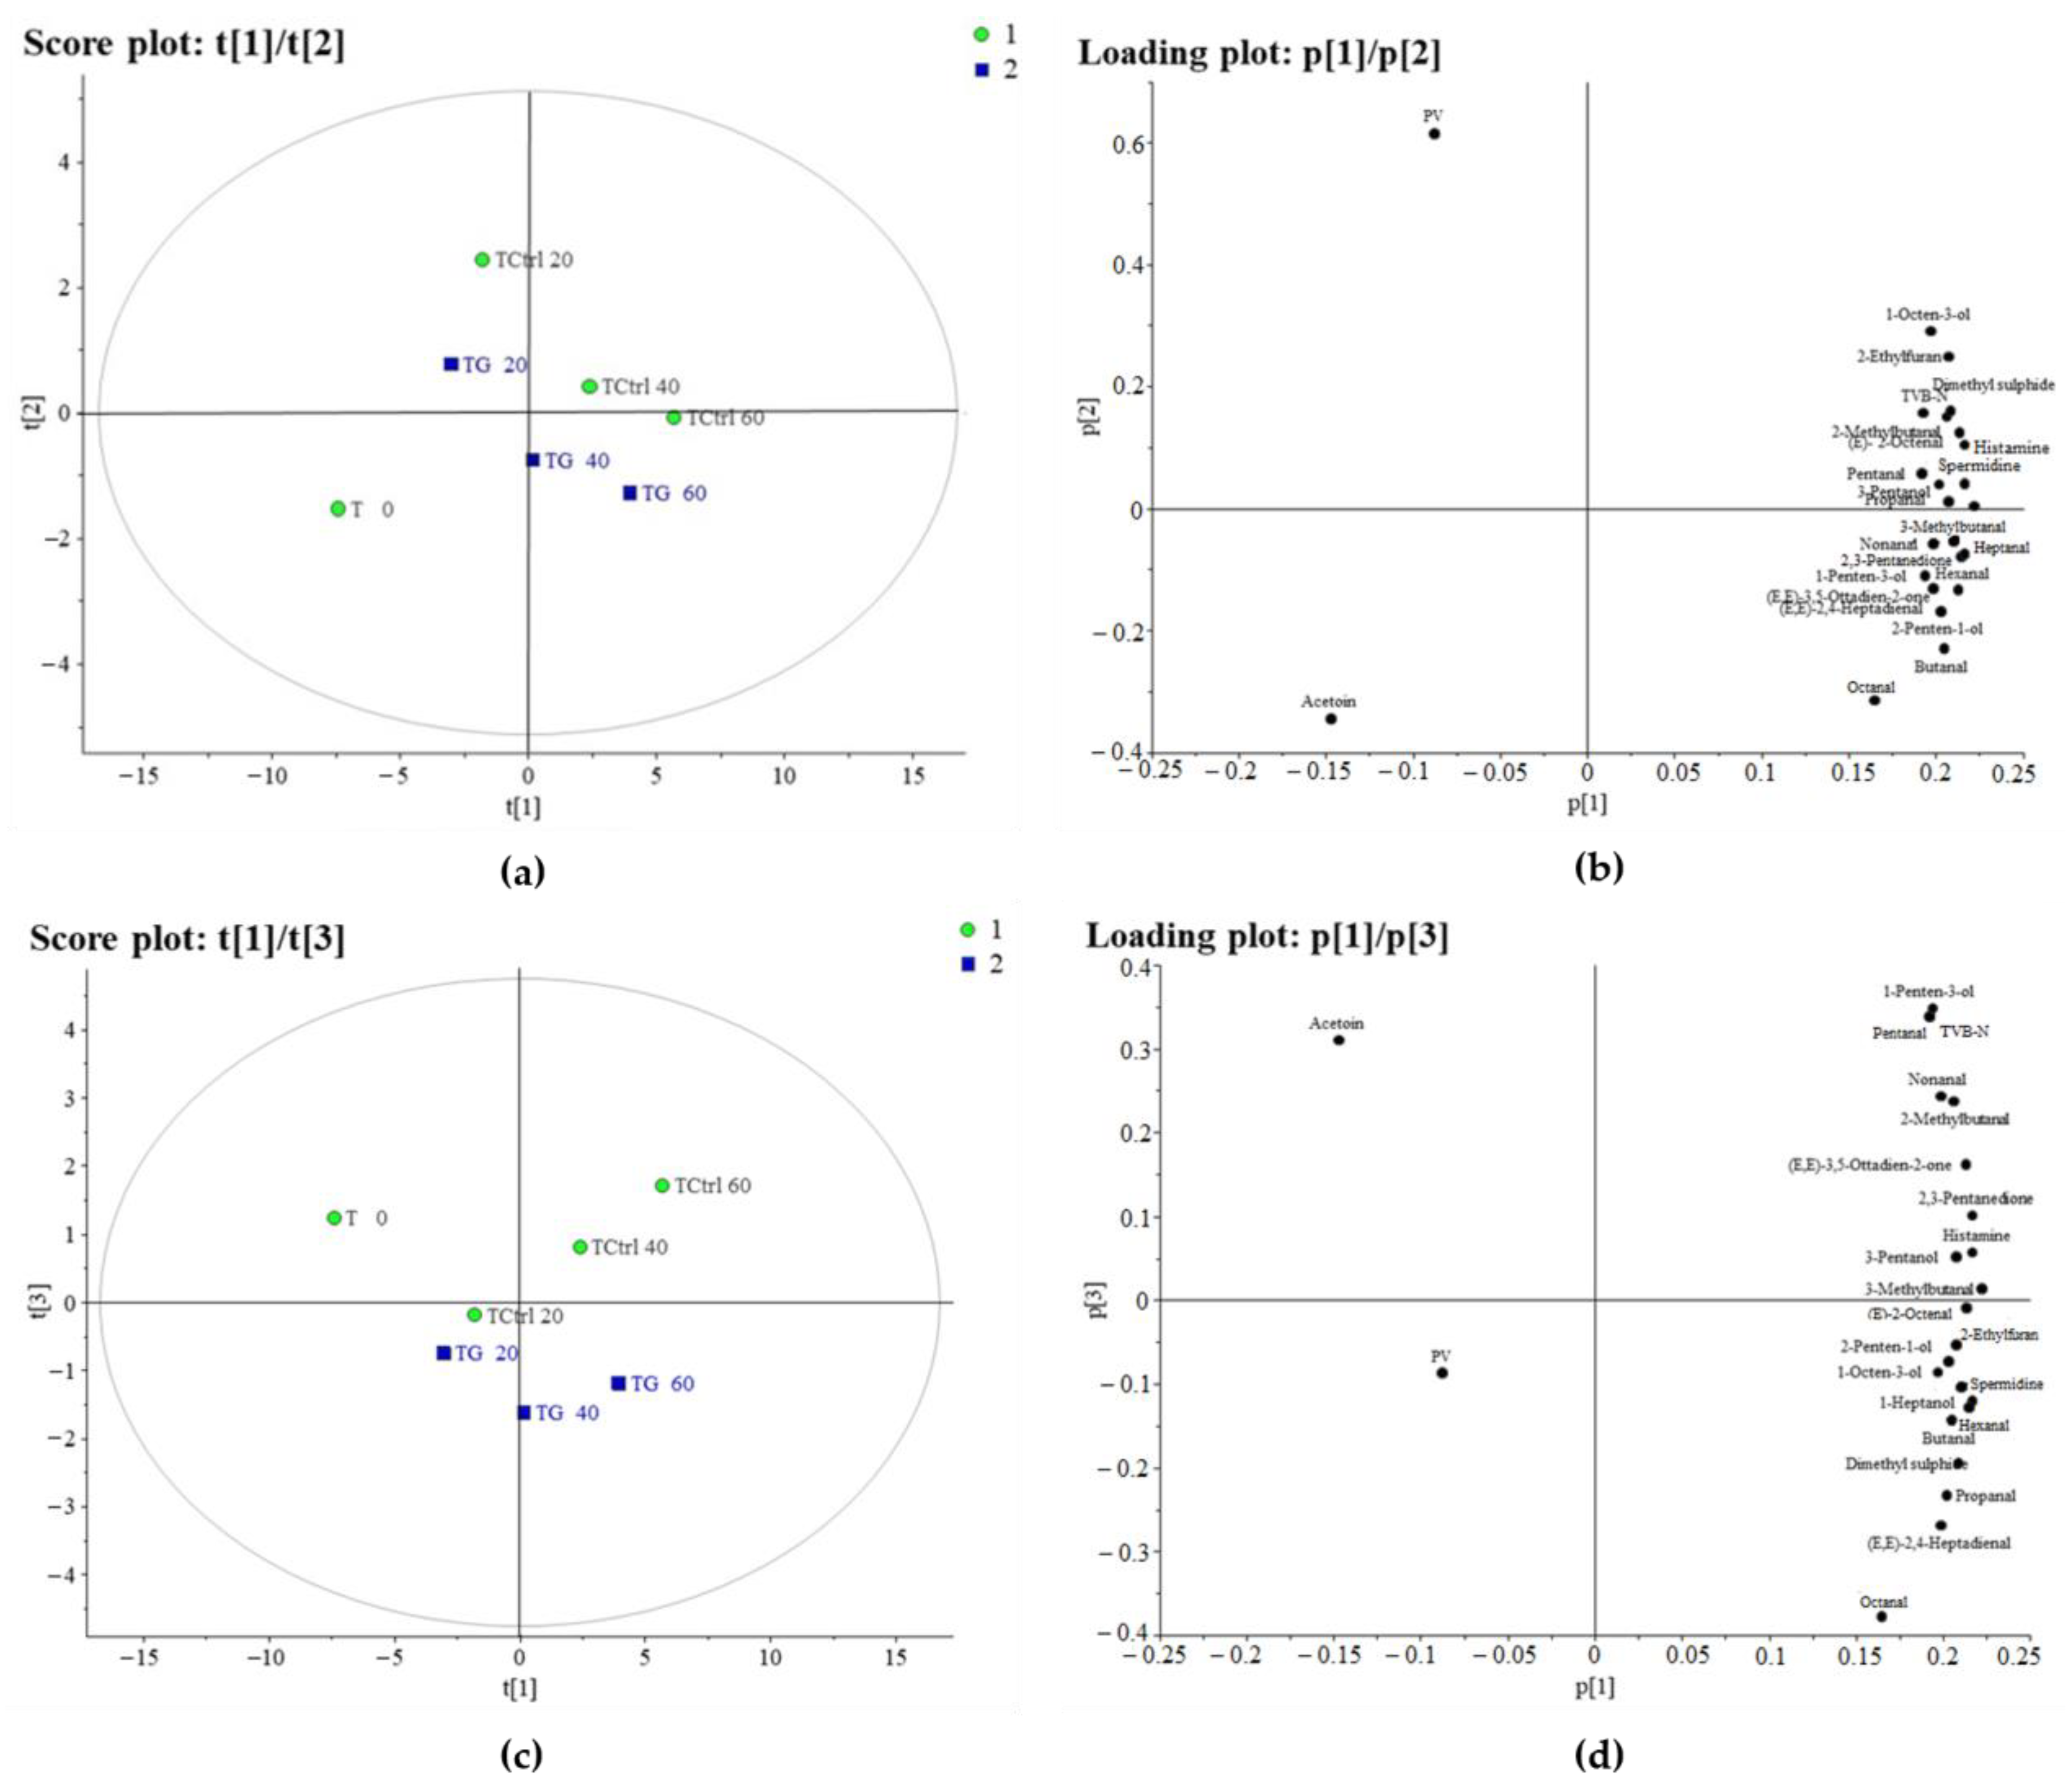
3.1.2. PCA of Tuna
3.2. Peroxide Value (PV)
3.3. Total Volatile Basic Nitrogen (TVB-N)
3.4. Biogenic Amines
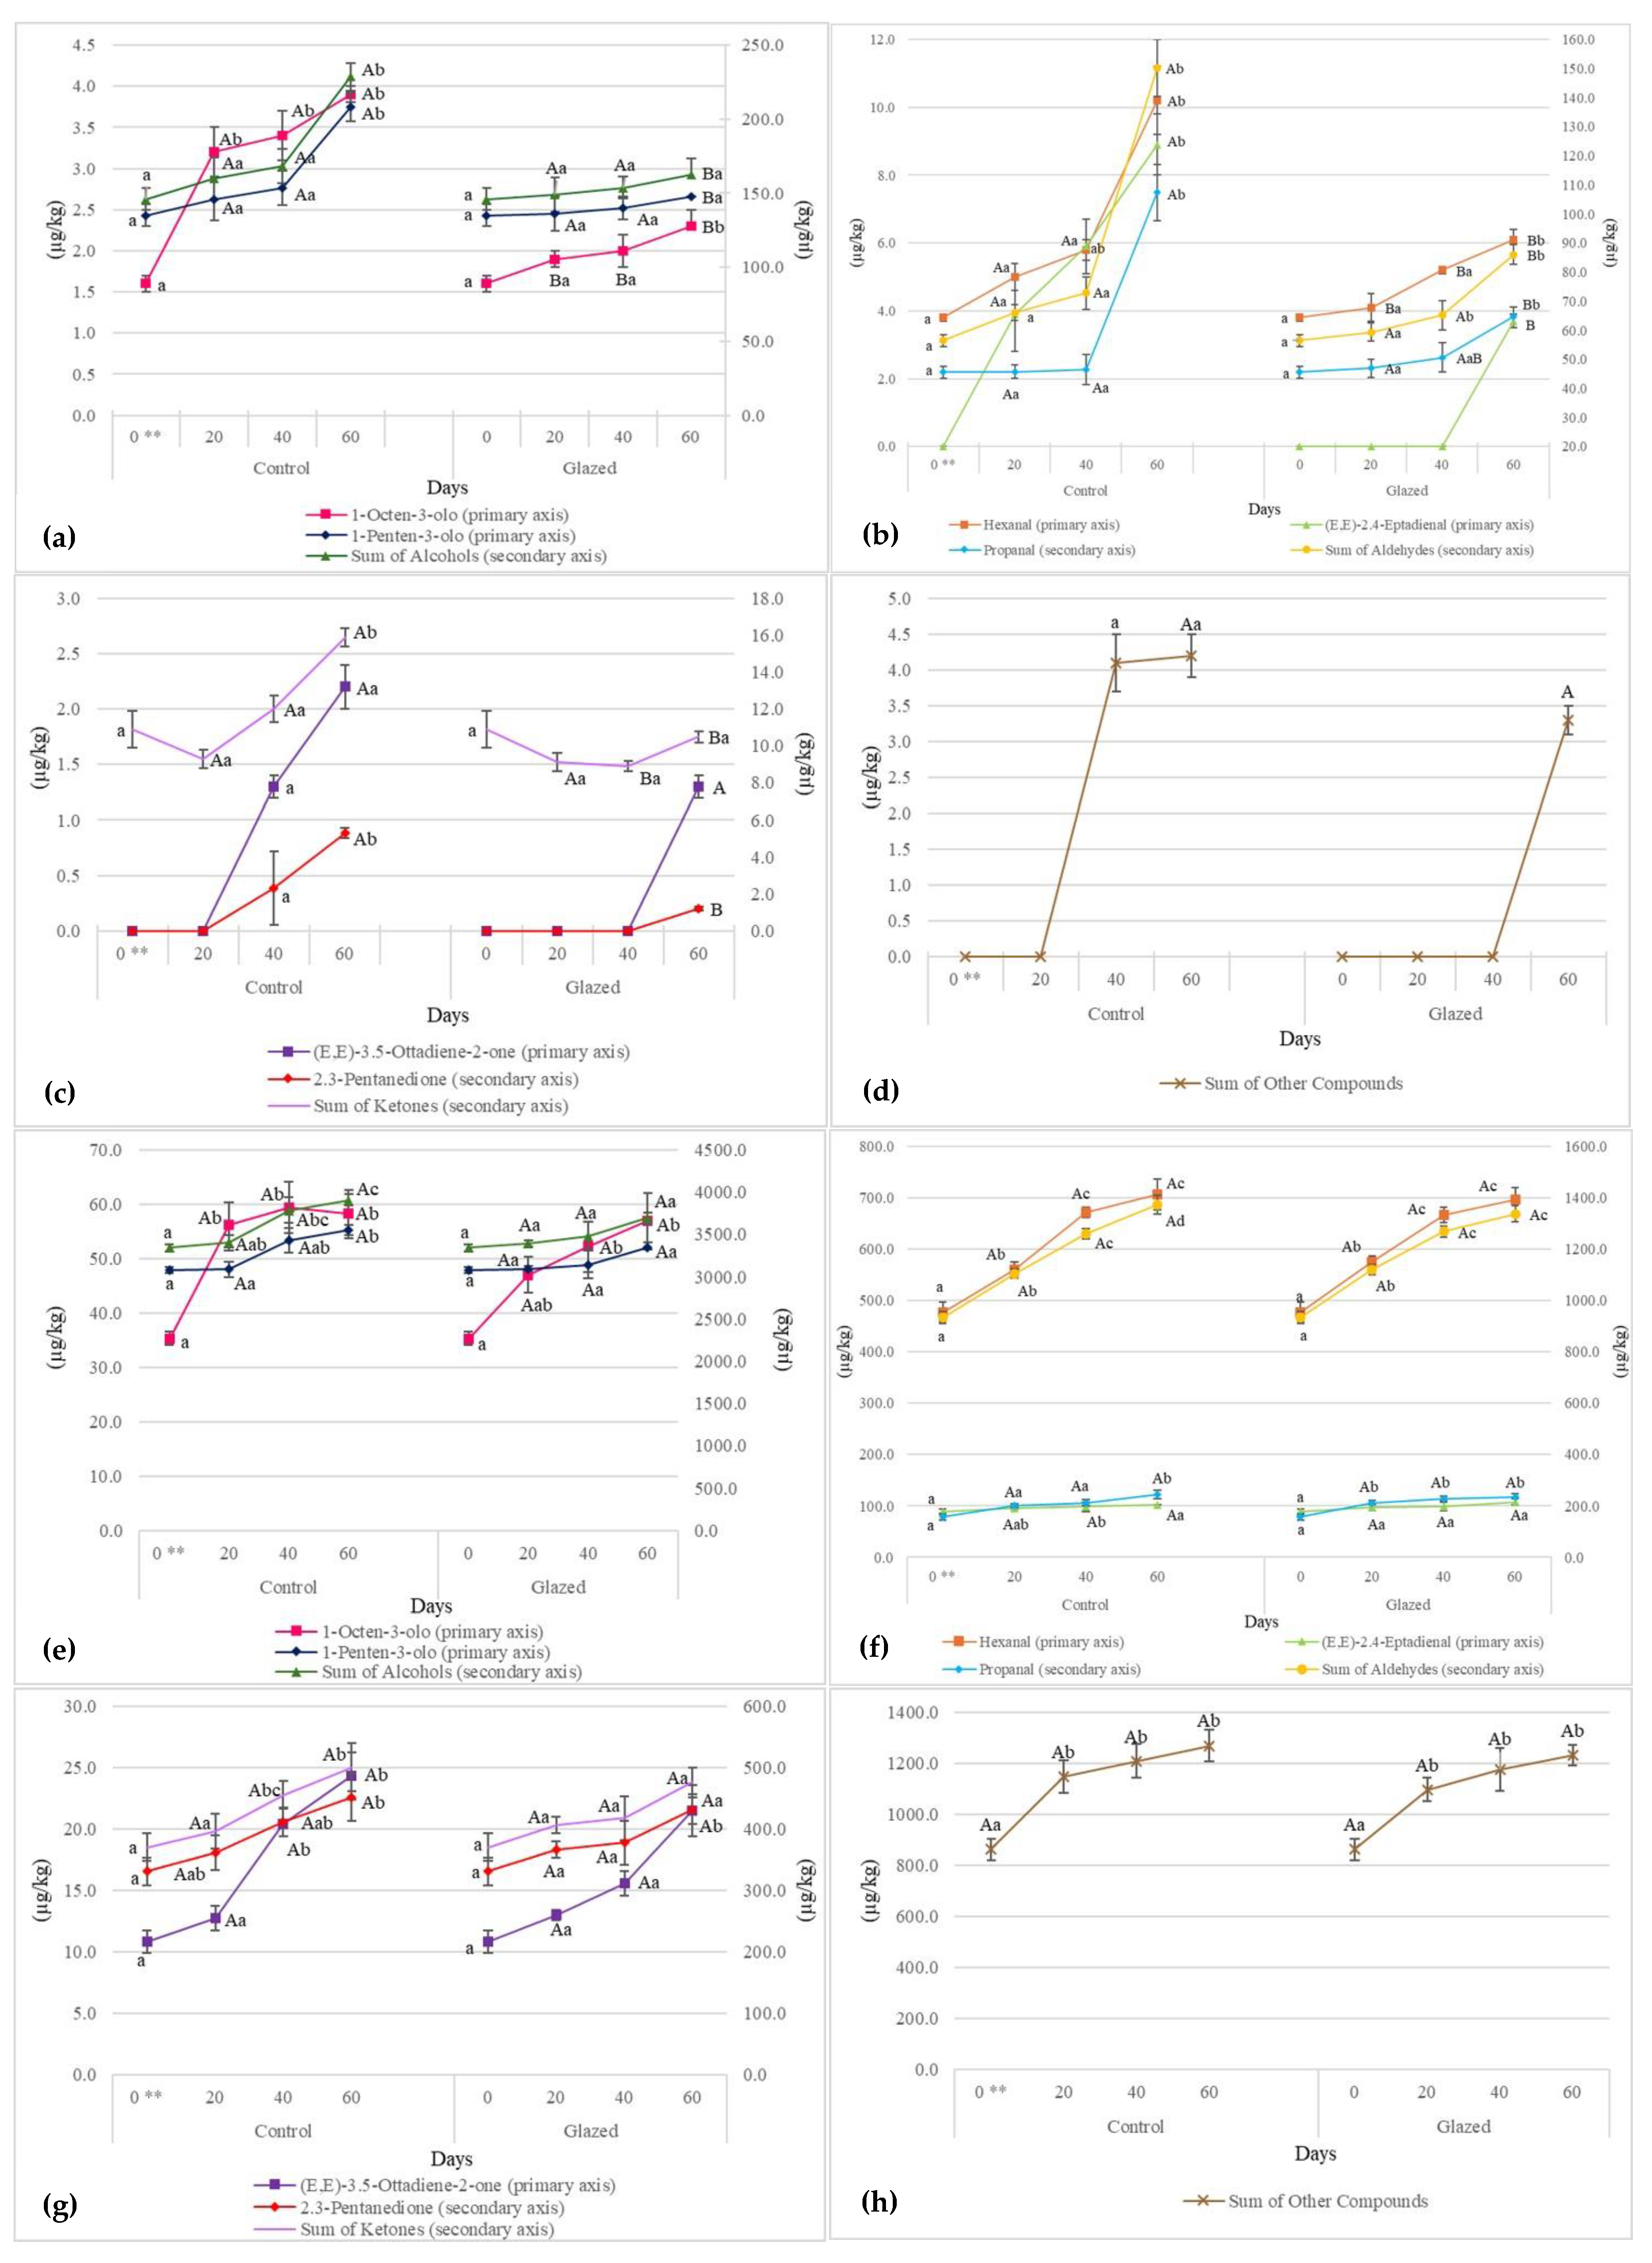
3.5. Evolution of Volatile Compounds
4. Conclusions
Author Contributions
Funding
Data Availability Statement
Acknowledgments
Conflicts of Interest
References
- Mariani Costantini, A.; Cannella, C.; Tomassi, G. Alimentazione e Nutrizione Umana, 2nd ed.; Il Pensiero Scientifico Editore: Roma, Italy, 2006. [Google Scholar]
- Tavares, J.; Martins, A.; Fidalgo, L.G.; Lima, V.; Amaral, R.A.; Pinto, C.A.; Silva, A.M.; Saraiva, J.A. Fresh Fish Degradation and Advances in Preservation Using Physical Emerging Technologies. Foods 2021, 10, 780. [Google Scholar] [CrossRef] [PubMed]
- Duarte, A.M.; Silva, F.; Pinto, F.R.; Barroso, S.; Gil, M.M. Quality Assessment of Chilled and Frozen Fish—Mini Review. Foods 2020, 9, 1739. [Google Scholar] [CrossRef] [PubMed]
- Amaral, A.B.; Solva, M.V.D.; Lannes, S.C.D.S. Lipid oxidation in meat: Mechanisms and protective factors. J. Food Sci. Technol. 2018, 38, 1–15. [Google Scholar] [CrossRef]
- Barriuso, B.; Astiasarán, I.; Ansorena, D. A Review of Analytical Methods Measuring Lipid Oxidation Status in Foods: A Challenging Task. Eur. Food Res. Technol. 2013, 236, 1–15. [Google Scholar] [CrossRef]
- Boziaris, I.S. Introduction to seafood processing-assuring quality and safety of seafood. In Seafood Processing; John Wiley & Sons, Ltd.: Chichester, UK, 2013; pp. 1–8. [Google Scholar] [CrossRef]
- Kostaki, M.; Giatrakou, V.; Savvaidis, I.N.; Kontomina, M.G. Combined Effect of MAP and Thyme Essential Oil on the Microbiological, Chemical and Sensory Attributes of Organically Aquacultured Sea Bass (Dicentrarchus Labrax) Fillets. Food Microbiol. 2009, 26, 475–482. [Google Scholar] [CrossRef]
- Tolstorebrov, I.; Eikevik, T.M.; Bantle, M. Effect of low and ultra-low temperature applications during freezing and frozen storage on quality parameters for fish. Int. J. Refrig. 2016, 63, 37–47. [Google Scholar] [CrossRef]
- Sperber, W.H.; Doyle, M.P. Compendium of the Microbiological Spoilage of Foods and Beverages; Springer: Griffith, GA, USA, 2010. [Google Scholar]
- Cheng, S.; Wang, X.; Li, R.; Yang, H.; Wang, H.; Wang, H.; Tan, M. Influence of multiple freeze-thaw cycles on quality characteristics of beef semimembranous muscle: With emphasis on water status and distribution by LF-NMR and MRI. Meat Sci. 2019, 147, 44–52. [Google Scholar] [CrossRef]
- Hassoun, A.; Shumilina, E.; Di Donato, F.; Foschi, M.; Simal-Gandara, J.; Biancolillo, A. Emerging Techniques for Differentiation of Fresh and Frozen–Thawed Seafoods: Highlighting the Potential of Spectroscopic Techniques. Molecules 2020, 25, 4472. [Google Scholar] [CrossRef]
- De Rezende, L.P.; Barbosa, J.; Teixeira, P. Analysis of Alternative Shelf Life-Extending Protocols and Their Effect on the Preservation of Seafood Products. Foods 2022, 11, 1100. [Google Scholar] [CrossRef]
- Dawson, P.; Al-Jeddawi, W.; Remington, N. Effect of Freezing on the Shelf Life of Salmon. Int. J. Food Sci. 2018, 2018, 1686121. [Google Scholar] [CrossRef]
- D’Ancona, G.G. Industrie Agro Alimentari, Chimica Applicata, Tecnologie, Processi 1, 4th ed.; Reda: Brescia, Italy, 2014. [Google Scholar]
- Vanhaecke, L.; Verbeke, W.; De Brabander, H.F. Glazing of frozen fish: Analytical and economic challenges. Anal. Chim. Acta 2010, 672, 40–44. [Google Scholar] [CrossRef] [PubMed]
- Luo, H.; Wang, W.; Chen, W.; Tang, T.; Jiang, L.; Yu, Z. Effect of incorporation of natural chemicals in water ice-glazing on freshness and shelf-life of Pacific saury (Cololabis saira) during −18 °C frozen storage. J. Sci. Food Agric. 2018, 98, 3309–3314. [Google Scholar] [CrossRef] [PubMed]
- Manzoni, P.; Tepedino, V. Grande enciclopedia Illustrata dei Pesci; Eurofishmarket: Bologna, Italy, 2008; Volume 44. [Google Scholar]
- Commission Implementing Regulation (EU). 1604/2019 of 27 September 2019 amending Regulation (EEC) No 2568/91 on the characteristics of olive oil and olive-pomace oil and on the relevant methods of analysis. Off. J. Eur. Union 2019, L250, 14–48. [Google Scholar]
- Commission Regulation (EC). No 2074/2005 of 5 December 2005 ‘laying down implementing measures for certain products under Regulation (EC) No 853/2004 of the European Parliament and of the Council and for the organisation of official controls under Regulation (EC) No 854/2004 of the European Parliament and of the Council and Regulation (EC) No 882/2004 of the European Parliament and of the Council, derogating from Regulation (EC) No 852/2004 of the European Parliament and of the Council and amending Regulations (EC) No 853/2004 and (EC) No 854/2004’. Off. J. Eur. Union 2005, L338, 27–59. [Google Scholar]
- Molognoni, L.; Daguera, H.; De Sá Ploêncio, L.A.; De Dea Lindnerc, J. A multi-purpose tool for food inspection: Simultaneous determination of various classes of preservatives and biogenic amines in meat and fish products by LC-MS. Talanta 2018, 178, 1053–1066. [Google Scholar] [CrossRef]
- Dottori, I.; Urbani, S.; Sordini, B.; Servili, M.; Selvaggini, R.; Veneziani, G.; Ranucci, D.; Taticchi, A.; Esposto, S. Frozen Ready-to-(h)eat Meals: Evolution of Their Quality during a Real-Time Short Shelf Life. Foods 2023, 12, 1087. [Google Scholar] [CrossRef]
- He, Q.; Yang, Z.; Gong, B.; Wang, J.; Xiao, K.; Yang, S.T. Quality Evaluation Focusing on Tissue Fractal Dimension and Chemical Changes for Frozen Tilapia with Treatment by Tangerine Peel Extract. Sci. Rep. 2017, 7, 42202. [Google Scholar] [CrossRef]
- Nowsad, A.A.; Hoque, M.S. Biochemical properties and shelf life of value-added fish cube and powder developed from hilsa shad (Tenualosa ilisha). Heliyon 2021, 7, e08137. [Google Scholar] [CrossRef]
- Chaijan, M. Physicochemical changes of tilapia (Oreochromis niloticus) muscle during salting. Food Chem. 2011, 129, 1201–1210. [Google Scholar] [CrossRef]
- Aberoumand, A.; Baesi, F. Effects of vacuum packaging in freezer on oxidative spoilage indexes of fish Lethrinus atkinsoni. Food Sci. Nutr. 2020, 8, 4145–4150. [Google Scholar] [CrossRef]
- Santos, H.M.C.; Méndez, L.; Secci, G.; Parisi, G.; Martelli, R.; Medina, I. Pathway-oriented action of dietary essential oils to prevent muscle protein oxidation and texture deterioration of farmed rainbow trout. Animal 2019, 13, 2080–2091. [Google Scholar] [CrossRef] [PubMed]
- Iglesias, J.; Medina, I.; Bianchi, F.; Careri, M.; Mangia, A.; Musci, M. Study of the volatile compounds useful for the characterisation of fresh and frozen-thawed cultured gilthead sea bream fish by solid-phase microextraction gas chromatography–mass spectrometry. Food Chem. 2009, 115, 1473–1478. [Google Scholar] [CrossRef]
- Iglesias, J.; Medina, I. Solid-phase microextraction method for the determination of volatile compounds associated to oxidation of fish muscle. J. Chromatogr. A 2008, 1192, 9–16. [Google Scholar] [CrossRef] [PubMed]
- Rezaei, M.; Hosseini, S.F.; Langrudi, H.E.; Safari, R.; Hosseini, S.V. Effect of delayed icing on quality changes of iced rainbow trout (Onchorynchus mykiss). Food Chem. 2008, 106, 1161–1165. [Google Scholar] [CrossRef]
- Commission Regulation (EC). No 1022/2008 of 17 October 2008 ‘amending Regulation (EC) No 2074/2005 as regards the total volatile basic nitrogen (TVB-N) limit values. Off. J. Eur. Union 2008, L277, 18–20. [Google Scholar]
- Kung, H.F.; Lee, Y.C.; Lin, C.W.; Huang, Y.R.; Cheng, C.A.; Lin, C.M.; Tsai, Y.H. The effect of vacuum packaging on histamine changes of milkfish sticks at various storage temperatures. J. Food Drug Anal. 2017, 25, 812–818. [Google Scholar] [CrossRef]
- Li, Q.; Zhang, L.; Luo, Y. Changes in microbial communities and quality attributes of white muscle and dark muscle from common carp (Cyprinus carpio) during chilled and freeze-chilled storage. Food Microbiol. 2018, 73, 237–244. [Google Scholar] [CrossRef]
- Tsironi, T.N.; Stoforos, N.G.; Taoukis, P.S. Quality and Shelf-Life Modeling of Frozen Fish at Constant and Variable Temperature Conditions. Foods 2020, 9, 1893. [Google Scholar] [CrossRef]
- Messina, C.M.; Arena, R.; Ficano, G.; La Barbera, L.; Morghese, M.; Santulli, A. Combination of Freezing, Low Sodium Brine, and Cold Smoking on the Quality and Shelf-Life of Sea Bass (Dicentrarchus labrax L.) Fillets as a Strategy to Innovate the Market of Aquaculture Products. Animals 2021, 11, 185. [Google Scholar] [CrossRef]
- Sunde Roiha, I.; Jónsson, A.; Backi, C.J.; Lunestad, B.T.; Karlsdóttir, M.G. A comparative study of quality and safety of Atlantic cod (Gadus morhua) fillets during cold storage, as affected by diffeent thawing methods of pre-rigor frozen headed and gutted fish. J. Sci. Food Agric. 2018, 98, 400–409. [Google Scholar] [CrossRef]
- Aberoumand, A.; Baesi, F. Effects of abdominal emptying and immersion in salt in different concentrations on fatty acids profile and spoilage indices of fish Kotr (Sphyraena jello) during freezing. Food Sci. Nutr. 2020, 8, 6275–6286. [Google Scholar] [CrossRef] [PubMed]
- Ribeiro, I.S.; Shirahigue, L.D.; Ferraz de Arruda Sucasas, L.; Anbe, L.; da Cruz, P.G.; Gallo, C.R.; Carpes, S.T.; Marques, M.J.; Oetterer, M. Shelf Life and Quality Study of Minced Tilapia with Nori and Hijiki Seaweeds as Natural Additives. Sci. World J. 2014, 2014, 485287. [Google Scholar] [CrossRef]
- Visciano, P.; Schirone, M.; Paparella, A. An overview of histamine and other biogenic amines in fish and fish products. Foods 2020, 9, 1795. [Google Scholar] [CrossRef]
- Commission Regulation (EC). No 2073/2005 of 15 November 2005 ‘on microbiological criteria for foodstuffs’. Off. J. Eur. Union 2005, L338, 1–26. [Google Scholar]
- Dalgaard, P.; Madsen, H.L.; Samieian, N.; Emborg, J. Biogenic amine formation and microbial spoilage in chilled garfish (Belone belone belone)–effect of modified atmosphere packaging and previous frozen storage. J. Appl. Microbiol. 2006, 101, 80–95. [Google Scholar] [CrossRef] [PubMed]
- Emborg, J.; Laursen, B.G.; Rathjen, T.; Dalgaard, P. Microbial spoilage and formation of biogenic amines in fresh and thawed modified atmosphere-packed salmon (Salmo salar) at 2 °C. J. Appl. Microbiol. 2002, 92, 790–799. [Google Scholar] [CrossRef]
- Gandotra, R.; Koul, M.; Gupta, S.; Gupta, V. Influence of ice glazing and long term storage on some quality parameters of Rohu fillets during frozen storage. Biolife 2014, 2, 779–785. [Google Scholar]
- Cattaneo, P. Scombroid syndrome-histamine poisoning. Food 2011, 1, 5–80. [Google Scholar] [CrossRef]
- Leduc, F.; Krzewinski, F.; Le Fur, B.; N’Guessan, A.; Malle, P.; Kol, O.; Duflos, G. Differentiation of fresh and frozen/thawed fish, European sea bass (Dicentrarchus labrax), gilthead seabream (Sparus aurata), cod (Gadus morhua) and salmon (Salmo salar), using volatile compounds by SPME/GC/MS. J. Sci. Food Agric. 2012, 92, 2560–2568. [Google Scholar] [CrossRef]

| Hake | Tuna | |||
|---|---|---|---|---|
| Days | Control | Glazed | Control | Glazed |
| 0 ** | n.d. | n.d. | 14.0 ± 0.4 a | 14.0 ± 0.7 a |
| 20 | 5.0 ± 0.1 a | n.d. | 21.6 ± 1.1 Ab | 21.9 ± 0.8 Ab |
| 40 | 5.1 ± 0.2 a | n.d. | 15 ± 0.5 Aa | 13.8 ± 0.3 Aa |
| 60 | 12.6 ± 0.3 Ab | 2.6 ± 0.1 B | 14.2 ± 0.4 Aa | 11.9 ± 0.5 Ab |
| Hake | Tuna | |||
|---|---|---|---|---|
| Days | Control | Glazed | Control | Glazed |
| 0 ** | 16.8 ± 1.6 a | 16.8 ± 1.4 a | 20.3 ± 1.8 a | 20.3 ± 1.6 a |
| 20 | 20.3 ± 2 Aa | 16.8 ± 1.3 Aa | 22.4 ± 1.9 Aa | 21 ± 1.9 Aa |
| 40 | 21 ± 1.8 Aa | 18.9 ± 1.5 Aa | 23.8 ± 2.1 Aa | 21.7 ± 2 Aa |
| 60 | 24.5 ± 2.3 Aa | 19.6 ± 1.7 Aa | 25.2 ± 2 Aa | 22.4 ± 2.1 Aa |
| Hake | Tuna | |||||||
|---|---|---|---|---|---|---|---|---|
| Days | Control | Glazed | Control | Glazed | ||||
| Cadaverine | Histamine | Cadaverine | Histamine | Spermidine | Histamine | Spermidine | Histamine | |
| 0 ** | n.d. | n.d. | n.d. | n.d. | 1.1 ± 0.1 a | 4.1 ± 0.5 a | 1.1 ± 0.9 a | 4.1 ± 0.5 a |
| 20 | n.d. | n.d. | n.d. | n.d. | 6.6 ± 0.5 Ab | 9.5 ± 0.2 Ab | 7.1 ± 0.4 Ab | 8.8 ± 0.4 Ab |
| 40 | 0.6 ± 0.05 Aa | 0.4 ± 0.02 Aa | n.d. | n.d. | 9 ± 1 Ac | 11.5 ± 1 Ab | 8.1 ± 1.5 Abc | 9.9 ± 0.8 Ab |
| 60 | 0.8 ± 0.1 Aa | 1.0 ± 0.1 Ab | 0.7 ± 0.04 A | 0.2 ± 0.02 B | 12.1 ± 0.2 Ad | 15.7 ± 1.1 Ac | 11.8 ± 1.0 Ac | 12.3 ± 0.3 Ac |
Disclaimer/Publisher’s Note: The statements, opinions and data contained in all publications are solely those of the individual author(s) and contributor(s) and not of MDPI and/or the editor(s). MDPI and/or the editor(s) disclaim responsibility for any injury to people or property resulting from any ideas, methods, instructions or products referred to in the content. |
© 2025 by the authors. Licensee MDPI, Basel, Switzerland. This article is an open access article distributed under the terms and conditions of the Creative Commons Attribution (CC BY) license (https://creativecommons.org/licenses/by/4.0/).
Share and Cite
Dottori, I.; Urbani, S.; Daidone, L.; Bonucci, A.; Beccerica, M.; Selvaggini, R.; Sordini, B.; Branciari, R.; Veneziani, G.; Nucciarelli, D.; et al. A Simulation of the Real-Time Shelf Life of Frozen Fish Products in a Bulk System Sale. Foods 2025, 14, 1334. https://doi.org/10.3390/foods14081334
Dottori I, Urbani S, Daidone L, Bonucci A, Beccerica M, Selvaggini R, Sordini B, Branciari R, Veneziani G, Nucciarelli D, et al. A Simulation of the Real-Time Shelf Life of Frozen Fish Products in a Bulk System Sale. Foods. 2025; 14(8):1334. https://doi.org/10.3390/foods14081334
Chicago/Turabian StyleDottori, Ilenia, Stefania Urbani, Luigi Daidone, Arianna Bonucci, Matteo Beccerica, Roberto Selvaggini, Beatrice Sordini, Raffaella Branciari, Gianluca Veneziani, Davide Nucciarelli, and et al. 2025. "A Simulation of the Real-Time Shelf Life of Frozen Fish Products in a Bulk System Sale" Foods 14, no. 8: 1334. https://doi.org/10.3390/foods14081334
APA StyleDottori, I., Urbani, S., Daidone, L., Bonucci, A., Beccerica, M., Selvaggini, R., Sordini, B., Branciari, R., Veneziani, G., Nucciarelli, D., Taticchi, A., Servili, M., & Esposto, S. (2025). A Simulation of the Real-Time Shelf Life of Frozen Fish Products in a Bulk System Sale. Foods, 14(8), 1334. https://doi.org/10.3390/foods14081334