

Matching the Sensory Analysis of Serpa PDO Cheese with the Volatile Profiles—A Preliminary Study
 , , , and
Abstract
:
1. Introduction
2. Materials and Methods
2.1. Samples
2.2. Methods
2.2.1. Sensory Analysis Evaluation
2.2.2. Volatile Composition Analysis
Sample Preparation
Analysis by SPME-GC-MS
Identification of Compounds by GC-MS
2.2.3. Data Analysis
3. Results and Discussion
3.1. Serpa Cheese Classification Based on Sensory Analysis
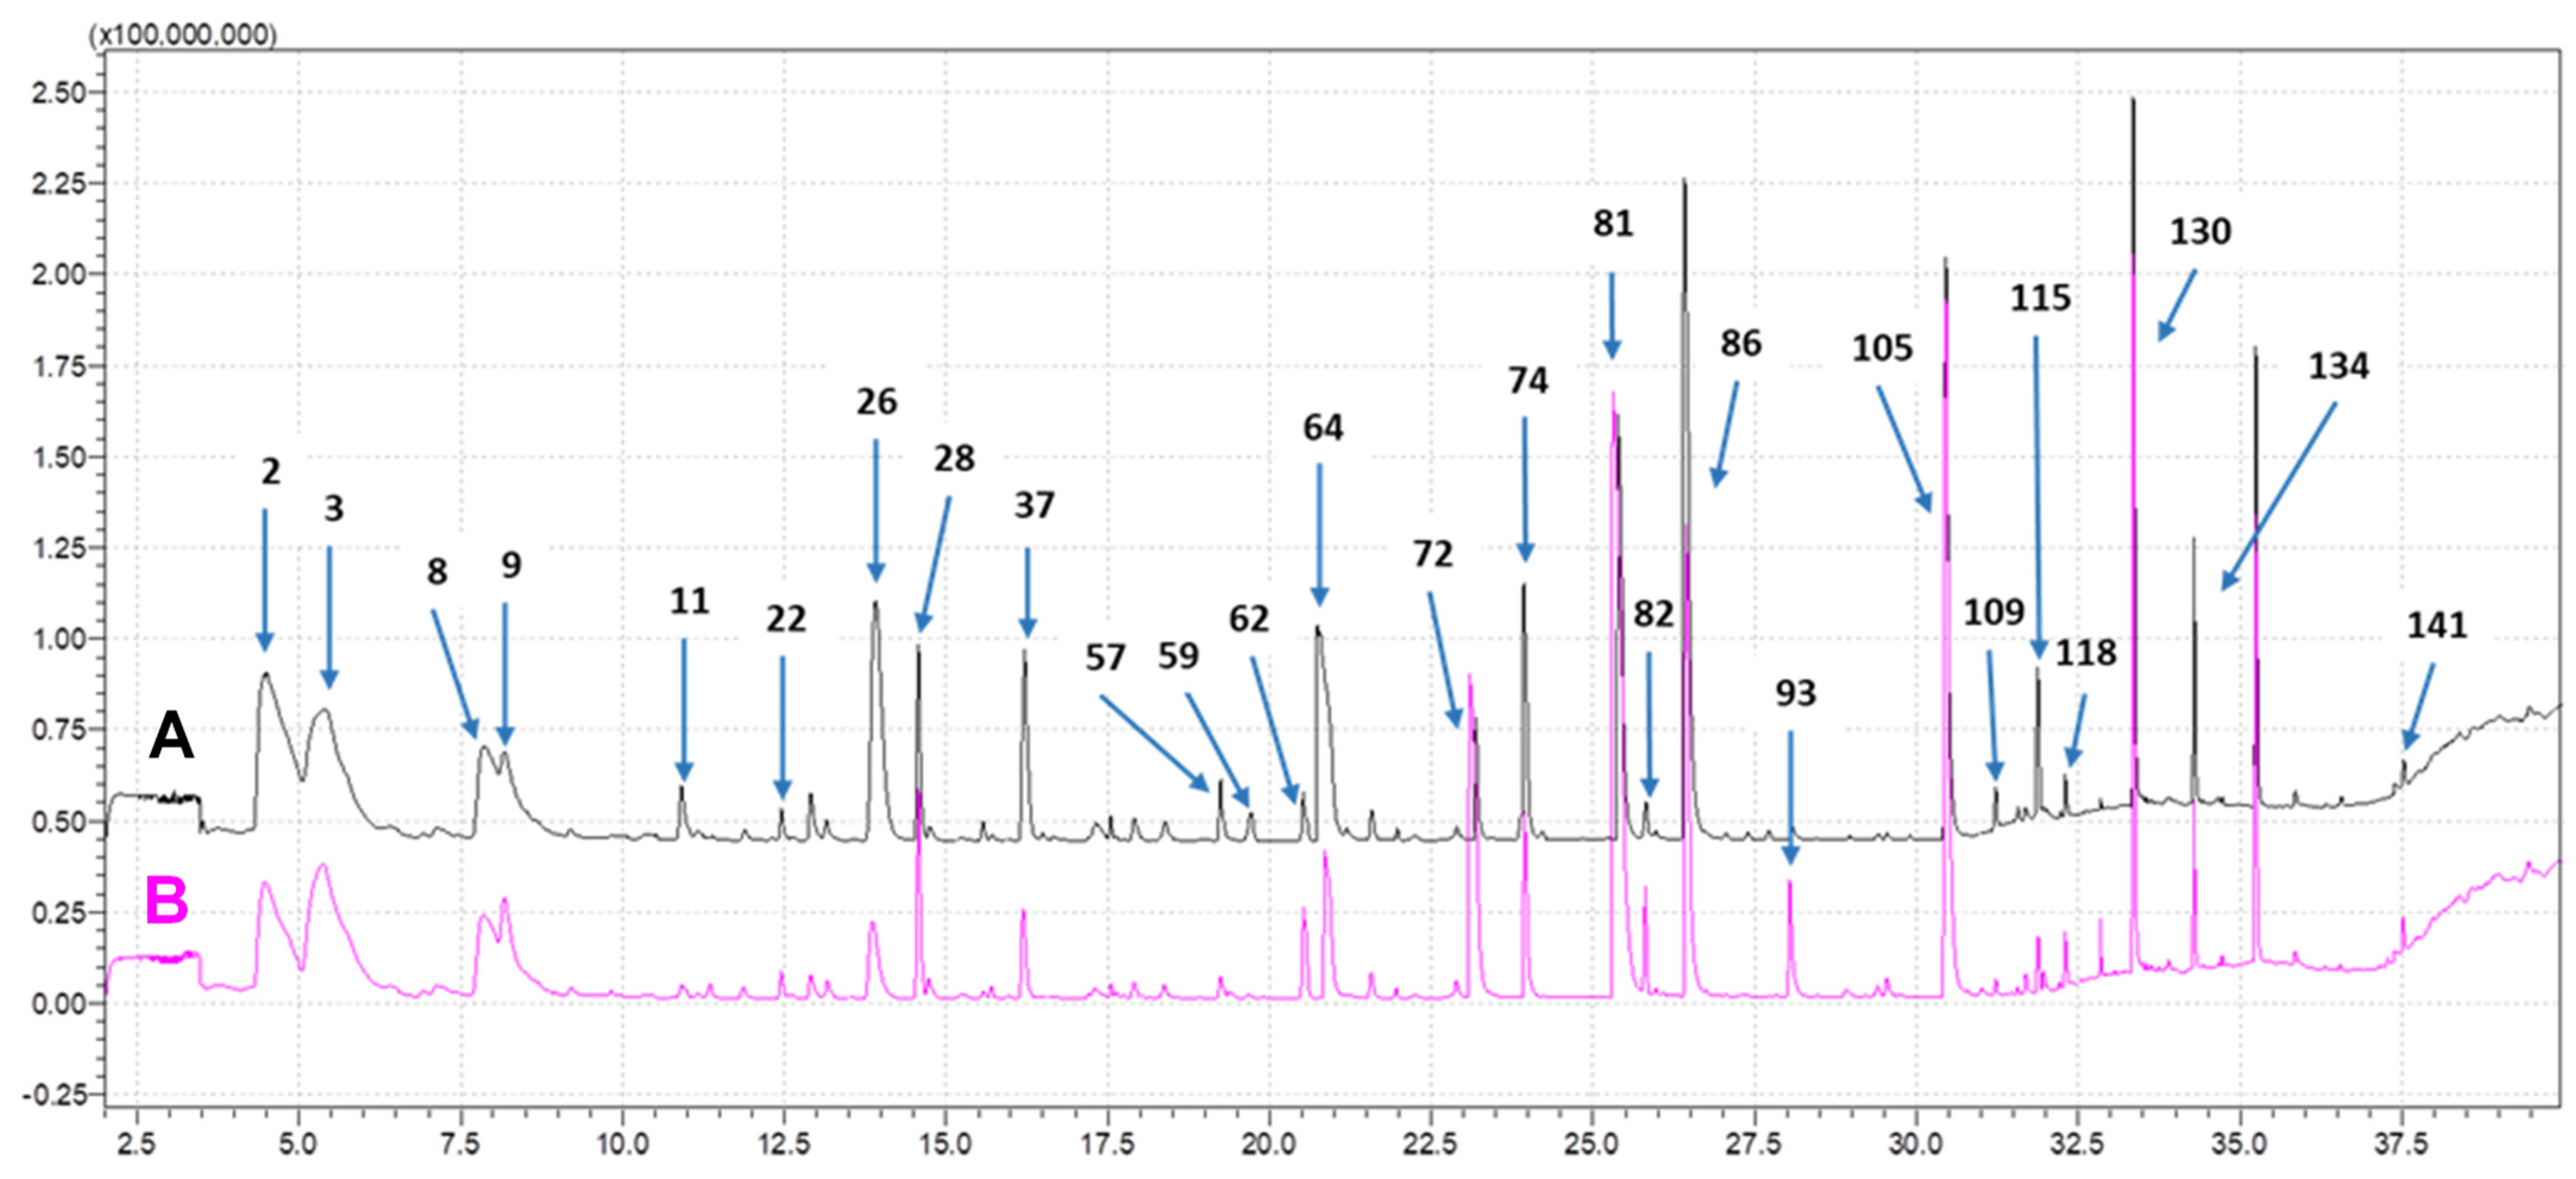
3.2. Volatile Composition by SPME-GC-MS
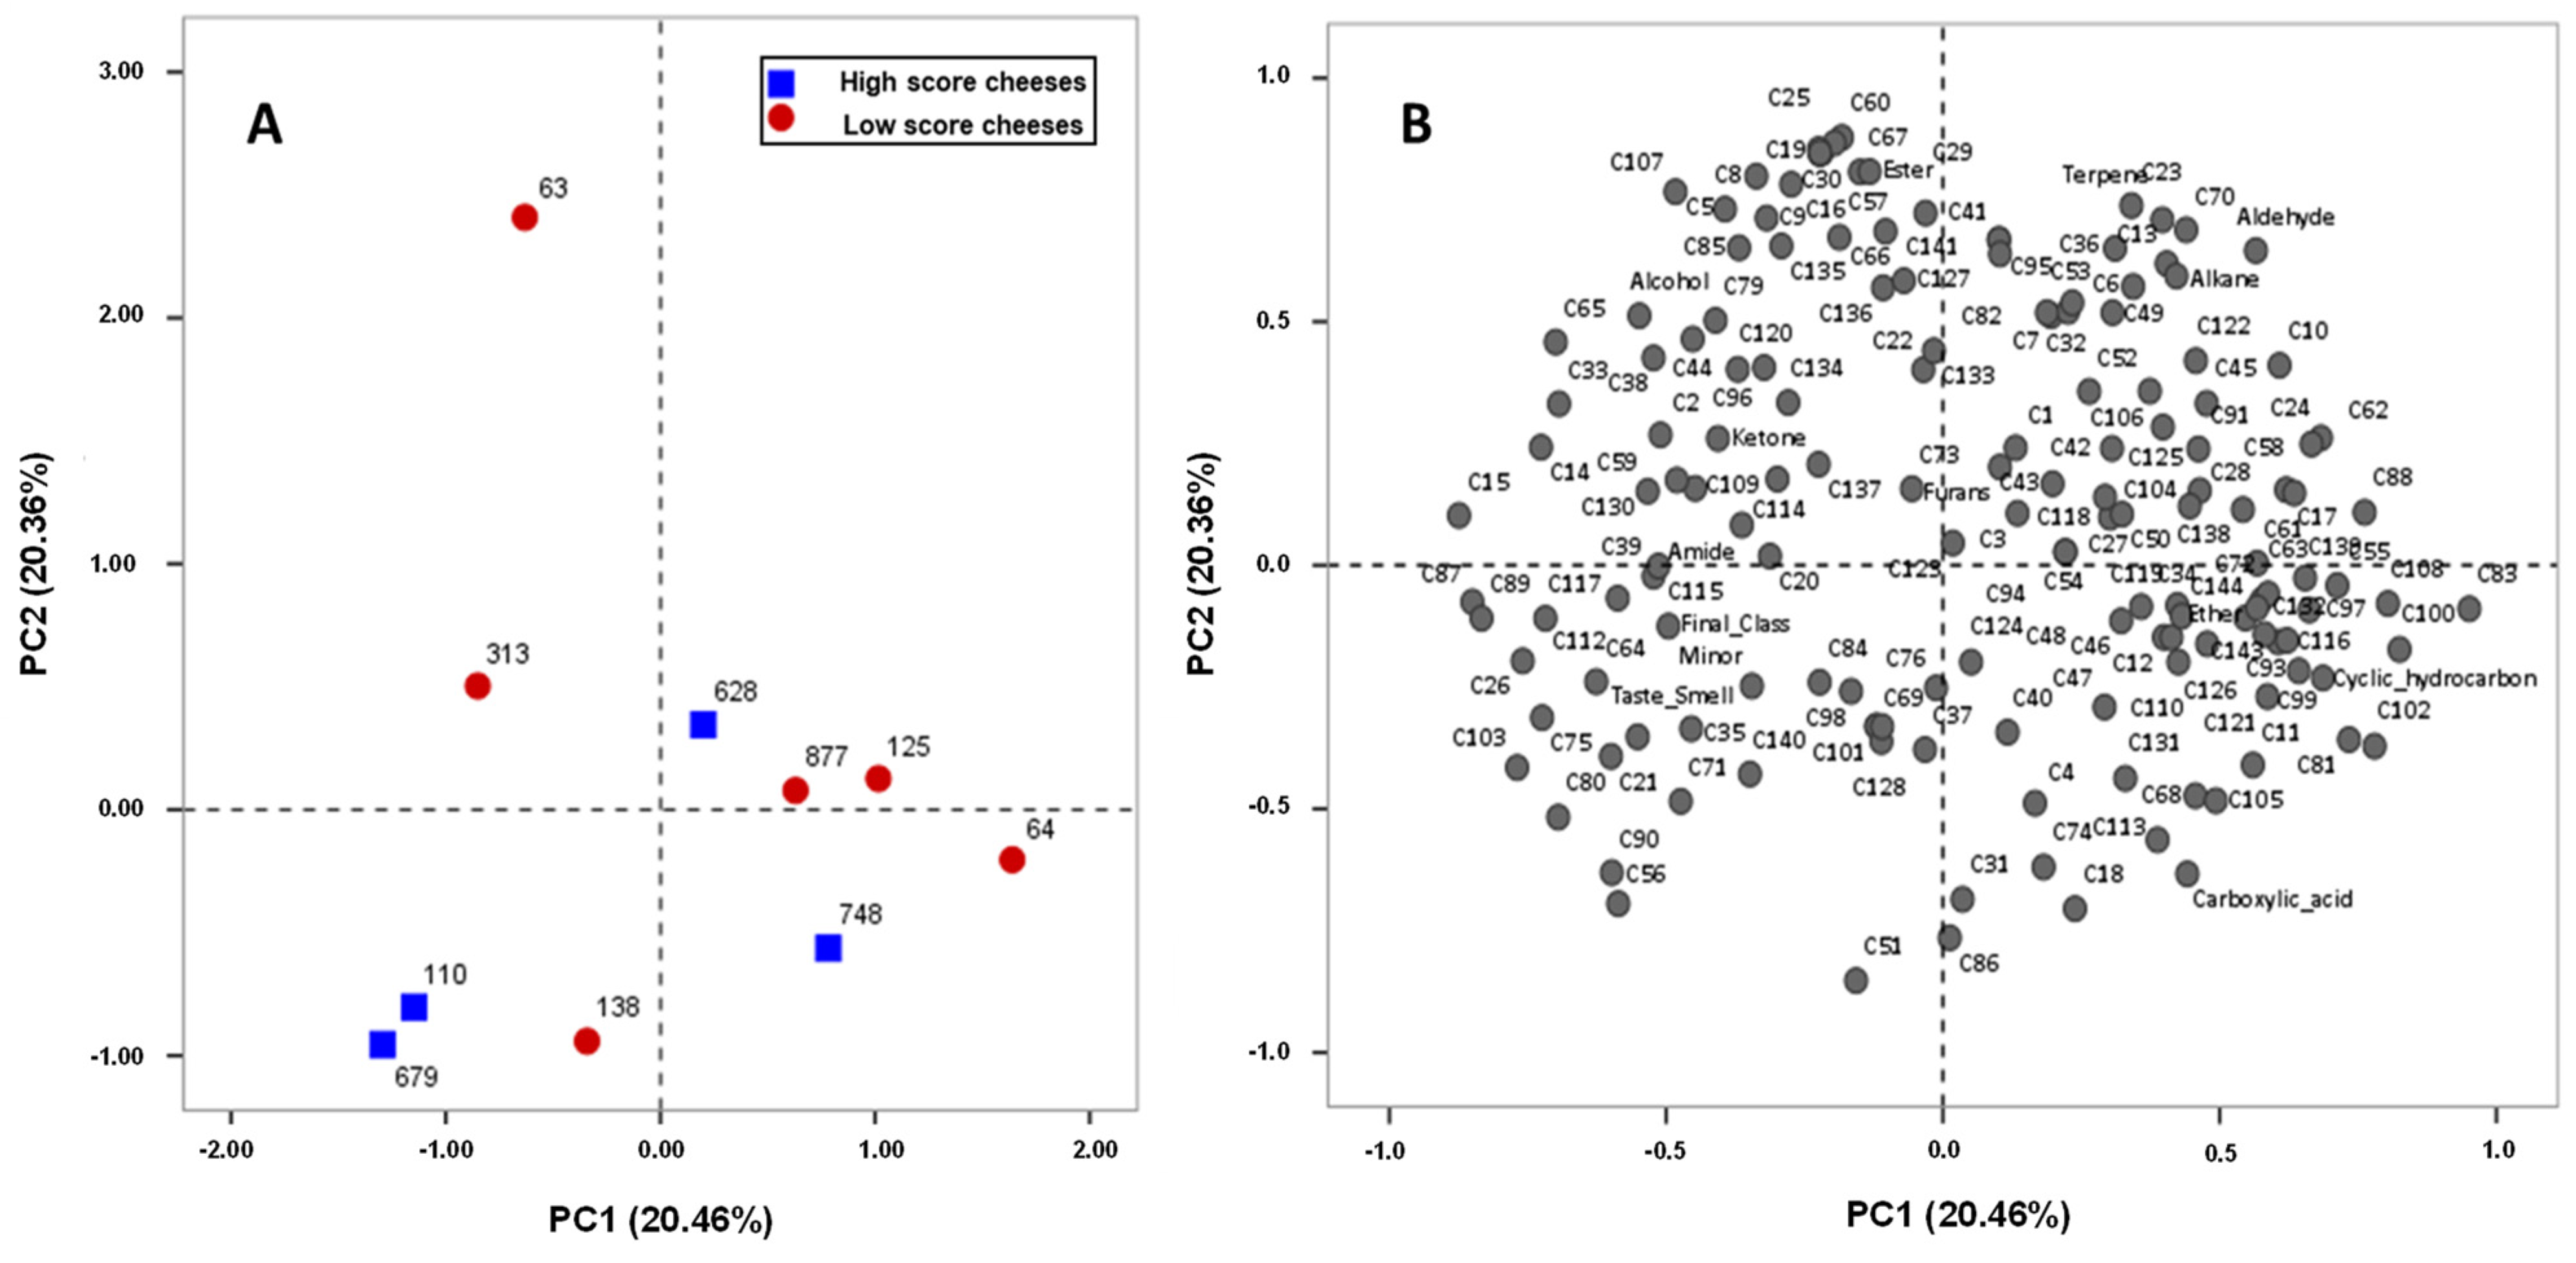
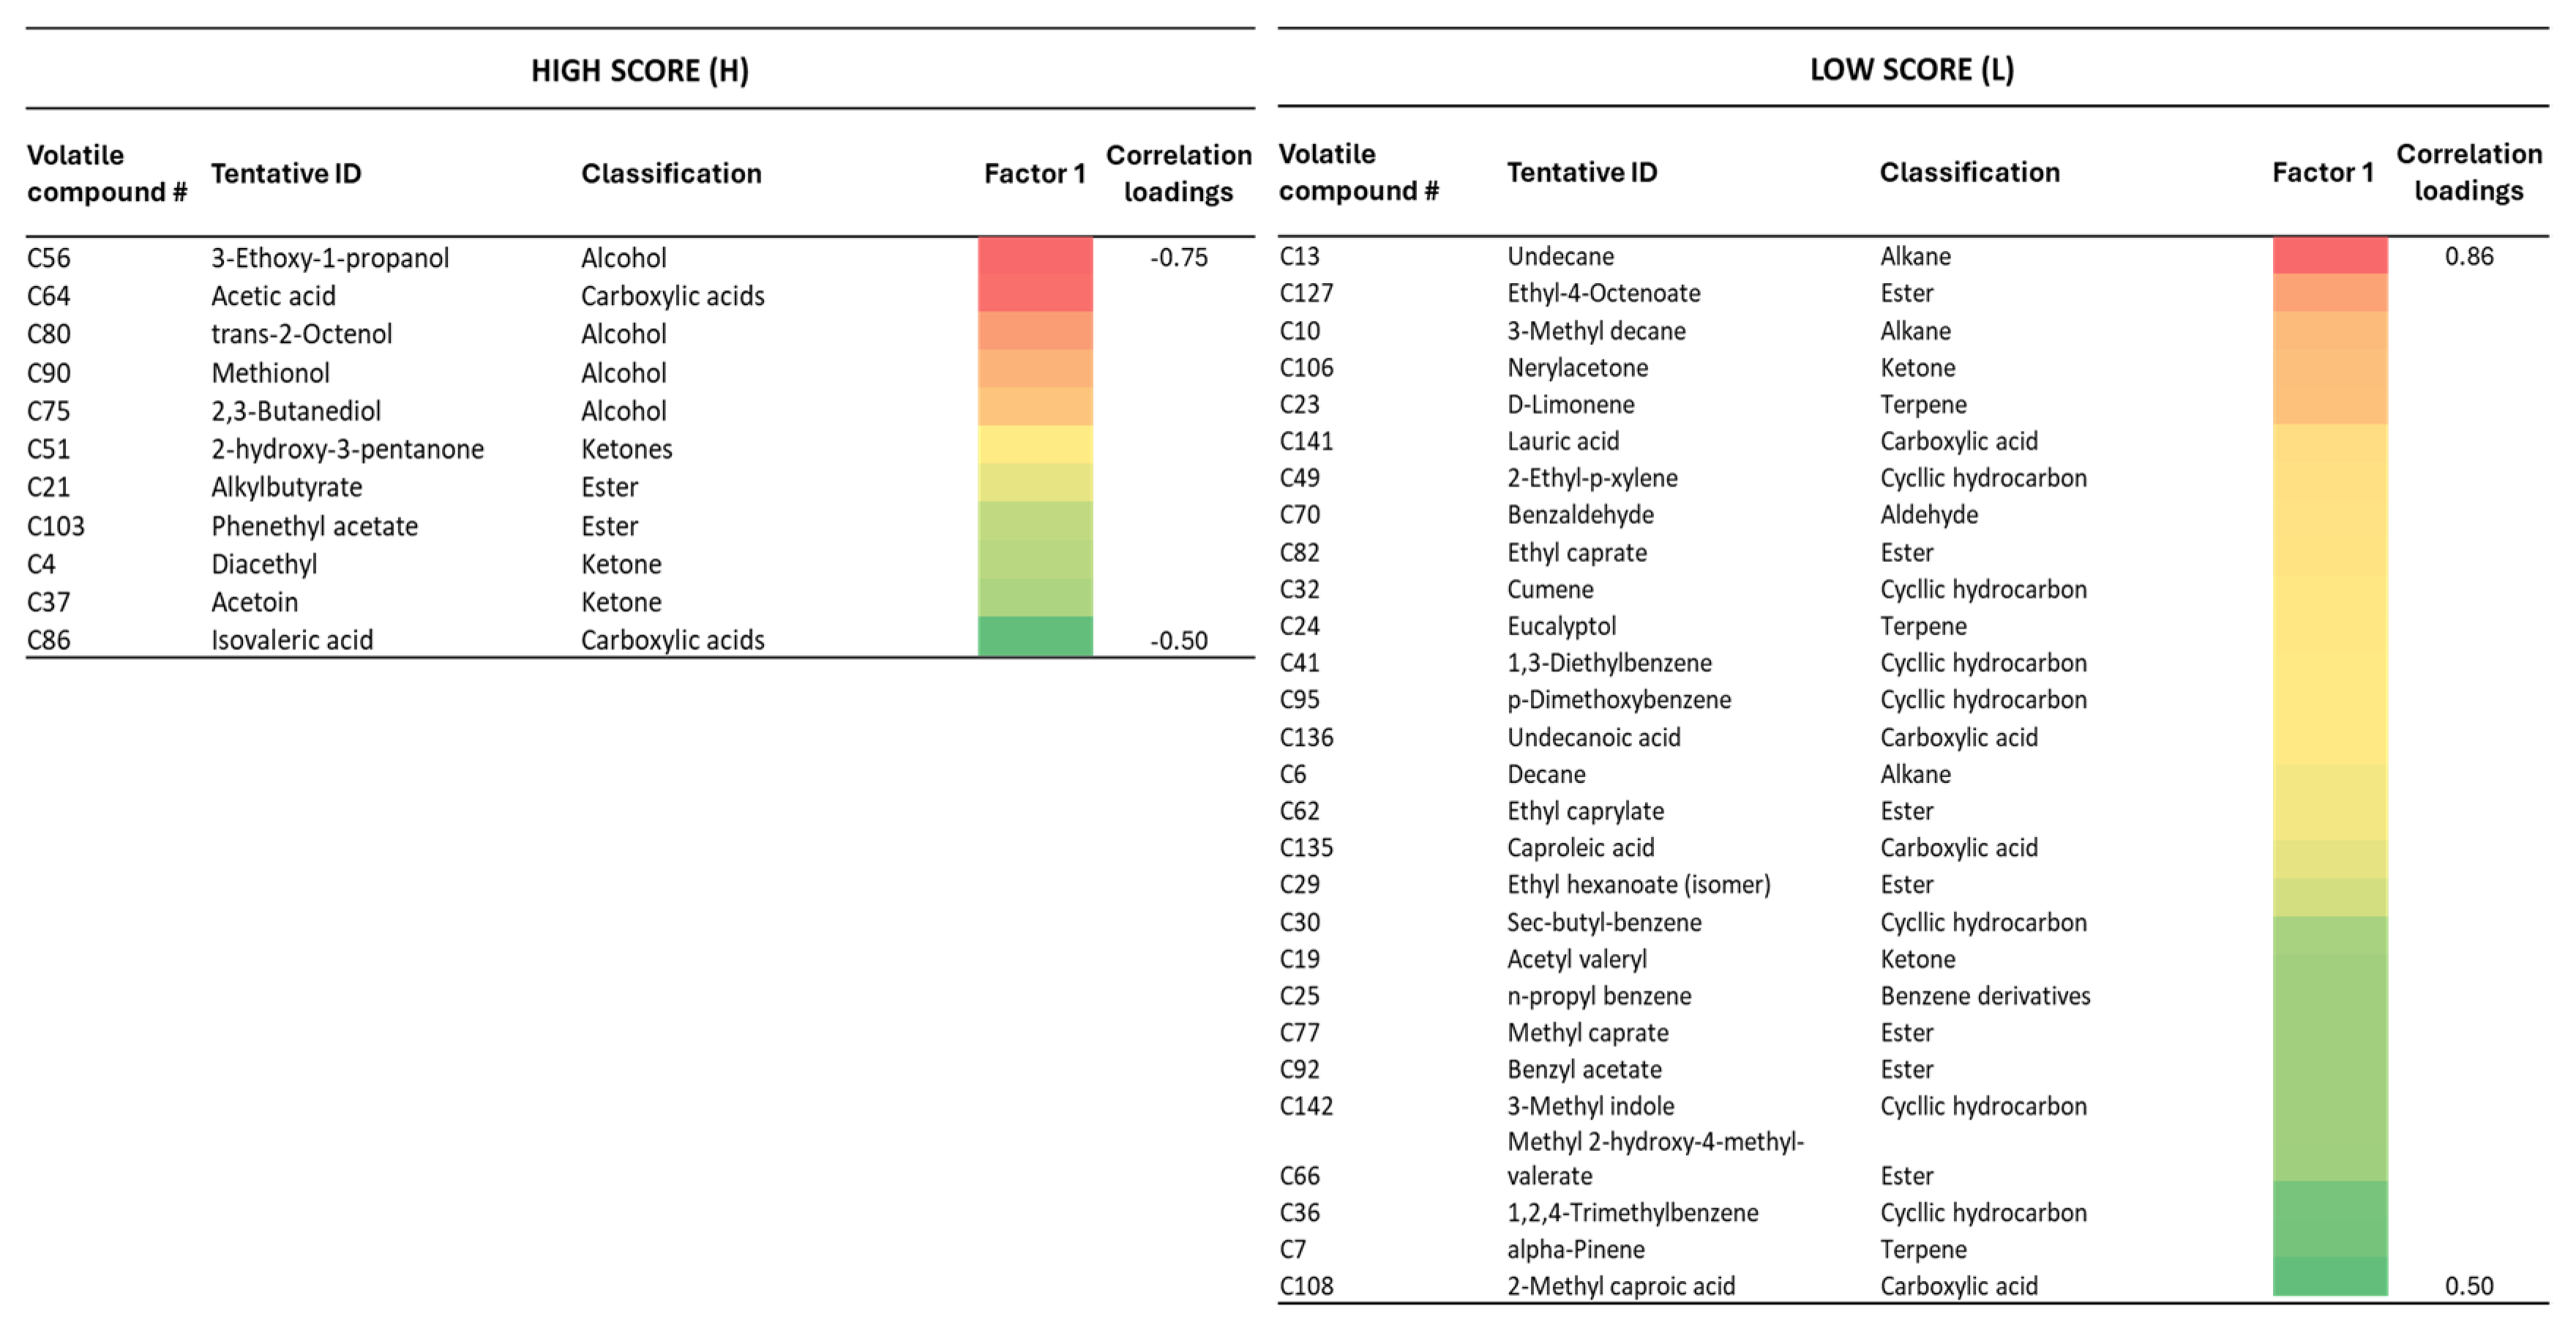
3.3. Correlation Between Serpa Cheese Volatile Composition and the Sensory Quality Evaluation
4. Conclusions
Supplementary Materials
Author Contributions
Funding
Data Availability Statement
Acknowledgments
Conflicts of Interest
References
- Drake, M.A.; Delahunty, C.M. Sensory Character of Cheese and its Evaluation. In Cheese—Chemistry, Physics and Microbiology, 4th ed.; McSweeney, P., Fox, P., Cotter, P., Everett, D., Eds.; Academic Press: San Diego, CA, USA, 2017; Volume 1, pp. 517–545. [Google Scholar]
- Jeantet, R.; Croguennec, T.; Garric, G.; Brulé, G. Initiation à la Technologie Fromagère, 2nd ed.; Lavoisier/TEC&DOC: Paris, France, 2017; p. 210. [Google Scholar]
- D’Acampora Zellner, B.; Dugo, P.; Dugo, G.; Mondello, L. Gas chromatography-olfactometry in food flavor analysis. J. Chromatogr. Anal. 2008, 1186, 123–143. [Google Scholar] [CrossRef]
- Breer, H.; Fleischer, J.; Strotmann, J. The sense of smell: Multiple olfactory subsystems. Cell. Mol. Life Sci. 2006, 63, 1465–1475. [Google Scholar] [CrossRef] [PubMed]
- O’ Callaghan, T.F.; Mannion, D.T.; Henessy, D.; McAuliffe, S.; O’ Sullivan, M.G.; Leeuwendaal, N.; Beresford, T.P.; Dillon, P.; Kilcawley, K.N.; Sheehan, J.J.; et al. Effect of pasture versus indoor feeding systems on quality characteristics, nutritional composition and sensory and volatile properties of full-fat Cheddar cheese. J. Dairy Sci. 2017, 100, 6053–6073. [Google Scholar] [CrossRef] [PubMed]
- McSweeney, P.L.H.; Sousa, M.J. Biochemical pathways for the production of flavor compounds in cheeses during ripening: A review. Lait 2000, 80, 293–324. [Google Scholar] [CrossRef]
- McSweeney, P.L.H.; Fox, P.F.; Ciocia, F. Metabolism of Residual Lactose and of Lactate and Citrate. In Cheese—Chemistry, Physics and Microbiology, 4th ed.; McSweeney, P., Fox, P., Cotter, P., Everett, D., Eds.; Academic Press: San Diego, CA, USA, 2017; Volume 1, pp. 411–421. [Google Scholar]
- Alewijn, M. Formation of Fat-Derived Flavor Compounds During the Ripening of Gouda-Type Cheese. Ph.D. Thesis, Wageningen University, Wageningen, The Netherlands, 2006. [Google Scholar]
- Collins, Y.F.; McSweeney, P.L.H.; Wilkinson, M.G. Lipolysis and free fatty acid catabolism in cheese: A review of current knowledge. Int. Dairy J. 2003, 13, 841–866. [Google Scholar] [CrossRef]
- McSweeney, P.L.H. Biochemistry of Cheese Ripening: Introduction and Overview. In Cheese—Chemistry, Physics and Microbiology, 4th ed.; McSweeney, P., Fox, P., Cotter, P., Everett, D., Eds.; Academic Press: San Diego, CA, USA, 2017; Volume 1, pp. 379–387. [Google Scholar]
- Fox, P.F.; Guinee, T.P.; Cogan, T.M.; McSweeney, P.L.H. Fundamentals of Cheese Science-Biochemistry of Cheese Ripening, 1st ed.; Springer: New York, NY, USA, 2017; pp. 391–442. [Google Scholar]
- Singh, T.K.; Drake, M.A.; Cadwallader, K.R. Flavor of Cheddar cheese: A chemical and sensory perspective. Compr. Rev. Food Sci. Food Saf. 2003, 2, 166–189. [Google Scholar] [CrossRef]
- Smit, G.; Smit, B.A.; Engels, W.J.M. Flavor formation by lactic acid bacteria and biochemical flavor profiling of cheese products. FEMS Microbiol. Rev. 2005, 29, 591–610. [Google Scholar] [CrossRef]
- Thierry, A.; Collins, Y.F.; Mukdsi, M.C.A.; McSweeney, P.L.H.; Wilkinson, M.G.; Spinnler, H.E. Lipolysis and Metabolism of Fatty Acids in Cheese. In Cheese—Chemistry, Physics and Microbiology, 4th ed.; McSweeney, P., Fox, P., Cotter, P., Everett, D., Eds.; Academic Press: San Diego, CA, USA, 2017; Volume 1. [Google Scholar]
- Curioni, P.M.G.; Bosset, J.O. Key odorants in various cheese types as determined by gas chromatography-olfactometry. Int. Dairy J. 2002, 12, 959–984. [Google Scholar] [CrossRef]
- Liu, S.Q.; Holland, R.; Crow, V.L. Esters and their biosynthesis in fermented dairy products: A review. Int. Dairy J. 2004, 14, 923–945. [Google Scholar] [CrossRef]
- Sablé, S.; Cottenceau, G. Current knowledge of soft cheeses flavor and related compounds. J. Agric. Food Chem. 1999, 47, 4825–4836. [Google Scholar] [CrossRef]
- Yvon, M.; Rijnen, L. Cheese flavour formation by amino acid catabolism. Int. Dairy J. 2001, 11, 185–201. [Google Scholar] [CrossRef]
- Roseiro, L.B.; Barbosa, M.; Ames, J.M.; Wilbey, R.A. Cheesemaking with vegetable coagulants—The use of Cynara L. for the production of ovine milk cheeses. Int. J. Dairy Technol. 2003, 56, 76–85. [Google Scholar] [CrossRef]
- Faro, C.C.; Moir, A.J.; Pires, E.V. Specificity of a milk-clotting enzyme extracted from the thistle Cynara cardunculus L.: Action on oxidized insulin and K- casein. Biotechnol. Lett. 1992, 14, 841–846. [Google Scholar] [CrossRef]
- Barron, L.J.R.; Redondo, J.; Aramburu, M.; Pérez-Elortondo, F.J.; Albisu, M.; Nájera, A.I.; de Renobales, M. Variations in volatile compounds and flavour in Idiazabal cheese manufactured from ewe’s milk in farmhouse and factory. J. Sci. Food Agric. 2005, 85, 1660–1671. [Google Scholar] [CrossRef]
- Pirisi, A.; Pinna, G.; Addis, M.; Piredda, G.; Mauriello, R.; De Pascale, S.; Chianese, L. Relationship between the enzymatic composition of lamb rennet paste and proteolytic, lipolytic pattern and texture of PDO Fiore Sardo ovine cheese. Int. Dairy J. 2007, 17, 143–156. [Google Scholar] [CrossRef]
- Lay, A.M.; Kolpin, K.M.; Sommer, D.A.; Rankin, S.A. Hot topic: Black spot defect in Cheddar cheese linked to intramammary teat sealant. J. Dairy Sci. 2007, 90, 4938–4941. [Google Scholar] [CrossRef] [PubMed]
- Walstra, P.; Wouters, J.P.M.; Geurts, T.J. Dairy Science and Technology, 2nd ed.; CRC Press-Taylor & Francis Group, L.L.C.: Boca Raton, FL, USA, 2006; pp. 577–582. [Google Scholar]
- Caridi, A.; Micari, P.; Caparra, P.; Cufari, A.; Sarullo, V. Ripening and seasonal changes in microbial groups and in physico-chemical properties of the ewes’ cheese Pecorino del Poro. Int. Dairy J. 2003, 13, 191–200. [Google Scholar] [CrossRef]
- IMAIAA. Regras de Produção do Queijo Serpa. Available online: https://ec.europa.eu/geographical-indications-register/eambrosia-public-api/api/v1/attachments/59825 (accessed on 15 March 2025).
- Nájera, A.I.; Barron, L.J.R.; Ribeiro, P.; Pélissier, F.; Abilleira, E.; Pérez-Elortondo, F.J.; Albisu, M.; Salmerón, J.; Gordoa, J.C.R.; Virto, M.; et al. Seasonal changes in the technological and compositional quality of ewe’s raw milks from commercial flocks under part-time grazing. J. Dairy Res. 2009, 76, 301–307. [Google Scholar] [CrossRef]
- Zabaleta, G.; Gourrat, K.; Barron, L.J.R.; Albisu, M.; Guichard, E. Identification of odor-active compounds in ewes’ raw milk commercial cheeses with sensory defects. Int. Dairy J. 2016, 58, 23–30. [Google Scholar] [CrossRef]
- Niimi, J.; Eddy, A.I.; Overington, A.R.; Silcock, P.; Bremer, P.J.; Delahunty, C.M. Sensory interactions between cheese flavor and taste. J. Sens. Stud. 2015, 30, 247–257. [Google Scholar] [CrossRef]
- Zehentbauer, G.; Reineccius, G. Determination of key aroma components of Cheddar cheese using dynamic headspace dilution assay. Flavor. Fragr. J. 2002, 17, 300–305. [Google Scholar] [CrossRef]
- Falih, M.A.; Altemimi, A.B.; Alkaisy, Q.H.; Awlqadr, F.H.; Abedelmaksoud, T.G.; Amjadi, S.; Hesarinejad, M.A. Enhancing safety and quality in the global cheese industry: A review of innovative preservation techniques. Heliyon 2024, 10, e40459. [Google Scholar] [CrossRef] [PubMed]
- Neviani, E.; Gatti, M.; Gardini, F.; Levante, A. Microbiota of Cheese Ecosystems: A Perspective on Cheesemaking. Foods 2025, 14, 830. [Google Scholar] [CrossRef] [PubMed]
- ISO 8586:2012; Sensory Analysis—General Guidelines for the Selection, Training and Monitoring of Selected Assessors and expert Sensory Assessors. ISO—International Organization for Standardization: Geneve, Switzerland, 2012.
- ISO 8589:2007; Sensory Analysis—General Guidance for the Design of Test Rooms. ISO—International Organization for Standardization: Geneve, Switzerland, 2007.
- NP EN ISO/IEC 17025:2018; General Requirements for the Competence of Testing and Calibration Laboratories. Portuguese Accreditation Institute: Caparica, Portugal, 2018.
- Choi, H.; Moon, J.K.; Seo, J.S. Establishment of retention index library on gas chromatography-mass spectrometry for nontargeted metabolite profiling approach. J. Korean Soc. Appl. Biol. Chem. 2013, 56, 87–90. [Google Scholar] [CrossRef]
- Stein, S. Mass spectral reference libraries: An ever-expanding resource for chemical identification. Anal. Chem. 2012, 84, 7274–7282. [Google Scholar] [CrossRef]
- Boltar, I.; Majhenič, A.Č.; Jarni, K.; Jug, T.; Kralij, M.B. Research of volatile compounds in cheese affected by different technological parameters. J. Food Nutr. Res. 2019, 58, 75–84. [Google Scholar]
- Marangoz, B.; Bostan, K. Identification of off-odor compounds in Turkish white cheese with putrid defects by SPME-GC/MS. Acta Vet. Eurasia 2020, 46, 125–131. [Google Scholar] [CrossRef]
- Suriyaphan, O.; Drake, M.; Chen, X.Q.; Cadwallader, K.R. Characteristic aroma components of British Farmhouse Cheddar cheese. J. Agric. Food Chem. 2001, 49, 1382–1387. [Google Scholar] [CrossRef]
- Gómez-Torres, N.; Garde, S.; Peirotén, A.; Ávila, M. Impact of Clostridium spp. on cheese characteristics: Microbiology, color, formation of volatile compounds and off-flavors. Food Control 2015, 56, 186–194. [Google Scholar] [CrossRef]
- Nogueira, M.C.L.; Lubachevsky, G.; Rankin, S.A. A study of the volatile composition of Minas cheese. LWT-Food Sci. Technol. 2005, 38, 555–563. [Google Scholar] [CrossRef]
- Bord, C.; Lenoir, L.; Benoit, J.; Guérinon, D.; Dechambre, G.; Chassard, C.; Christian, C. Characterization of Cantal and Salers Protected Designation of Origin Cheeses based on sensory analysis, physicochemical characteristics and volatile compounds. Appl. Sci. 2025, 15, 961. [Google Scholar] [CrossRef]
- Cabiddu, A.; Addis, M.; Pinna, G.; Spada, S.; Fiori, M.; Sitzia, M.; Pirisi, A.; Piredda, G.; Molle, G. The inclusion of a daisy plant (Chrysanthemum coronarium) in dairy sheep diet. 1: Effect on milk and cheese fatty acid composition with particular reference to C18:2 cis-9, trans-11. Livest. Sci. 2006, 101, 57–67. [Google Scholar] [CrossRef]
- Chen, C.; Liu, Z.; Yu, H.; Xu, Z.; Tian, H. Flavoromic determination of lactones in cheddar cheese by GC-MS-olfactometry, aroma extract dilution analysis, aroma recombination and omission analysis. Food Chem. 2022, 368, 130736. [Google Scholar] [CrossRef]
- Cadwallader, K.R.; Singh, T.K. Flavours and Off-Flavours in Milk and Dairy Products. In Advanced Dairy Chemistry; Springer: New York, NY, USA, 2009; Volume 3, pp. 631–690. [Google Scholar] [CrossRef]
- Kubickova, J.; Grosch, W. Quantification of potent odorants in Camembert cheese and calculation of their odor activity. Int. Dairy J. 1998, 8, 17–23. [Google Scholar] [CrossRef]
- Le Bars, D.; Yvon, M. Formation of diacetyl and acetoin by Lactococcus lactis via aspartate catabolism. J. Appl. Microbiol. 2008, 104, 171–177. [Google Scholar] [CrossRef]
- Ozturkoglu-Budak, S.; Wiebenga, A.; Bron, P.A.; de Vries, R.P. Protease and lipase activities of fungal and bacterial strains derived from an artisanal raw ewe’s milk cheese. Int. J. Food Microbiol. 2016, 237, 17–27. [Google Scholar] [CrossRef]
- Atik, D.S.; Akin, N.; Akal, C.; Koçak, C. The determination of volatile profile during the ripening period of traditional Tulum cheese from Turkey, produced in Anamur in the Central Taurus region and ripened in goatskin. Int. Dairy J. 2021, 11, 104991. [Google Scholar] [CrossRef]
- Tavaria, F.; Silva Ferreira, A.; Malcata, F. Volatile free fatty acids as ripening indicators for Serra da Estrela cheese. J. Dairy Sci. 2005, 87, 4064–4072. [Google Scholar] [CrossRef]
- Che, Y.; Yin, S.; Wang, H.; Yang, H.; Xu, R.; Wang, Q.; Wu, Y.; Boutet, J.; Huet, R.; Wang, C. Production of methionol from 3-methylthiopropionaldehyde by catalysis of yeast alcohol dehydrogenase Adh4p. J. Agric. Food. Chem. 2020, 68, 4650–4656. [Google Scholar] [CrossRef]
- Durlu-Özkaya, F.; Gün, İ. Flavor compounds of some traditional Turkish cheeses and their importance for Turkish cuisine. Food Nutr. Sci. 2014, 5, 425–434. [Google Scholar] [CrossRef]
- Whetstine, M.E.C.; Cadwallader, K.R.; Drake, M. Characterization of flavor compounds responsible for the rosy/floral flavor in Cheddar cheese. J. Agric. Food Chem. 2005, 53, 3126–3132. [Google Scholar] [CrossRef] [PubMed]
- Poulopoulou, I.; Zoidis, E.; Massouras, T.; Hadjigeorgiou, I. Terpenes transfer to milk and cheese after oral administration to sheep fed indoors. J. Anim. Physiol. Anim. Nutr. 2012, 96, 172–181. [Google Scholar] [CrossRef]
- Wang, J.; Yang, Z.J.; Xu, L.Y.; Wang, B.; Zhang, J.H.; Li, B.Z.; Cao, Y.P.; Tan, L. Key flavor compounds identified in Cheddar cheese with different ripening times by flavor extract dilution analysis, odor activity value, flavor recombination, and omission. J. Dairy Sci. 2021, 104, 1576–1590. [Google Scholar] [CrossRef]
- Ruíz, J.A.G.; Viñas, M.A.G.; Martínez-Castro, I.; Ballesteros, C.; Arellano, L.R. Relationships between volatile compounds and odor in Manchego cheese: Comparison between artisanal and industrial cheeses at different ripening times. Dairy Sci. Technol. 2002, 82, 613–628. [Google Scholar] [CrossRef]
- Ianni, A.; Bennato, F.; Martino, C.; Grotta, L.; Martino, G. Volatile flavor compounds in cheese as affected by ruminant Diet. Molecules 2020, 25, 461. [Google Scholar] [CrossRef]
- Amira, S.; Sifour, M.; Ouled-Haddard, H.; Hadef, S.; Khennoug, T.; Mauriello, G.; Maresca, D. Effect of different food stress conditions on the viability of encapsulated Lactobacillus plantarum and Lactobacillus casei isolated from klila (an algerian traditional fermented cheese). J. Microbiol. Biotechnol. Food Sci. 2019, 9, 38. [Google Scholar] [CrossRef]
- Wang, J.; Yang, Z.J.; Wang, Y.D.; Cao, Y.P.; Wang, B.; Lui, Y. The key flavor compounds and sensory characteristics of commercial Cheddar cheeses. J. Dairy Sci. 2021, 104, 7555–7571. [Google Scholar] [CrossRef] [PubMed]
- Jerković, I.; Kranjac, M.; Marijanović, Z.; Roje, M.; Jokić, S. Chemical diversity of headspace and volatile oil composition of two brown algae (Taonia atomaria and Padina pavonica) from the Adriatic Sea. Molecules 2019, 24, 495. [Google Scholar] [CrossRef]
- Khattab, A.R.; Guirguis, H.A.; Tawfikb, S.M.; Farag, M.A. Cheese ripening: A review on modern technologies towards flavor enhancement, process acceleration and improved quality assessment. Trends Food Sci. Technol. 2019, 88, 343–360. [Google Scholar] [CrossRef]
- Araújo-Rodrigues, H.; Martins, A.P.L.; Tavaria, F.K.; Santos, M.T.G.; Carvalho, M.J.; Dias, J.; Alvarenga, N.B.; Pintado, M.E. Organoleptic chemical markers of Serpa PDO cheese specificity. Foods 2022, 11, 1898. [Google Scholar] [CrossRef]


| Sensory Attribute | Description | Scores |
|---|---|---|
| Crust | Flat or wavy rind, thin or medium-thin; whole/continuous rind: with an intense straw-yellow or lemon-yellow and sometimes with dried molds spots. | 3.5–4.0 |
| Little adherent rind, malformed, with difficult cheese paste containment, with slits more or less extended and open, or hard and thick, with a white color, stained, or yellow-brownish intense color. | 2.0–3.0 | |
| Deeply deteriorated, excessive thickness and deeply stained. | 0.0–1.5 | |
| Shape and consistency | Regular with a side bulge and no sharp edges. Semi-soft consistency with some fluctuation—massive sound or slightly tympanic in sound. | 3.5–4.0 |
| Edges with hard consistency, or excessively deformable due to excessive softness; sharp tympanic sound. | 2.0–3.0 | |
| Exaggerated deformation; too much fluid consistency. | 0.0–1.5 | |
| Texture and paste color | Well-bonded, closed, or with some eyes, and a medium buttery paste; white-ivory, uniform color. | 5.5–6.0 |
| Badly bonded, hard center, haggard, or irregular, with interstitial water; white-matte color, white center with irregular coloration and stains. | 3.0–5.0 | |
| Not bonded, spongy; color white or stained with different tones. | 0.0–2.5 | |
| Taste and smell | Smooth taste or slightly sharp and spicy; smooth smell or slightly strong and ammoniacal. | 5.5–6.0 |
| Soapy, salty, bitter, strong, and unpleasant, strong and sharp ammoniacal smell. | 3.0–5.0 | |
| Disgusting taste and smell. | 0.0–2.5 |
| Serpa Cheese ID | Classification (Final Score) | Classification (Taste and Smell) | Sensory Quality Evaluation |
|---|---|---|---|
| 64 | 13.06 | 3.06 | Low score |
| 138 | 11.40 | 3.30 | |
| 313 | 14.30 | 3.60 | |
| 877 | 13.90 | 3.65 | |
| 63 | 14.72 | 3.72 | |
| 125 | 14.07 | 3.86 | |
| 628 | 14.70 | 4.25 | High score |
| 748 | 15.64 | 4.45 | |
| 679 | 17.27 | 5.14 | |
| 110 | 17.45 | 5.25 |
| [#] Tentatively Identified Compounds | Low Score | High Score | ||||||||||
|---|---|---|---|---|---|---|---|---|---|---|---|---|
| 63 | 64 | 125 | 138 | 313 | 877 | Average ± SEM | 110 | 628 | 679 | 748 | Average ± SEM | |
| [#3 *] Ethanol | 13.26 ± 0.24 bc | 11.95 ± 0.30 e | 15.29 ± 0.16 bc | 15.38 ± 0.84 b | 14.84 ± 0.50 bcd | 14.15 ± 1.02 bcd | 14.14 ± 0.32 a | 11.86 ± 0.14 e | 19.51 ± 0.59 a | 13.01 ± 0.71 de | 14.66 ± 0.21 bcd | 14.76 ± 0.89 a |
| [#8 *] 2-Butanol | 10.74 ± 1.37 a | 4.06 ± 030 d | 4.29 ± 0.38 d | 4.52 ± 0.61 cd | 11.31 ± 0.41 a | 6.59 ± 0.33 bc | 6.92 ± 0.75 a | 4.57 ± 0.20 cd | 7.91 ± 0.44 b | 4.18 ± 0.17 d | 4.25 ± 0.27 d | 5.23 ± 0.47 a |
| [#14] Isobutanol | 0.17 ± 0.02 a | 0.09 ± 0.02 ab | 0.12 ± 0.01 abc | 0.13 ± 0.03 abc | 0.16 ± 0.01 | 0.14 ± 0.02 ab | 0.14 ± 0.01 a | 0.16 ± 0.02 a | 0.08 ± 0.02 c | 0.15 ± 0.01 ab | 0.12 ± 0.01 abc | 0.13 ± 0.01 a |
| [#16] 2-Pentanol | 0.22 ± 0.16 a | 0.05 ± 0.02 a | 0.08 ± 0.00 a | 0.06 ± 0.01 a | 0.06 ± 0.01 a | 0.04 ± 0.01 a | 0.08 ± 0.02 a | 0.11 ± 0.01 a | 0.07 ± 0.01 a | 0.04 ± 0.03 a | 0.05 ± 0.01 a | 0.07 ± 0.01 a |
| [#18] 1-Butanol | 0.09 ± 0.02 cd | 0.18 ± 0.04 ab | 0.15 ± 0.04 abc | 0.22 ± 0.02 a | 0.06 ± 0.01 d | 0.12 ± 0.01 bcd | 0.14 ± 0.01 a | 0.15 ± 0.02 abc | 0.12 ± 0.01 bcd | 0.15 ± 0.02 abc | 0.14 ± 0.01 abc | 0.14 ± 0.01 a |
| [#26 *] Isoamyl alcohol | 5.25 ± 0.10 bc | 2.39 ± 0.20 e | 5.22 ± 0.20 bc | 6.56 ± 1.15 ab | 6.00 ± 0.21 b | 4.09 ± 0.17 cd | 4.92 ± 0.34 a | 7.75 ± 0.18 a | 2.87 ± 0.49 de | 5.64 ± 0.10 bc | 4.10 ± 0.23 cd | 5.09 ± 0.55 a |
| [#34] 1H,1H,2H,2H-Perfluorooctan-1-ol isomer | 0.14 ± 0.11 bcd | 0.10 ± 0.04 bcd | 0.09 ± 0.06 bcd | 0.30 ± 0.03 ab | 0.05 ± 0.02 cd | 0.33 ± 0.04 ab | 0.17 ± 0.03 a | 0.05 ± 0.02 d | 0.29 ± 0.11 abc | 0.02 ± 0.01 d | 0.48 ± 0.10 a | 0.21 ± 0.06 a |
| [#44] 2-Heptanol | 0.46 ± 0.07 a | 0.14 ± 0.02 cd | 0.16 ± 0.02 cd | 0.12 ± 0.02 cd | 0.06 ± 0.01 d | 0.14 ± 0.03 cd | 0.18 ± 0.03 a | 0.38 ± 0.04 ab | 0.26 ± 0.07 bc | 0.23 ± 0.08 bcd | 0.09 ± 0.01 d | 0.24 ± 0.03 a |
| [#48] 1H,1H,2H,2H-Perfluorooctan-1-ol isomer | 0.01 ± 0.01 c | 0.01 ± 0.00 c | 0.01 ± 0.01 c | 0.03 ± 0.01 bc | 0.00 ± 0.01 c | 0.06 ± 0.02 ab | 0.02 ± 0.01 a | <0.01 c | 0.02 ± 0.01 c | <0.01 c | 0.10 ± 0.02 a | 0.03 ± 0.01 a |
| [#59 *] 2-Butoxyethanol | 0.29 ± 0.01 b | 0.05 ± 0.00 c | 0.07 ± 0.02 c | 0.08 ± 0.02 c | 0.84 ± 0.04 a | 0.28 ± 0.07 b | 0.27 ± 0.07 a | 0.37 ± 0.03 b | 0.05 ± 0.01 c | 0.29 ± 0.01 b | 0.31 ± 0.04 b | 0.26 ± 0.04 a |
| [#68] 2-Ethylhexanol | 0.02 ± 0.01 c | 0.06 ± 0.02 abc | 0.11 ± 0.02 ab | 0.05 ± 0.01 abc | 0.05 ± 0.01 bc | 0.08 ± 0.02 abc | 0.06 ± 0.01 a | 0.05 ± 0.02 abc | 0.02 ± 0.01 c | 0.07 ± 0.04 abc | 0.13 ± 0.04 a | 0.07 ± 0.01 a |
| [#75] 2,3-Butanediol | 0.03 ± 0.01 de | 0.01 ± 0.00 f | 0.03 ± 0.00 e | 0.03 ± 0.01 e | 0.05 ± 0.01 cd | 0.01 ± 0.00 f | 0.03 ± 0.00 b | 0.09 ± 0.01 b | 0.05 ± 0.00 c | 0.17 ± 0.01 a | 0.01 ± 0.00 f | 0.08 ± 0.02 a |
| [#76] trans,trans-2,4-Hexadien-1-ol | <0.01 c | <0.01 c | <0.01 c | 0.03 ± 0.01 a | <0.01 c | <0.01 c | 0.01 ± 0.00 a | <0.01 c | 0.02 ± 0.02 ab | <0.01 c | 0.01 ± 0.01 bc | 0.01 ± 0.00 a |
| [#80] trans-2-octenol | <0.01 d | <0.01 d | <0.01 d | 0.02 ± 0.01 bc | 0.01 ± 0.00 c | 0.01 ± 0.00 c | 0.01 ± 0.00 b | 0.04 ± 0.01 a | 0.01 ± 0.00 c | 0.02 ± 0.00 b | <0.01 d | 0.02 ± 0.00 a |
| [#84] Furfuryl alcohol | <0.01 c | <0.01 c | 0.01 ± 0.00 abc | 0.02 ± 0.01 ab | 0.02 ± 0.00 a | 0.00 ± 0.01 bc | 0.01 ± 0.00 a | <0.01 c | 0.01 ± 0.00 abc | 0.01 ± 0.00 abc | 0.01 ± 0.00 abc | 0.01 ± 0.00 a |
| [#90] Methionol | <0.01 c | 0.01 ± 0.00 c | 0.03 ± 0.01 bc | 0.05 ± 0.02 b | 0.01 ± 0.00 c | 0.02 ± 0.00 c | 0.02 ± 0.00 b | 0.09 ± 0.01 a | <0.01 c | 0.11 ± 0.01 a | 0.01 ± 0.01 c | 0.06 ± 0.01 a |
| [#97] 1-Decanol | 0.01 ± 0.00 d | 0.08 ± 0.01 ab | 0.02 ± 0.01 cd | 0.00 ± 0.01 d | 0.01 ± 0.01 d | 0.10 ± 0.02 a | 0.04 ± 0.01 a | 0.02 ± 0.02 cd | 0.01 ± 0.00 d | 0.01 ± 0.01 d | 0.05 ± 0.01 bc | 0.02 ± 0.01 a |
| [#104] 1-Phenyl-2-propanol | <0.01 b | <0.01 b | 0.01 ± 0.01 a | <0.01 b | <0.01 b | 0.01 ± 0.00 a | <0.01 a | <0.01 b | 0.01 ± 0.00 a | <0.01 b | <0.01 b | <0.01 a |
| [#109 *] Benzyl alcohol | 0.18 ± 0.01 bc | 0.12 ± 0.01 cd | 0.18 ± 0.02 bc | 0.04 ± 0.02 d | 0.36 ± 0.01 a | 0.17 ± 0.04 bcd | 0.18 ± 0.02 a | 0.29 ± 0.09 ab | 0.04 ± 0.00 d | 0.16 ± 0.05 bcd | 0.10 ± 0.01 cd | 0.15 ± 0.03 a |
| [#115 *] Phenethyl alcohol | 1.40 ± 0.02 b | 0.48 ± 0.05 ef | 1.10 ± 0.05 bcd | 1.93 ± 0.27 a | 0.98 ± 0.07 cd | 0.77 ± 0.08 de | 1.11 ± 0.12 a | 1.22 ± 0.08 bc | 0.28 ± 0.02 f | 1.03 ± 0.09 bcd | 0.53 ± 0.05 ef | 0.77 ± 0.11 a |
| [#120] 1-Dodecanol | 0.02 ± 0.01 a | <0.01 b | <0.01 b | 0.01 ± 0.01 a | 0.01 ± 0.00 ab | <0.01 b | 0.01 ± 0.00 a | <0.01 b | 0.01 ± 0.01 ab | <0.01 b | <0.01 b | <0.01 b |
| Alcohol | 32.28 ± 1.49 ab | 19.78 ± 0.60 e | 26.96 ± 0.34 cd | 29.59 ± 2.00 bc | 34.88 ± 0.60 a | 27.12 ± 0.98 cd | 28.44 ± 1.18 a | 27.21 ± 0.38 cd | 31.64 ± 0.51 ab | 25.28 ± 0.76 d | 25.15 ± 0.60 d | 27.32 ± 0.80 a |
| [#12 *] Hexanal | <0.01 b | 0.01 ± 0.01 ab | <0.01 b | 0.01 ± 0.00 ab | <0.01 b | 0.01 ± 0.01 ab | <0.01 a | <0.01 b | 0.02 ± 0.01 a | <0.01 b | 0.01 ± 0.00 ab | 0.01 ± 0.00 a |
| [#58] Nonanal | 0.04 ± 0.03 a | 0.05 ± 0.01 a | 0.07 ± 0.03 a | 0.06 ± 0.03 a | 0.03 ± 0.01 a | 0.04 ± 0.01 a | 0.05 ± 0.01 a | 0.01 ± 0.01 a | 0.07 ± 0.06 a | 0.02 ± 0.01 a | 0.04 ± 0.03 a | 0.04 ± 0.01 a |
| [#61] trans-2-Octenal | <0.01 a | 0.01 ± 0.00 a | <0.01 a | <0.01 a | <0.01 a | <0.01 a | <0.01 a | <0.01 a | <0.01 a | <0.01 a | 0.01 ± 0.01 a | <0.01 a |
| [#70] Benzaldehyde | 0.32 ± 0.07 a | 0.27 ± 0.04 ab | 0.16 ± 0.07 bcd | 0.03 ± 0.01 d | 0.08 ± 0.01 cd | 0.24 ± 0.04 abc | 0.19 ± 0.03 a | 0.16 ± 0.05 bcd | 0.23 ± 0.03 abc | 0.06 ± 0.04 d | 0.14 ± 0.03 bcd | 0.15 ± 0.02 a |
| Aldehyde | 0.37 ± 0.05 a | 0.34 ± 0.03 a | 0.23 ± 0.06 abc | 0.10 ± 0.03 c | 0.11 ± 0.02 c | 0.28 ± 0.04 ab | 0.24 ± 0.03 a | 0.17 ± 0.04 bc | 0.32 ± 0.05 ab | 0.08 ± 0.04 c | 0.20 ± 0.06 abc | 0.19 ± 0.03 a |
| [#6] Decane | 0.14 ± 0.04 ab | 0.10 ± 0.04 ab | 0.16 ± 0.07 a | 0.05 ± 0.01 ab | 0.02 ± 0.01 b | 0.02 ± 0.02 b | 0.08 ± 0.01 a | 0.03 ± 0.02 b | 0.07 ± 0.02 ab | 0.04 ± 0.03 ab | 0.03 ± 0.03 b | 0.05 ± 0.01 a |
| [#10] 3-Methyldecane | 0.02 ± 0.01 abc | 0.03 ± 0.01 ab | 0.04 ± 0.01 a | 0.01 ± 0.01 abc | 0.01 ± 0.01 bc | 0.01 ± 0.00 bc | 0.02 ± 0.00 a | <0.01 c | 0.01 ± 0.01 abc | 0.01 ± 0.01 bc | 0.01 ± 0.01 bc | 0.01 ± 0.00 b |
| [#13] Undecane | 0.03 ± 0.01 a | 0.03 ± 0.01 a | 0.04 ± 0.02 a | 0.01 ± 0.01 a | 0.04 ± 0.01 a | 0.03 ± 0.02 a | 0.03 ± 0.00 a | 0.01 ± 0.01 a | 0.02 ± 0.01 a | 0.01 ± 0.01 a | 0.01 ± 0.01 a | 0.01 ± 0.00 b |
| Alkane | 0.20 ± 0.05 ab | 0.16 ± 0.06 ab | 0.23 ± 0.10 a | 0.07 ± 0.02 ab | 0.07 ± 0.01 ab | 0.06 ± 0.03 b | 0.13 ± 0.02 a | 0.04 ± 0.03 b | 0.10 ± 0.03 ab | 0.06 ± 0.04 ab | 0.05 ± 0.03 b | 0.07 ± 0.01 b |
| [#96] Acetamide | 0.02 ± 0.01 a | 0.01 ± 0.00 a | <0.01 a | 0.01 ± 0.00 a | <0.01 a | <0.01 a | 0.01 ± 0.00 a | 0.01 ± 0.00 a | 0.01 ± 0.01 a | 0.01 ± 0.00 a | <0.01 a | 0.01 ± 0.00 a |
| [#98] Formamide | <0.01 b | <0.01 b | 0.01 ± 0.00 ab | <0.01 b | <0.01 b | <0.01 b | <0.01 a | <0.01 b | <0.01 b | 0.01 ± 0.01 a | <0.01 b | <0.01 a |
| Amide | 0.02 ± 0.01 a | 0.01 ± 0.00 a | 0.01 ± 0.01 a | 0.01 ± 0.00 a | <0.01 a | <0.01 a | 0.01 ± 0.00 a | 0.01 ± 0.00 a | 0.01 ± 0.01 a | 0.02 ± 0.01 a | <0.01 a | 0.01 ± 0.00 a |
| [#54] 2-Ethylbutyric acid | <0.01 b | <0.01 b | <0.01 b | <0.01 b | <0.01 b | 0.02 ± 0.01 a | <0.01 a | <0.01 b | <0.01 b | <0.01 b | <0.01 b | <0.01 a |
| [#64 *] Acetic acid | 5.98 ± 0.22 c | 2.82 ± 0.16 f | 5.58 ± 0.17 c | 7.38 ± 0.35 b | 4.16 ± 0.22 e | 4.44 ± 0.22 de | 5.06 ± 0.36 b | 7.18 ± 0.32 b | 7.99 ± 0.19 ab | 8.45 ± 0.27 a | 5.18 ± 0.14 cd | 7.20 ± 0.38 a |
| [#72 *] Propanoic acid | 0.72 ± 0.11 e | 7.17 ± 0.12 a | 2.64 ± 0.06 cd | 1.16 ± 0.08 e | 4.60 ± 0.29 b | 2.29 ± 0.10 d | 3.10 ± 0.53 a | 1.13 ± 0.09 e | 0.48 ± 0.08 f | 0.78 ± 0.03 ef | 2.91 ± 0.13 c | 1.33 ± 0.29 b |
| [#74 *] Isobutyric acid | 0.32 ± 0.03 g | 1.92 ± 0.08 d | 2.77 ± 0.05 bc | 1.23 ± 0.12 e | 0.77 ± 0.02 f | 3.02 ± 0.16 ab | 1.67 ± 0.24 a | 3.24 ± 0.17 a | 0.76 ± 0.04 f | 2.46 ± 0.13 c | 2.41 ± 0.02 c | 2.22 ± 0.27 a |
| [#81 *] Butanoic acid | 4.83 ± 0.19 f | 16.49 ± 0.47 a | 12.06 ± 0.07 b | 7.73 ± 0.21 cd | 3.69 ± 0.19 b | 6.84 ± 0.23 de | 8.61 ± 1.07 a | 6.41 ± 0.10 e | 4.43 ± 0.14 fg | 8.24 ± 0.17 c | 11.28 ± 0.41 b | 7.59 ± 0.76 a |
| [#86 *] Isovaleric acid | 1.83 ± 0.05 f | 6.55 ± 0.11 d | 8.75 ± 0.19 b | 6.66 ± 0.30 d | 2.67 ± 0.23 f | 7.55 ± 0.07 c | 5.67 ± 0.61 b | 11.45 ± 0.46 a | 3.95 ± 0.20 e | 8.95 ± 0.28 b | 7.14 ± 0.16 cd | 7.87 ± 0.83 a |
| [#93 *] Valeric acid | 0.24 ± 0.07 b | 1.45 ± 0.23 a | 0.30 ± 0.02 b | 0.25 ± 0.03 b | 0.11 ± 0.01 b | 0.30 ± 0.01 b | 0.44 ± 0.11 a | 0.28 ± 0.02 b | 0.20 ± 0.03 b | 0.37 ± 0.01 b | 0.37 ± 0.06 b | 0.30 ± 0.02 a |
| [#102] 4-Methylvaleric acid | <0.01 d | 0.19 ± 0.02 a | 0.11 ± 0.01 b | 0.04 ± 0.01 c | <0.01 d | 0.05 ± 0.01 c | 0.07 ± 0.02 a | 0.05 ± 0.00 c | 0.03 ± 0.00 cd | 0.05 ± 0.00 c | 0.10 ± 0.02 b | 0.06 ± 0.01 a |
| [#105 *] Caproic acid | 6.78 ± 0.45 e | 10.23 ± 0.46 a | 7.59 ± 0.18 bcde | 8.46 ± 0.90 bcd | 5.04 ± 0.16 f | 7.41 ± 0.23 cde | 7.58 ± 0.39 a | 7.00 ± 0.29 de | 6.45 ± 0.08 ef | 8.78 ± 0.35 abc | 9.01 ± 0.30 ab | 7.81 ± 0.34 a |
| [#113] 5-Hexenoic acid | 0.01 ± 0.01 d | 0.16 ± 0.02 a | 0.09 ± 0.00 b | 0.04 ± 0.02 cd | 0.01 ± 0.00 cd | 0.04 ± 0.01 c | 0.06 ± 0.01 a | 0.09 ± 0.01 b | 0.02 ± 0.01 cd | 0.11 ± 0.00 b | 0.08 ± 0.01 b | 0.08 ± 0.01 a |
| [#114] 4-Hexenoic acid | <0.01 b | <0.01 b | <0.01 b | <0.01 b | 0.73 ± 0.02 a | <0.01 b | 0.12 ± 0.07 a | <0.01 b | <0.01 b | <0.01 b | <0.01 b | <0.01 a |
| [#116] 2-Methylhexanoic acid | 0.01 ± 0.00 c | 0.19 ± 0.03 a | 0.07 ± 0.01 b | 0.02 ± 0.01 c | 0.01 ± 0.01 c | <0.01 c | 0.05 ± 0.02 a | 0.03 ± 0.02 bc | <0.01 c | 0.02 ± 0.01 bc | 0.03 ± 0.02 bc | 0.02 ± 0.00 a |
| [#118 *] Heptanoic acid | 0.38 ± 0.05 b | 0.37 ± 0.04 b | 0.21 ± 0.01 c | 0.33 ± 0.03 bc | 0.29 ± 0.02 bc | 0.63 ± 0.02 a | 0.37 ± 0.03 a | 0.24 ± 0.03 c | 0.27 ± 0.01 bc | 0.30 ± 0.06 bc | 0.39 ± 0.03 b | 0.30 ± 0.02 a |
| [#124] Caprylic acid | 4.62 ± 0.31 ab | 4.83 ± 0.40 ab | 3.64 ± 0.11 bc | 5.25 ± 0.87 a | 3.61 ± 0.04 bc | 4.47 ± 0.08 ab | 4.40 ± 0.17 a | 4.13 ± 0.11 abc | 3.04 ± 0.07 c | 4.43 ± 0.42 ab | 4.50 ± 0.14 ab | 4.03 ± 0.19 a |
| [#128] Sorbic acid isomer | <0.01 b | <0.01 b | 0.01 ± 0.01 b | 0.08 ± 0.02 a | <0.01 b | <0.01 b | 0.02 ± 0.01 a | 0.01 ± 0.00 b | <0.01 b | <0.01 b | <0.01 b | <0.01 a |
| [#129] Sorbic acid isomer | 0.01 ± 0.01 b | 0.02 ± 0.00 b | 0.01 ± 0.01 b | 1.72 ± 0.24 a | 0.01 ± 0.00 b | 0.01 ± 0.00 b | 0.30 ± 0.16 a | 0.01 ± 0.01 b | 0.01 ± 0.01 b | <0.01 b | 0.04 ± 0.04 b | 0.01 ± 0.01 a |
| [#130 *] Nonanoic acid | 1.06 ± 0.06 a | 0.77 ± 0.24 ab | 0.25 ± 0.07 b | 0.59 ± 0.33 ab | 0.61 ± 0.14 ab | 0.63 ± 0.15 ab | 0.65 ± 0.07 a | 1.15 ± 0.18 a | 0.16 ± 0.02 b | 0.69 ± 0.16 ab | 0.33 ± 0.13 b | 0.58 ± 0.12 a |
| [#134 *] n-Capric acid | 4.57 ± 0.44 d | 3.06 ± 0.23 bcd | 2.21 ± 0.06 cd | 4.10 ± 1.02 ab | 3.35 ± 0.05 abc | 3.84 ± 0.08 ab | 3.52 ± 0.21 a | 2.79 ± 0.07 bcd | 1.84 ± 0.06 d | 3.18 ± 0.19 bcd | 2.96 ± 0.04 bcd | 2.69 ± 0.16 b |
| [#135] Caproleic acid | 0.28 ± 0.03 a | 0.10 ± 0.01 c | 0.08 ± 0.02 c | 0.15 ± 0.05 b | 0.13 ± 0.01 c | 0.15 ± 0.01 b | 0.15 ± 0.02 a | 0.10 ± 0.00 c | 0.05 ± 0.01 c | 0.11 ± 0.02 c | 0.10 ± 0.01 c | 0.09 ± 0.01 b |
| [#136] Undecanoic acid | 0.05 ± 0.01 ab | 0.02 ± 0.00 c | 0.02 ± 0.01 c | 0.02 ± 0.01 c | 0.04 ± 0.00 b | 0.06 ± 0.01 a | 0.04 ± 0.00 a | 0.02 ± 0.00 c | 0.01 ± 0.01 c | 0.02 ± 0.00 c | 0.02 ± 0.00 c | 0.02 ± 0.00 b |
| [#140] Benzoic acid | 0.06 ± 0.01 bc | 0.07 ± 0.01 b | 0.03 ± 0.00 d | 0.08 ± 0.01 ab | 0.04 ± 0.01 cd | 0.06 ± 0.01 b | 0.06 ± 0.00 a | 0.07 ± 0.01 b | <0.01 e | 0.11 ± 0.01 a | 0.06 ± 0.00 bc | 0.06 ± 0.01 a |
| [#141 *] Lauric acid | 0.44 ± 0.08 a | 0.22 ± 0.04 bcd | 0.15 ± 0.00 cd | 0.23 ± 0.06 bcd | 0.31 ± 0.03 ab | 0.43 ± 0.02 a | 0.30 ± 0.03 a | 0.17 ± 0.01 bcd | 0.13 ± 0.02 d | 0.20 ± 0.03 bcd | 0.27 ± 0.01 bc | 0.19 ± 0.02 b |
| [#143] Phenylpropanedioic acid | <0.01 b | <0.01 b | 0.07 ± 0.01 a | <0.01 b | <0.01 b | 0.07 ± 0.01 a | 0.02 ± 0.01 a | <0.01 b | <0.01 b | <0.01 b | 0.09 ± 0.03 a | 0.02 ± 0.01 a |
| [#144] Myristic acid | 0.12 ± 0.04 ab | 0.14 ± 0.01 ab | 0.12 ± 0.04 ab | 0.19 ± 0.01 ab | 0.14 ± 0.02 ab | 0.18 ± 0.02 ab | 0.15 ± 0.01 a | 0.09 ± 0.03 b | 0.11 ± 0.03 ab | 0.08 ± 0.03 b | 0.18 ± 0.01 ab | 0.12 ± 0.01 b |
| Carboxylic acid | 32.32 ± 1.96 d | 56.85 ± 1.19 a | 46.77 ± 0.27 bc | 45.72 ± 2.60 bc | 30.32 ± 1.18 d | 42.54 ± 0.47 c | 42.42 ± 2.20 a | 45.63 ± 0.78 bc | 29.94 ± 0.33 d | 47.33 ± 0.61 b | 47.46 ± 1.08 b | 42.59 ± 2.22 a |
| [#25] n-Propylbenzene | <0.01 a | <0.01 a | <0.01 a | <0.01 a | <0.01 a | <0.01 a | <0.01 a | <0.01 a | <0.01 a | <0.01 a | <0.01 a | <0.01 a |
| [#30] Sec-butylbenzene | <0.01 a | <0.01 a | <0.01 a | <0.01 a | <0.01 a | <0.01 a | <0.01 a | <0.01 a | <0.01 a | <0.01 a | <0.01 a | <0.01 a |
| [#31] Styrene | 0.02 ± 0.01 ab | 0.03 ± 0.00 ab | 0.02 ± 0.00 ab | 0.06 ± 0.02 a | 0.01 ± 0.01 b | 0.03 ± 0.01 ab | 0.03 ± 0.00 a | 0.03 ± 0.02 ab | 0.01 ± 0.01 b | 0.04 ± 0.02 ab | 0.05 ± 0.01 ab | 0.03 ± 0.01 a |
| [#32] Cumene | 0.01 ± 0.01 a | <0.01 a | 0.01 ± 0.01 a | <0.01 a | <0.01 a | <0.01 a | <0.01 a | <0.01 a | <0.01 a | <0.01 a | <0.01 a | <0.01 a |
| [#36] 1,2,4-Trimethylbenzene | 0.04 ± 0.01 a | 0.03 ± 0.00 a | 0.04 ± 0.02 a | 0.01 ± 0.01 a | 0.01 ± 0.00 a | 0.01 ± 0.00 a | 0.02 ± 0.00 a | 0.01 ± 0.00 a | 0.03 ± 0.01 a | 0.02 ± 0.01 a | 0.02 ± 0.01 a | 0.02 ± 0.00 a |
| [#39] p-Diethylbenzene | <0.01 a | <0.01 a | <0.01 a | <0.01 a | <0.01 a | <0.01 a | <0.01 a | <0.01 a | <0.01 a | 0.01 ± 0.02 a | <0.01 a | <0.01 a |
| [#41] 1,3-Diethylbenzene | <0.01 a | <0.01 a | <0.01 a | <0.01 a | <0.01 a | <0.01 a | <0.01 a | <0.01 a | <0.01 a | <0.01 a | <0.01 a | <0.01 a |
| [#42] n-Butylbenzene | <0.01 a | <0.01 a | <0.01 a | <0.01 a | <0.01 a | <0.01 a | <0.01 a | <0.01 a | <0.01 a | <0.01 a | <0.01 a | <0.01 a |
| [#49] 2-Ethyl-p-xylene | 0.01 ± 0.01 a | <0.01 a | 0.01 ± 0.01 a | <0.01 a | <0.01 a | <0.01 a | <0.01 a | <0.01 a | <0.01 a | <0.01 a | <0.01 a | <0.01 a |
| [#52] 4-Ethyl-o-xylene | <0.01 a | <0.01 a | 0.01 ± 0.01 a | <0.01 a | <0.01 a | <0.01 a | <0.01 a | <0.01 a | <0.01 a | <0.01 a | <0.01 a | <0.01 a |
| [#95] p-Dimethoxybenzene | <0.01 a | <0.01 a | <0.01 a | <0.01 a | <0.01 a | <0.01 a | <0.01 a | <0.01 a | <0.01 a | <0.01 a | <0.01 a | <0.01 a |
| [#121] Phenol | 0.03 ± 0.01 b | 0.35 ± 0.13 ab | 0.09 ± 0.03 b | 0.10 ± 0.04 b | 0.02 ± 0.00 b | 0.11 ± 0.03 b | 0.12 ± 0.03 a | 0.04 ± 0.00 b | 0.02 ± 0.01 b | 0.03 ± 0.01 b | 0.66 ± 0.28 a | 0.19 ± 0.09 a |
| [#125] p-Cresol | 0.01 ± 0.00 bc | 0.02 ± 0.01 a | 0.01 ± 0.00 bc | <0.01 d | 0.01 ± 0.00 bc | 0.01 ± 0.00 bc | 0.01 ± 0.00 a | 0.01 ± 0.01 b | 0.01 ± 0.00 bc | <0.01 cd | <0.01 d | 0.01 ± 0.00 a |
| [#126] m-Cresol | <0.01 d | 0.03 ± 0.01 a | 0.02 ± 0.01 bc | <0.01 d | 0.01 ± 0.00 cd | 0.03 ± 0.01 ab | 0.01 ± 0.00 a | 0.02 ± 0.01 bc | <0.01 d | 0.01 ± 0.01 cd | <0.01 d | 0.01 ± 0.00 a |
| [#139] Indole | <0.01 b | 0.10 ± 0.06 a | 0.02 ± 0.01 b | <0.01 b | <0.01 b | <0.01 b | 0.02 ± 0.01 a | <0.01 b | <0.01 b | <0.01 b | <0.01 b | <0.01 a |
| [#142] 3-Methylindole | <0.01 a | <0.01 a | <0.01 a | <0.01 a | <0.01 a | <0.01 a | <0.01 a | <0.01 a | <0.01 a | <0.01 a | <0.01 a | <0.01 a |
| Cyclic Hydrocarbon | 0.13 ± 0.02 c | 0.57 ± 0.18 ab | 0.23 ± 0.04 bc | 0.17 ± 0.06 bc | 0.07 ± 0.01 c | 0.19 ± 0.03 bc | 0.23 ± 0.04 a | 0.11 ± 0.03 c | 0.07 ± 0.02 c | 0.12 ± 0.03 c | 0.73 ± 0.27 a | 0.26 ± 0.09 a |
| [#1] Ethyl acetate | 0.02 ± 0.01 b | <0.01 c | 0.05 ± 0.01 a | <0.01 c | <0.01 c | <0.01 c | 0.01 ± 0.00 a | <0.01 c | 0.03 ± 0.00 b | 0.02 ± 0.00 b | <0.01 c | 0.01 ± 0.00 a |
| [#5] Sec-butyl acetate | 0.02 ± 0.02 a | <0.01 a | <0.01 a | <0.01 a | 0.02 ± 0.01 a | <0.01 a | 0.01 ± 0.00 a | <0.01 a | <0.01 a | <0.01 a | <0.01 a | <0.01 a |
| [#9 *] Ethyl butyrate | 7.97 ± 0.67 ab | 4.74 ± 0.20 cd | 3.58 ± 0.18 d | 3.90 ± 0.98 d | 9.06 ± 0.92 a | 6.25 ± 0.28 bc | 5.92 ± 0.51 a | 4.61 ± 0.14 cd | 6.29 ± 0.34 bc | 4.64 ± 0.19 cd | 4.67 ± 0.43 cd | 5.05 ± 0.23 a |
| [#11 *] Ethyl isovalerate | 0.04 ± 0.01 b | 0.17 ± 0.05 a | 0.12 ± 0.05 ab | 0.12 ± 0.04 ab | 0.03 ± 0.01 b | 0.09 ± 0.01 ab | 0.10 ± 0.01 a | 0.10 ± 0.01 ab | 0.11 ± 0.02 ab | 0.08 ± 0.02 ab | 0.05 ± 0.02 b | 0.09 ± 0.01 a |
| [#15] Isoamyl acetate | 0.79 ± 0.09 ab | 0.22 ± 0.02 ef | 0.36 ± 0.01 def | 0.47 ± 0.08 cde | 0.58 ± 0.04 bcd | 0.21 ± 0.01 f | 0.44 ± 0.05 a | 0.71 ± 0.09 bc | 0.28 ± 0.01 ef | 0.96 ± 0.14 a | 0.24 ± 0.05 ef | 0.55 ± 0.09 a |
| [#20] Isobutyl butyrate] | 0.01 ± 0.01 ab | 0.01 ± 0.00 ab | 0.01 ± 0.01 ab | <0.01 b | 0.01 ± 0.00 ab | <0.01 ab | 0.01 ± 0.00 a | 0.02 ± 0.01 a | <0.01 b | 0.01 ± 0.01 ab | <0.01 b | 0.01 ± 0.00 a |
| [#21] Alkyl butyrate | <0.01 b | <0.01 b | <0.01 b | <0.01 b | <0.01 b | <0.01 b | <0.01 a | 0.01 ± 0.01 ab | <0.01 b | 0.02 ± 0.00 a | <0.01 b | 0.01 ± 0.00 a |
| [#27] 1-Methoxy-2-propyl acetate | <0.01 b | <0.01 b | 0.02 ± 0.01 a | 0.01 ± 0.01 ab | <0.01 b | <0.01 b | 0.01 ± 0.00 a | <0.01 b | <0.01 b | <0.01 b | <0.01 b | <0.01 b |
| [#28 *] Ethyl hexanoate isomer | 2.26 ± 0.19 abc | 2.25 ± 0.03 abc | 2.38 ± 0.26 abc | 2.09 ± 0.42 bc | 2.36 ± 0.14 abc | 2.70 ± 0.41 abc | 2.34 ± 0.07 a | 1.74 ± 0.21 c | 3.11 ± 0.07 a | 2.24 ± 0.12 abc | 3.02 ± 0.41 ab | 2.53 ± 0.18 a |
| [#29] Ethyl hexanoate isomer | 0.18 ± 0.11 ab | 0.42 ± 0.21 ab | 0.24 ± 0.03 ab | 0.14 ± 0.14 ab | 0.39 ± 0.06 ab | 0.62 ± 0.17 a | 0.33 ± 0.05 a | 0.08 ± 0.07 b | 0.36 ± 0.13 ab | 0.49 ± 0.18 ab | 0.18 ± 0.14 ab | 0.28 ± 0.06 a |
| [#33] Isoamyl butyrate | 0.20 ± 0.02 a | 0.07 ± 0.01 cde | 0.09 ± 0.01 bcde | 0.11 ± 0.06 bcd | 0.14 ± 0.01 abc | 0.03 ± 0.01 e | 0.11 ± 0.01 a | 0.17 ± 0.02 ab | 0.04 ± 0.01 de | 0.12 ± 0.01 abc | 0.07 ± 0.02 cde | 0.10 ± 0.02 a |
| [#35] Hexyl acetate | <0.01 a | <0.01 a | <0.01 a | <0.01 a | <0.01 a | <0.01 a | <0.01 a | <0.01 a | <0.01 a | <0.01 a | <0.01 a | <0.01 a |
| [#38] 2-Methylbutyl 2-methylbutyrate | 0.09 ± 0.05 | <0.01 c | 0.01 ± 0.00 c | 0.02 ± 0.02 bc | 0.19 ± 0.02 a | <0.01 c | 0.05 ± 0.02 a | 0.06 ± 0.02 bc | <0.01 c | 0.01 ± 0.01 c | <0.01 c | 0.02 ± 0.01 a |
| [#43] Propyl hexanoate | 0.01 ± 0.01 ab | 0.02 ± 0.00 a | <0.01 b | <0.01 b | 0.02 ± 0.00 a | <0.01 b | 0.01 ± 0.00 a | <0.01 b | <0.01 b | 0.01 ± 0.01 ab | 0.01 ± 0.00 ab | <0.01 a |
| [#45] Ethyl heptanoate | 0.03 ± 0.03 ab | 0.03 ± 0.01 ab | 0.04 ± 0.02 ab | <0.01 b | 0.03 ± 0.01 ab | 0.10 ± 0.06 a | 0.04 ± 0.01 a | <0.01 b | 0.05 ± 0.01 ab | 0.02 ± 0.01 ab | 0.03 ± 0.03 ab | 0.02 ± 0.01 a |
| [#50] Isobutyl hexanoate | 0.01 ± 0.00 a | <0.01 b | <0.01 b | <0.01 b | <0.01 b | <0.01 b | <0.01 a | <0.01 ab | <0.01 b | <0.01 b | <0.01 b | <0.01 a |
| [#53] Allyl caproate | 0.01 ± 0.00 a | <0.01 b | 0.01 ± 0.00 a | <0.01 b | <0.01 b | <0.01 b | <0.01 a | <0.01 b | <0.01 b | <0.01 b | 0.01 ± 0.01 a | <0.01 a |
| [#60] Butyl hexanoate | 0.02 ± 0.00 a | <0.01 c | <0.01 bc | <0.01 c | 0.01 ± 0.00 b | <0.01 c | 0.01 ± 0.00 a | <0.01 c | 0.01 ± 0.00 c | <0.01 c | 0.01 ± 0.01 bc | <0.01 a |
| [#62 *] Ethyl caprylate | 1.09 ± 0.17 ab | 1.48 ± 0.25 ab | 1.06 ± 0.31 ab | 0.52 ± 0.21 b | 1.13 ± 0.09 ab | 1.92 ± 0.99 a | 1.20 ± 0.14 a | 0.47 ± 0.12 b | 0.81 ± 0.06 ab | 0.70 ± 0.18 ab | 1.54 ± 0.09 ab | 0.88 ± 0.12 a |
| [#65] Isoamyl caproate | 0.10 ± 0.01 ab | 0.03 ± 0.01 cd | 0.03 ± 0.01 d | 0.03 ± 0.02 cd | 0.12 ± 0.01 a | 0.05 ± 0.02 bcd | 0.06 ± 0.01 a | 0.06 ± 0.02 bcd | 0.03 ± 0.01 cd | 0.09 ± 0.03 abc | 0.03 ± 0.01 d | 0.05 ± 0.01 a |
| [#66] Methyl 2-hydroxy-4-methyl valerate | 2.00 ± 0.05 a | 0.32 ± 0.02 d | 0.59 ± 0.06 c | 0.99 ± 0.14 b | 0.10 ± 0.04 ef | 0.27 ± 0.04 def | 0.71 ± 0.16 a | 0.31 ± 0.03 de | 0.31 ± 0.02 d | 0.08 ± 0.01 f | 0.32 ± 0.03 d | 0.26 ± 0.03 b |
| [#69] Ethyl sorbate | <0.01 a | <0.01 a | <0.01 a | 0.01 ± 0.00 a | <0.01 a | <0.01 a | <0.01 a | <0.01 a | <0.01 a | <0.01 a | <0.01 a | <0.01 a |
| [#73] Ethyl 2-hydroxy-4-methylpentanoate | 0.02 ± 0.01 b | <0.01 b | 0.01 ± 0.00 b | 0.02 ± 0.01 b | 0.01 ± 0.00 b | 0.01 ± 0.01 b | 0.01 ± 0.00 b | 0.01 ± 0.01 b | 0.06 ± 0.01 a | 0.01 ± 0.00 b | 0.02 ± 0.01 b | 0.03 ± 0.01 a |
| [#77] Methyl caprate | 0.01 ± 0.00 a | <0.01 a | <0.01 a | <0.01 a | <0.01 a | <0.01 a | <0.01 a | <0.01 a | <0.01 a | <0.01 a | <0.01 a | <0.01 a |
| [#82 *] Ethyl caprate | 1.09 ± 0.20 a | 0.90 ± 0.10 abc | 0.41 ± 0.04 d | 0.36 ± 0.15 d | 1.33 ± 0.10 a | 1.33 ± 0.22 a | 0.90 ± 0.10 a | 0.31 ± 0.09 d | 0.55 ± 0.04 bcd | 0.49 ± 0.10 cd | 0.98 ± 0.04 ab | 0.58 ± 0.08 b |
| [#85] Isoamyl octanoate | 0.01 ± 0.01 a | <0.01 b | <0.01 b | <0.01 b | <0.01 b | <0.01 b | <0.01 a | 0.01 ± 0.01 ab | <0.01 b | <0.01 b | <0.01 b | <0.01 a |
| [#87] Ethyl 9-decenoate | 0.07 ± 0.01 abc | 0.03 ± 0.01 de | 0.02 ± 0.01 e | 0.05 ± 0.02 bcde | 0.06 ± 0.01 bcd | 0.05 ± 0.02 bcde | 0.05 ± 0.00 a | 0.07 ± 0.01 ab | 0.03 ± 0.00 cde | 0.10 ± 0.02 a | 0.04 ± 0.00 bcde | 0.06 ± 0.01 a |
| [#89] 2-Ethoxyethyl butyrate | 0.07 ± 0.01 ab | <0.01 d | 0.04 ± 0.00 bcd | 0.09 ± 0.03 a | 0.05 ± 0.01 abc | 0.02 ± 0.00 cd | 0.04 ± 0.01 a | 0.06 ± 0.02 abc | 0.03 ± 0.01 bcd | 0.09 ± 0.02 d | 0.02 ± 0.00 cd | 0.05 ± 0.01 a |
| [#91] Propyl decanoate | 0.02 ± 0.00 b | 0.02 ± 0.00 b | 0.09 ± 0.02 a | <0.01 b | 0.01 ± 0.00 b | 0.01 ± 0.01 b | 0.02 ± 0.01 a | <0.01 b | <0.01 b | <0.01 b | 0.01 ± 0.01 b | <0.01 b |
| [#92] Benzyl acetate | <0.01 a | <0.01 a | <0.01 a | <0.01 a | <0.01 a | <0.01 a | <0.01 a | <0.01 a | <0.01 a | <0.01 a | <0.01 a | <0.01 a |
| [#94] Ethyl undecanoate | <0.01 a | <0.01 a | <0.01 a | <0.01 a | <0.01 a | 0.01 ± 0.00 a | <0.01 a | <0.01 a | <0.01 a | <0.01 a | <0.01 a | <0.01 a |
| [#99] Ethyl phenylacetate | <0.01 a | 0.01 ± 0.00 a | <0.01 a | 0.01 ± 0.01 a | <0.01 a | 0.01 ± 0.01 a | <0.01 a | <0.01 a | <0.01 a | <0.01 a | <0.01 a | <0.01 a |
| [#103] Phenethyl acetate | 0.01 ± 0.00 cd | <0.01 d | 0.01 ± 0.00 cd | 0.02 ± 0.01 bc | 0.01 ± 0.00 cd | <0.01 d | 0.01 ± 0.00 b | 0.03 ± 0.00 a | <0.01 d | 0.03 ± 0.01 ab | 0.01 ± 0.01 cd | 0.02 ± 0.00 a |
| [#107] Isoamyl decanoate | 0.01 ± 0.01 a | <0.01 c | <0.01 c | <0.01 c | 0.01 ± 0.00 ab | <0.01 c | <0.01 a | <0.01 bc | <0.01 c | <0.01 c | <0.01 c | <0.01 a |
| [#110] Ethyl 3-phenylpropionate | <0.01 b | 0.02 ± 0.01 a | <0.01 b | <0.01 b | <0.01 b | <0.01 b | <0.01 a | <0.01 b | <0.01 b | 0.01 ± 0.01 ab | <0.01 b | <0.01 a |
| [#111] Dodecyl butyrate | 0.10 ± 0.01 a | 0.01 ± 0.00 b | <0.01 b | <0.01 b | 0.01 ± 0.00 b | <0.01 b | 0.02 ± 0.01 a | <0.01 b | 0.02 ± 0.01 b | 0.01 ± 0.01 b | 0.01 ± 0.00 b | 0.01 ± 0.00 a |
| [#127] Ethyl 4-octenoate | 0.03 ± 0.01 a | 0.02 ± 0.01 a | <0.01 b | <0.01 b | 0.01 ± 0.00 ab | 0.02 ± 0.01 a | 0.01 ± 0.00 a | 0.01 ± 0.00 ab | <0.01 b | <0.01 b | <0.01 b | <0.01 b |
| Ester | 16.27 ± 0.17 a | 10.78 ± 0.67 bcd | 9.18 ± 0.77 cd | 8.94 ± 0.64 d | 15.70 ± 0.86 a | 13.70 ± 1.67 ab | 12.43 ± 0.74 a | 8.85 ± 0.70 d | 12.12 ± 0.37 bc | 10.22 ± 0.52 cd | 11.26 ± 0.72 bcd | 10.61 ± 0.40 a |
| [#17] 1-Methoxy-2-propanol | 0.10 ± 0.02 cde | 0.14 ± 0.01 bc | 0.11 ± 0.02 cde | 0.07 ± 0.03 cde | 0.12 ± 0.02 cd | 0.30 ± 0.03 a | 0.14 ± 0.02 a | 0.02 ± 0.01 e | 0.11 ± 0.02 cd | 0.03 ± 0.03 de | 0.23 ± 0.03 ab | 0.10 ± 0.03 a |
| [#56] 3-Ethoxy-1-propanol | <0.01 b | <0.01 b | <0.01 b | 0.03 ± 0.01 a | <0.01 b | <0.01 b | 0.01 ± 0.00 a | 0.04 ± 0.02 a | <0.01 b | 0.04 ± 0.00 a | 0.02 ± 0.01 ab | 0.02 ± 0.01 a |
| [#101] 2-(2-Butoxyethoxy)Ethanol | <0.01 a | <0.01 a | <0.01 a | <0.01 a | <0.01 a | <0.01 a | <0.01 a | <0.01 a | <0.01 a | <0.01 a | <0.01 a | <0.01 a |
| [#79] γ -Valerolactone | <0.01 a | <0.01 a | <0.01 a | <0.01 a | <0.01 a | <0.01 a | <0.01 a | <0.01 a | <0.01 a | <0.01 a | <0.01 a | <0.01 a |
| [#88] γ-Caprolactone | <0.01 bc | 0.02 ± 0.01 a | 0.01 ± 0.00 abc | <0.01 c | <0.01 c | <0.01 c | 0.01 ± 0.01 a | <0.01 c | 0.02 ± 0.01 ab | <0.01 c | 0.01 ± 0.00 abc | 0.01 ± 0.01 a |
| [#100] δ-Caprolactone | 0.02 ± 0.01 de | 0.10 ± 0.01 b | 0.13 ± 0.01 a | 0.03 ± 0.01 cd | 0.02 ± 0.00 de | 0.10 ± 0.01 b | 0.07 ± 0.05 a | 0.06 ± 0.01 c | 0.03 ± 0.00 d | <0.01 e | 0.11 ± 0.01 ab | 0.05 ± 0.04 a |
| [#119] δ-Octalactone | 0.01 ± 0.00 c | 0.01 ± 0.00 c | 0.03 ± 0.01 ab | 0.02 ± 0.00 b | 0.01 ± 0.00 c | 0.01 ± 0.00 c | 0.01 ± 0.01 a | 0.01 ± 0.00 c | 0.03 ± 0.00 a | 0.01 ± 0.00 c | 0.02 ± 0.00 b | 0.02 ± 0.01 a |
| [#122] 3,4,5-Trime thyldihydrofuran-2-one | 0.02 ± 0.01 bc | 0.02 ± 0.01 cd | 0.02 ± 0.00 bcd | 0.01 ± 0.00 cd | 0.01 ± 0.00 cd | 0.03 ± 0.01 ab | 0.02 ± 0.01 a | 0.01 ± 0.01 d | 0.04 ± 0.00 a | 0.01 ± 0.00 cd | 0.02 ± 0.00 bcd | 0.02 ± 0.01 a |
| [#123] γ-Decalactone | <0.01 b | <0.01 b | <0.01 b | <0.01 b | 0.01 ± 0.00 a | <0.01 b | <0.01 a | <0.01 b | 0.01 ± 0.01 a | <0.01 b | 0.01 ± 0.00 a | <0.01 a |
| [#132] δ-Decalactone | 0.04 ± 0.01 cde | 0.04 ± 0.01 bcde | 0.07 ± 0.01 a | 0.05 ± 0.00 abcd | 0.02 ± 0.01 e | 0.03 ± 0.01 de | 0.04 ± 0.01 a | 0.03 ± 0.01 e | 0.06 ± 0.01 abc | 0.04 ± 0.00 bcde | 0.06 ± 0.01 ab | 0.05 ± 0.02 a |
| [#133] 3,4,5-Trimethyldihydrofuran-2-one | <0.01 ab | <0.01 b | <0.01 b | <0.01 b | <0.01 b | <0.01 b | <0.01 a | <0.01 b | 0.01 ± 0.00 a | <0.01 b | <0.01 b | <0.01 a |
| [#137] γ-Dodecalactone | 0.07 ± 0.01 c | 0.03 ± 0.00 ef | 0.03 ± 0.00 ef | 0.03 ± 0.01 f | 0.63 ± 0.02 a | 0.32 ± 0.01 b | 0.19 ± 0.23 a | 0.06 ± 0.01 cdef | 0.03 ± 0.01 def | 0.06 ± 0.00 cde | 0.06 ± 0.01 cd | 0.05 ± 0.01 a |
| [#138] δ-Dodecalactone | 0.01 ± 0.01 ab | 0.02 ± 0.01 ab | 0.02 ± 0.01 ab | <0.01 b | 0.01 ± 0.01 ab | 0.02 ± 0.00 ab | 0.01 ± 0.01 a | 0.01 ± 0.00 ab | 0.01 ± 0.00 ab | 0.01 ± 0.00 ab | 0.03 ± 0.00 a | 0.02 ± 0.01 a |
| Furans | 0.18 ± 0.02 de | 0.23 ± 0.04 d | 0.30 ± 0.01 c | 0.14 ± 0.00 e | 0.72 ± 0.02 a | 0.53 ± 0.01 b | 0.35 ± 0.05 a | 0.17 ± 0.02 e | 0.23 ± 0.02 d | 0.13 ± 0.00 e | 0.32 ± 0.01 c | 0.21 ± 0.02 b |
| [#2 *] 2-Butanone | 12.89 ± 0.97 bc | 7.83 ± 0.27 d | 10.89 ± 0.27 c | 11.12 ± 0.93 c | 15.35 ± 0.26 b | 11.72 ± 0.82 c | 11.63 ± 2.39 b | 12.85 ± 0.19 c | 18.15 ± 0.93 a | 12.73 ± 0.67 c | 10.91 ± 0.44 c | 13.66 ± 2.87 a |
| [#4] Diacetyl | 0.08 ± 0.04 ab | 0.10 ± 0.02 ab | 0.11 ± 0.01 ab | 0.17 ± 0.05 a | <0.01 b | 0.10 ± 0.01 ab | 0.09 ± 0.06 b | 0.17 ± 0.02 a | 0.17 ± 0.01 a | 0.11 ± 0.00 ab | 0.20 ± 0.08 a | 0.16 ± 0.05 a |
| [#19] Acetyl valeryl | 0.04 ± 0.00 a | <0.01 a | <0.01 a | <0.01 a | <0.01 a | <0.01 a | 0.01 ± 0.02 a | <0.01 a | <0.01 a | <0.01 a | <0.01 a | <0.01 a |
| [#22] Butyl acetone | 0.82 ± 0.08 ab | 0.33 ± 0.02 bc | 0.33 ± 0.01 bc | 0.24 ± 0.06 bc | 0.15 ± 0.02 c | 0.33 ± 0.11 bc | 0.37 ± 0.22 b | 0.54 ± 0.09 bc | 1.42 ± 0.47 a | 0.34 ± 0.10 bc | 0.36 ± 0.03 bc | 0.66 ± 0.51 a |
| [#37 *] Acetoin | 1.51 ± 0.05 d | 1.33 ± 0.10 d | 3.24 ± 0.21 a | 2.71 ± 0.28 ab | 1.74 ± 0.33 cd | 2.24 ± 0.09 bc | 2.13 ± 0.72 b | 2.78 ± 0.15 ab | 3.20 ± 0.21 a | 2.26 ± 0.11 bc | 2.24 ± 0.17 bc | 2.62 ± 0.44 a |
| [#40] Acetol | 0.01 ± 0.01 b | 0.01 ± 0.01 b | 0.04 ± 0.02 a | 0.02 ± 0.01 ab | 0.01 ± 0.00 b | 0.02 ± 0.00 ab | 0.02 ± 0.01 a | 0.03 ± 0.01 ab | 0.01 ± 0.00 b | 0.01 ± 0.01 ab | 0.02 ± 0.01 ab | 0.02 ± 0.01 a |
| [#46] Methylheptenone | 0.02 ± 0.01 ab | 0.01 ± 0.01 ab | 0.02 ± 0.01 ab | 0.03 ± 0.00 a | <0.01 b | <0.01 b | 0.01 ± 0.01 a | 0.01 ± 0.00 ab | 0.02 ± 0.01 ab | <0.01 b | 0.03 ± 0.01 a | 0.02 ± 0.01 a |
| [#47] 3-Hydroxy-2-pentanone | 0.16 ± 0.03 c | 0.24 ± 0.06 bc | 0.47 ± 0.09 a | 0.26 ± 0.02 bc | 0.20 ± 0.04 c | 0.21 ± 0.01 c | 0.26 ± 0.11 a | 0.31 ± 0.03 bc | 0.38 ± 0.03 ab | 0.25 ± 0.02 bc | 0.26 ± 0.02 bc | 0.30 ± 0.06 a |
| [#51] 2-Hydroxy-3-pentanone | 0.15 ± 0.02 c | 0.23 ± 0.06 abc | 0.34 ± 0.03 a | 0.32 ± 0.05 ab | 0.20 ± 0.03 bc | 0.22 ± 0.01 abc | 0.24 ± 0.07 a | 0.30 ± 0.03 ab | 0.22 ± 0.03 abc | 0.25 ± 0.03 abc | 0.23 ± 0.02 abc | 0.25 ± 0.04 a |
| [#57 *] 2-Nonanone | 1.53 ± 0.53 a | 0.25 ± 0.02 b | 0.22 ± 0.08 b | 0.15 ± 0.09 b | 0.13 ± 0.06 b | 0.27 ± 0.22 b | 0.42 ± 0.55 a | 0.42 ± 0.21 ab | 1.52 ± 0.68 a | 0.42 ± 0.29 ab | 0.16 ± 0.06 b | 0.63 ± 0.64 a |
| [#63] 5-Nonen-2-one | <0.01 b | 0.01 ± 0.01 a | <0.01 b | <0.01 b | <0.01 b | <0.01 b | <0.01 a | <0.01 b | <0.01 b | <0.01 b | <0.01 b | <0.01 a |
| [#67] 2-Decanone | 0.01 ± 0.00 a | <0.01 b | <0.01 b | <0.01 b | <0.01 b | <0.01 b | <0.01 a | <0.01 b | 0.01 ± 0.01 a | <0.01 b | <0.01 b | <0.01 a |
| [#78] 2-Undecanone | 0.16 ± 0.06 a | 0.01 ± 0.01 b | 0.01 ± 0.00 b | 0.01 ± 0.01 b | 0.01 ± 0.00 b | 0.02 ± 0.02 b | 0.04 ± 0.06 a | 0.01 ± 0.01 b | 0.06 ± 0.02 b | 0.02 ± 0.01 b | 0.01 ± 0.00 b | 0.02 ± 0.02 a |
| [#83] Acetophenone | 0.01 ± 0.01 b | 0.03 ± 0.01 a | 0.02 ± 0.01 ab | 0.01 ± 0.00 ab | <0.01 b | 0.01 ± 0.01 ab | 0.01 ± 0.01 a | <0.01 b | 0.01 ± 0.00 ab | <0.01 b | 0.02 ± 0.00 ab | 0.01 ± 0.01 a |
| [#106] Nerylacetone | 0.01 ± 0.00 a | 0.01 ± 0.01 b | <0.011 b | 0.01 ± 0.01 b | <0.01 b | <0.01 b | 0.01 ± 0.01 a | <0.01 b | <0.01 b | <0.01 b | <0.01 b | <0.01 b |
| Ketone | 17.39 ± 0.62 bc | 10.39 ± 0.25 f | 15.69 ± 0.02 cde | 15.04 ± 0.66 de | 17.78 ± 0.11 b | 15.15 ± 0.46 de | 15.24 ± 0.59 b | 17.42 ± 0.25 b | 25.17 ± 0.83 a | 16.39 ± 0.22 bcd | 14.44 ± 0.32 e | 18.35 ± 1.24 a |
| [#7] α-Pinene | 0.02 ± 0.01 b | <0.01 c | 0.03 ± 0.01 a | <0.01 c | <0.01 c | <0.01 c | 0.01 ± 0.01 a | <0.01 c | <0.01 c | <0.01 c | <0.01 c | <0.01 b |
| [#23] D-Limonene | 0.35 ± 0.06 a | 0.19 ± 0.03 a | 0.29 ± 0.12 a | 0.19 ± 0.09 a | 0.14 ± 0.03 a | 0.16 ± 0.09 a | 0.22 ± 0.10 a | 0.14 ± 0.09 a | 0.21 ± 0.03 a | 0.07 ± 0.04 a | 0.20 ± 0.14 a | 0.16 ± 0.09 a |
| [#24] Eucalyptol | 0.02 ± 0.02 a | 0.02 ± 0.01 a | 0.04 ± 0.01 a | 0.01 ± 0.01 a | <0.01 a | 0.03 ± 0.02 a | 0.02 ± 0.02 a | 0.01 ± 0.01 a | 0.01 ± 0.01 a | 0.01 ± 0.01 a | 0.01 ± 0.01 a | 0.01 ± 0.01 b |
| Terpene | 0.38 ± 0.08 a | 0.22 ± 0.02 a | 0.35 ± 0.13 a | 0.20 ± 0.08 a | 0.14 ± 0.03 a | 0.19 ± 0.10 a | 0.25 ± 0.03 a | 0.15 ± 0.10 a | 0.22 ± 0.03 a | 0.08 ± 0.05 a | 0.21 ± 0.14 a | 0.16 ± 0.03 b |
| [#55] Dimethyltrisulfide | <0.01 b | 0.04 ± 0.02 a | 0.02 ± 0.01 ab | <0.01 b | <0.01 b | <0.01 b | 0.01 ± 0.02 a | <0.01 b | <0.01 b | <0.01 b | <0.01 b | <0.01 a |
| [#71] Dihydro-2-methyl-3(2H)-thiophenone | <0.01 c | <0.01 c | <0.01 c | 0.02 ± 0.01 b | <0.01 c | <0.01 c | <0.01 a | <0.01 c | <0.01 c | 0.03 ± 0.01 a | <0.01 c | 0.01 ± 0.01 a |
| [#112] Dymethyl sulfone | 0.06 ± 0.01 abc | 0.04 ± 0.00 cd | 0.06 ± 0.01 abc | 0.05 ± 0.01 bc | 0.05 ± 0.01 bc | 0.05 ± 0.01 bc | 0.05 ± 0.01 a | 0.07 ± 0.01 ab | 0.02 ± 0.00 d | 0.08 ± 0.01 a | 0.04 ± 0.00 cd | 0.05 ± 0.02 a |
| [#117] Phenylacetonitrile | 0.01 ± 0.00 ab | <0.01 b | <0.01 b | <0.01 b | <0.01 b | <0.01 b | <0.01 b | 0.02 ± 0.01 a | <0.01 b | 0.02 ± 0.01 ab | <0.01 b | 0.01 ± 0.01 a |
| Minor | 0.07 ± 0.01 bcd | 0.08 ± 0.02 bc | 0.08 ± 0.01 bc | 0.06 ± 0.01 bcd | 0.05 ± 0.01 cde | 0.05 ± 0.01 cde | 0.07 ± 0.00 a | 0.09 ± 0.00 ab | 0.02 ± 0.00 e | 0.12 ± 0.02 a | 0.04 ± 0.00 de | 0.07 ± 0.01 a |
Disclaimer/Publisher’s Note: The statements, opinions and data contained in all publications are solely those of the individual author(s) and contributor(s) and not of MDPI and/or the editor(s). MDPI and/or the editor(s) disclaim responsibility for any injury to people or property resulting from any ideas, methods, instructions or products referred to in the content. |
© 2025 by the authors. Licensee MDPI, Basel, Switzerland. This article is an open access article distributed under the terms and conditions of the Creative Commons Attribution (CC BY) license (https://creativecommons.org/licenses/by/4.0/).
Share and Cite
Macedo, A.; Carvalho, M.J.; Mecha, E.; Costa, L.; Ferreira, A.; Inácio, R.S.; Bronze, M.d.R. Matching the Sensory Analysis of Serpa PDO Cheese with the Volatile Profiles—A Preliminary Study. Foods 2025, 14, 1509. https://doi.org/10.3390/foods14091509
Macedo A, Carvalho MJ, Mecha E, Costa L, Ferreira A, Inácio RS, Bronze MdR. Matching the Sensory Analysis of Serpa PDO Cheese with the Volatile Profiles—A Preliminary Study. Foods. 2025; 14(9):1509. https://doi.org/10.3390/foods14091509
Chicago/Turabian StyleMacedo, Antónia, Maria João Carvalho, Elsa Mecha, Leonor Costa, António Ferreira, Rita S. Inácio, and Maria do Rosário Bronze. 2025. "Matching the Sensory Analysis of Serpa PDO Cheese with the Volatile Profiles—A Preliminary Study" Foods 14, no. 9: 1509. https://doi.org/10.3390/foods14091509
APA StyleMacedo, A., Carvalho, M. J., Mecha, E., Costa, L., Ferreira, A., Inácio, R. S., & Bronze, M. d. R. (2025). Matching the Sensory Analysis of Serpa PDO Cheese with the Volatile Profiles—A Preliminary Study. Foods, 14(9), 1509. https://doi.org/10.3390/foods14091509