
The Behavior of Listeria monocytogenes During the Shelf Life of Wiener Sausages, as an Effect of Fermented Parsley Root Juice and Hawthorn Berry Phenolics

 , ,
, ,  , and
, and
Abstract
1. Introduction
2. Materials and Methods
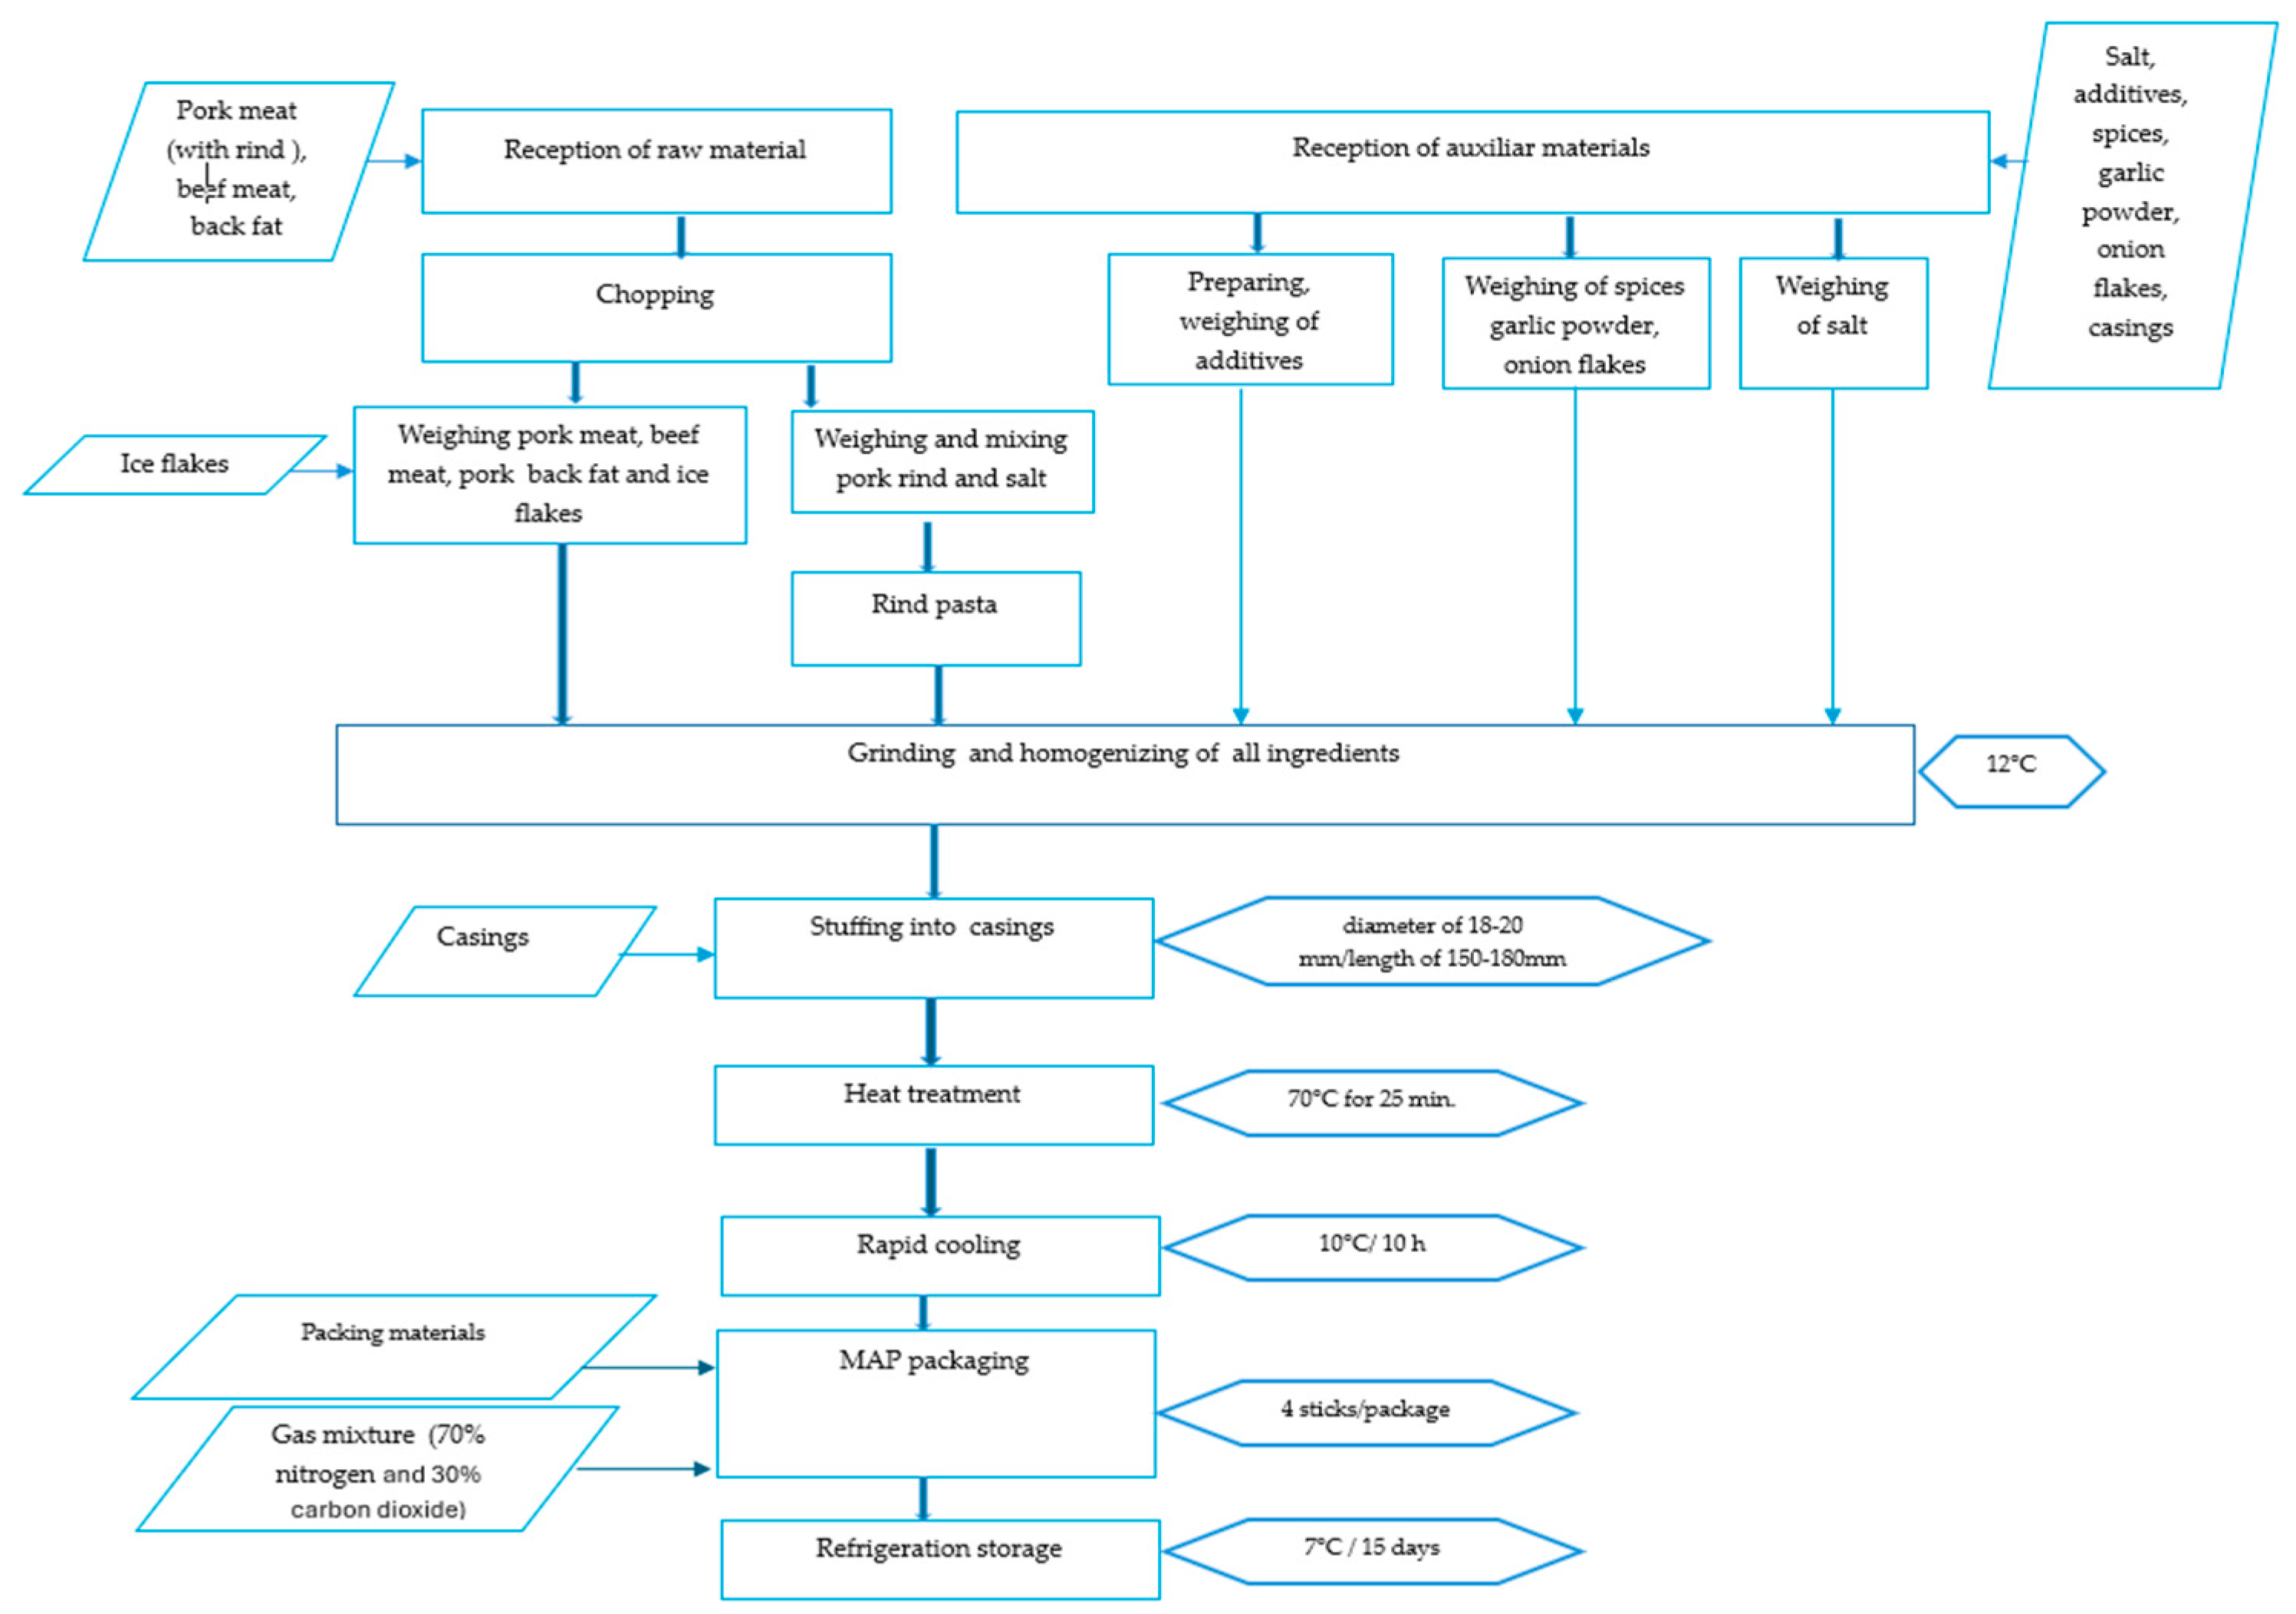
2.1. Wiener Sausage Manufacture and Sampling
2.2. Obtaining Fermented Parsley Juice (PFJ)
2.3. Obtaining Hawthorn Berry Phenolics (HBE)
2.4. Preparation of L. monocytogenes Inoculum
2.5. The Artificial Inoculation of Samples
2.6. Detection of L. monocytogenes
2.7. Enumeration of L. monocytogenes
2.8. Determination of Physicochemical Parameters
2.9. Enumeration of Aerobic Mesophilic Microflora (TVC)
2.10. Determination of Growth Potential (Δ)
2.11. Statistical Analysis
3. Results
3.1. Control Sample Results
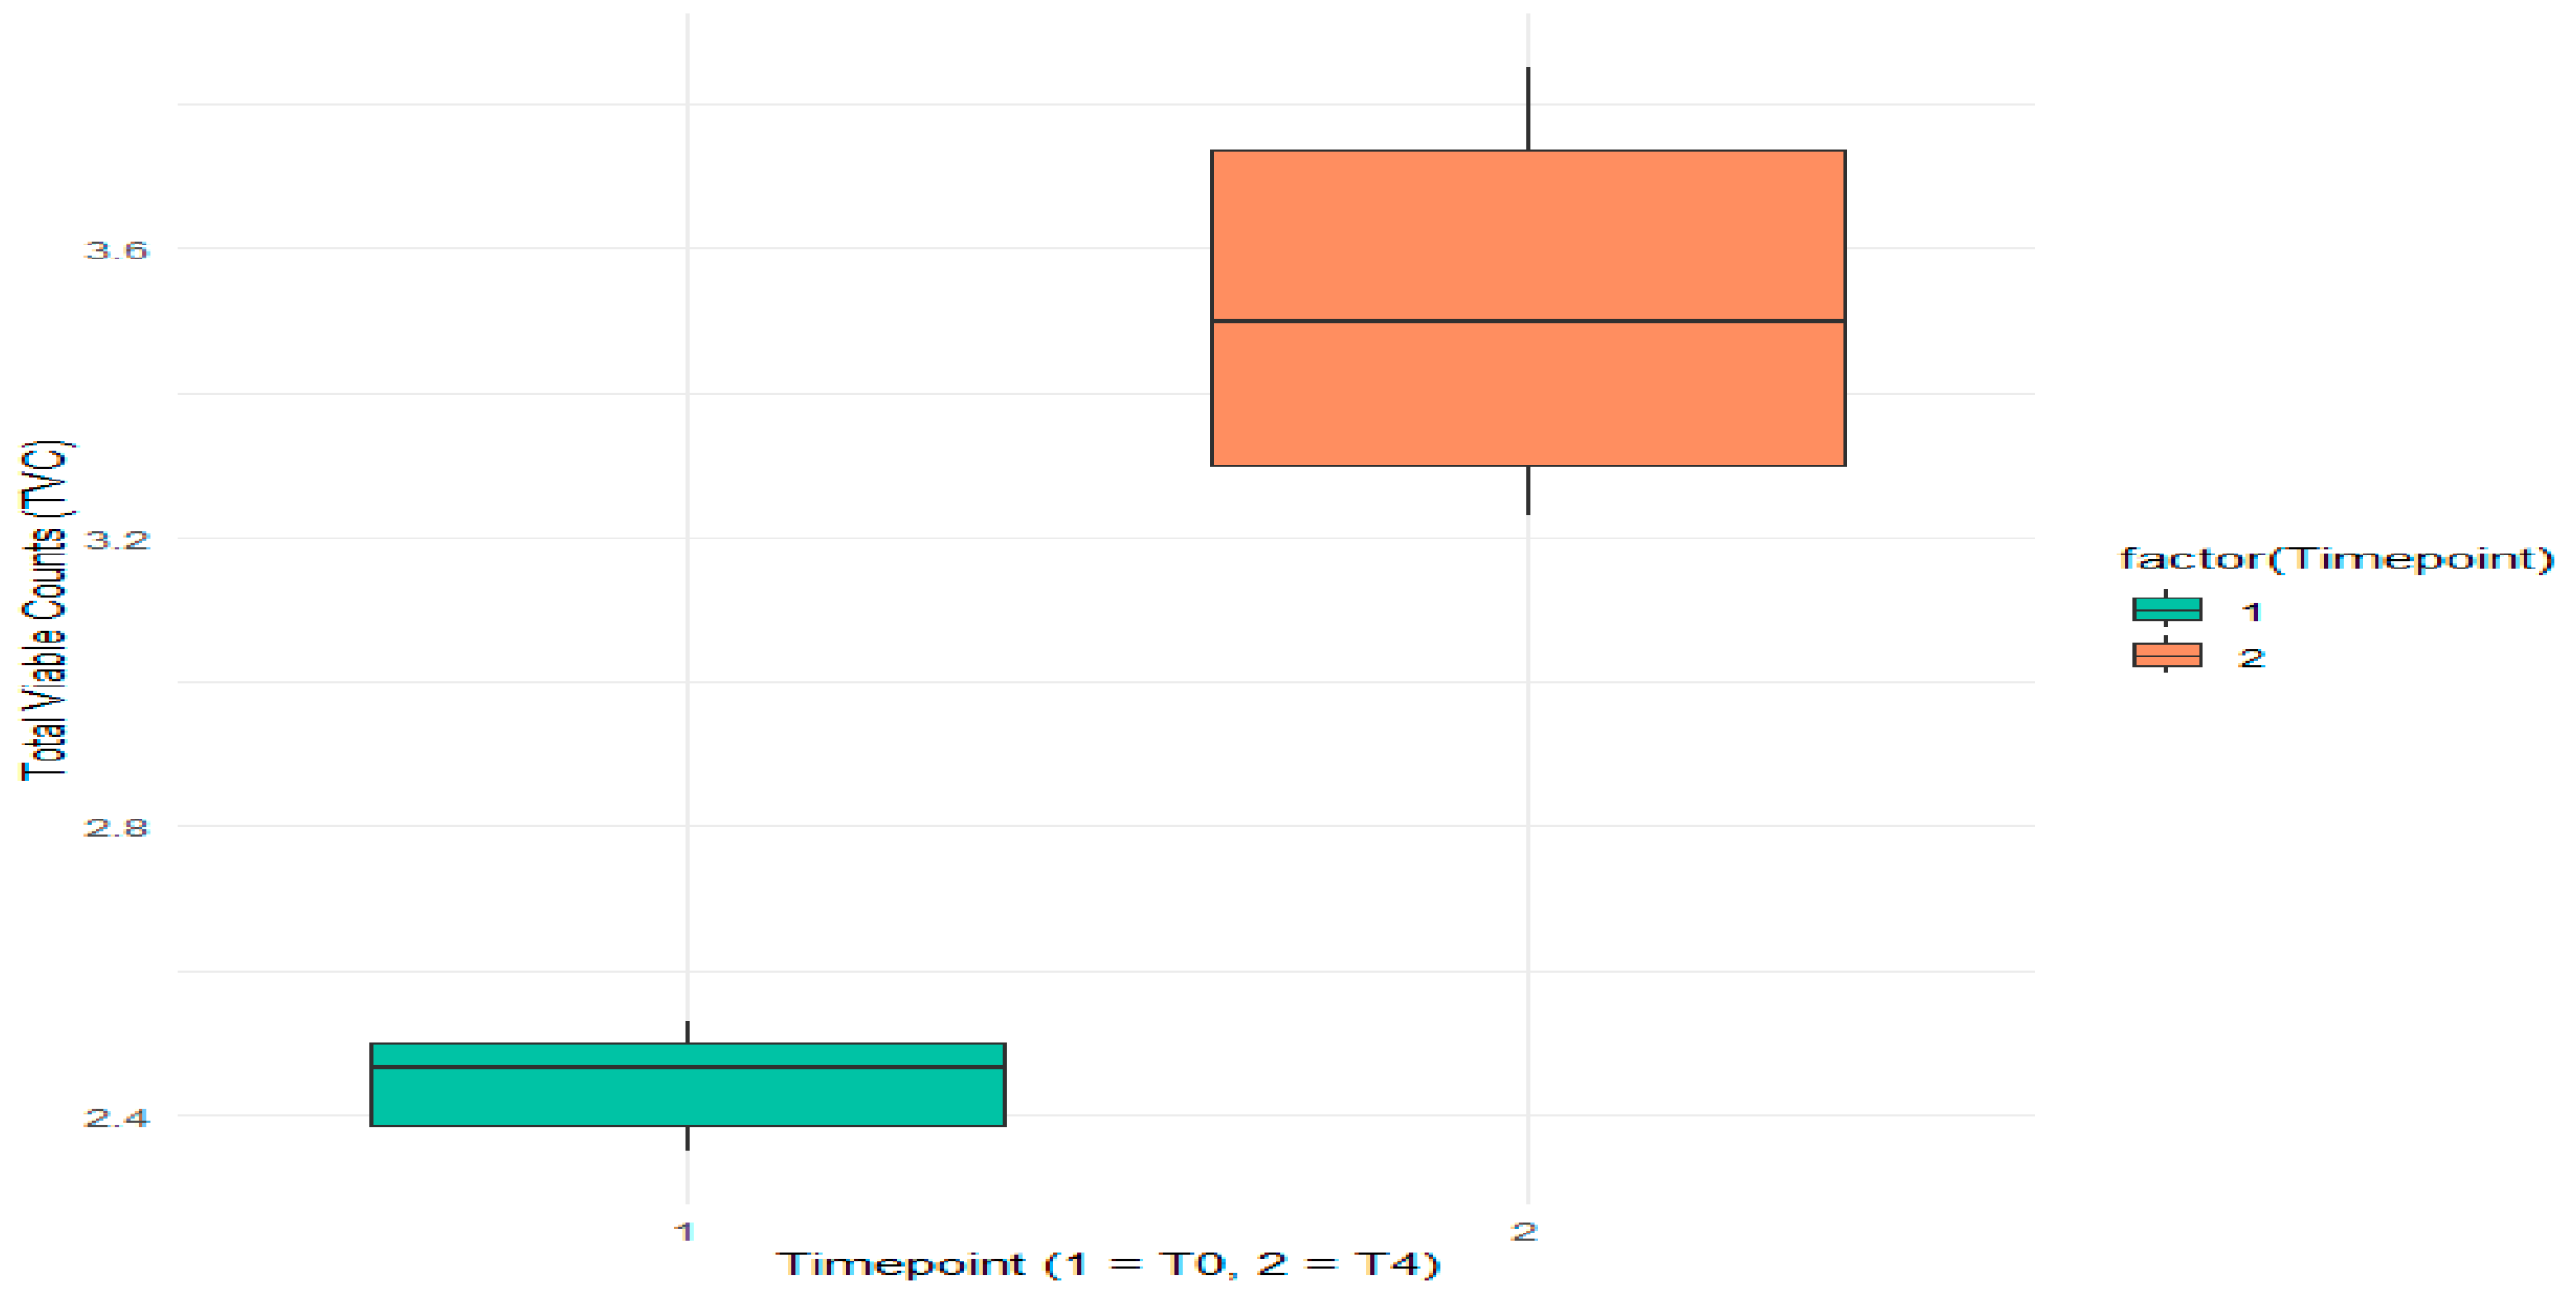
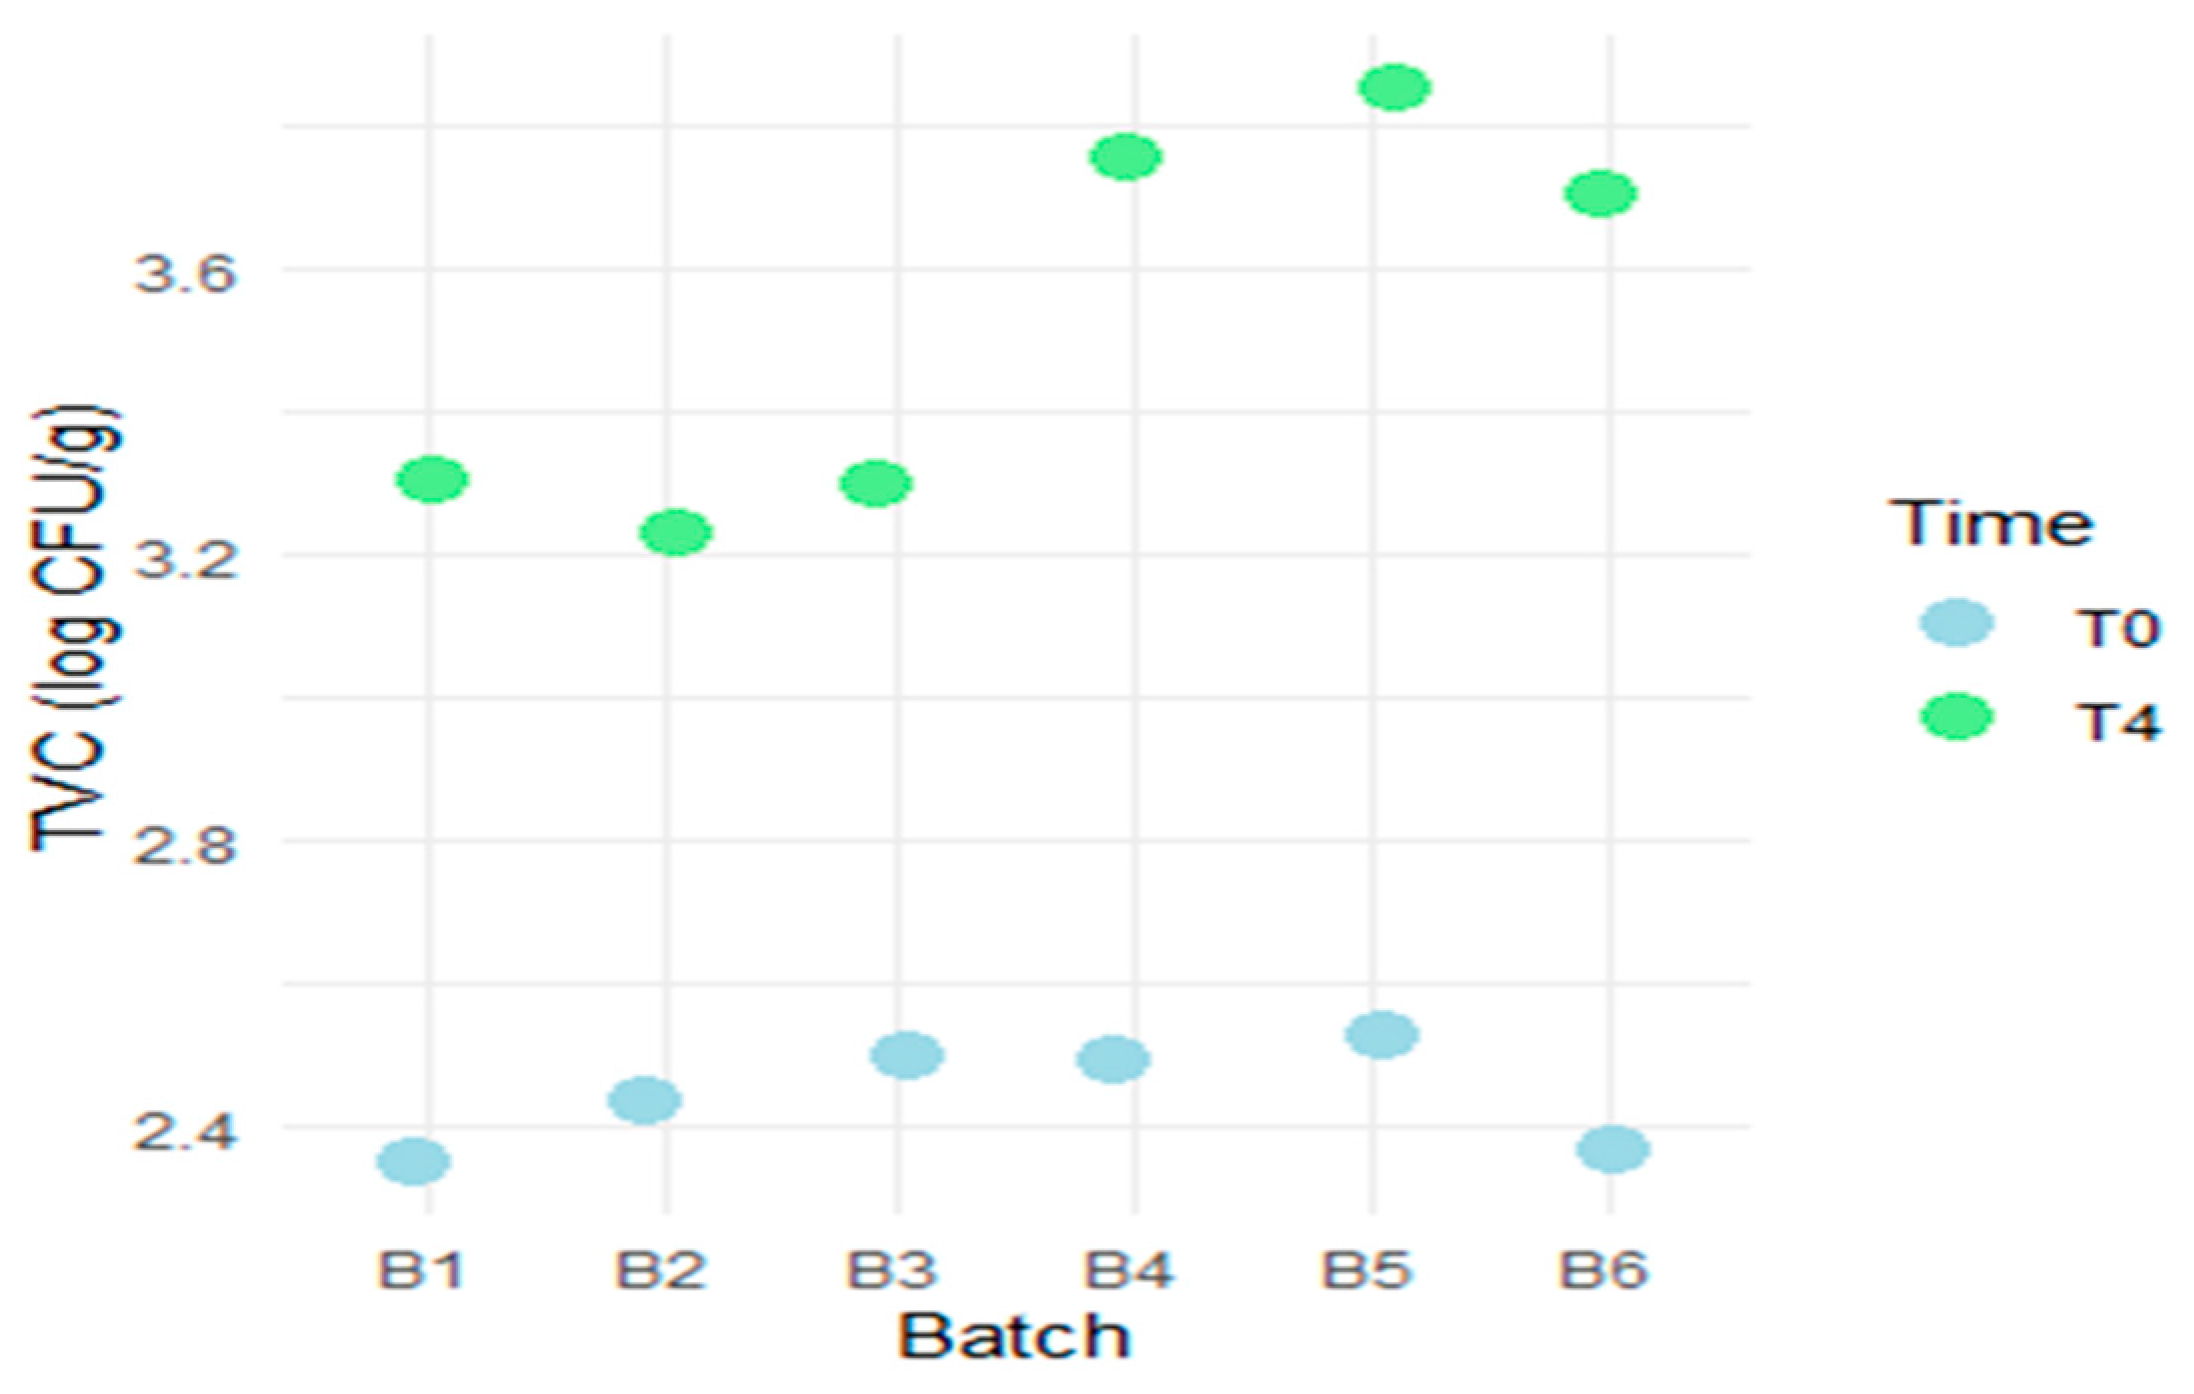
3.1.1. Evaluation of Aerobic Mesophilic Microflora Counts
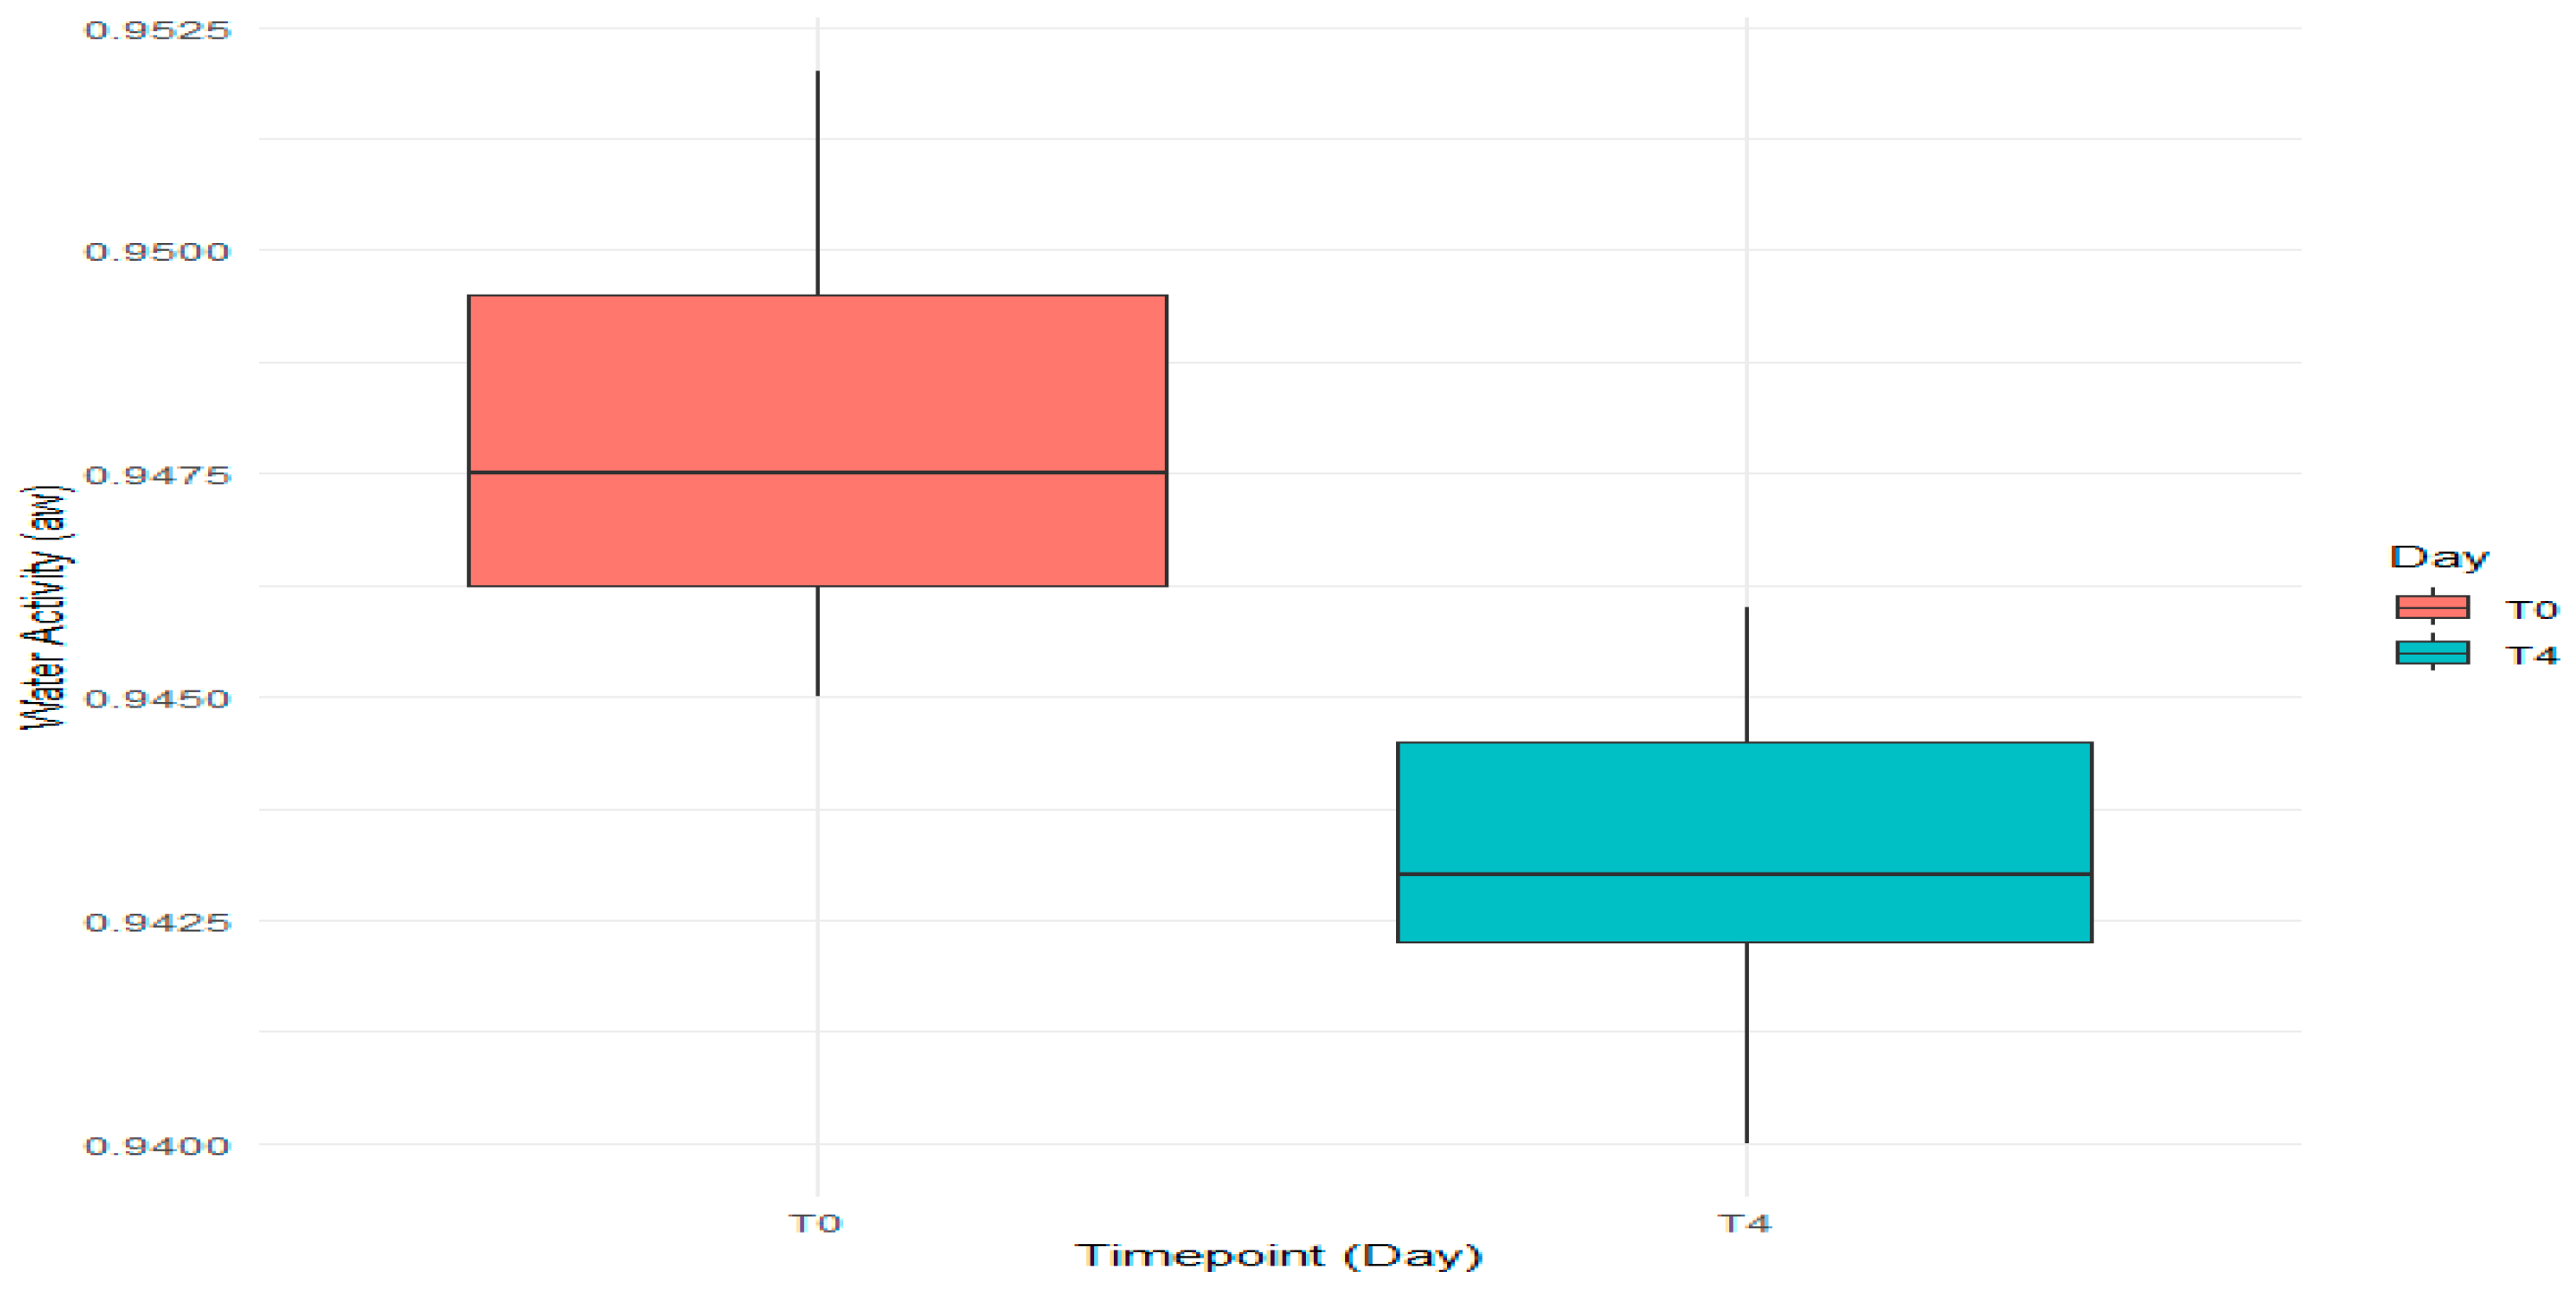
3.1.2. Evaluation of pH and aw
3.2. Evaluation of L. monocytogenes Counts on Blank Samples of Wiener Sausages
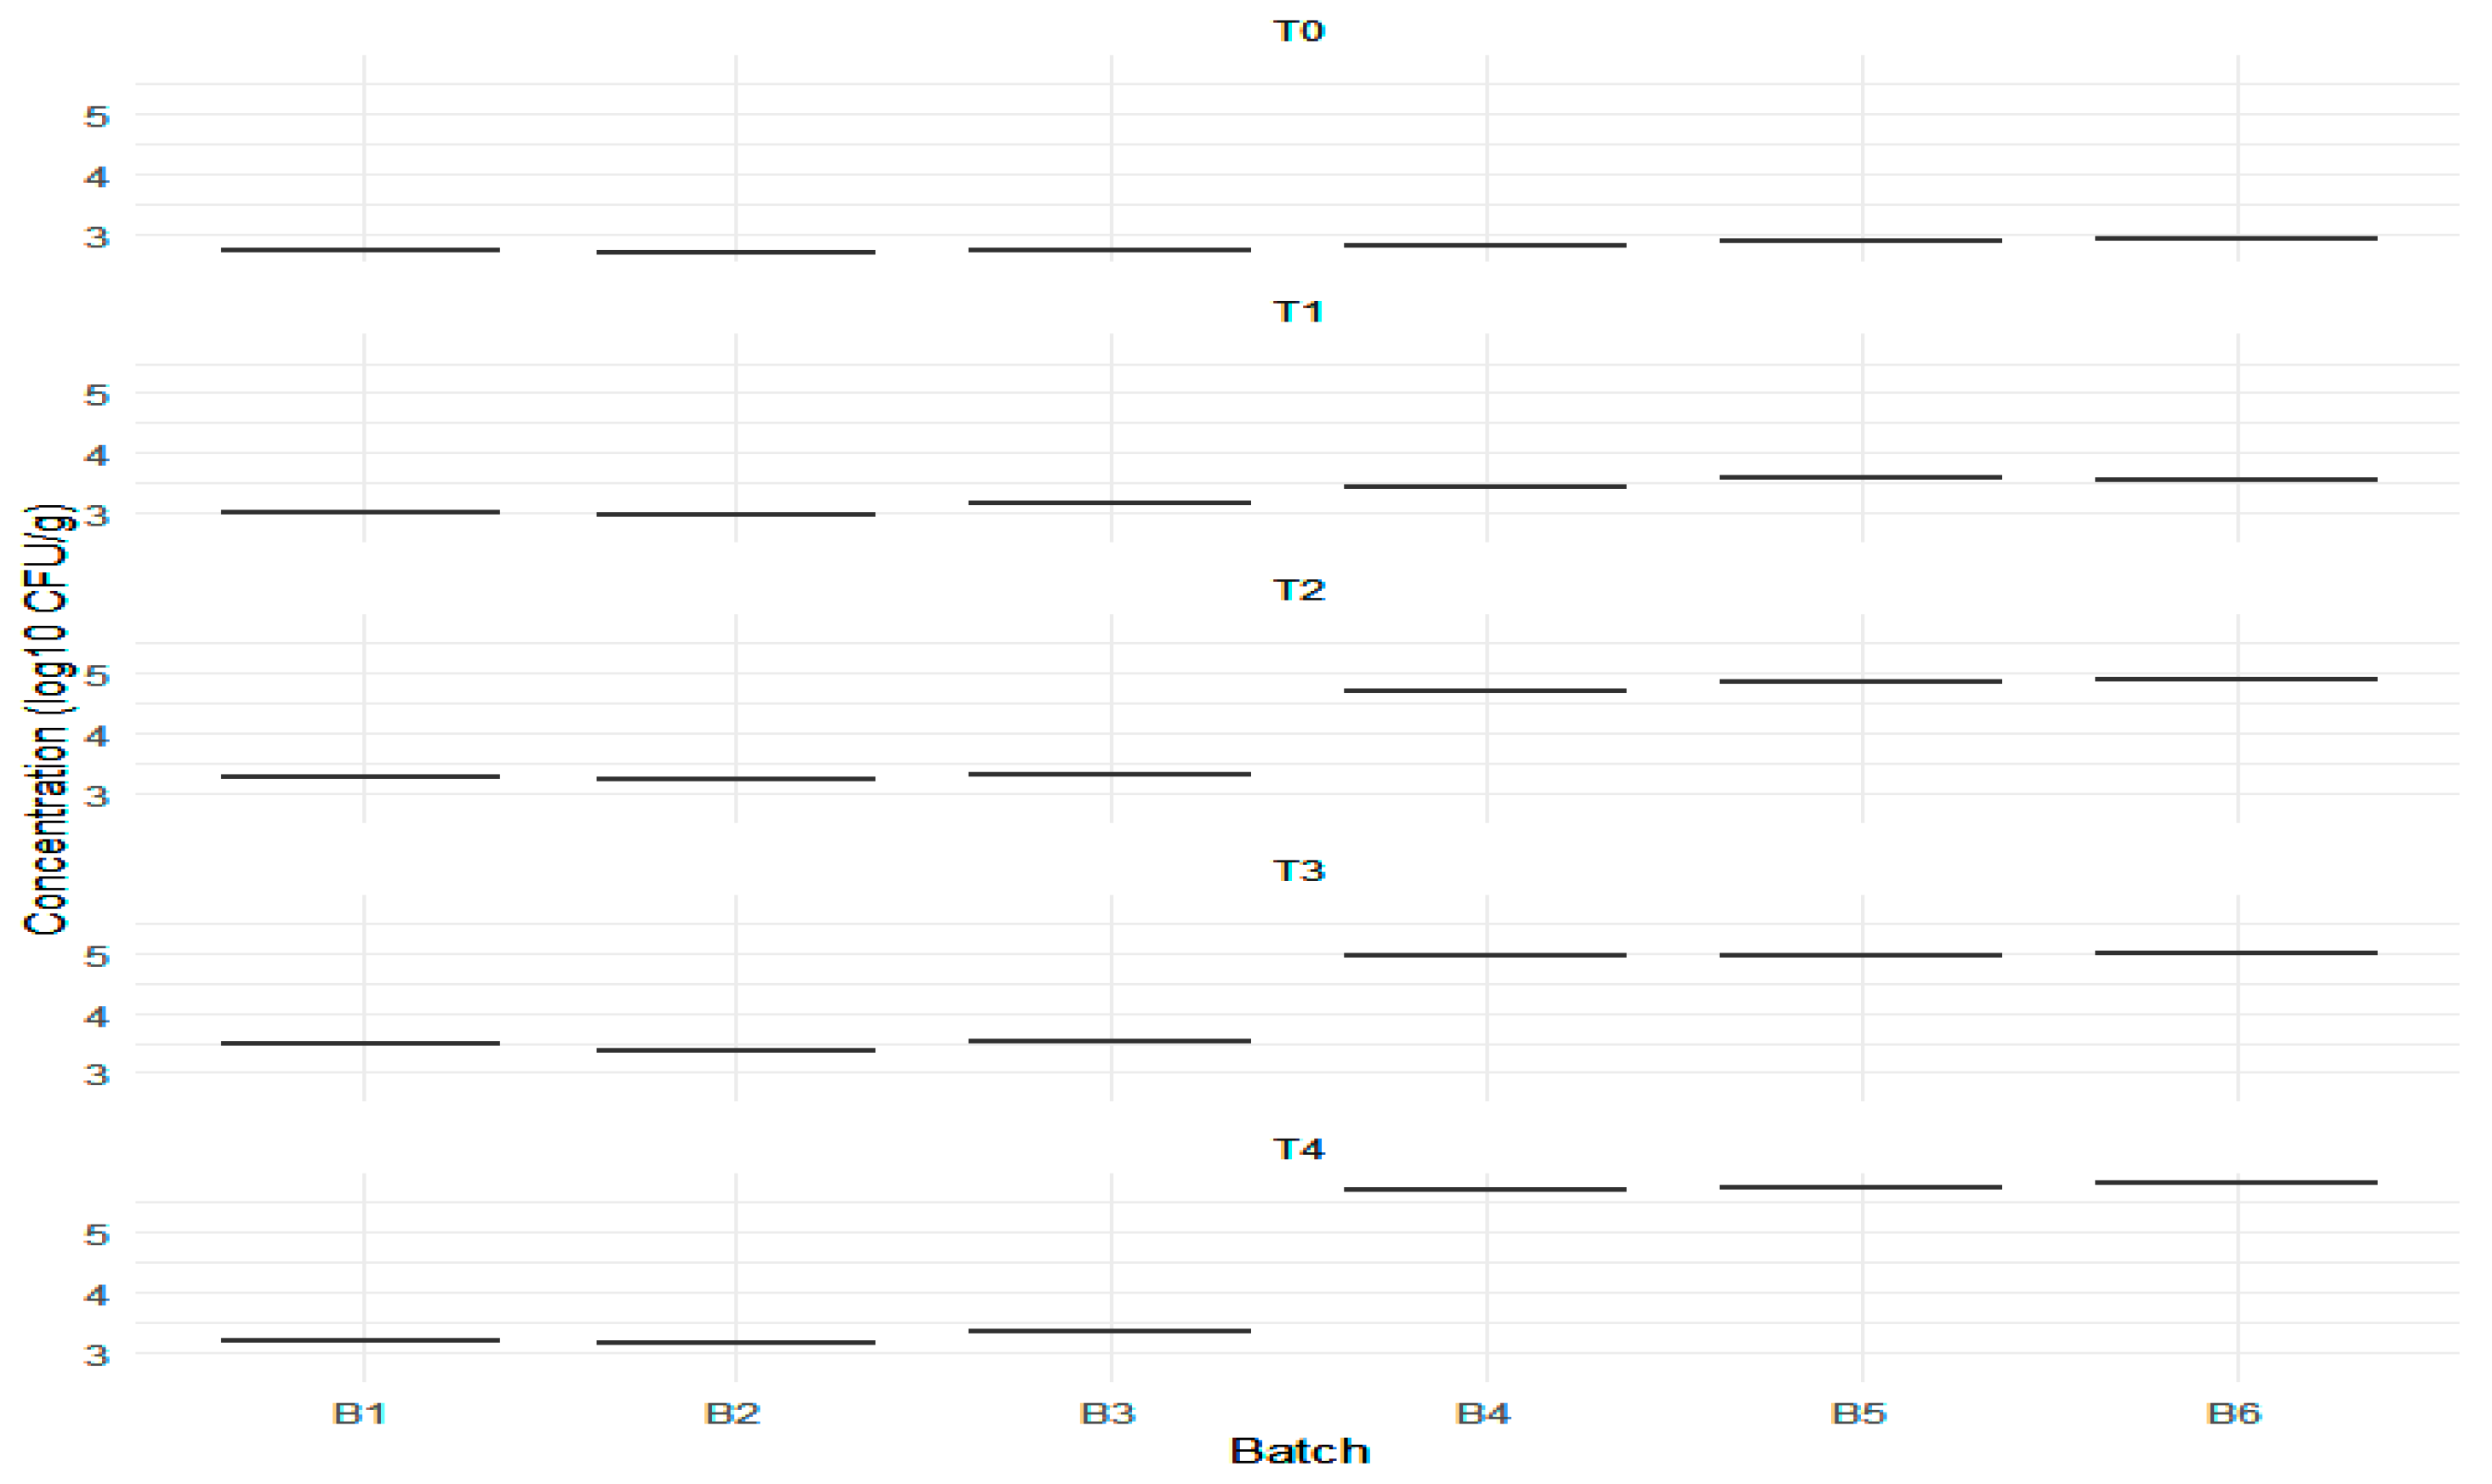
3.3. Results of the Behavior of L. monocytogenes in Artificially Inoculated Samples
4. Discussion
5. Conclusions
Author Contributions
Funding
Institutional Review Board Statement
Informed Consent Statement
Data Availability Statement
Conflicts of Interest
References
- Farber, J.M.; Peterkin, P.I. Listeria monocytogenes, a Food-Borne Pathogen. Microbiol. Rev. 1991, 55, 476–511. [Google Scholar] [CrossRef]
- McLauchlin, J.; Mitchell, R.T.; Smerdon, W.J.; Jewell, K. Listeria monocytogenes and Listeriosis: A Review of Hazard Characterisation for Use in Microbiological Risk Assessment of Foods. Int. J. Food Microbiol. 2004, 92, 15–33. [Google Scholar] [CrossRef] [PubMed]
- Vázquez-Boland, J.A.; Kuhn, M.; Berche, P.; Chakraborty, T.; Domínguez-Bernal, G.; Goebel, W.; González-Zorn, B.; Wehland, J.; Kreft, J. Listeria Pathogenesis and Molecular Virulence Determinants. Clin. Microbiol. Rev. 2001, 14, 584–640. [Google Scholar] [CrossRef] [PubMed]
- Di Pinto, A.; Novello, L.; Montemurro, F.; Bonerba, E.; Tantillo, G. Occurrence of Listeria monocytogenes in Ready-to-eat Foods from Supermarkets in Southern Italy. New Microbiol. 2010, 33, 249–252. [Google Scholar] [PubMed]
- Lungu, B.; Ricke, S.C.; Johnson, M.G. Growth, Survival, Proliferation and Pathogenesis of Listeria monocytogenes Under Low Oxygen or Anaerobic Conditions: A Review. Anaerobe 2009, 15, 7–17. [Google Scholar] [CrossRef]
- Stefan, G.; Predescu, C.N.; Baraitareanu, S. Evaluation of Growth Potential of Listeria monocytogenes in Meat Products Ready To Eat. Rev. Rom. Med. Vet. 2024, 34, 129–132. [Google Scholar]
- FAO/WHO. Codex Alimentarius Report of the Thirty-Fourth Session of the Codex Committee on Food Hygiene (ALINORM 03/13). Rome, Italy. 2002. Available online: https://www.fao.org/input/download/report/116/al03_13e.pdf (accessed on 15 November 2022).
- European Commission. Commission Regulation (EC) No 2073/2005 of 15 November 2005 on Microbiological Criteria for Foodstuffs. Off. J. 2005, 338, 1–26. Available online: https://eur-lex.europa.eu/legal-content/EN/TXT/?uri=CELEX%3A32005R2073&qid=1745590037765 (accessed on 15 November 2022).
- Silva, R.F.M.; Pogačnik, L. Polyphenols from Food and Natural Products: Neuroprotection and Safety. Antioxidants 2020, 9, 61. [Google Scholar] [CrossRef]
- Quinto, E.J.; Caro, I.; Villalobos-Delgado, L.H.; Mateo, J.; De-Mateo-Silleras, B.; Redondo-Del-Río, M.P. Food Safety through Natural Antimicrobials. Antibiotics 2019, 8, 208. [Google Scholar] [CrossRef]
- Horita, C.N.; Messias, V.C.; Morgano, M.A.; Hayakawa, F.M.; Pollonio, M.A.R. Textural, Microstructural and Sensory Properties of Reduced Sodium Frankfurter Sausages Containing Mechanically Deboned Poultry Meat and Blends of Chloride Salts. Food Res. Int. 2014, 66, 29–35. [Google Scholar] [CrossRef]
- Lorenzo, J.M.; Sineiro, J.; Amado, I.R.; Franco, D. Influence of natural extracts on the shelf life of modified atmosphere-packaged pork patties. Meat Sci. 2014, 96, 526–534. [Google Scholar] [CrossRef] [PubMed]
- Papuc, C.; Goran, G.V.; Predescu, C.N.; Nicorescu, V.; Stefan, G. Plant Polyphenols as Antioxidant and Antibacterial Agents for Shelf-Life Extension of Meat and Meat Products: Classification, Structures, Sources, and Action Mechanisms. Compr. Rev. Food Sci. Food Saf. 2017, 16, 1243–1268. [Google Scholar] [CrossRef]
- Ahmad, S.R.; Gokulakrishnan, P.; Giriprasad, R.; Yatoo, M.A. Fruit-based Natural Antioxidants in Meat and Meat Products: A Review. Crit. Rev. Food Sci. Nutr. 2015, 55, 1503–1513. [Google Scholar] [CrossRef]
- Bae, J.Y.; Seo, Y.H.; Oh, S.W. Antibacterial Activities of Polyphenols Against Foodborne Pathogens and Their Application as Antibacterial Agents. Food Sci. Biotechnol. 2022, 31, 985–997. [Google Scholar] [CrossRef] [PubMed]
- Borges, A.; Saavedra, M.J.; Simões, M. The activity of ferulic and gallic acids in biofilm prevention and control of pathogenic bacteria. Biofouling 2012, 28, 755–767. [Google Scholar] [CrossRef]
- Borges, A.; Ferreira, C.; Saavedra, M.J.; Simões, M. Antibacterial Activity and Mode of Action of Ferulic and Gallic Acids Against Pathogenic Bacteria. Microb. Drug Resist. 2013, 19, 256–265. [Google Scholar] [CrossRef] [PubMed]
- Zaixiang, L.; Hongxin, W.; Shengqi, R.; Juntao, S.; Chaoyang, M.; Jing, L. p-Coumaric Acid Kills Bacteria through Dual Damage Mechanisms. Food Control 2012, 25, 550–554. [Google Scholar] [CrossRef]
- Kumar, D.; Arya, V.; Bhat, Z.A.; Khan, N.A.; Prasad, D.N. The genus Crataegus: Chemical and pharmacological perspectives. Braz. J. Pharmacogn. 2012, 22, 1187–1200. [Google Scholar] [CrossRef]
- Ghendov-Moșanu, A.; Cojocari, D.; Balan, G.; Sturza, R. Antimicrobial activity of rose hip and hawthorn powders on pathogenic bacteria. J. Eng. Sci. 2018, XXV, 100–107. [Google Scholar]
- Özderin, S. Chemical properties, antioxidant, and antimicrobial activities of fruit extracts of Crataegus monogyna var. odemisii. BioResources 2024, 19, 1542–1557. [Google Scholar] [CrossRef]
- Tadić, V.M.; Dobrić, S.; Marković, G.M.; Dordević, S.M.; Arsić, I.A.; Menković, N.R.; Stević, T. Anti-inflammatory, gastroprotective, free-radical-scavenging, and antimicrobial activities of hawthorn berries ethanol extract. J. Agric. Food Chem. 2008, 56, 7700–7709. [Google Scholar] [CrossRef]
- Papuc, C.; Predescu, C.N.; Tudoreanu, L.; Nicorescu, V.; Gâjâilă, I. Comparative Study of the Influence of Hawthorn (Crataegus monogyna) Berry Ethanolic Extract and Butylated Hydroxylanisole (BHA) on Lipid Peroxidation, Myoglobin Oxidation, Consistency and Firmness of Minced Pork During Refrigeration. J. Sci. Food Agric. 2018, 98, 1346–1361. [Google Scholar] [CrossRef]
- Munekata, P.E.S.; Rocchetti, G.; Pateiro, M.; Lucini, L.; Domínguez, R.; Lorenzo, J.M. Addition of Plant Extracts to Meat and Meat Products to Extend Shelf-Life and Health-Promoting Attributes: An Overview. Curr. Opin. Food Sci. 2020, 31, 81–87. [Google Scholar] [CrossRef]
- Papuc, C.; Predescu, C.; Nicorescu, V.; Stefan, G.; Nicorescu, I. Antioxidant Properties of a Parsley (Petroselinum crispum) Juice Rich in Polyphenols and Nitrites. Curr. Res. Nutr. Food Sci. 2016, 4, 114–118. [Google Scholar] [CrossRef]
- Niemann, V.; Koch-Singenstreu, M.; Neu, A.; Nilkens, S.; Götz, F.; Unden, G.; Stehle, T. The NreA Protein Functions as a Nitrate Receptor in the Staphylococcal Nitrate Regulation System. J. Mol. Biol. 2014, 426, 1539–1553. [Google Scholar] [CrossRef] [PubMed]
- Sánchez, M.M.; Leroy, F. Process-driven bacterial community dynamics are key to cured meat colour formation by coagulase-negative staphylococci via nitrate reductase or nitric oxide synthase activities. Int. J. Food Microbiol. 2015, 212, 60–66. [Google Scholar] [CrossRef] [PubMed]
- Predescu, N.; Papuc, C.; Stefan, G.; Goran, G. The Effect of Hawthorn Berry Phenolics and Parsley Roots Fermented Juice on Frankfurters’ Shelf-Life. Bull. Univ. Agric. Sci. Vet. Med. Cluj Napoca 2018, 75, 149–155. [Google Scholar] [CrossRef] [PubMed]
- Shahamat, M.A.; Seaman, A.; Woodbine, M. Influence of sodium chloride, pH and temperature on the inhibitory activity of sodium nitrite on Listeria monocytogenes. In Microbial Growth and Survival in Extremes of Environment; Academic Press: Cambridge, MA, USA, 1980; pp. 221–231. [Google Scholar]
- Junttila, J.; Hirn, J.; Hill, P.; Nurmi, E. Effect of Different Levels of Nitrite and Nitrate on the Survival of Listeria monocytogenes During the Manufacture of Fermented Sausage. J. Food Prot. 1989, 52, 158–161. [Google Scholar] [CrossRef]
- Bergis, H.; Bonanno, L.; Asséré, A. EURL Lm Technical Guidance Document on Challenge Tests and Durability Studies for Assessing Shelf-Life of Ready-to-Eat Foods Related to Listeria monocytogenes, 2021, Version 4, (Ed.) EURL Lm, Maisons-Alfort, France. Available online: https://food.ec.europa.eu/system/files/2021-07/biosafety_fh_mc_tech-guide-doc_listeria-in-rte-foods_en_0.pdf (accessed on 25 January 2024).
- EN ISO 20976-1; Microbiology of the Food Chain—Guidelines for Conducting Challenge Tests of Food and Feed Products—Part 1: Challenge Tests to Study the Growth Potential, Lag Time and the Maximum Growth Rate, 1st ed. ISO: Geneva, Switzerland, 2019.
- Predescu, C.N.; Papuc, C.; Stefan, G.; Tașbac, B.; Temocico, G.; Sărăcilă, M.; Untea, A.E. Combined Effects of Parsnip Fermented Juice and Hawthorn Extract Regarding Pork Mince Stability: Physico-Chemical and Microbiological Aspects. Agriculture 2023, 13, 432. [Google Scholar] [CrossRef]
- Association of Official Analytical Chemists Official. Methods of Analysis. In 973.31 Nitrites in Cured Meat; Colorimetric Method; Association of Official Analytical Chemists: Arlington, TX, USA, 1990. [Google Scholar]
- Singleton, V.L.; Rosi, J.A. Colorimetric of Total Phenolics with Phosphomolybdic-Phosphotungstic Acid Reagents. Am. J. Enol. Vitic. 1965, 16, 144–158. [Google Scholar] [CrossRef]
- AFNOR Certification Validation Study of the VIDAS Listeria Monocytogenes II(LMO2 Ref.30122) BIO 12/11 -03/04 for the Detection of Listeria Monocytogenes. Available online: https://nfvalidation.afnor.org/wp-content/uploads/sites/2/2014/03/BIO-12-11-03-04_en.pdf (accessed on 24 January 2024).
- EN ISO 11290-2; Microbiology of Food Chain—Horizontal Method for the Detection and Enumeration of L. monocytogenes and of Listeria spp.—Part 2: Enumeration Method. ISO: Geneva, Switzerland, 2017.
- ISO 18787:2017; Foodstuffs—Determination of Water Activity. ISO: Geneva, Switzerland, 2017.
- Association of Official Analytical Chemists. Official Methods of Analysis, 15th ed.; Association of Official Analytical Chemists: Washington, DC, USA, 1990. [Google Scholar]
- AFNOR Certification Validation Study of the Method Tempo® AC (Tempo®AC Ref.411113) BIO 12/35-05/13 for the Enumeration of Aerobic Mesophilic Flora in Human Food, Pet food and Environmental Samples. Available online: https://nf-validation.afnor.org/wp-content/uploads/2021/09/TEMPO-AC-SUMMARY-REPORT-Version-0.pdf (accessed on 24 January 2024).
- Wickham, H.; François, R.; Henry, L.; Müller, K.; Vaughan, D. dplyr: A Grammar of Data Manipulation. R Package Version 1.1.4. 2023. Available online: https://dplyr.tidyverse.org (accessed on 28 February 2025).
- Wickham, H. ggplot2: Elegant Graphics for Data Analysis; Springer: New York, NY, USA, 2016; ISBN 978-3-319-24277-4. Available online: https://ggplot2.tidyverse.org (accessed on 28 February 2025).
- Dinno, A. dunn.test Version 1.3.6. 2024. Available online: https://CRAN.R-project.org/package=dunn.test (accessed on 28 February 2025).
- Fox, J.; Weisberg, S. An R Companion to Applied Regression, 3rd ed.; Sage Publishing: Thousand Oaks, CA, USA, 2019; Available online: https://www.john-fox.ca/Companion/ (accessed on 28 February 2025).
- Hothorn, T.; Bretz, F.; Westfall, P. Simultaneous Inference in General Parametric Models. Biom. J. 2008, 50, 346–363. [Google Scholar] [CrossRef]
- Pohlert, T.; PMCMRplus: Calculate Pairwise Multiple Comparisons of Mean Rank Sums Extended. R Package Version 1.9.12. 2024. Available online: https://CRAN.R-project.org/package=PMCMRplus (accessed on 28 February 2025).
- Mendiburu, F.; Yaseen, M.; Agricolae: Statistical Procedures for Agricultural Research. R Package Version1.4.0. 2020. Available online: https://myaseen208.github.io/agricolae (accessed on 28 February 2025).
- Zhang, H.; Wu, J.; Guo, X. Effects of antimicrobial and antioxidant activities of spice extracts on raw chicken meat quality. Food Sci. Hum. Well. 2016, 5, 39–48. [Google Scholar] [CrossRef]
- Dave, D.; Ghaly, A.E. Meat Spoilage Mechanisms and Preservation Techniques: A Critical Review. Am. J. Agric. Biol. Sci. 2011, 6, 486–510. [Google Scholar] [CrossRef]
- Mazhar, S.; Bibi, H.; Bibi, A.; Zulfiqar, S.; Zahid, S.; Raza, A.; Zamaan, T. Microbial Food Spoilage of Animal Based Products and Preservation by Using Diverse Methods. J. Microbiol. Mol. Genet. 2023, 4, 85–103. [Google Scholar] [CrossRef]
- Iulietto, M.F.; Sechi, P.; Borgogni, E.; Cenci-Goga, B.T. Meat spoilage: A Critical Review of a Neglected Alteration Due to Ropy Slime Producing Bacteria. Ital. J. Anim. Sci. 2015, 14, 4011. [Google Scholar] [CrossRef]
- Stanišiċ, N.; Petričević, M.; Živkoviċ, D.; Petrović, M.M.; Ostojić-Andrić, D.; Aleksić, S.; Stajić, S. Changes of physical-chemical properties of beef during 14 days of chilling. Biotechnol. Anim. Husb. 2012, 28, 77–85. [Google Scholar] [CrossRef]
- Koutsoumanis, K.P.; Sofos, J.N. Effect of Inoculum Size on the Combined Temperature, pH and aw Limits for Growth of Listeria monocytogenes. Int. J. Food Microbiol. 2005, 104, 83–91. [Google Scholar] [CrossRef]
- ANSES. EURL Lm Guidance Document to Evaluate the Competence of Laboratories Implementing Challenge Tests and Durability Studies Related to Listeria Monocytogenes in Ready-to-Eat Foods. Version 3–10/02/2023. 2023. Available online: https://food.ec.europa.eu/system/files/2023-02/biosafety_fh_mc_guidance-comp-labs.pdf (accessed on 12 September 2023).
- Georgescu, M.; Irimia, R.A.; Raita, S.M. Development of a Listeria monocytogenes—Targeted Food Safety Management Plan for a Meat Processing Facility. Rev. Romana Med. Vet. 2019, 29, 91–96. [Google Scholar]
- Wu, Y.; Park, K.C.; Choi, B.G.; Park, J.H.; Yoon, K.S. The Antibiofilm Effect of Ginkgo biloba Extract Against Salmonella and Listeria Isolates from Poultry. Foodborne Pathog. Dis. 2016, 13, 229–238. [Google Scholar] [CrossRef]
- Fotina, T.; Petrov, R.; Fotina, H.; Shkromada, O.; Yaroshchuk, R.; Fotin, A.; Zazharsky, V.; Fotin, O.; Havryliuk, H.; Yaroshchuk, S. Antibacterial Properties of Ginkgo Biloba Extract on Microorganism Strains in Vitro Experiments. AgroLife Sci. J. 2024, 13, 92–99. [Google Scholar]
- Bouarab-Chibane, L.; Forquet, V.; Lantéri, P.; Clément, Y.; Léonard-Akkari, L.; Oulahal, N.; Degraeve, P.; Bordes, C. Antibacterial Properties of Polyphenols: Characterization and QSAR (Quantitative Structure-Activity Relationship) Models. Front. Microbiol. 2019, 10, 829. [Google Scholar] [CrossRef] [PubMed]
- Gyawali, R.; Ibrahim, S.A. Natural products as antimicrobial agents. Food Control 2014, 46, 412–429. [Google Scholar] [CrossRef]
- Vazquez-Armenta, F.J.; Bernal-Mercado, A.T.; Lizardi-Mendoza, J.; Silva- Espinoza, B.A.; Cruz-Valenzuela, M.R.; Gonzalez-Aguilar, G.A.; Nazzaro, F.; Fratianni, F.; Ayala-Zavala, J.F. Phenolic Extracts from Grape Stems Inhibit Listeria monocytogenes Motility and Adhesion to Food Contact Surfaces. J. Adhes. Sci. Technol. 2017, 32, 889–907. [Google Scholar] [CrossRef]
- Tamkutė, L.; Gil, B.M.; Carballido, J.R.; Pukalskienė, M.; Venskutonis, P.R. Effect of Cranberry Pomace Extracts Isolated by Pressurized Ethanol and Water on the Inhibition of Food Pathogenic/Spoilage Bacteria and the Quality of Pork Products. Food Res. Int. 2019, 120, 38–51. [Google Scholar] [CrossRef] [PubMed]
- Ferysiuk, K.; Wójciak, K.M. Reduction of Nitrite in Meat Products through the Application of Various Plant-Based Ingredients. Antioxidants 2020, 9, 711. [Google Scholar] [CrossRef] [PubMed]
- Sindelar, J.J.; Milkowski, A.L. Human Safety Controversies Surrounding Nitrate and Nitrite in the Diet. Nitric Oxide 2012, 26, 259–266. [Google Scholar] [CrossRef]
- Gassara, F.; Kouassi, A.P.; Brar, S.K.; Belkacemi, K. Green Alternatives to Nitrates and Nitrites in Meat-Based Products—A Review. Crit. Rev. Food Sci. Nutr. 2016, 56, 2133–2148. [Google Scholar] [CrossRef]
- Govari, M.; Pexara, A. Nitrates and Nitrites in Meat Products. J. Hell. Vet. Med. Soc. 2015, 66, 127–140. [Google Scholar] [CrossRef]
- Riel, G.; Boulaaba, A.; Popp, J.; Klein, G. Effects of Parsley Extract Powder as an Alternative for the Direct Addition of Sodium Nitrite in the Production of Mortadella-Type Sausages—Impact on Microbiological, Physicochemical and Sensory Aspects. Meat Sci. 2017, 131, 166–175. [Google Scholar] [CrossRef]
- Hospital, X.F.; Hierro, E.; Arnau, J.; Carballo, J.; Aguirre, J.S.; Gratacós-Cubarsí, M.; Fernández, M. Effect of Nitrate and Nitrite on Listeria and Selected Spoilage Bacteria Inoculated in Dry-Cured Ham. Food Res. Int. 2017, 101, 82–87. [Google Scholar] [CrossRef]
- Seman, D.L.; Borger, A.C.; Meyer, J.D.; Hall, P.A.; Milkowski, A.L. Modeling the Growth of Listeria monocytogenes in Cured Ready-to-Eat Processed Meat Products by Manipulation of Sodium Chloride, Sodium Diacetate, Potassium Lactate, and Product Moisture Content. J. Food Prot. 2002, 65, 651–658. [Google Scholar] [CrossRef] [PubMed]
- Legan, J.D.; Seman, D.L.; Milkowski, A.L.; Hirschey, J.A.; Vandeven, M.H. Modeling the Growth Boundary of Listeria monocytogenes in Ready-to-Eat Cooked Meat Products as a Function of the Product Salt, Moisture, Potassium Lactate, and Sodium Diacetate Concentrations. J. Food Prot. 2004, 67, 2195–2204. [Google Scholar] [CrossRef] [PubMed]


| Product | Batch | Preservatives and Antioxidants | |||
|---|---|---|---|---|---|
| PFJ (ppm NO2−) | HBE (ppm GAE) | N (ppm NO2−) | A (ppm Ascorbate) | ||
| F1 | B1 | 50 | 50 | ||
| B2 | 50 | 50 | |||
| B3 | 50 | 50 | |||
| F2 | B4 | 50 | 50 | ||
| B5 | 50 | 50 | |||
| B6 | 50 | 50 | |||
| Batch | TVC at T0 (log CFU/g) | TVC at T4 (log CFU/g) | ||||
|---|---|---|---|---|---|---|
| Mean | SD | Variance (log CFU/g)2 | Mean | SD | Variance (log CFU/g)2 | |
| B1 | 2.35 | 0.40 | 3.30 | 0.30 | ||
| B2 | 2.43 | 0.35 | 3.23 | 0.35 | ||
| B3 | 2.50 | 0.40 | 3.30 | 0.35 | ||
| Experimental Group (B1, B2, B3) | 2.43 | 0.0751 | 0.00563 | 3.28 | 0.0404 | 0.00163 |
| B4 | 2.50 | 0.40 | 3.75 | 0.35 | ||
| B5 | 2.53 | 0.35 | 3.85 | 0.35 | ||
| B6 | 2.37 | 0.45 | 3.70 | 0.30 | ||
| Standard Group (B4, B5, B6) | 2.47 | 0.0850 | 0.00723 | 3.77 | 0.0764 | 0.00583 |
| Batch | Day | pH | aw | ||||
|---|---|---|---|---|---|---|---|
| Mean | SD | Variance | Mean | SD | Variance | ||
| B1 | T0 | 5.76 | 0.45 | 0.952 | 0.001 | ||
| T4 | 5.89 | 0.35 | 0.945 | 0.002 | |||
| B2 | T0 | 5.66 | 0.40 | 0.947 | 0.001 | ||
| T4 | 5.82 | 0.40 | 0.940 | 0.002 | |||
| B3 | T0 | 5.74 | 0.35 | 0.948 | 0.002 | ||
| T4 | 5.90 | 0.35 | 0.943 | 0.001 | |||
| Experimental Group (B1, B2, B3) | 5.80 | 0.0929 | 0.00863 | 0.946 | 0.00417 | 0.0000174 | |
| B4 | T0 | 6.15 | 0.30 | 0.950 | 0.001 | ||
| T4 | 6.32 | 0.45 | 0.946 | 0.001 | |||
| B5 | T0 | 6.18 | 0.35 | 0.945 | 0.003 | ||
| T4 | 6.30 | 0.40 | 0.943 | 0.001 | |||
| B6 | T0 | 5.89 | 0.40 | 0.946 | 0.0002 | ||
| T4 | 6.27 | 0.35 | 0.942 | 0.001 | |||
| Standard Group (B4, B5, B6) | 6.18 | 0.159 | 0.0254 | 0.945 | 0.00280 | 0.00000787 | |
| Time (Day) | B1 | B2 | B3 | B4 | B5 | B6 |
|---|---|---|---|---|---|---|
| T0 | absent/25 g | absent/25 g | absent/25 g | absent/25 g | absent/25 g | absent/25 g |
| absent/25 g | absent/25 g | absent/25 g | absent/25 g | absent/25 g | absent/25 g | |
| absent/25 g | absent/25 g | absent/25 g | absent/25 g | absent/25 g | absent/25 g | |
| T4 | absent/25 g | absent/25 g | absent/25 g | absent/25 g | absent/25 g | absent/25 g |
| absent/25 g | absent/25 g | absent/25 g | absent/25 g | absent/25 g | absent/25 g | |
| absent/25 g | absent/25 g | absent/25 g | absent/25 g | absent/25 g | absent/25 g |
| Batch | T0 | T1 | T2 | T3 | T4 | Δ/Batch log10 CFU/g | Δ/F1 log10 CFU/g | |
|---|---|---|---|---|---|---|---|---|
| Lm (log10 CFU/g) | Mean ± SD | Lm (log10 CFU/g) | Lm (log10 CFU/g) | Lm (log10 CFU/g) | Lm (log10 CFU/g) | |||
| B1 | 2.66 | 2.71 ± 0.05 | 2.99 | 3.25 | 3.48 | 3.21 | 3.48−2.71 = 0.77 | 0.82 |
| 2.76 | ||||||||
| 2.72 | ||||||||
| B2 | 2.63 | 2.66 ± 0.02 | 2.95 | 3.22 | 3.37 | 3.14 | 3.37−2.66 = 0.71 | |
| 2.67 | ||||||||
| 2.68 | ||||||||
| B3 | 2.59 | 2.70 ± 0.10 | 3.18 | 3.30 | 3.52 | 3.35 | 3.52−2.70 = 0.82 | |
| 2.72 | ||||||||
| 2.79 | ||||||||
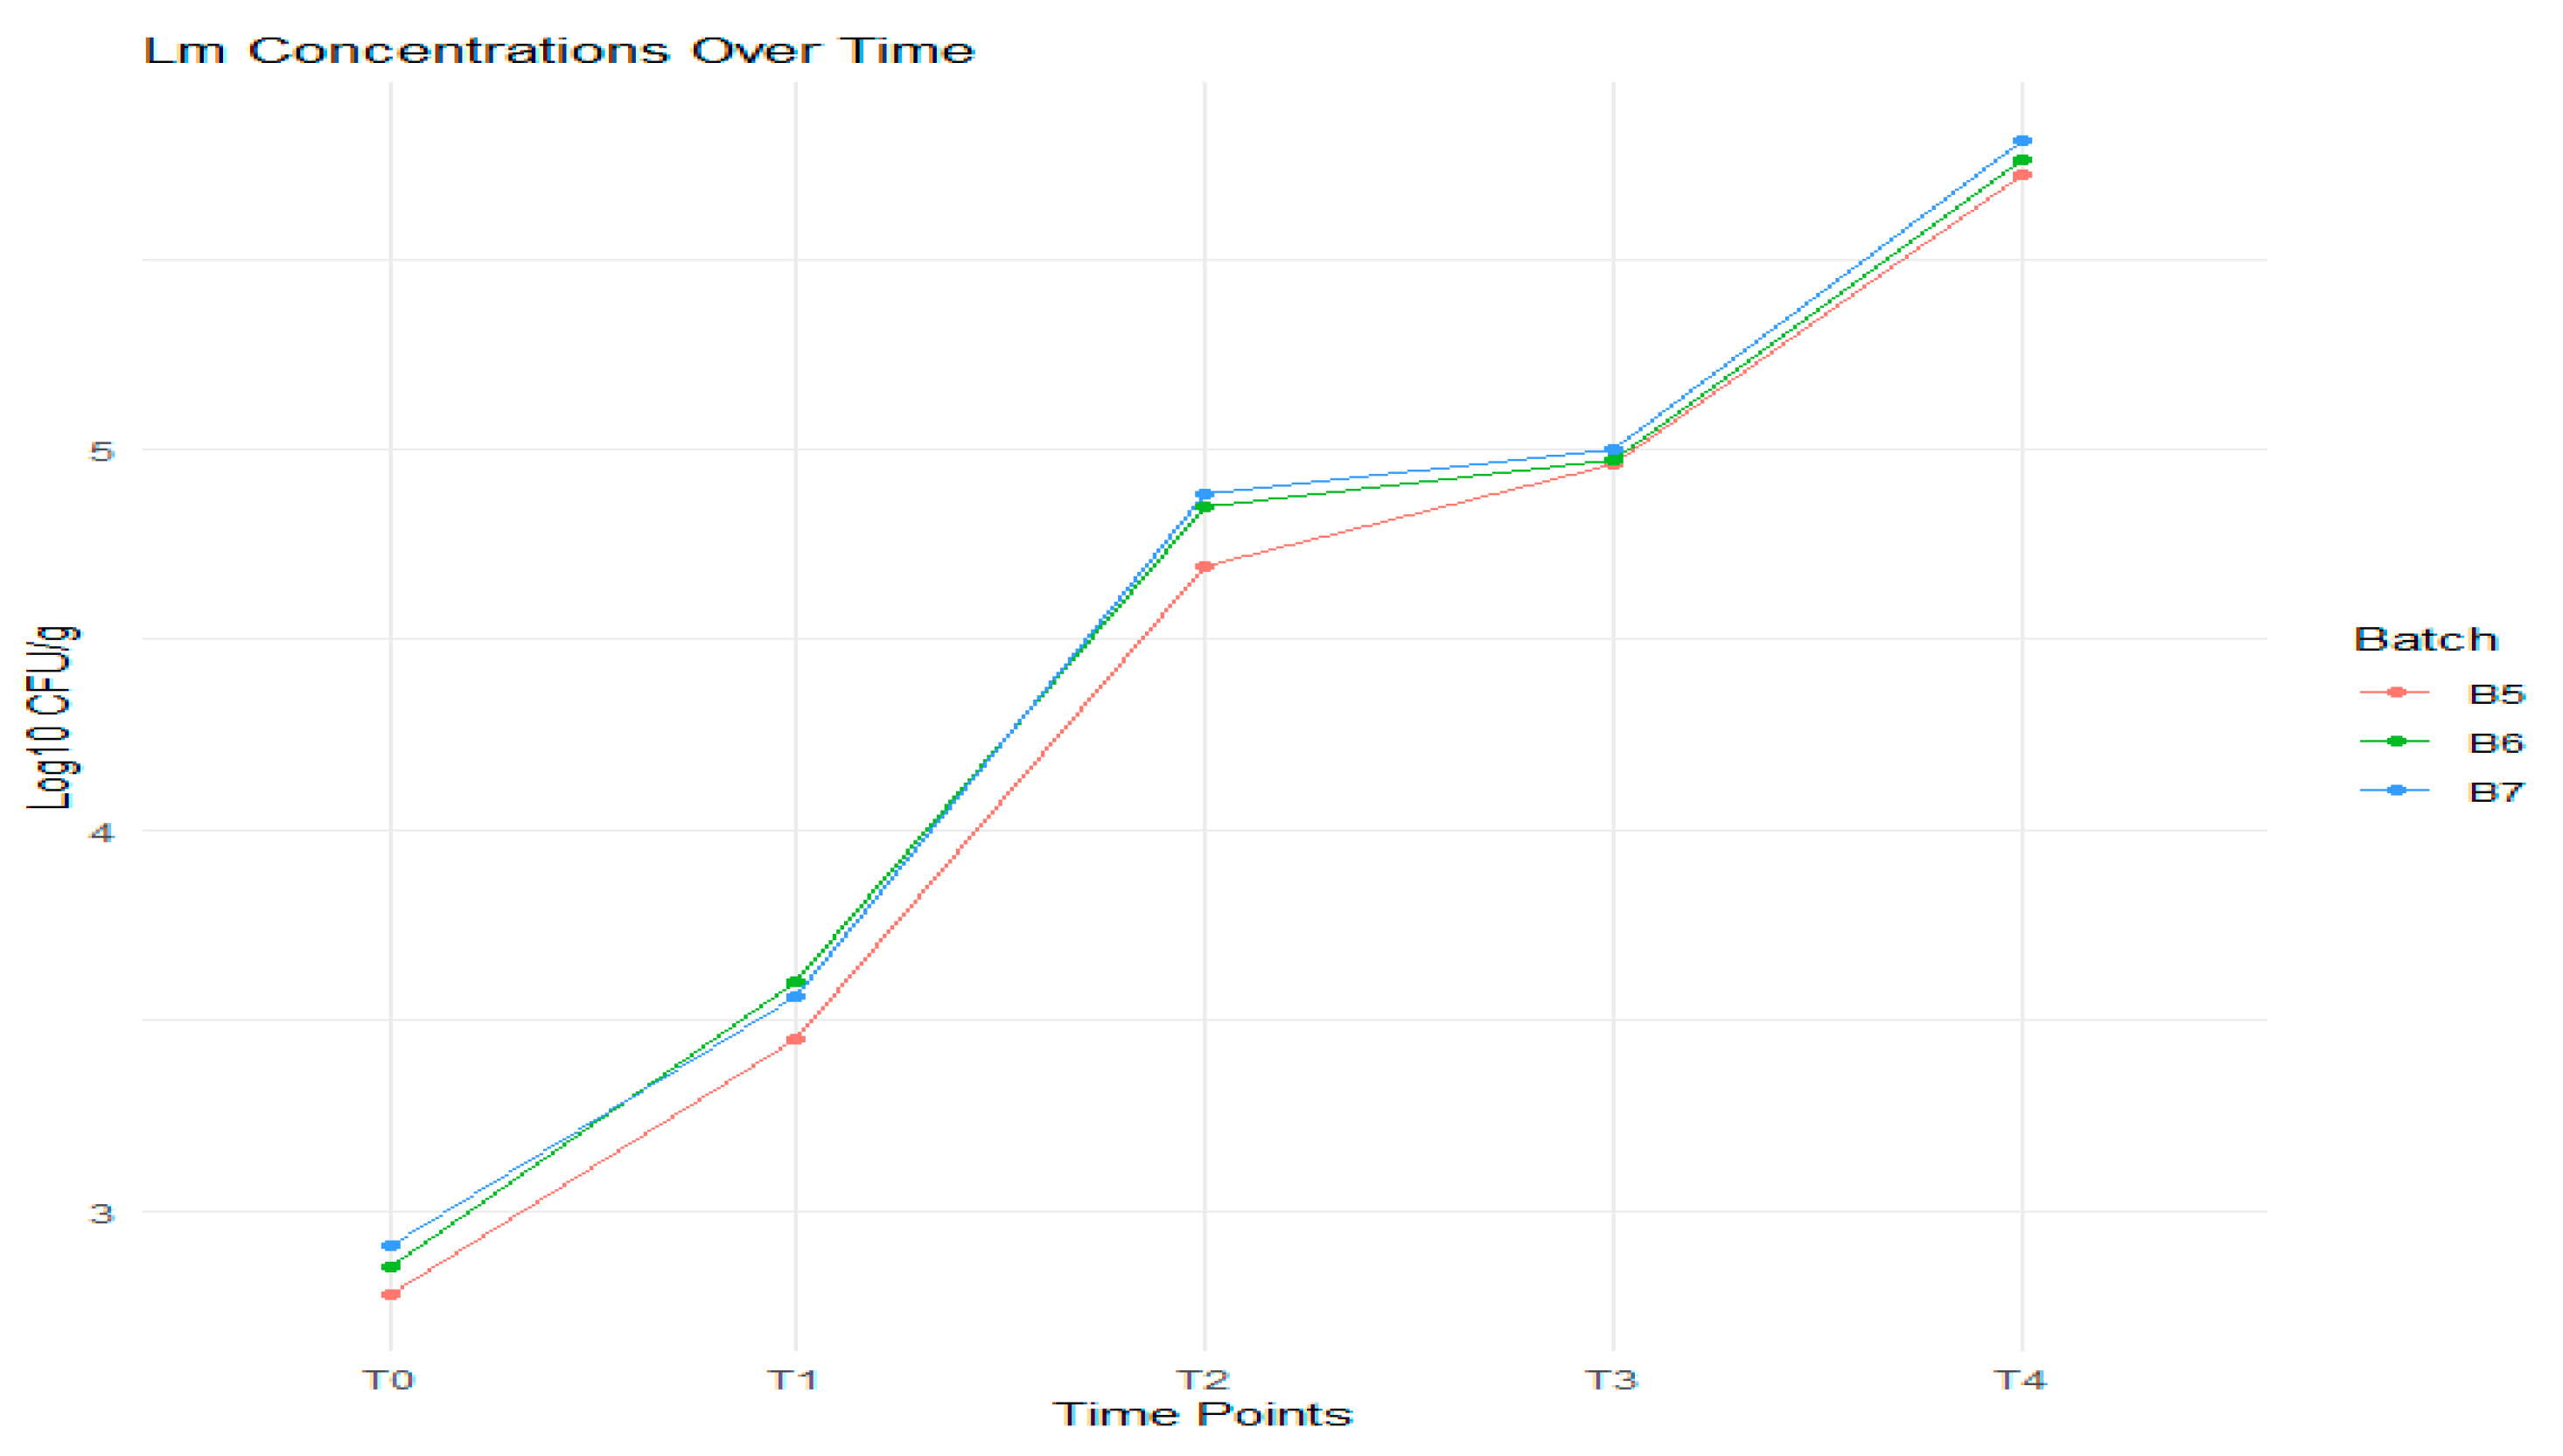
| Batch | T0 | T1 | T2 | T3 | T4 | Δ/Batch log10 CFU/g | Δ/F2 log10 CFU/g | |
|---|---|---|---|---|---|---|---|---|
| Lm (log10 CFU/g) | Mean ± SD | Lm (log10 CFU/g) | Lm (log10 CFU/g) | Lm (log10 CFU/g) | Lm (log10 CFU/g) | |||
| B4 | 2.79 | 2.78 ± 0.07 | 3.45 | 4.69 | 4.96 | 5.72 | 5.72−2.78 = 2.94 | 2.94 |
| 2.84 | ||||||||
| 2.70 | ||||||||
| B5 | 2.83 | 2.85 ± 0.02 | 3.60 | 4.85 | 4.97 | 5.76 | 5.76−2.85 = 2.91 | |
| 2.87 | ||||||||
| 2.86 | ||||||||
| B6 | 2.88 | 2.91 ± 0.02 | 3.56 | 4.88 | 5.00 | 5.81 | 5.81−2.91 = 2.90 | |
| 2.93 | ||||||||
| 2.92 | ||||||||
| Batch | T0 | T1 | T2 | T3 | T4 |
|---|---|---|---|---|---|
| Lm (log10 CFU/g) (mean ± SD) | Lm (log10 CFU/g) | Lm (log10 CFU/g) | Lm (log10 CFU/g) | Lm (log10 CFU/g) | |
| Experimental Batch | |||||
| B1 | 2.71 | 2.99 | 3.25 | 3.48 | 3.21 |
| B2 | 2.66 | 2.95 | 3.22 | 3.37 | 3.14 |
| B3 | 2.70 | 3.18 | 3.30 | 3.52 | 3.35 |
| Mean | 2.69 | 3.04 | 3.26 | 3.46 | 3.23 |
| Standard Deviation | 0.0265 | 0.123 | 0.0404 | 0.0777 | 0.107 |
| Variance | 0.000700 | 0.0151 | 0.00163 | 0.00603 | 0.0114 |
| Standard Batch | |||||
| B4 | 2.78 | 3.45 | 4.69 | 4.96 | 5.72 |
| B5 | 2.85 | 3.60 | 4.85 | 4.97 | 5.76 |
| B6 | 2.91 | 3.56 | 4.88 | 5.00 | 5.81 |
| Mean | 2.85 | 3.54 | 4.81 | 4.98 | 5.76 |
| Standard Deviation | 0.0651 | 0.0777 | 0.102 | 0.0208 | 0.0451 |
| Variance | 0.00423 | 0.00603 | 0.0104 | 0.000433 | 0.00203 |
Disclaimer/Publisher’s Note: The statements, opinions and data contained in all publications are solely those of the individual author(s) and contributor(s) and not of MDPI and/or the editor(s). MDPI and/or the editor(s) disclaim responsibility for any injury to people or property resulting from any ideas, methods, instructions or products referred to in the content. |
© 2025 by the authors. Licensee MDPI, Basel, Switzerland. This article is an open access article distributed under the terms and conditions of the Creative Commons Attribution (CC BY) license (https://creativecommons.org/licenses/by/4.0/).
Share and Cite
Ștefan, G.; Goran, G.V.; Predescu, C.N.; Gurău, M.R.; Bărăităreanu, S. The Behavior of Listeria monocytogenes During the Shelf Life of Wiener Sausages, as an Effect of Fermented Parsley Root Juice and Hawthorn Berry Phenolics. Foods 2025, 14, 1513. https://doi.org/10.3390/foods14091513
Ștefan G, Goran GV, Predescu CN, Gurău MR, Bărăităreanu S. The Behavior of Listeria monocytogenes During the Shelf Life of Wiener Sausages, as an Effect of Fermented Parsley Root Juice and Hawthorn Berry Phenolics. Foods. 2025; 14(9):1513. https://doi.org/10.3390/foods14091513
Chicago/Turabian StyleȘtefan, Georgeta, Gheorghe Valentin Goran, Corina Nicoleta Predescu, Maria Rodica Gurău, and Stelian Bărăităreanu. 2025. "The Behavior of Listeria monocytogenes During the Shelf Life of Wiener Sausages, as an Effect of Fermented Parsley Root Juice and Hawthorn Berry Phenolics" Foods 14, no. 9: 1513. https://doi.org/10.3390/foods14091513
APA StyleȘtefan, G., Goran, G. V., Predescu, C. N., Gurău, M. R., & Bărăităreanu, S. (2025). The Behavior of Listeria monocytogenes During the Shelf Life of Wiener Sausages, as an Effect of Fermented Parsley Root Juice and Hawthorn Berry Phenolics. Foods, 14(9), 1513. https://doi.org/10.3390/foods14091513