1. Introduction
Gluten is known to produce an allergic response, and intolerance to gluten leads to celiac disease. Levels of intolerance to gluten often vary with gluten variety; this is especially relevant to the use of oats which has a low effect on celiac suffers. Most current ELISA methodology, with the exception of assays based on the R5 antibody [
1], detect the presence of barley, rye and wheat but also oats. Assays based on the R5 antibody are not sensitive to oats, but this assay still cannot differentiate barley, wheat and rye. Also, all the ELISA methods that detect gluten are based on one section of the gluten protein (for example, in the case of the R5 assay, the peptide sequence glutamine-glutamine-proline-phenylalanine-proline (QQPFP) peptide epitope) and as such are susceptible to false positives and false negatives. Liquid chromatography tandem mass spectrometry (LC-MS/MS) has the ability to detect species based on multiple markers with multiple points of confirmation which makes it far less susceptible to producing false negatives and positives, and gives far more confirmation in detection. Due to its very specific nature, it is also capable of distinguishing species by using multiple peptide markers as shown previously [
2,
3,
4,
5]. A suitable LC-MS/MS method that could offer the possibility to differentiate between gluten species with a high degree of specificity would be beneficial to both grain producers and consumers.
In addition, legislation is changing with respect to gluten and, in the UK, one of the first allergen limits came into effect on 1 January 2012 [
6,
7]. On this date the laws governing food labeling were changed such that three different terms can now be used:
Gluten-free—is covered by the law and applies only to food which has 20 parts per million (ppm) or less of gluten.
Very low gluten—is covered by the law and is for foods which have between 21 and 100 ppm.
No gluten-containing ingredients—this is not covered by the law and is for foods that are made with ingredients that do not contain gluten and where cross contamination controls are in place. These foods will have very low levels of gluten, but have not been tested to the same extent as those labeled gluten-free or very low gluten.
These changes in the food labeling law have recently been followed in the US by the FDA [
8]. Some initial studies using LC-MS/MS in gluten profiling were presented in 2012 [
9]. In these studies trypsin was used as the enzyme for digestion, even though gluten proteins do not undergo a large level of trypsin digestion (due to a low number of lysine and arginine residues) some unique marker peptides were found. Recently, chymotrypsin has also been used as an alternative to trypsin [
10] to generate a large number of peptides for the improved detection of wheat gliadin proteins, but this method used longer digestion times and labelling chemistry to better characterise the gluten proteins.
The purpose of this study was a follow up to the original poster presentation in 2012 [
9] to investigate a simpler approach to preparing extracts and use recent advances in LC technology to help reach detection limits below the requirements of the current labelling legislation. One of the main purposes of this work was to develop an approach which could analyse a sample in one day using inexpensive available chemicals. In this study single varieties of grain which have not been first milled were ground into flour using a commercial coffee grinder. These samples, together with commercial samples of self-raising flour, gluten-free flour and some gluten and gluten-free foods, were extracted and then the allergenic proteins were reduced, alkylated and digested using trypsin. In this study the extracts produced were simply diluted into 0.1 % formic acid prior to injection and separation by reverse phase chromatography and LC-MS/MS detection. The LC used was a Eksigent ekspert™ microLC 200 UHPLC system (Eksigent, Redwood City, CA, USA) which had been previously evaluated for the detection of egg and milk allergens in wine [
11] and had been shown to offer a 5-fold improvement in sensitivity. The mass spectrometry methods utilised
Scheduled MRM™ (an algorithm which allows the independent monitoring of MRM transitions with a defined window around the expected retentions time for each MRM transition which is available in the Analyst
® software version 1.5 and onwards from AB SCIEX) for multiple peptides for each gluten species, so that presence of allergen can be unambiguously confirmed.
3. Results
To test this approach, several samples of grain from single varieties of wheat, rye, barley and oats, together with commercial samples of gluten-free flour, oats cookies, gluten free cookies, wheat cookies and a self-raising flour (from a local supermarket in the UK) were collected. Each sample of grain was milled in a commercially available coffee bean grinder to make single variety flour, and all these samples were extracted and analyzed using the described method.
Figure 2 shows the comparisons of the four different grain flours using a beta amylase marker peptide.
Figure 2.
The comparison of separate extracts from barley, wheat, rye, oats and gluten free flour. Here the chromatograms for three MRM transitions for a specific marker peptide from beta amylase (wheat 5 in
Table 3) have been shown for each species.
Figure 2.
The comparison of separate extracts from barley, wheat, rye, oats and gluten free flour. Here the chromatograms for three MRM transitions for a specific marker peptide from beta amylase (wheat 5 in
Table 3) have been shown for each species.
Separate marker peptides were also tested for oats, barley, wheat and rye, which were specific for each species; these are shown in
Figure 3,
Figure 4,
Figure 5 and
Figure 6.
Figure 3.
The comparison of separate extracts from barley, wheat, rye, oats and gluten free flour. Here the overlaid chromatograms for oats marker peptides (obtained from the theoretical digestion of avenin) have been shown for flour extract for each sample.
Figure 3.
The comparison of separate extracts from barley, wheat, rye, oats and gluten free flour. Here the overlaid chromatograms for oats marker peptides (obtained from the theoretical digestion of avenin) have been shown for flour extract for each sample.
Figure 4.
The comparison of separate extracts from barley, wheat, rye and oats flour. Here the overlaid chromatograms for barley marker peptides (obtained from the theoretical digestion of hordein) have been shown for flour extracts for each sample.
Figure 4.
The comparison of separate extracts from barley, wheat, rye and oats flour. Here the overlaid chromatograms for barley marker peptides (obtained from the theoretical digestion of hordein) have been shown for flour extracts for each sample.
Figure 5.
The comparison of separate extracts from barley, wheat, rye and oats flour. Here the overlaid chromatograms for rye marker peptides (obtained from the theoretical digestion of secalin) have been shown for flour extracts for each sample.
Figure 5.
The comparison of separate extracts from barley, wheat, rye and oats flour. Here the overlaid chromatograms for rye marker peptides (obtained from the theoretical digestion of secalin) have been shown for flour extracts for each sample.
Figure 6.
The comparison of separate extracts from barley, wheat, rye, oats and gluten-free flour. Here four separate peptide chromatograms for wheat marker peptides (obtained from the theoretical digestion of glutenin) have been shown for the extracts of each sample.
Figure 6.
The comparison of separate extracts from barley, wheat, rye, oats and gluten-free flour. Here four separate peptide chromatograms for wheat marker peptides (obtained from the theoretical digestion of glutenin) have been shown for the extracts of each sample.
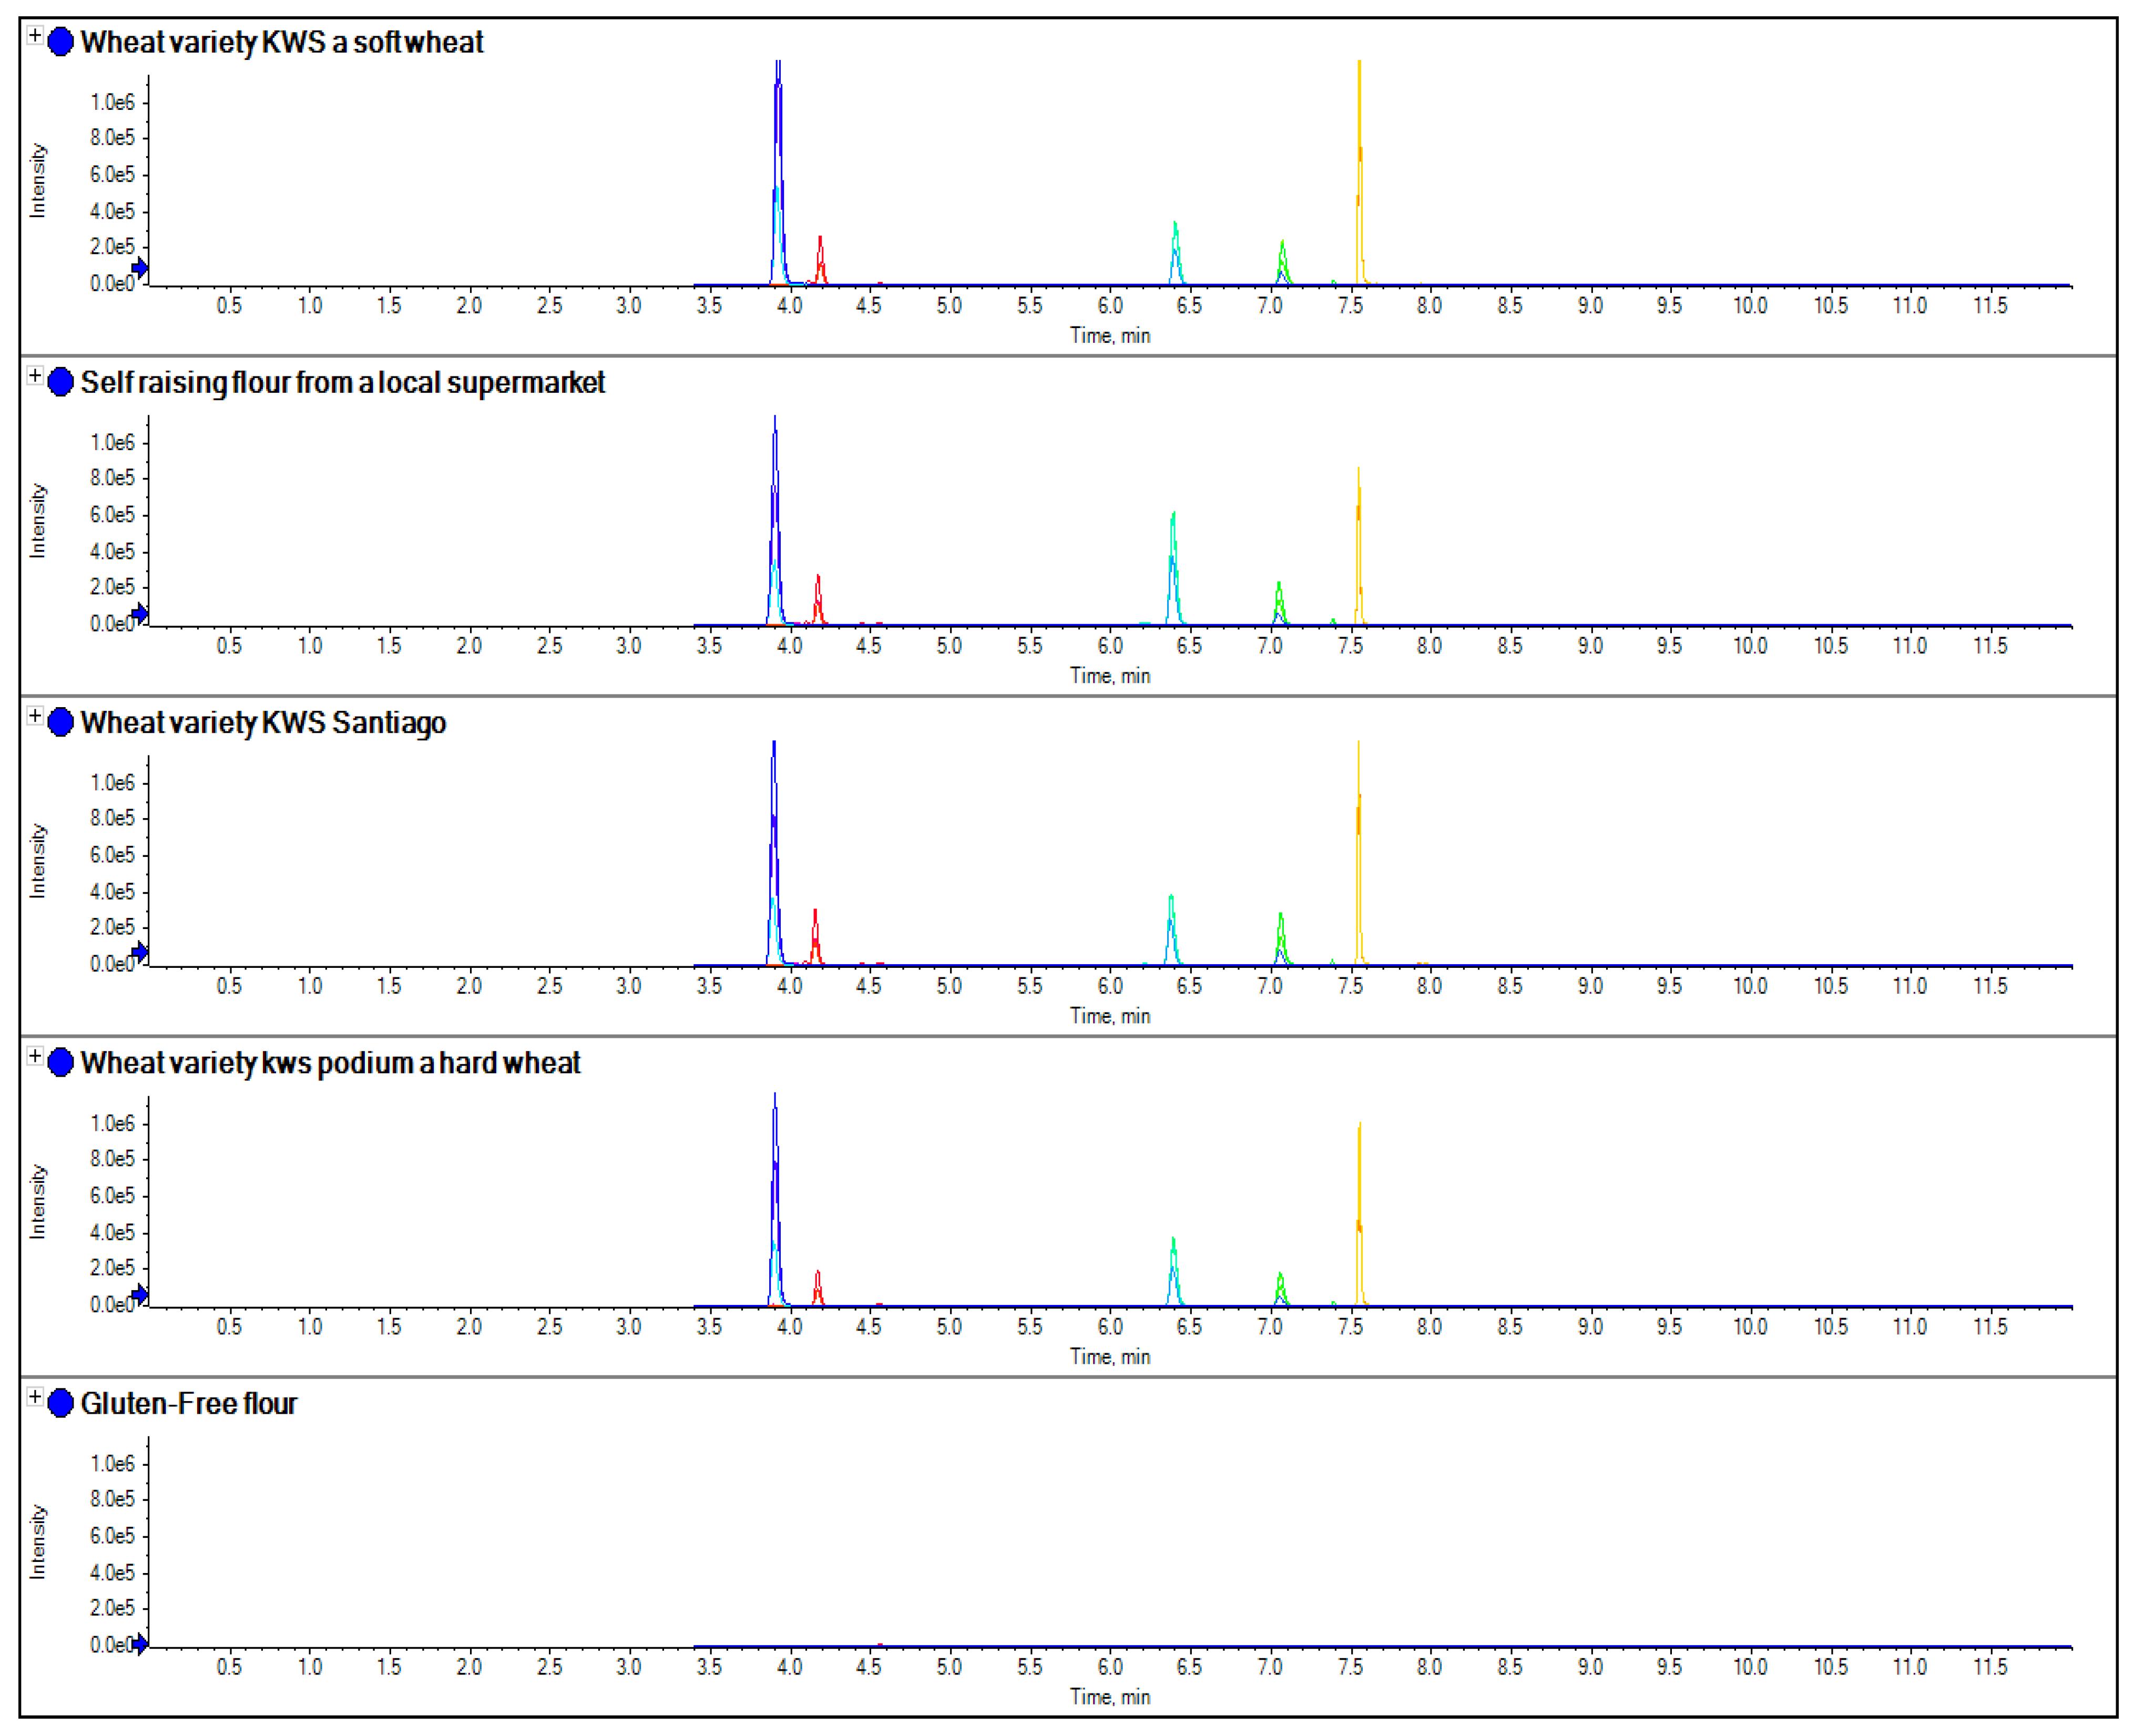
To further evaluate this approach, three samples of single varieties of wheat grain were obtained and extracted and compared with an extraction of gluten-free flour (a mix of tapioca, buckwheat, rice, maize and potato flour), as well as a sample of self-raising flour obtained from a local supermarket (
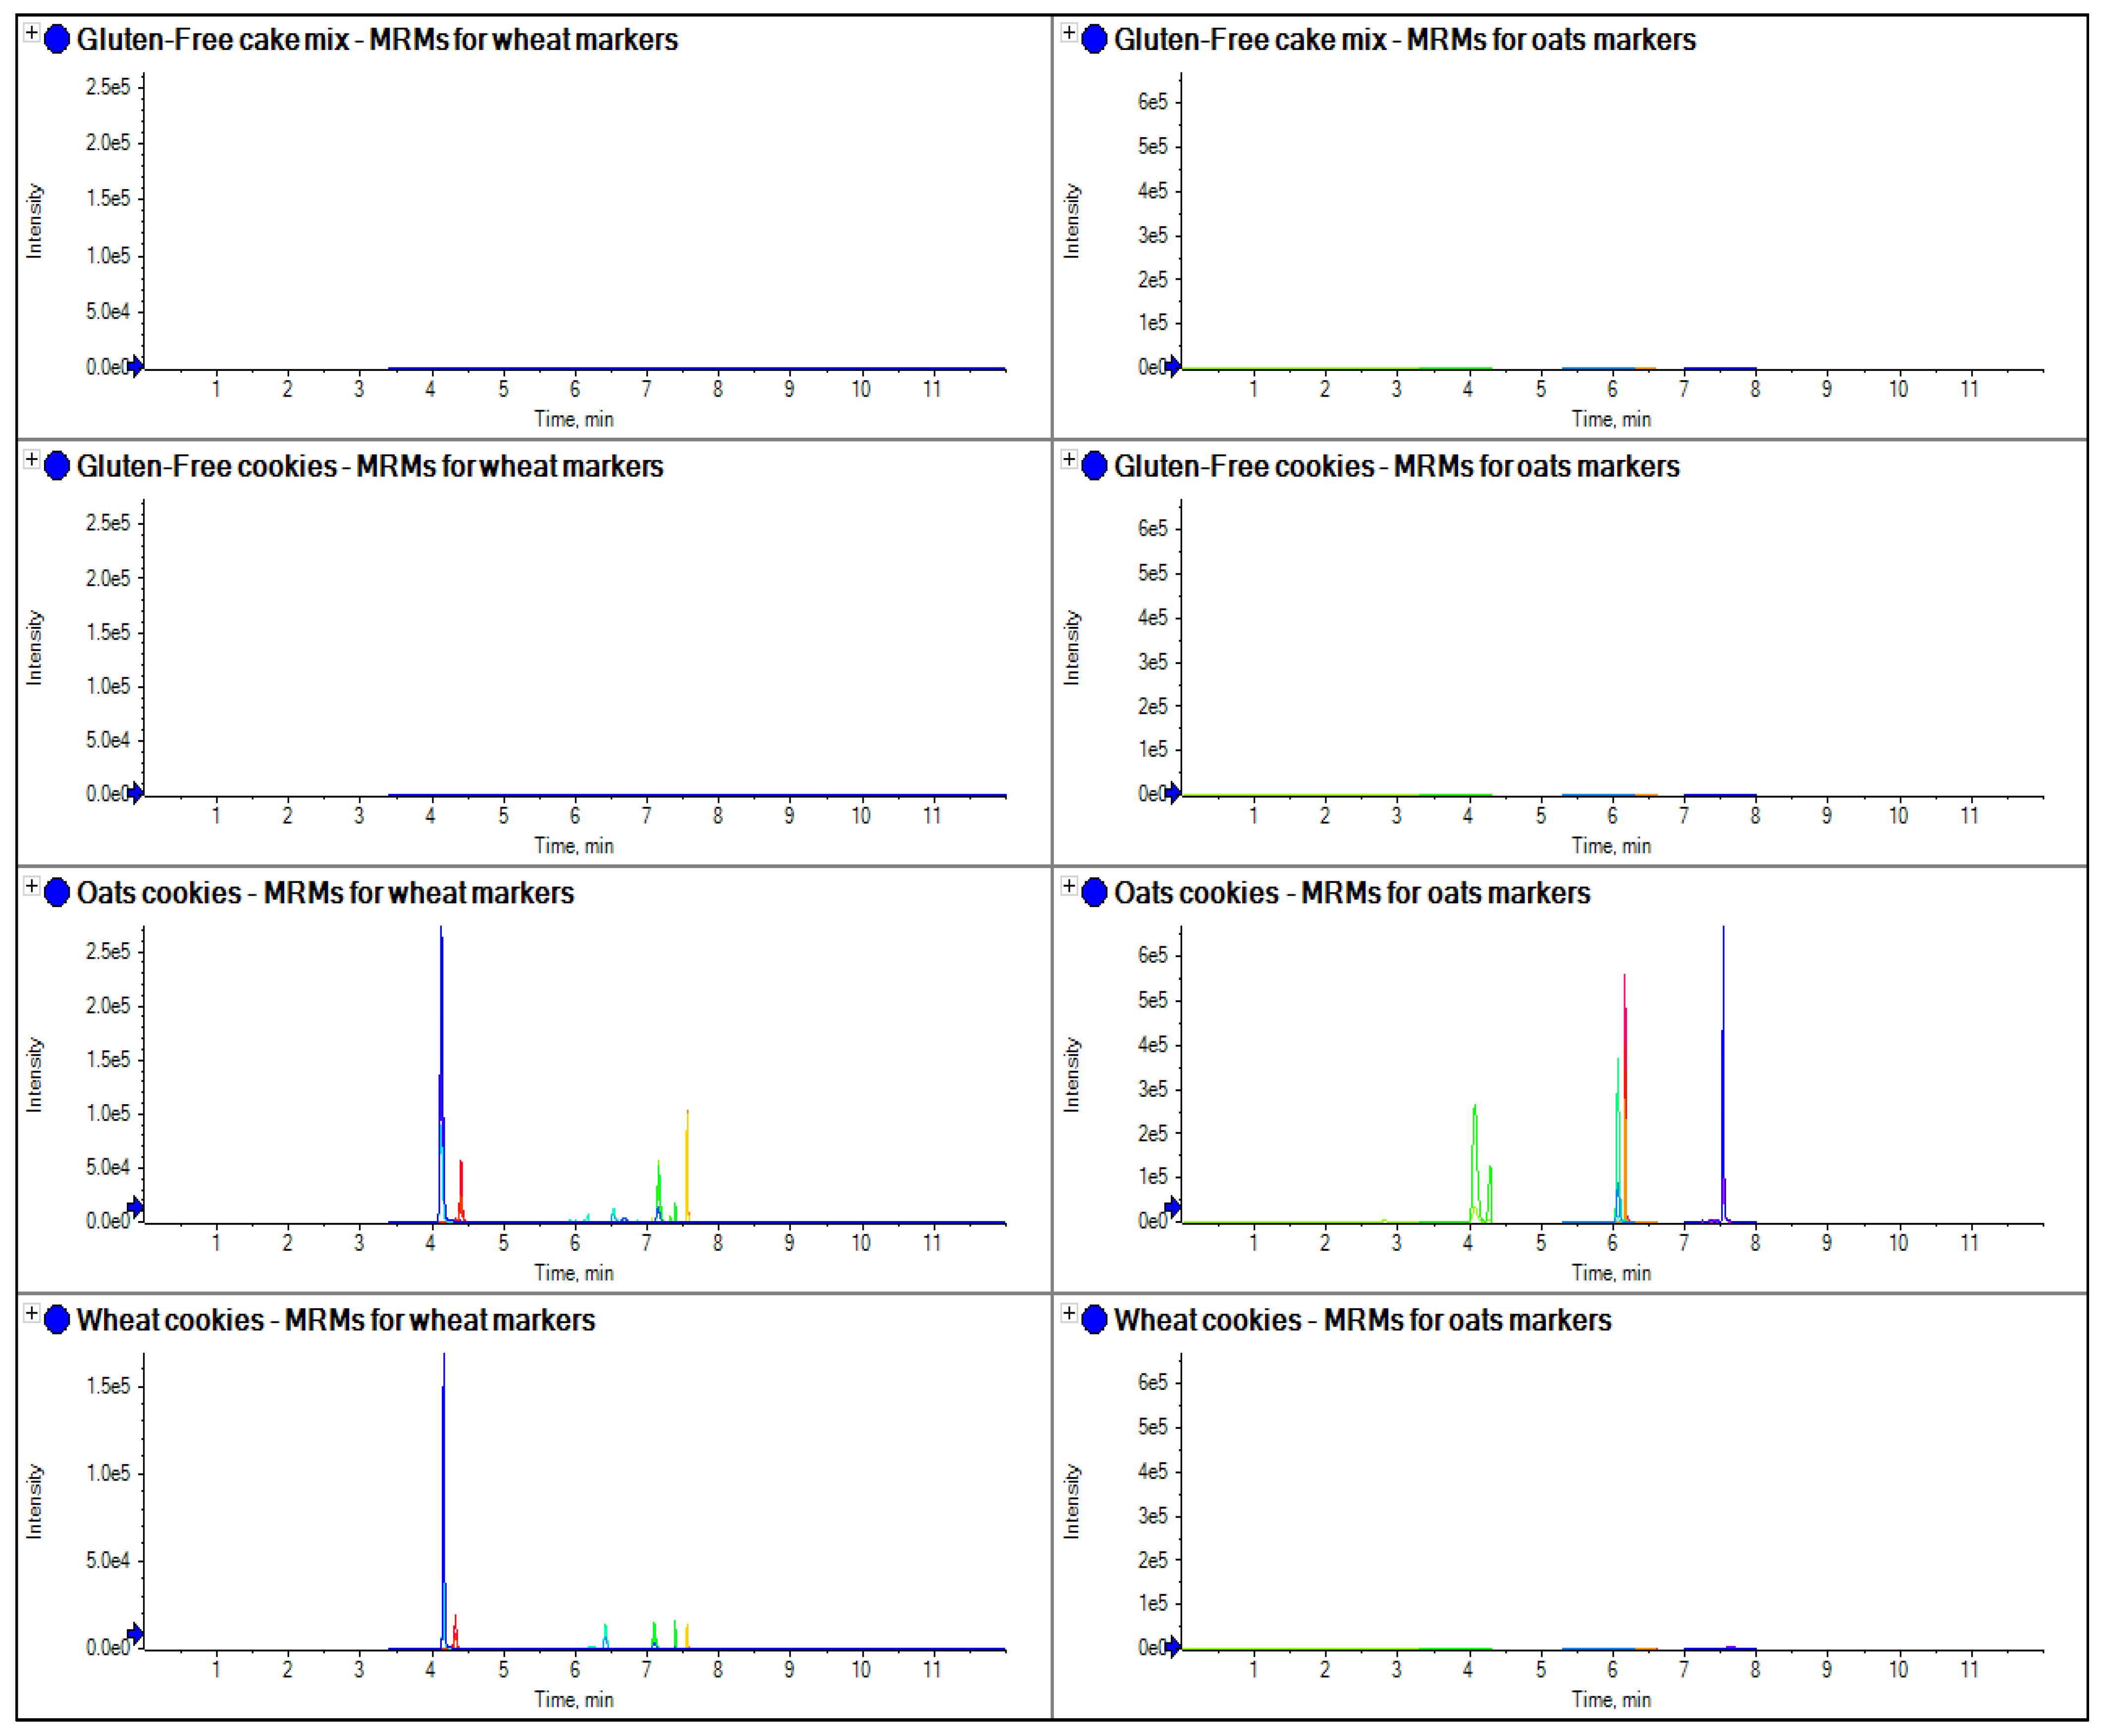
Figure 7). The method was further evaluated by applying the same extraction and analysis method to a sample of gluten-free cake mix and cookies, as well as samples of oats and wheat cookies, to see if it could be applied to processed food (
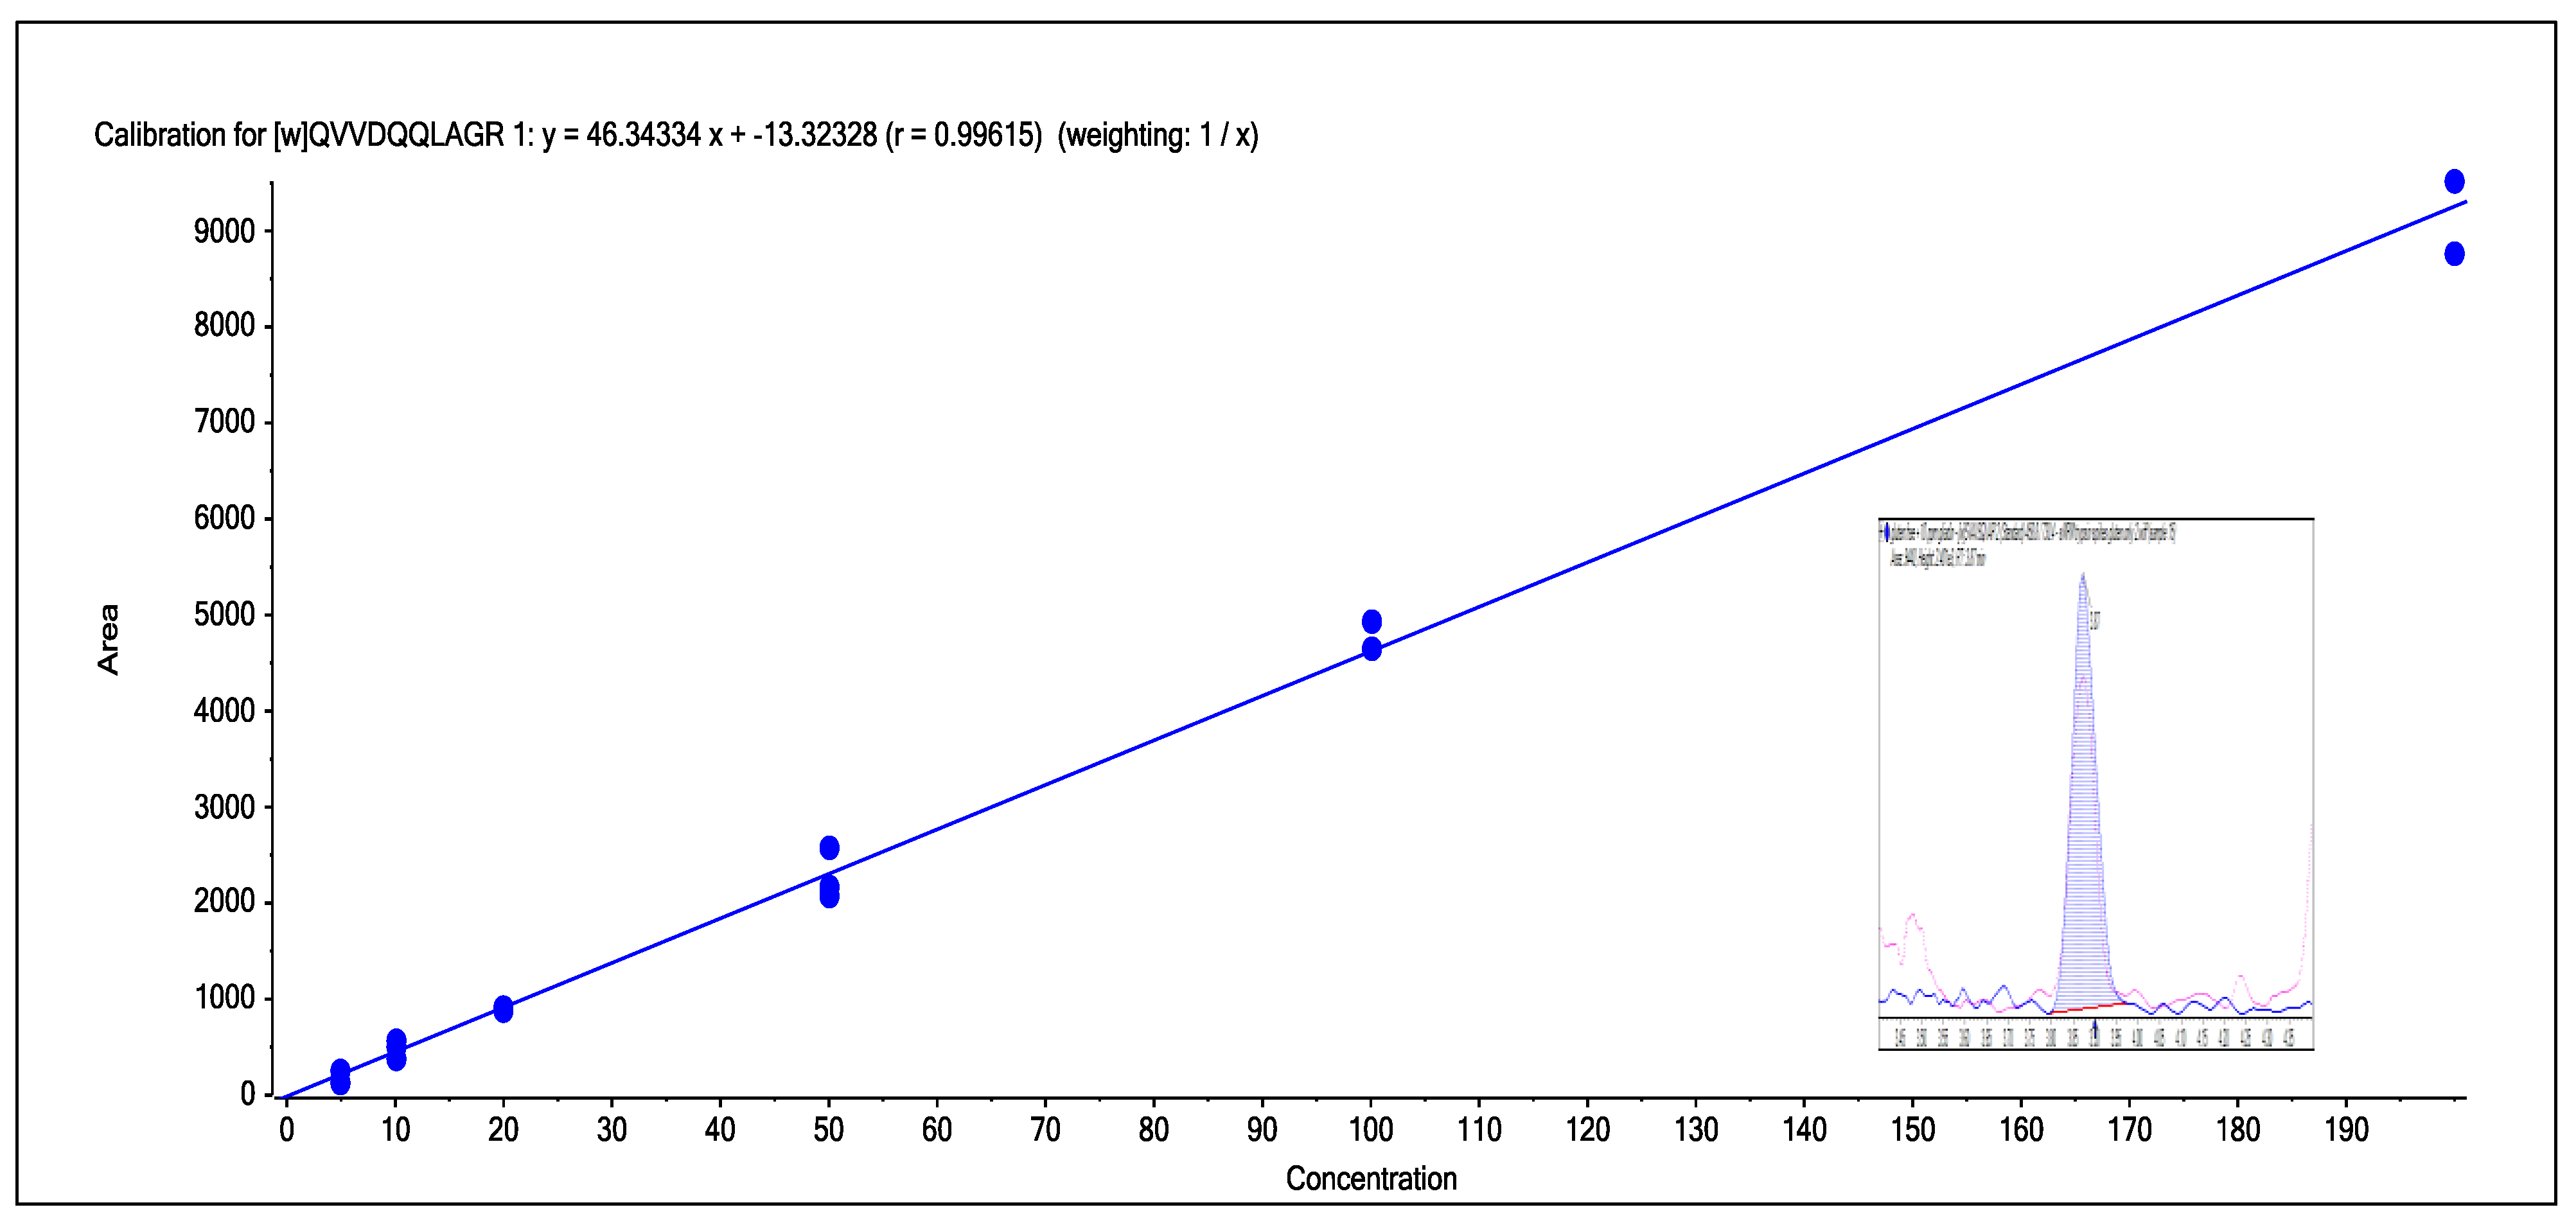
Figure 8). To assess linearity and sensitivity, samples of gluten-free flour were spiked at different levels with gliadin protein from wheat, which had been purchased from Sigma Aldrich (part number G3375,
Figure 9).
Figure 7.
The comparison of separate extracts of several samples of wheat obtained from single variety grain samples, as well as a sample of gluten-free flour and self-raising flour obtained from a local supermarket using the wheat peptides in
Table 3.
Figure 7.
The comparison of separate extracts of several samples of wheat obtained from single variety grain samples, as well as a sample of gluten-free flour and self-raising flour obtained from a local supermarket using the wheat peptides in
Table 3.
Figure 8.
The comparison of extracts from several samples of food collected from a local supermarket and analyzed for gluten markers for oats and wheat.
Figure 8.
The comparison of extracts from several samples of food collected from a local supermarket and analyzed for gluten markers for oats and wheat.
Figure 9.
The calibration line obtained from the spiking of gliadin into gluten-free wheat from the range of 5–200 ppm for wheat peptide 3. Inlayed in the calibration line is the chromatogram for the 10 ppm spike of gliadin into gluten-free flour. The calibration line was a linear 1/x fit with r = 0.9944.
4. Discussion
Similar to current R5 antibody based ELISA methods, LC-MS/MS marker peptides can be found which are present in all gluten varieties, with the exception of oats as shown in
Figure 2, where the use of a tryptic peptide from the protein beta amylase was present in wheat, barley and rye, but absent in oats. This marker gave a consistent MRM ratio for the three peptide MRM transitions across all three species and is a good marker to replicate the results of R5 antibody ELISA based methods which are positive to only wheat, rye and barley. However, LC-MS/MS differs to ELISA in that specific markers from the individual species of oats, rye, barley and wheat can also be developed.
Figure 3,
Figure 4,
Figure 5 and
Figure 6 show how individual markers for each of these species can be used to distinguish different species by LC-MS/MS and specifically confirm whether oats had been used as a replacement to wheat. LC-MS/MS offers an advantage over ELISA based methods in that you can use multiple peptide markers with multiple MRMs for each peptide to confirm the presence of the gluten species in the sample. One question that had been asked was that if LC-MS/MS was so specific, would it be affected by the variety of the species in the sample? To test this hypothesis, several single varieties of wheat grain were obtained from a grain supplier. These were then ground and the resulting flour extracted to test the effect of variety of wheat on the peptides detected. In
Figure 7 the comparison of four peptide markers for wheat, across different samples of flour, were compared. What is immediately apparent is that all the peptides are seen in all the samples with the exception of the gluten-free flour. These wheat varieties included commercial self-raising flour obtained from a supermarket, as well as hard and soft wheat varieties. From the peptide responses, you can also see that the relative responses are the same for three out of the four, with only one marker significantly higher in variety 3, but this may have been as a result of the change in matrix interference for this particular sample. This clearly indicates that the majority of LC-MS/MS markers which have been found are independent of variety used to produce the wheat flour and are just species specific.
One of the important tests for the feasibility of the use of LC-MS/MS was its ability to detect gluten in processed food. In processed food, ELISA kits have been shown to fail to pick up allergens due to processing changes in the protein structure which then prevent the antibody binding and this leads to false negatives [
15]. Also, due to the fact that ELISA methodology just relies on one protein region, unspecific binding has also been shown which has led to false positives in some instances [
16]. In this work, the LC-MS/MS method was applied to some cookies as well as gluten-free flour to determine its ability to detect the markers in processed food. In
Figure 8 it can clearly be seen that LC-MS/MS can detect the markers in the processed food and distinguish between varieties. In the case of the oats cookie, wheat and oats had been used in its manufacture and markers for both varieties were detected (barley and rye were not present in any sample, although not shown in this figure). However, in the wheat cookie, only wheat was used and this is the only species detected. In the gluten-free products, no gluten markers were detected.
A final test was linearity of response and the sensitivity of the method. To test both of these, gluten-free flour was spiked with gliadin (wheat protein obtained commercially) from a range of 5–200 ppm. A calibration line, shown in
Figure 9, for one of the peptides clearly shows that the LC-MS/MS response obtained for this wheat marker was linear—this was typical of the other markers used for wheat—and for this marker a 10 ppm spike could be easily detected. Marker peptides therefore could be detected at 5–10 ppm levels in the spiked sample of gluten-free flour even though the current sample preparation used an 80-fold dilution of the original sample.
5. Conclusions
This work has demonstrated that LC-MS/MS can be used to detect gluten in processed food and food ingredients. The work demonstrated that markers can be obtained which are specific for each individual species of gluten. The presence of these multiple markers for individual species were not variety dependent, as shown in a test of several single varieties of wheat flour (where all the same markers were detected), but some were species-dependent. As well as species dependent markers, markers for proteins that are present in rye, wheat and barley, but absent in oats, can also be added to the method to mimic the behavior of the R5 antibody based ELISA method to generally pick up the species that are high in gluten and affect people who suffer from Celiac disease. The method has been shown to detect levels of 5–10 ppm gluten proteins in gluten-free flour and offers an extended linear response which is envisaged to be a lot larger than that normally obtained for ELISA assays. Further to this, as the current method actually involves an 80-fold dilution of the sample, before injecting onto the LC-MSMS system, it offers the potential of detecting low ppm (0.5–5 ppm) when an SPE protocol is used to collect concentrate and purify the peptide markers.
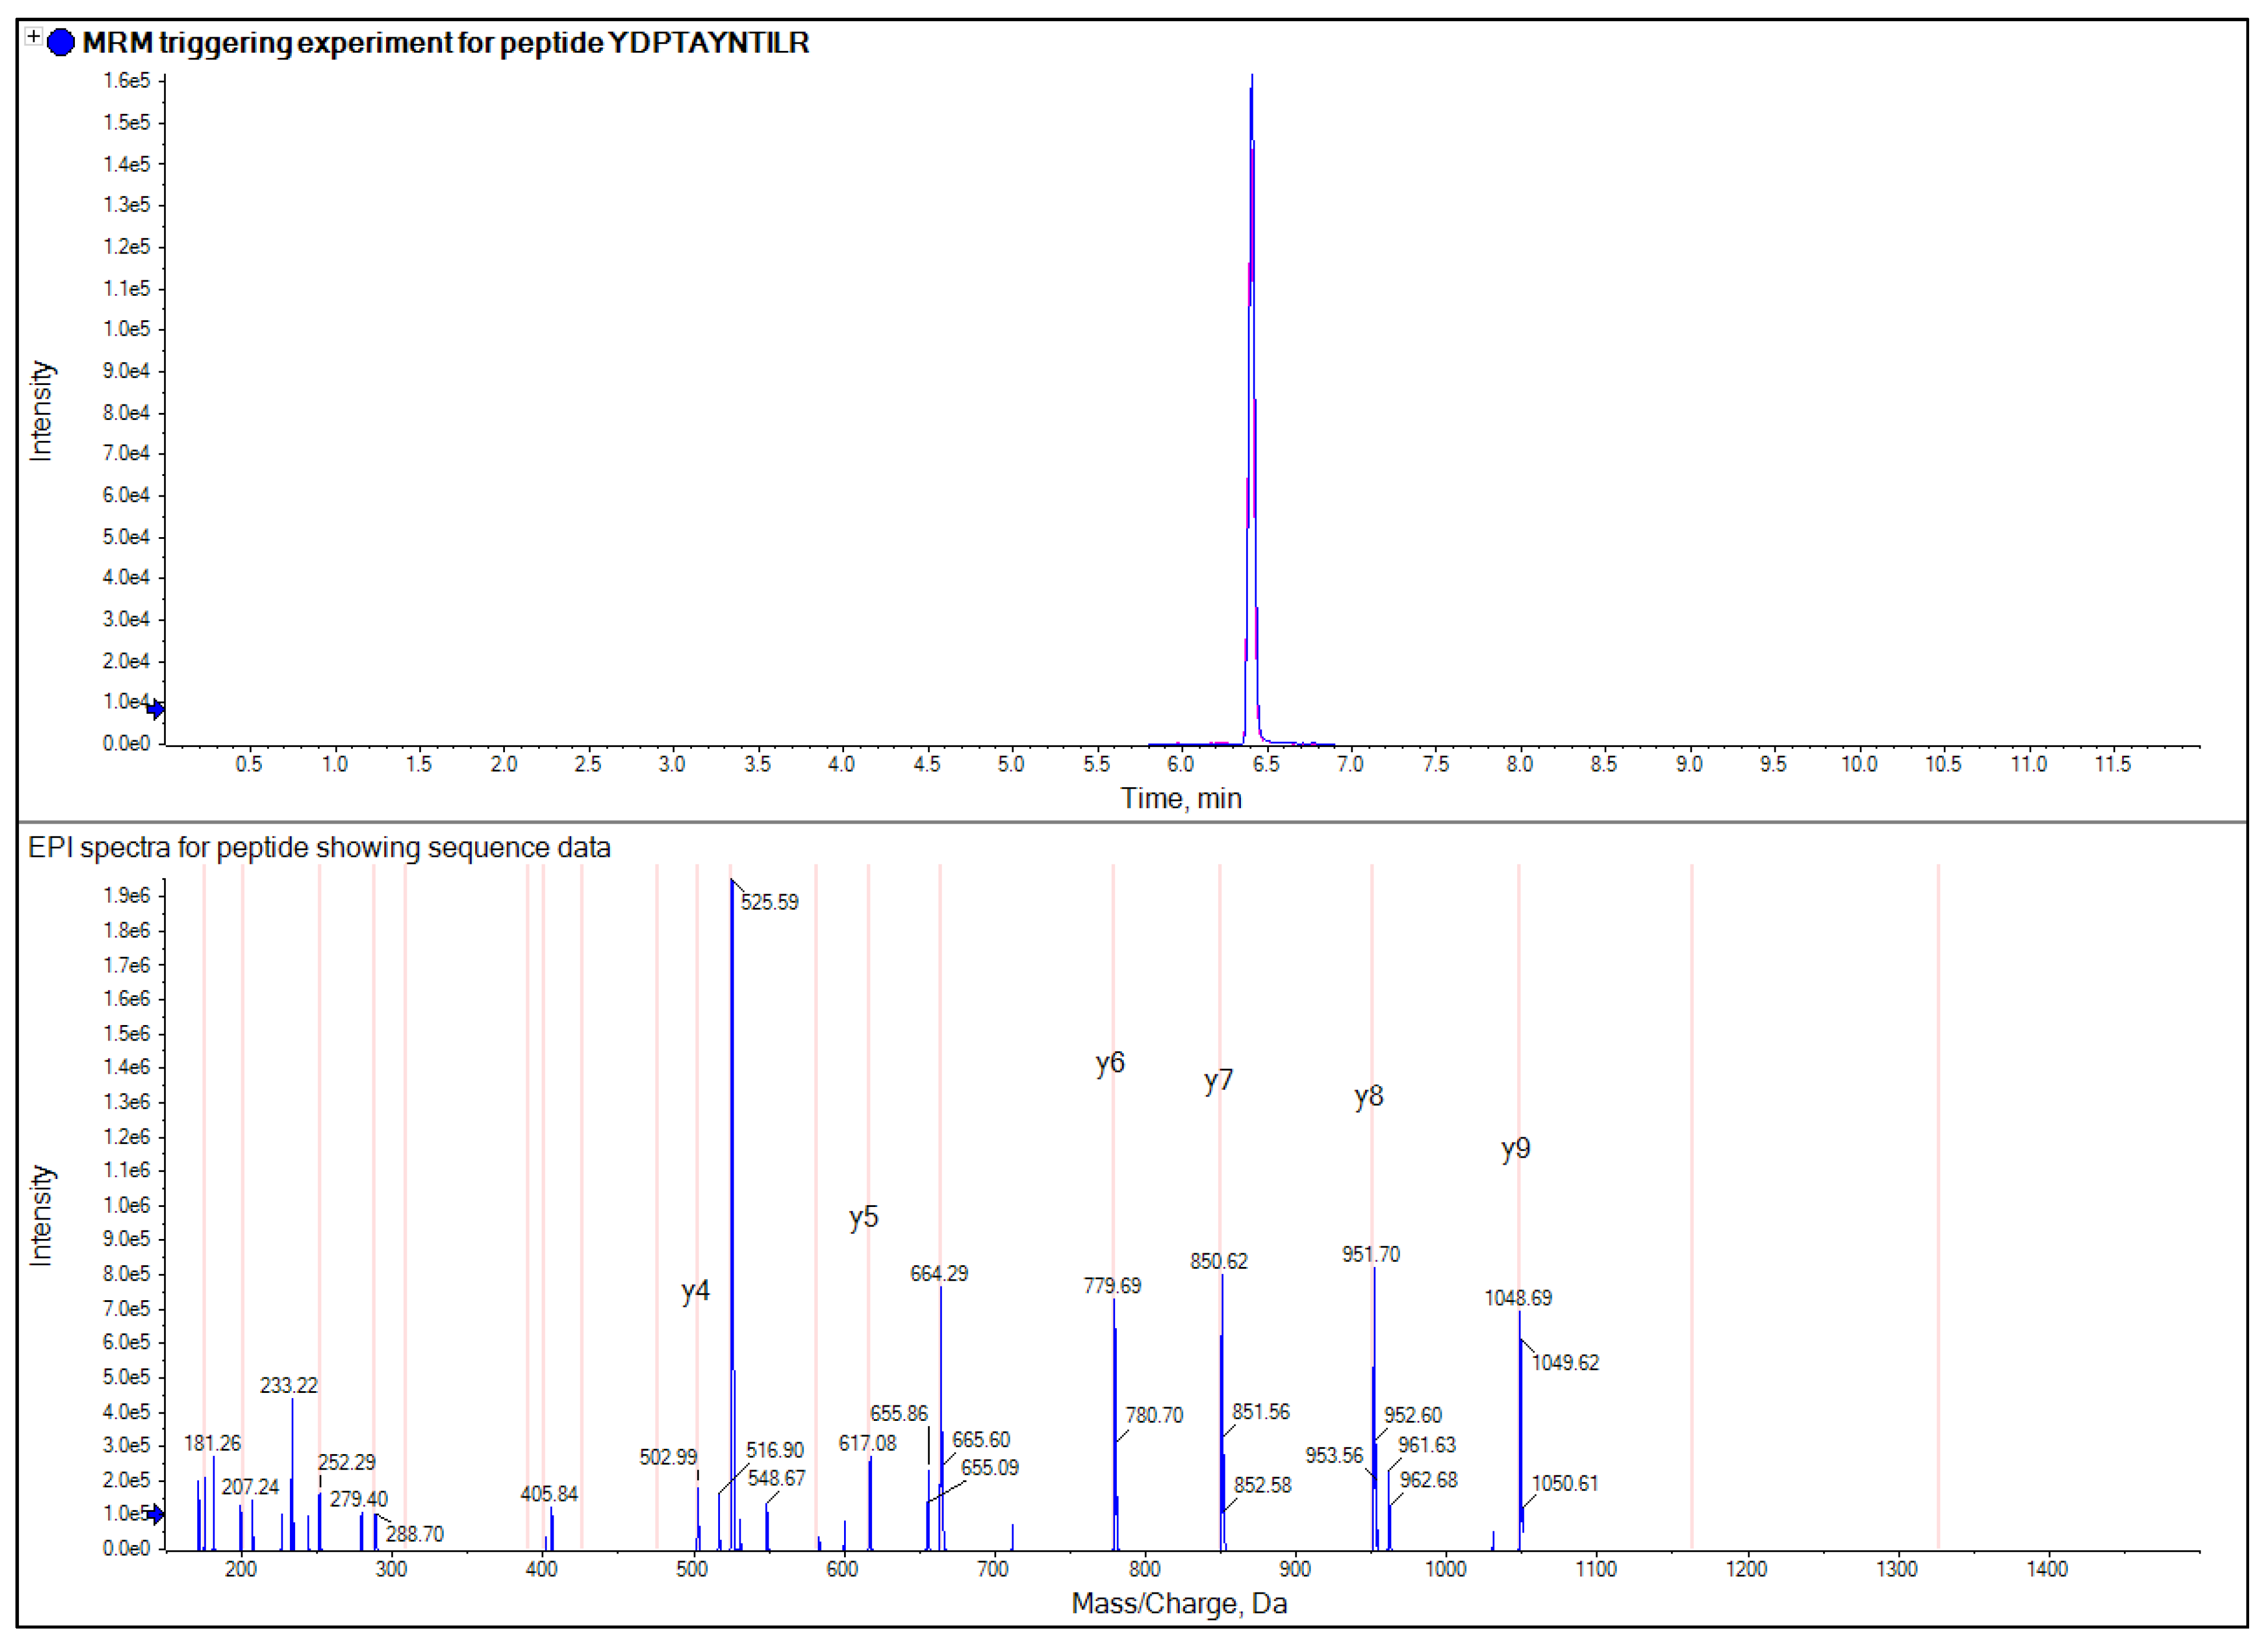
The presence of multiple markers for each gluten variety and the potential of acquiring MRM triggered product ion scans [
12], offers multiple points for confirmation of gluten contamination and provide confidence in the results, and reduces the risk of false positives and false negatives which can occur in ELISA assays.


