Taste Sensitivity Is Associated with Food Consumption Behavior but not with Recalled Pleasantness


Abstract
:1. Introduction
2. Materials and Methods
2.1. Participants
2.2. Taste Sensitivity
2.3. Questionnaires
2.3.1. Portions of VFB per Week
2.3.2. Masking and Modifying Taste
2.3.3. Recalled Pleasantness and Use-Frequency of Foods and Beverages
2.4. Statistics
3. Results
3.1. Subject Characteristics
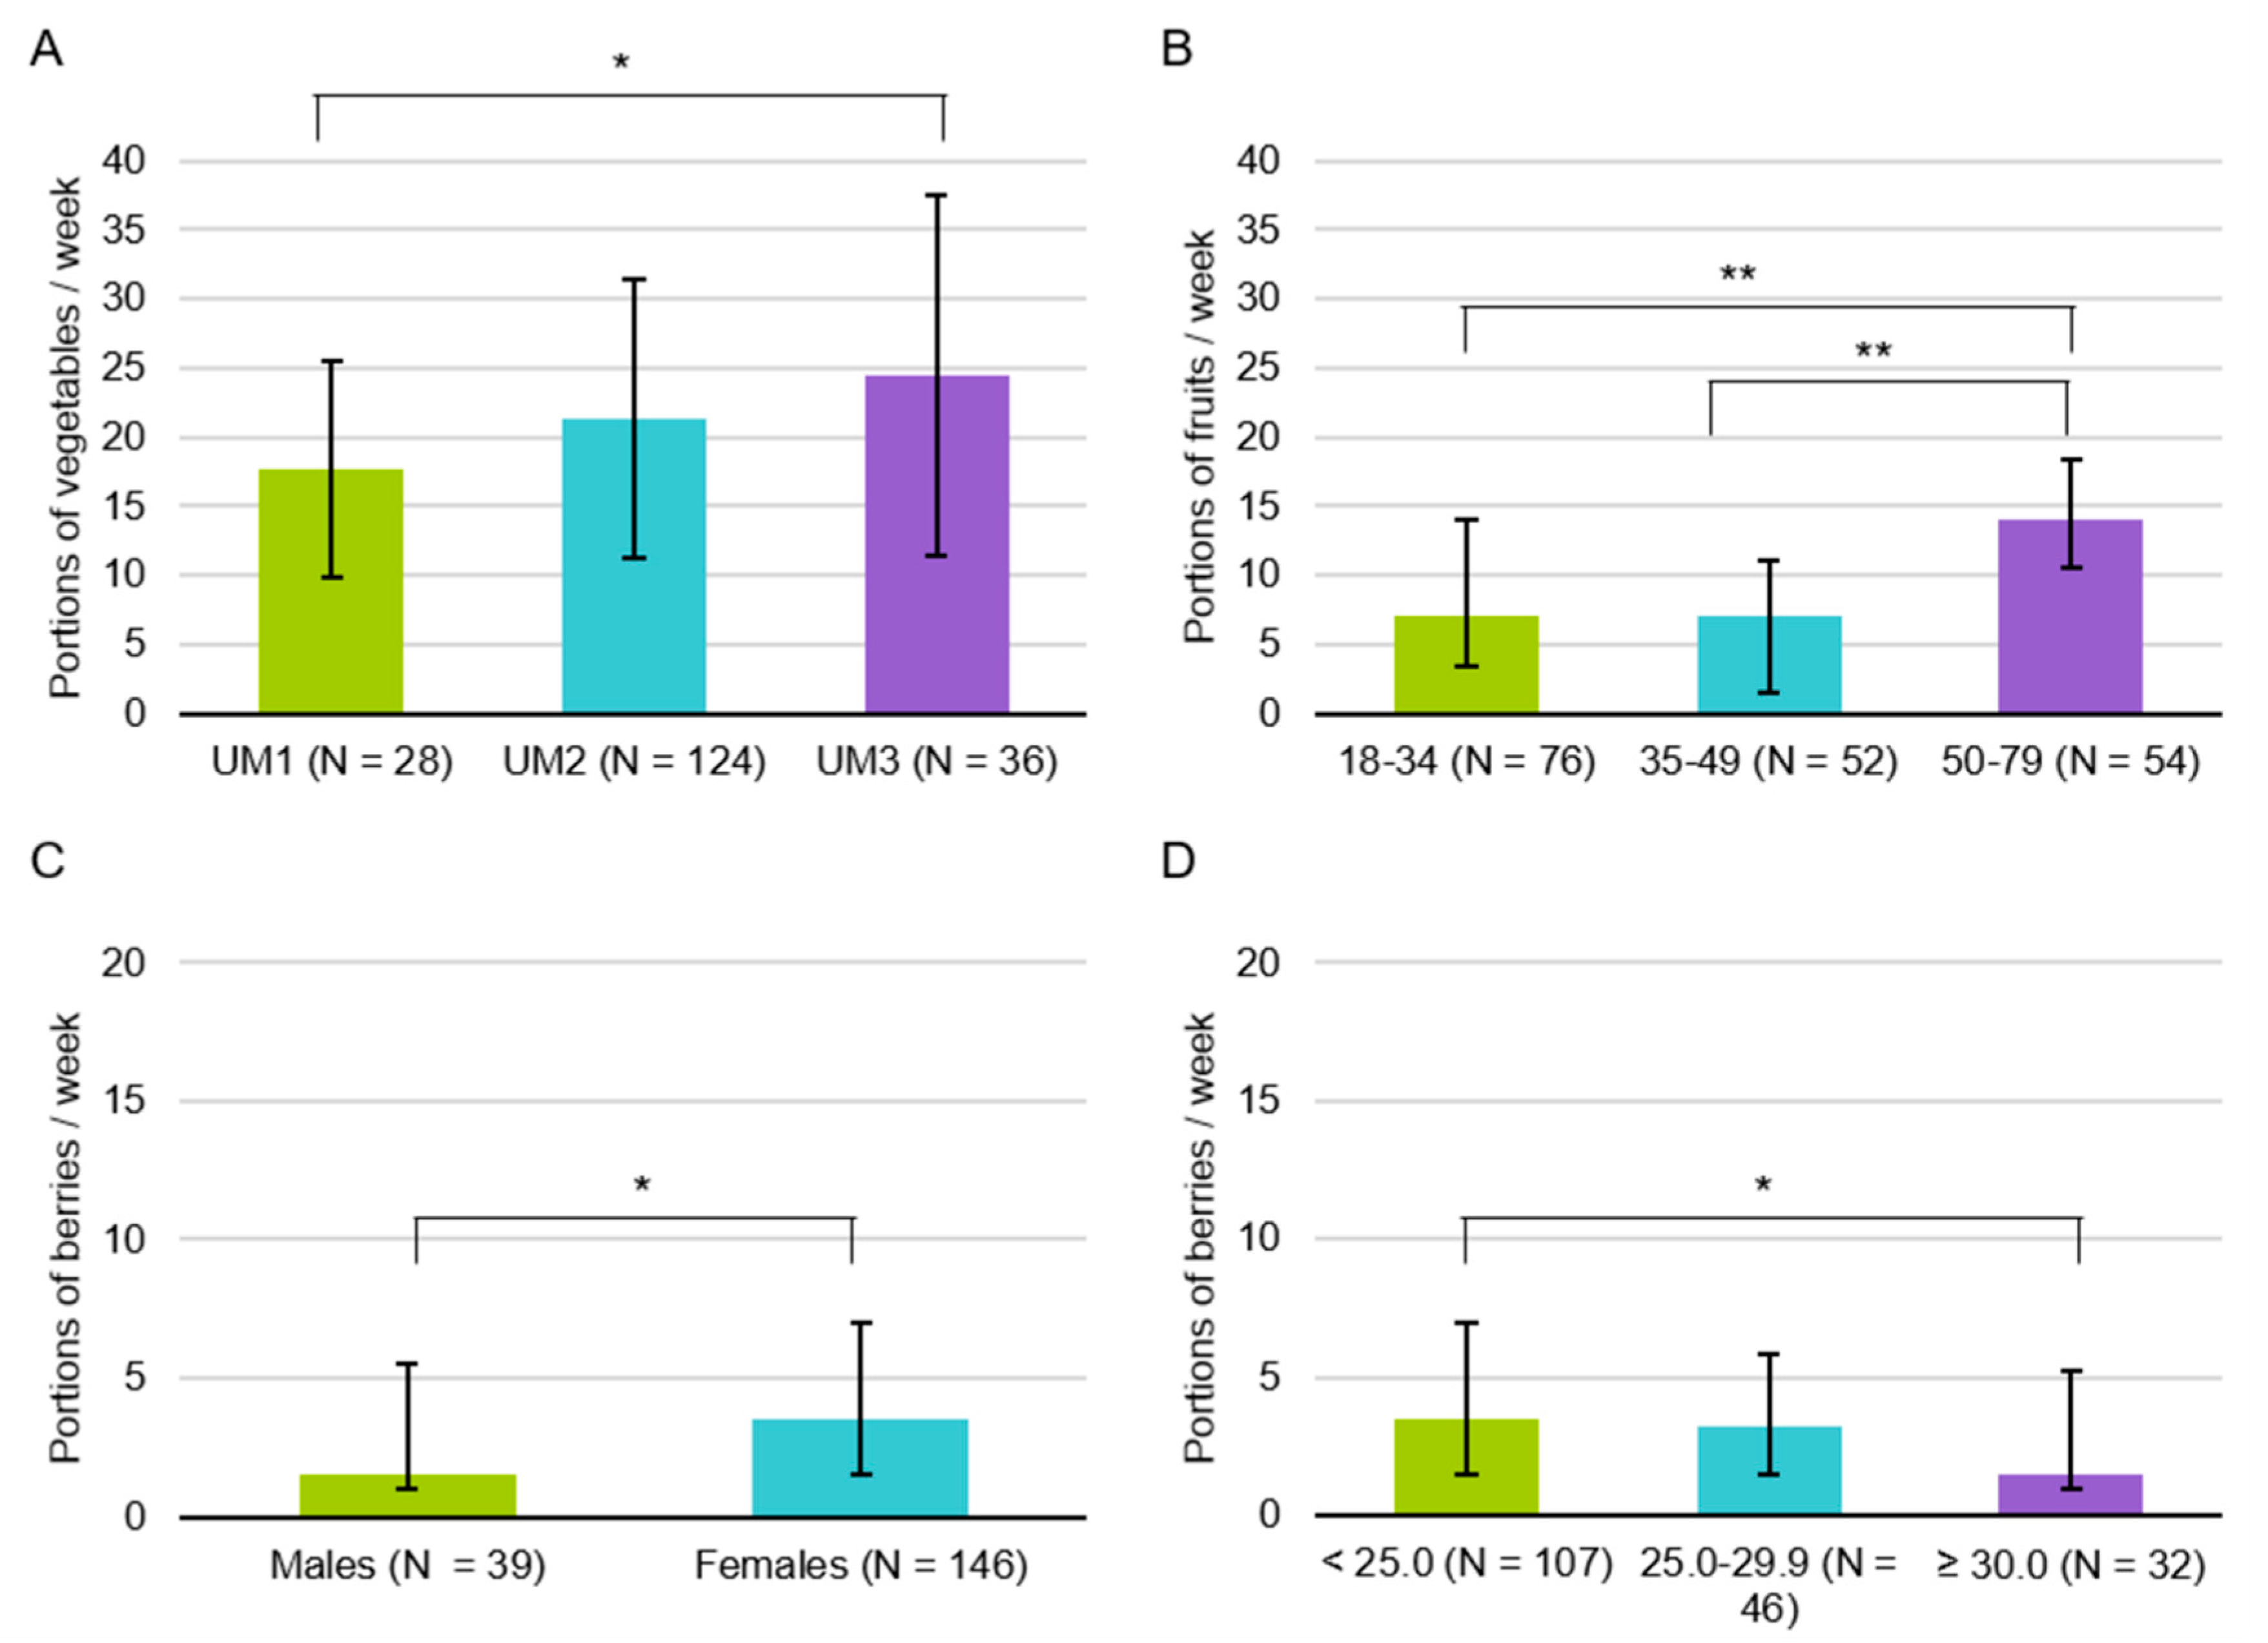
3.2. Portions of VFB per Week
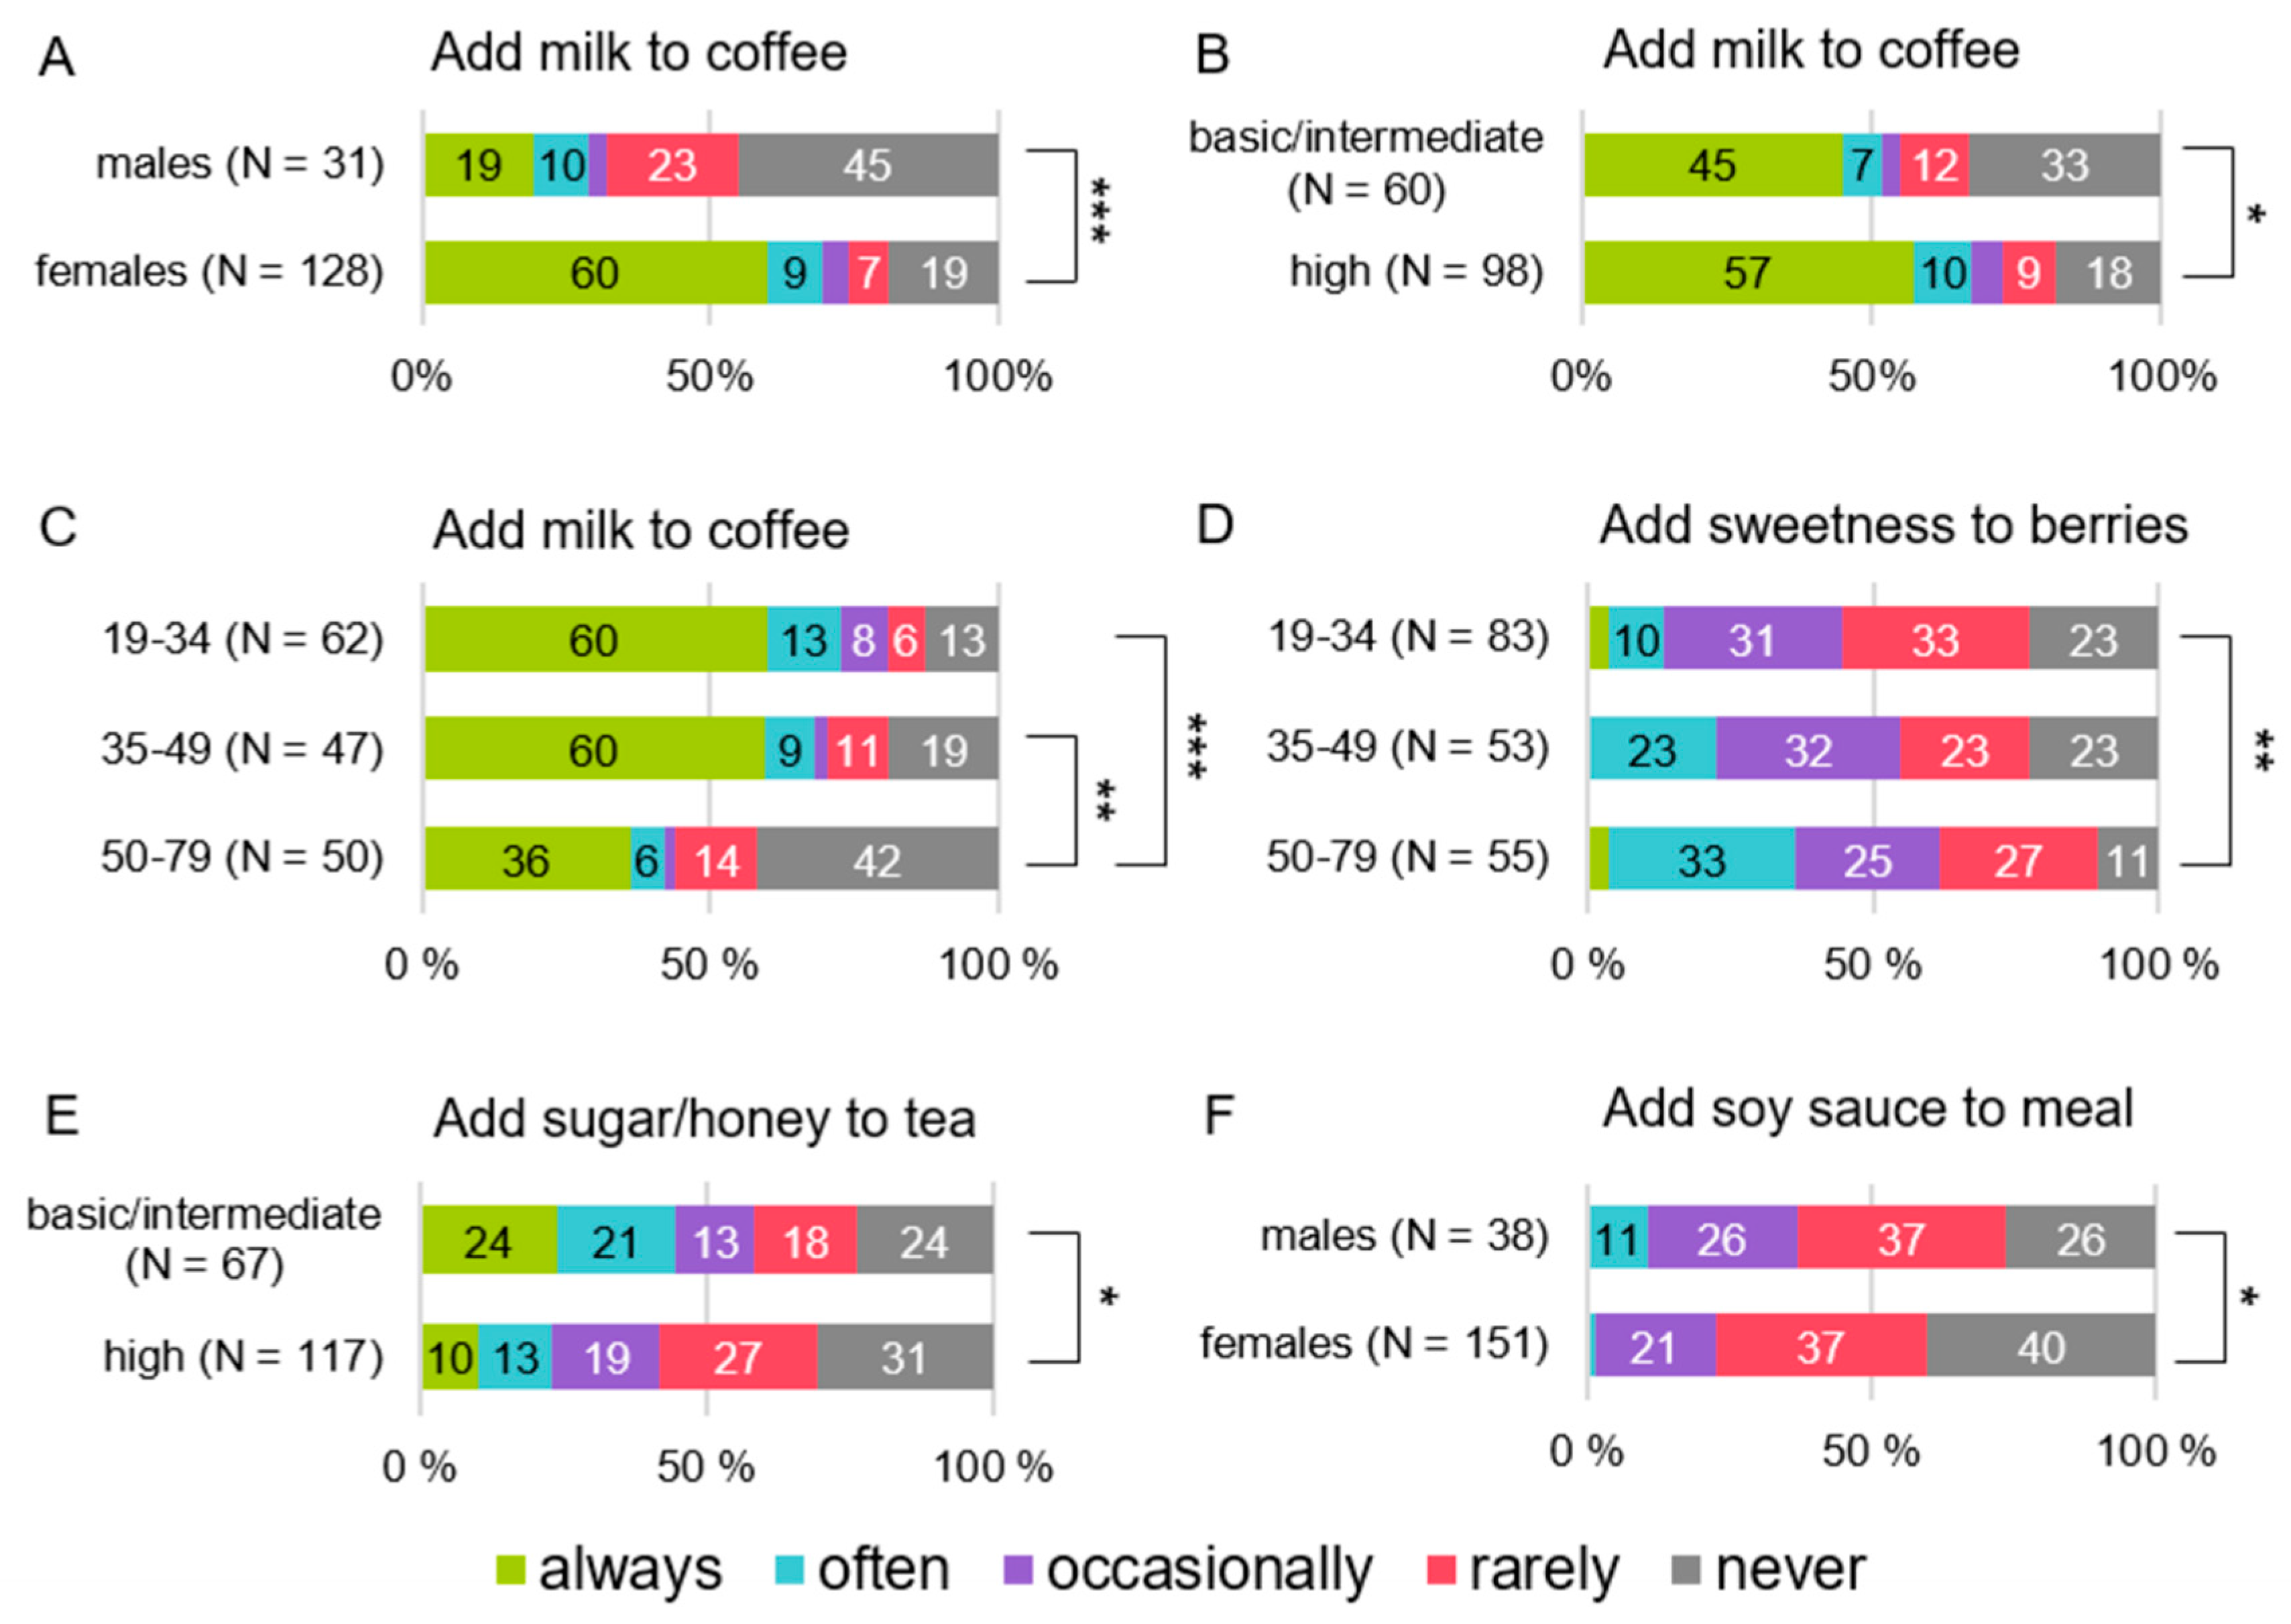
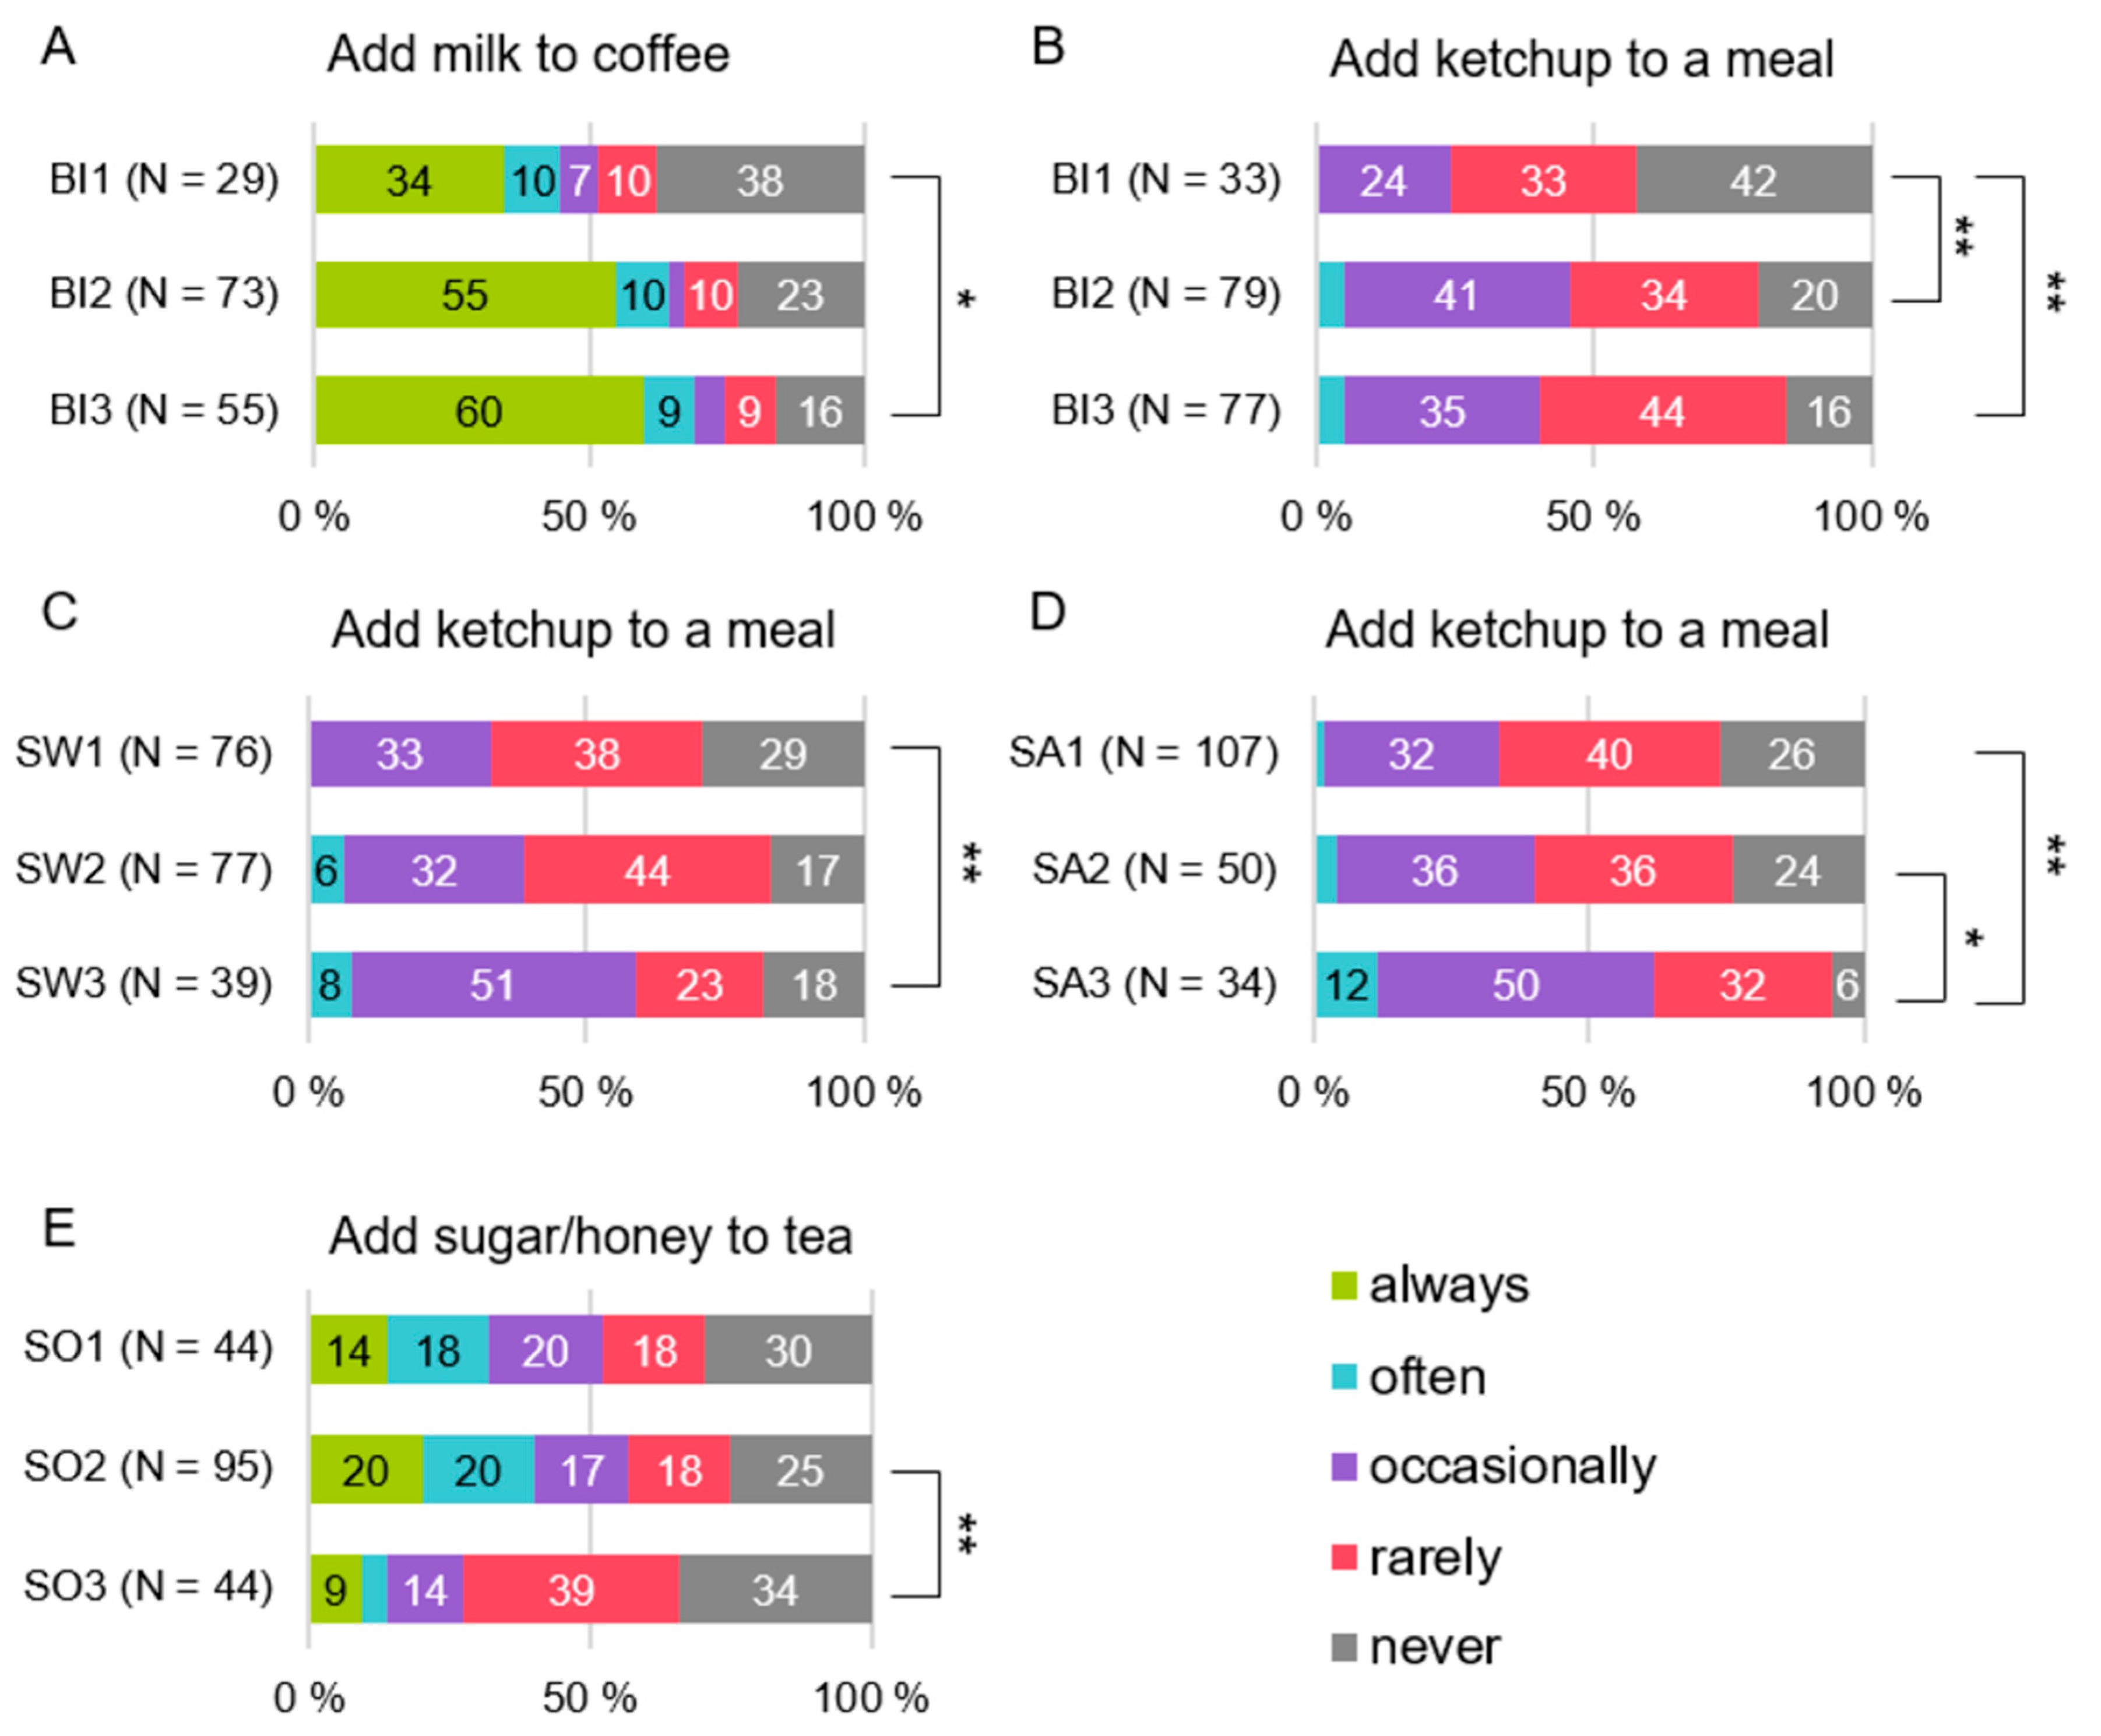
3.3. Masking and Modifying Taste
3.4. Factor Analysis of Recalled Pleasantness
3.5. Explaining Recalled Pleasantness
3.6. Use-Frequency
4. Discussion
4.1. Taste Sensitivity, Food Consumption, and Pleasantness
4.2. Background Factors, Food Consumption, and Pleasantness
4.3. Limitations
5. Conclusions
Supplementary Materials
Author Contributions
Funding
Acknowledgments
Conflicts of Interest
References
- Valsta, L.; Lundqvist, A.; Kaartinen, N.; Raulio, S.; Sääksjärvi, K.; Männistö, S. Ruokatottumukset. In Terveys, Toimintakyky ja Hyvinvointi Suomessa FinTerveys 2017-Tutkimus; Koponen, P., Borodulin, K., Lundqvist, A., Sääksjärvi, K., Koskinen, S., Eds.; THL: Helsinki, Finland, 2018; pp. 33–37. [Google Scholar]
- World Health Organization. Obesity and Overweight. Available online: https://www.who.int/news-room/fact-sheets/detail/obesity-and-overweight (accessed on 15 February 2019).
- Knaapila, A.; Hwang, L.-D.; Lysenko, A.; Duke, F.F.; Fesi, B.; Khoshnevisan, A.; James, R.S.; Wysocki, C.J.; Rhyu, M.; Tordoff, M.G.; et al. Genetic Analysis of Chemosensory Traits in Human Twins. Chem. Senses 2012, 107, 935–939. [Google Scholar] [CrossRef] [PubMed]
- Lugaz, O.; Pillias, A.-M.; Faurion, A. A New Specific Ageusia: Some Humans Cannot Taste L-Glutamate. Chem. Senses 2002, 27, 105–115. [Google Scholar] [CrossRef] [PubMed]
- Puputti, S.; Aisala, H.; Hoppu, U.; Sandell, M. Multidimensional measurement of individual differences in taste Perception. Food Qual. Prefer. 2018, 65, 10–17. [Google Scholar] [CrossRef]
- Webb, J.; Bolhuis, D.P.; Cicerale, S.; Hayes, J.E.; Keast, R. The Relationships Between Common Measurements of Taste Function. Chemosens. Percept. 2015, 8, 11–18. [Google Scholar] [CrossRef] [PubMed] [Green Version]
- Jayasinghe, S.N.; Kruger, R.; Walsh, D.C.I.; Cao, G.; Rivers, S.; Richter, M.; Breier, B.H. Is Sweet Taste Perception Associated with Sweet Food Liking and Intake? Nutrients 2017, 9, 750. [Google Scholar] [CrossRef] [PubMed]
- Low, J.Y.; Lacy, K.E.; McBride, R.; Keast, R.S.J. The Association between Sweet Taste Function, Anthropometry, and Dietary Intake in Adults. Nutrients 2016, 8, 241. [Google Scholar] [CrossRef]
- Bartoshuk, L.M. Comparing Sensory Experiences Across Individuals: Recent Psychophysical Advances Illuminate Genetic Variation in Taste Perception. Chem. Senses 2000, 25, 447–460. [Google Scholar] [CrossRef]
- Bajec, M.R.; Pickering, G.J. Thermal taste, PROP responsiveness, and perception of oral sensations. Physiol. Behav. 2008, 95, 581–590. [Google Scholar] [CrossRef]
- Fischer, M.E.; Cruickshanks, K.J.; Pankow, J.S.; Pankratz, N.; Schubert, C.R.; Huang, G.-H.; Klein, B.E.K.; Klein, R.; Pinto, A. The associations between 6-n-propylthiouracil (PROP) intensity and taste intensities differ by TAS2R38 haplotype. Lifestyle Genom. 2014, 7, 143–152. [Google Scholar] [CrossRef]
- Dinnella, C.; Monteleone, E.; Piochi, M.; Spinelli, S.; Prescott, J.; Pierguidi, L.; Gasperi, F.; Laureati, M.; Pagliarini, E.; Predieri, S.; et al. Individual Variation in PROP Status, Fungiform Papillae Density, and Responsiveness to Taste Stimuli in a Large Population Sample. Chem. Senses 2018, 43, 697–710. [Google Scholar] [CrossRef]
- Hayes, J.E.; Bartoshuk, L.M.; Kidd, J.R.; Duffy, V.B. Supertasting and PROP Bitterness Depends on More Than the TAS2R38 Gene. Chem. Senses 2008, 33, 255–265. [Google Scholar] [CrossRef] [PubMed] [Green Version]
- Lim, J.; Urban, L.; Green, B.G. Measures of Individual Differences in Taste and Creaminess Perception. Chem. Senses 2008, 33, 493–501. [Google Scholar] [CrossRef] [PubMed] [Green Version]
- Keskitalo, K.; Tuorila, H.; Spector, T.D.; Cherkas, L.F.; Knaapila, A.; Silventoinen, K.; Perola, M. Same genetic components underlie different measures of sweet taste preference. Am. J. Clin. Nutr. 2007, 86, 1663–1669. [Google Scholar] [CrossRef] [PubMed]
- Cicerale, S.; Riddell, L.J.; Keast, R.S.J. The Association between Perceived Sweetness Intensity and Dietary Intake in Young Adults. J. Food Sci. 2012, 77, H31–H35. [Google Scholar] [CrossRef] [PubMed]
- Lipchock, S.V.; Spielman, A.I.; Mennella, J.A.; Mansfield, C.J.; Hwang, L.-D.; Douglas, J.E.; Reed, D.R. Caffeine Bitterness is Related to Daily Caffeine Intake and Bitter Receptor mRNA Abundance in Human Taste Tissue. Perception 2017, 46, 245–256. [Google Scholar] [CrossRef] [PubMed]
- Duffy, V.B.; Peterson, J.M.; Bartoshuk, L.M. Associations between taste genetics, oral sensation and alcohol intake. Physiol. Behav. 2004, 82, 435–445. [Google Scholar] [CrossRef] [PubMed]
- Catanzaro, D.; Chesbro, E.C.; Velkey, A.J. Relationship between food preferences and PROP taster status of college students. Appetite 2013, 68, 124–131. [Google Scholar] [CrossRef] [PubMed]
- Dinehart, M.E.E.; Hayes, J.E.E.; Bartoshuk, L.M.M.; Lanier, S.L.L.; Duffy, V.B.B. Bitter taste markers explain variability in vegetable sweetness, bitterness, and intake. Physiol. Behav. 2006, 87, 304–313. [Google Scholar] [CrossRef] [PubMed]
- Duffy, V.B.; Hayes, J.E.; Davidson, A.C.; Kidd, J.R.; Kidd, K.K.; Bartoshuk, L.M. Vegetable Intake in College-Aged Adults Is Explained by Oral Sensory Phenotypes and TAS2R38 Genotype. Chemosens. Percept. 2010, 3, 137–148. [Google Scholar] [CrossRef] [Green Version]
- Kaminski, L.C.; Henderson, S.A.; Drewnowski, A. Young women’s food preferences and taste responsiveness to 6-n-propylthiouracil (PROP). Physiol. Behav. 2000, 68, 691–697. [Google Scholar] [CrossRef]
- Tepper, B.J. Nutritional Implications of Genetic Taste Variation: The Role of PROP Sensitivity and Other Taste Phenotypes. Annu. Rev. Nutr. 2008, 28, 367–388. [Google Scholar] [CrossRef] [PubMed]
- Sandell, M.; Hoppu, U.; Lundén, S.; Salminen, M.; Puolimatka, T.; Laaksonen, O.; Laitinen, K.; Hopia, A. Consumption of lingonberries by TAS2R38 genotype and sensory quality of texture-designed lingonberry samples. Food Qual. Prefer. 2015, 45, 166–170. [Google Scholar] [CrossRef]
- Hoppu, U.; Laitinen, K.; Jaakkola, J.; Sandell, M. The hTAS2R38 genotype is associated with sugar and candy consumption in preschool boys. J. Hum. Nutr. Diet. 2015, 28, 45–51. [Google Scholar] [CrossRef] [PubMed]
- Sandell, M.; Hoppu, U.; Mikkilä, V.; Mononen, N.; Kähönen, M.; Männistö, S.; Rönnemaa, T.; Viikari, J.; Lehtimäki, T.; Raitakari, O.T. Genetic variation in the hTAS2R38 taste receptor and food consumption among Finnish adults. Genes Nutr. 2014, 9, 433–440. [Google Scholar] [CrossRef] [PubMed]
- Hayes, J.E.; Feeney, E.L.; Allen, A.L. Do polymorphisms in chemosensory genes matter for human ingestive behavior? Food Qual. Prefer. 2013, 30, 202–216. [Google Scholar] [CrossRef] [PubMed] [Green Version]
- Hoppu, U.; Puputti, S.; Aisala, H.; Laaksonen, O.; Sandell, M.; Hoppu, U.; Puputti, S.; Aisala, H.; Laaksonen, O.; Sandell, M. Individual Differences in the Perception of Color Solutions. Foods 2018, 7, 154. [Google Scholar] [CrossRef]
- Puputti, S.; Aisala, H.; Hoppu, U.; Sandell, M. Factors explaining individual differences in taste sensitivity and taste modality recognition among Finnish adults. J. Sens. Stud. 2019. [Google Scholar] [CrossRef]
- Spinelli, S.; De Toffoli, A.; Dinnella, C.; Laureati, M.; Pagliarini, E.; Bendini, A.; Braghieri, A.; Gallina Toschi, T.; Sinesio, F.; Torri, L.; et al. Personality traits and gender influence liking and choice of food pungency. Food Qual. Prefer. 2018, 66, 113–126. [Google Scholar] [CrossRef]
- Törnwall, O.; Silventoinen, K.; Kaprio, J.; Tuorila, H. Why do some like it hot? Genetic and environmental contributions to the pleasantness of oral pungency. Physiol. Behav. 2012, 107, 381–389. [Google Scholar] [CrossRef]
- Masi, C.; Dinnella, C.; Monteleone, E.; Prescott, J. The impact of individual variations in taste sensitivity on coffee perceptions and preferences. Physiol. Behav. 2015, 138, 219–226. [Google Scholar] [CrossRef]
- Martin, C.; Visalli, M.; Lange, C.; Schlich, P.; Issanchou, S. Creation of a food taste database using an in-home “taste” profile method. Food Qual. Prefer. 2014, 36, 70–80. [Google Scholar] [CrossRef]
- van Stokkom, V.L.; Teo, P.S.; Mars, M.; de Graaf, C.; van Kooten, O.; Stieger, M. Taste intensities of ten vegetables commonly consumed in the Netherlands. Food Res. Int. 2016, 87, 34–41. [Google Scholar] [CrossRef] [PubMed] [Green Version]
- Ly, A.; Drewnowski, A. PROP (6-n-Propylthiouracil) Tasting and Sensory Responses to Caffeine, Sucrose, Neohesperidin Dihydrochalcone and Chocolate. Chem. Senses 2001, 26, 41–47. [Google Scholar] [CrossRef] [PubMed]
- Low, J.Y.Q.; Lacy, K.E.; McBride, R.L.; Keast, R.S.J. The Associations Between Oral Complex Carbohydrate Sensitivity, BMI, Liking, and Consumption of Complex Carbohydrate Based Foods. J. Food Sci. 2018, 83, 2227–2236. [Google Scholar] [CrossRef] [PubMed]
- Wise, P.M.; Nattress, L.; Flammer, L.J.; Beauchamp, G.K. Reduced dietary intake of simple sugars alters perceived sweet taste intensity but not perceived pleasantness. Am. J. Clin. Nutr. 2016, 103, 50–60. [Google Scholar] [CrossRef] [PubMed]
- Bertino, M.; Beauchamp, G.K.; Engelman, K. Increasing Dietary Salt Alters Salt Taste Preference. Physiol. Behav. 1986, 38, 203–213. [Google Scholar] [CrossRef]
- Bolhuis, D.P.; Gijsbers, L.; De Jager, I.; Geleijnse, J.M.; De Graaf, K. Encapsulated sodium supplementation of 4 weeks does not alter salt taste preferences in a controlled low sodium and low potassium diet. Food Qual. Prefer. 2015, 46, 58–65. [Google Scholar] [CrossRef]
- Noel, C.A.; Finlayson, G.; Dando, R. Prolonged Exposure to Monosodium Glutamate in Healthy Young Adults Decreases Perceived Umami Taste and Diminishes Appetite for Savory Foods. J. Nutr. 2018, 148, 980–988. [Google Scholar] [CrossRef] [Green Version]
- Törnwall, O.; Silventoinen, K.; Hiekkalinna, T.; Perola, M.; Tuorila, H.; Kaprio, J. Identifying flavor preference subgroups. Genetic basis and related eating behavior traits. Appetite 2014, 75, 1–10. [Google Scholar] [CrossRef]
- Ludy, M.-J.; Mattes, R.D. Comparison of sensory, physiological, personality, and cultural attributes in regular spicy food users and non-users. Appetite 2012, 58, 19–27. [Google Scholar] [CrossRef]
- Tuorila, H.; Keskitalo-Vuokko, K.; Perola, M.; Spector, T.; Kaprio, J. Affective responses to sweet products and sweet solution in British and Finnish adults. Food Qual. Prefer. 2017, 62, 128–136. [Google Scholar] [CrossRef] [Green Version]
- Laaksonen, O.; Knaapila, A.; Niva, T.; Deegan, K.C.; Sandell, M. Sensory properties and consumer characteristics contributing to liking of berries. Food Qual. Prefer. 2016, 53, 117–126. [Google Scholar] [CrossRef]
- Guido, D.; Perna, S.; Carrai, M.; Barale, R.; Grassi, M.; Rondanelli, M.; Perna, S. Multidimensional evaluation of endogenous and health factors affecting food preferences, taste and smell Perception. J. Nutr. Health Aging 2016, 20, 971–981. [Google Scholar] [CrossRef] [PubMed]
- Cox, D.N.; Van Galen, M.; Hedderley, D.; Perry, L.; Moore, P.B.; Mela, D.J. Sensory and hedonic judgments of common foods by lean consumers and consumers with obesity. Obes. Res. 1998, 6, 438–447. [Google Scholar] [CrossRef] [PubMed]
- Giskes, K.; Avendaňo, M.; Brug, J.; Kunst, A.E. A systematic review of studies on socioeconomic inequalities in dietary intakes associated with weight gain and overweight/obesity conducted among European adults. Obes. Rev. 2009, 11, 413–429. [Google Scholar] [CrossRef] [PubMed]
- Deglaire, A.; Méjean, C.; Castetbon, K.; Kesse-Guyot, E.; Urbano, C.; Hercberg, S.; Schlich, P. Development of a questionnaire to assay recalled liking for salt, sweet and fat. Food Qual. Prefer. 2012, 23, 110–124. [Google Scholar] [CrossRef]
- Mojet, J.; Heidema, J.; Christ-Hazelhof, E. Taste perception with age: Generic or specific losses in supra-threshold intensities of five taste qualities? Chem. Senses 2003, 28, 397–413. [Google Scholar] [CrossRef]


| Taste | Prototypic Tastant | Sample A (mM) | Sample B (mM) | Sample C (mM) | Sample D (mM) |
|---|---|---|---|---|---|
| Sour | Citric acid 1 | 3.33 | 1.87 | 1.05 | 0.57 |
| Bitter | Caffeine 1 | 3.60 | 2.03 | 1.14 | 0.62 |
| Sweet | Sucrose 2 | 58.4 | 32.9 | 18.5 | 10.5 |
| Salty | Sodium chloride (NaCl) 1 | 34.2 | 19.2 | 10.8 | 5.99 |
| Umami | L-glutamic acid, monosodium salt (MSG) 1 | 10.7 | 6.01 | 3.38 | 1.87 |
| Variable | n | % | Data Missing (n) |
|---|---|---|---|
| Age | 199 | 0 | |
| 19–34 years | 86 | 43.2 | |
| 35–49 years | 56 | 28.1 | |
| 50–79 years | 57 | 28.6 | |
| Sex | 199 | 0 | |
| Female | 158 | 79.4 | |
| Male | 41 | 20.6 | |
| BMI | 192 | 7 | |
| <25.0 | 110 | 57.3 | |
| 25.0–29.9 | 49 | 24.6 | |
| ≥30.0 | 33 | 17.2 | |
| Education 1 | 196 | 3 | |
| Low | 73 | 37.2 | |
| High | 123 | 62.8 | |
| Sour sensitivity | 197 | 2 | |
| Least sensitive | 49 | 24.9 | |
| Semi-sensitive | 101 | 51.3 | |
| Most sensitive | 47 | 23.9 | |
| Bitter sensitivity | 196 | 3 | |
| Least sensitive | 35 | 17.9 | |
| Semi-sensitive | 83 | 42.3 | |
| Most sensitive | 78 | 39.8 | |
| Sweet sensitivity | 199 | 0 | |
| Least sensitive | 80 | 40.2 | |
| Semi-sensitive | 79 | 39.7 | |
| Most sensitive | 40 | 20.1 | |
| Salty sensitivity | 198 | 1 | |
| Least sensitive | 112 | 56.6 | |
| Semi-sensitive | 51 | 25.8 | |
| Most sensitive | 35 | 17.7 | |
| Umami sensitivity | 198 | 1 | |
| Least sensitive | 29 | 14.6 | |
| Semi-sensitive | 132 | 66.7 | |
| Most sensitive | 37 | 18.7 |
| Add Milk to Coffee | Add Sugar/Honey to Tea | Add Salt to Vegetable Cooking Water | Add Salt to a Meal When Eating It | Add Ketchup to a Meal When Eating It | Add Soy Sauce to a Meal When Eating It | |
|---|---|---|---|---|---|---|
| always | 83 (52.2) | 29 (15.7) | 37 (19.5) | 6 (3.1) | 0 (0.0) | 0 (0.0) |
| often | 15 (9.4) | 29 (15.7) | 47 (24.7) | 24 (12.6) | 8 (4.2) | 6 (22.2) |
| occasionally | 7 (4.4) | 31 (16.8) | 40 (21.1) | 37 (19.4) | 70 (36.5) | 42 (22.2) |
| rarely | 16 (10.1) | 44 (23.8) | 29 (15.3) | 83 (43.5) | 72 (37.5) | 70 (37.0) |
| never | 38 (23.9) | 52 (28.1) | 37 (19.5) | 41 (21.5) | 42 (21.9) | 71 (37.6) |
| Total N | 159 | 185 | 190 | 191 | 192 | 189 |
| PC1 | PC2 | PC3 | |
|---|---|---|---|
| Vegetables and pungent items (N = 154) | |||
| Bitter vegetables (6.46 [2.12]) | |||
| Red beet | 0.725 | ||
| Swedish turnip | 0.714 | ||
| Brussels sprout | 0.710 | ||
| Carrot | 0.530 | ||
| Radish | 0.509 | 0.401 | |
| Strong-tasting vegetables (6.37 [2.46]) | |||
| Onion | 0.765 | ||
| Rucola | 0.684 | ||
| Olive | 0.658 | ||
| Celery | 0.652 | ||
| Pungent foods (5.92 [2.37]) | |||
| Chili sauce | 0.928 | ||
| Chili | 0.842 | ||
| Wasabi | 0.715 | ||
| Mustard | 0.448 | ||
| Variance explained (%) | 28.9 | 12.8 | 7.7 |
| Berries and fruits (N = 186) | |||
| Berries (7.20 [1.97]) | |||
| Lingonberry | 0.833 | ||
| Red currant | 0.817 | ||
| Black currant | 0.754 | ||
| Sea buckthorn berry | 0.658 | ||
| Bilberry | 0.499 | ||
| Fruits (6.73 [2.04]) | |||
| Avocado | 0.806 | ||
| Lemon | 0.764 | ||
| Rhubarb | 0.638 | ||
| Grapefruit | 0.432 | 0.475 | |
| Variance explained (%) | 33.7 | 10.4 | |
| Sweet, salty, and fatty (N = 177) | |||
| Salty-and-fatty foods (6.67 [1.99]) | |||
| French fries | 0.824 | ||
| Potato chips | 0.769 | ||
| Mayonnaise | 0.709 | ||
| Sweet-and-fatty foods (7.67 [1.66]) | |||
| Ice cream | 0.800 | ||
| Sweet pastry | 0.723 | ||
| Milk chocolate | 0.642 | ||
| Candy | 0.547 | ||
| Salty-and-savory foods (6.68 [2.52]) | |||
| Blue cheese | 0.821 | ||
| Dry-cured salmon | 0.744 | ||
| Soy sauce | 0.479 | ||
| Variance explained (%) | 24.0 | 15.0 | 11.1 |
| Beverages (N = 170) | |||
| Bitter-and-astringent alcohol (5.84 [2.52]) | |||
| White wine | 0.757 | ||
| Dry cider | 0.716 | ||
| Red wine | 0.699 | 0.409 | |
| Long drink | 0.656 | 0.438 | |
| Strong alcohol | 0.610 | ||
| Beer | 0.548 | 0.539 | |
| Bitter-and-astringent non-alcoholic (7.04 [2.22]) | |||
| Carbonated water | 0.782 | ||
| Tea | 0.668 | ||
| Coffee | 0.555 | ||
| Sweet beverages (4.81 [2.41]) | |||
| Soft drink | 0.828 | ||
| Light soft drink | 0.754 | ||
| Sweet cider | 0.538 | ||
| Variance explained (%) | 29.9 | 17.6 | 10.9 |
| Pleasantness Component 1 | Sex 2 | Age 3 | BMI 3 | Model Statistics |
|---|---|---|---|---|
| Bitter vegetables (N = 149) | −0.417 * (−0.802, −0.032) | 0.149 (−0.050, 0.347) | −0.210 * (−0.418, −0.003) | Fdf = 3, 145 = 3.39, p = 0.020, R2 = 0.066 |
| Strong-tasting vegetables (N = 149) | 0.208 (−0.179, 0.595) | 0.395 *** (0.201, 0.588) | Fdf = 2, 146 = 8.47, p < 0.001, R2 = 0.104 | |
| Pungent foods (N = 149) | 0.596 ** (0.202, 0.990) | 0.082 (−0.115, 0.279) | Fdf = 2, 146 = 4.67, p = 0.011, R2 = 0.060 | |
| Berries (N = 180) | −0.004 (−0.367, 0.359) | 0.330 *** (0.157, 0.502) | Fdf = 2, 177 = 7.16, p = 0.001, R2 = 0.075 | |
| Fruits (N = 180) | −0.005 (−0.366, 0.356) | 0.075 (−0.104, 0.253) | −0.254 * (−0.446, −0.062) | Fdf = 3, 176 = 2.28, p = 0.081, R2 = 0.037 |
| Salty-and-fatty foods (N = 174) | −0.167 (−0.525, 0.191) | −0.277 ** (−0.456, −0.098) | Fdf = 2, 171 = 4.90, p = 0.009, R2 = 0.054 | |
| Sweet-and-fatty foods (N = 174) | 0.450 * (0.086, 0.815) | −0.021 (−0.203, 0.161) | Fdf = 2, 171 = 3.05, p = 0.050, R2 = 0.034 | |
| Salty-and-savory foods (N = 174) | 0.116 (−0.237, 0.470) | 0.235 ** (0.059, 0.412) | Fdf = 2, 171 = 3.57, p = 0.030, R2 = 0.040 | |
| Bitter-and-astringent alcoholic (N = 165) | −0.604 ** (−0.961, −0.248) | 0.078 (−0.100, 0.255) | Fdf = 2, 162 = 6.21, p = 0.003, R2 = 0.071 | |
| Bitter-and-astringent non-alcoholic (N = 165) | −0.266 (−0.620, 0.088) | 0.227 *(0.051, 0.404) | Fdf = 2, 162 = 4.65, p = 0.011, R2 = 0.054 | |
| Sweet beverages (N = 165) | −0.187 (−0.546, 0.172) | −0.379 *** (−0.564, −0.194) | 0.291 ** (0.094, 0.489) | Fdf = 3, 161 = 6.92, p < 0.001, R2 = 0.114 |
| Descriptives | Correlation | ||||||
|---|---|---|---|---|---|---|---|
| Use-Frequency Variable | N | Mean 1 | SD | Cronbach’s α | N | Correlation with Pleasantness | Sig. (2-tailed) of Correlation |
| Bitter vegetables | 191 | 2.86 | 0.60 | 0.653 | 154 | 0.238 | 0.003 |
| Strong-tasting vegetables | 190 | 3.33 | 0.83 | 0.619 | 153 | 0.389 | <0.001 |
| Pungent items | 187 | 2.75 | 0.90 | 0.727 | 153 | 0.065 | 0.426 |
| Berries | 190 | 3.03 | 0.84 | 0.722 | 184 | 0.604 | <0.001 |
| Fruits | 189 | 2.69 | 0.72 | 0.571 | 183 | 0.602 | <0.001 |
| Salty-and-fatty foods | 191 | 2.64 | 0.74 | 0.668 | 176 | 0.572 | <0.001 |
| Sweet-and-fatty foods | 190 | 3.49 | 0.69 | 0.505 | 175 | 0.493 | <0.001 |
| Salty-and-savory foods | 190 | 2.76 | 0.81 | 0.444 | 175 | 0.672 | <0.001 |
| Bitter-and-astringent alcoholic | 191 | 2.21 | 0.74 | 0.785 | 170 | 0.726 | <0.001 |
| Bitter-and-astringent non-alcoholic | 192 | 4.29 | 1.07 | 0.232 | 170 | 0.704 | <0.001 |
| Sweet beverages | 190 | 2.02 | 0.71 | 0.355 | 168 | 0.634 | <0.001 |
| Use-Frequency Component 1 | Sex 2 | Age 3 | BMI 3 | Pleasantness | Bitter Sensitivity 3 | Sour Sensitivity 3 | Umami Sensitivity 3 | Model Statistics |
|---|---|---|---|---|---|---|---|---|
| Bitter vegetables (N = 149) | 0.176 (−0.059, 0.411) | 0.190 ** (0.074, 0.306) | 0.176 *** (0.079, 0.274) | F (3, 145) = 8.59, p < 0.001, R2 = 0.151 | ||||
| Pungent foods (N = 148) | −0.343 * (−0.683, −0.004) | 0.067 (−0.111, 0.246) | −0.259 * (−0.466, −0.052) | F (3, 144) = 4.45, p = 0.005, R2 = 0.085 | ||||
| Berries (N = 178) | 0.048 (−0.205, 0.301) | 0.131 * (0.001, 0.262) | −0.207 ** (−0.342, −0.071) | 0.489 *** (0.386, 0.592) | F (4, 173) = 28.3, p < 0.001, R2 = 0.396 | |||
| Fruits (N = 177) | −0.075 (−0.292, 0.142) | 0.042 (−0.065, 0.149) | −0.182 ** (−0.298, −0.065) | 0.415 *** (0.326, 0.504) | F (4, 172) = 27.0, p < 0.001, R2 = 0.386 | |||
| Salty-and-savory foods (N = 172) | −0.266 * (−0.484, −0.048) | 0.036 (−0.079, 0.151) | 0.535 *** (0.445, 0.625) | 0.196 ** (0.059, 0.334) | −0.219 * (−0.392, −0.046) | F (5, 166) = 32.1, p < 0.001, R2 = 0.492 |
© 2019 by the authors. Licensee MDPI, Basel, Switzerland. This article is an open access article distributed under the terms and conditions of the Creative Commons Attribution (CC BY) license (http://creativecommons.org/licenses/by/4.0/).
Share and Cite
Puputti, S.; Hoppu, U.; Sandell, M. Taste Sensitivity Is Associated with Food Consumption Behavior but not with Recalled Pleasantness. Foods 2019, 8, 444. https://doi.org/10.3390/foods8100444
Puputti S, Hoppu U, Sandell M. Taste Sensitivity Is Associated with Food Consumption Behavior but not with Recalled Pleasantness. Foods. 2019; 8(10):444. https://doi.org/10.3390/foods8100444
Chicago/Turabian StylePuputti, Sari, Ulla Hoppu, and Mari Sandell. 2019. "Taste Sensitivity Is Associated with Food Consumption Behavior but not with Recalled Pleasantness" Foods 8, no. 10: 444. https://doi.org/10.3390/foods8100444
APA StylePuputti, S., Hoppu, U., & Sandell, M. (2019). Taste Sensitivity Is Associated with Food Consumption Behavior but not with Recalled Pleasantness. Foods, 8(10), 444. https://doi.org/10.3390/foods8100444