Food Purchasing Behaviors of a Remote and Rural Adult Solomon Islander Population


Abstract
:1. Introduction
2. Materials and Methods
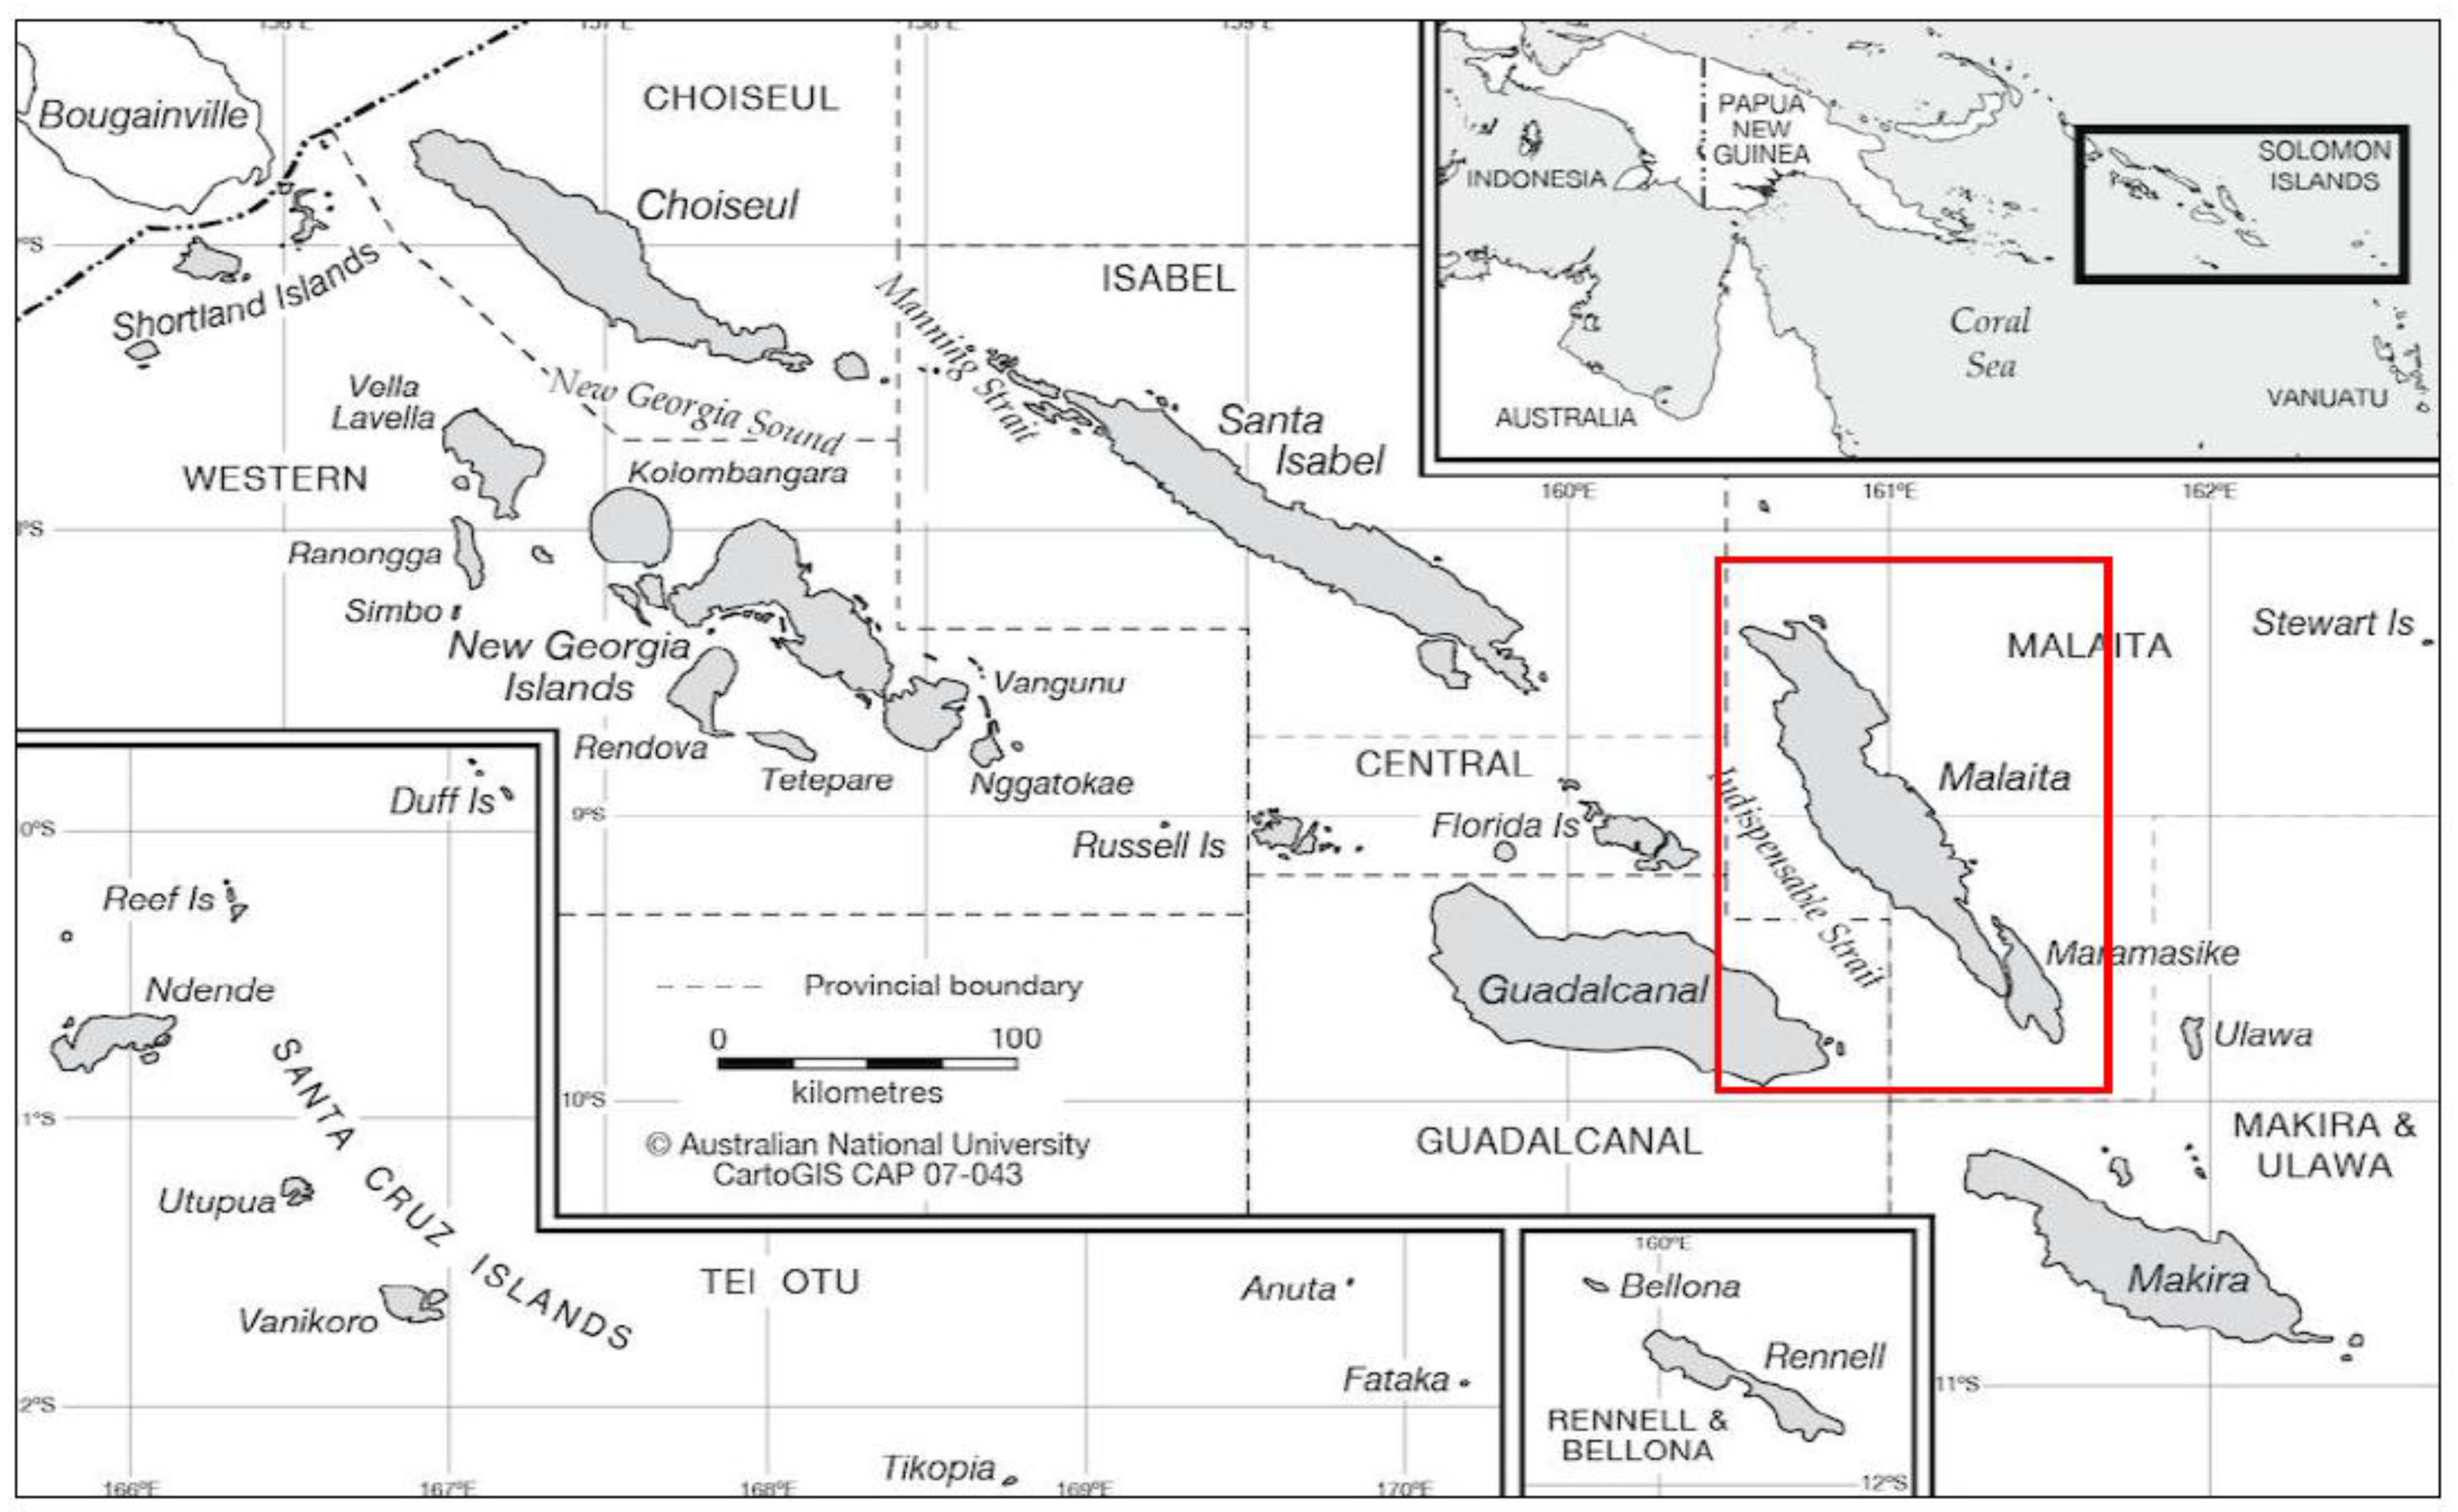
2.1. Study Design and Setting
2.2. Participants and Recruitment
2.3. Tools and Measures
2.4. Analysis
3. Results
3.1. Demographic Characteristics
3.2. Food Purchasing Behaviors
3.2.1. Sources of Food
3.2.2. Reported Food Expenditure
3.2.3. Number of Reported Food Shopping Experiences
3.2.4. Types of Foods Purchased in the Previous 24 Hours
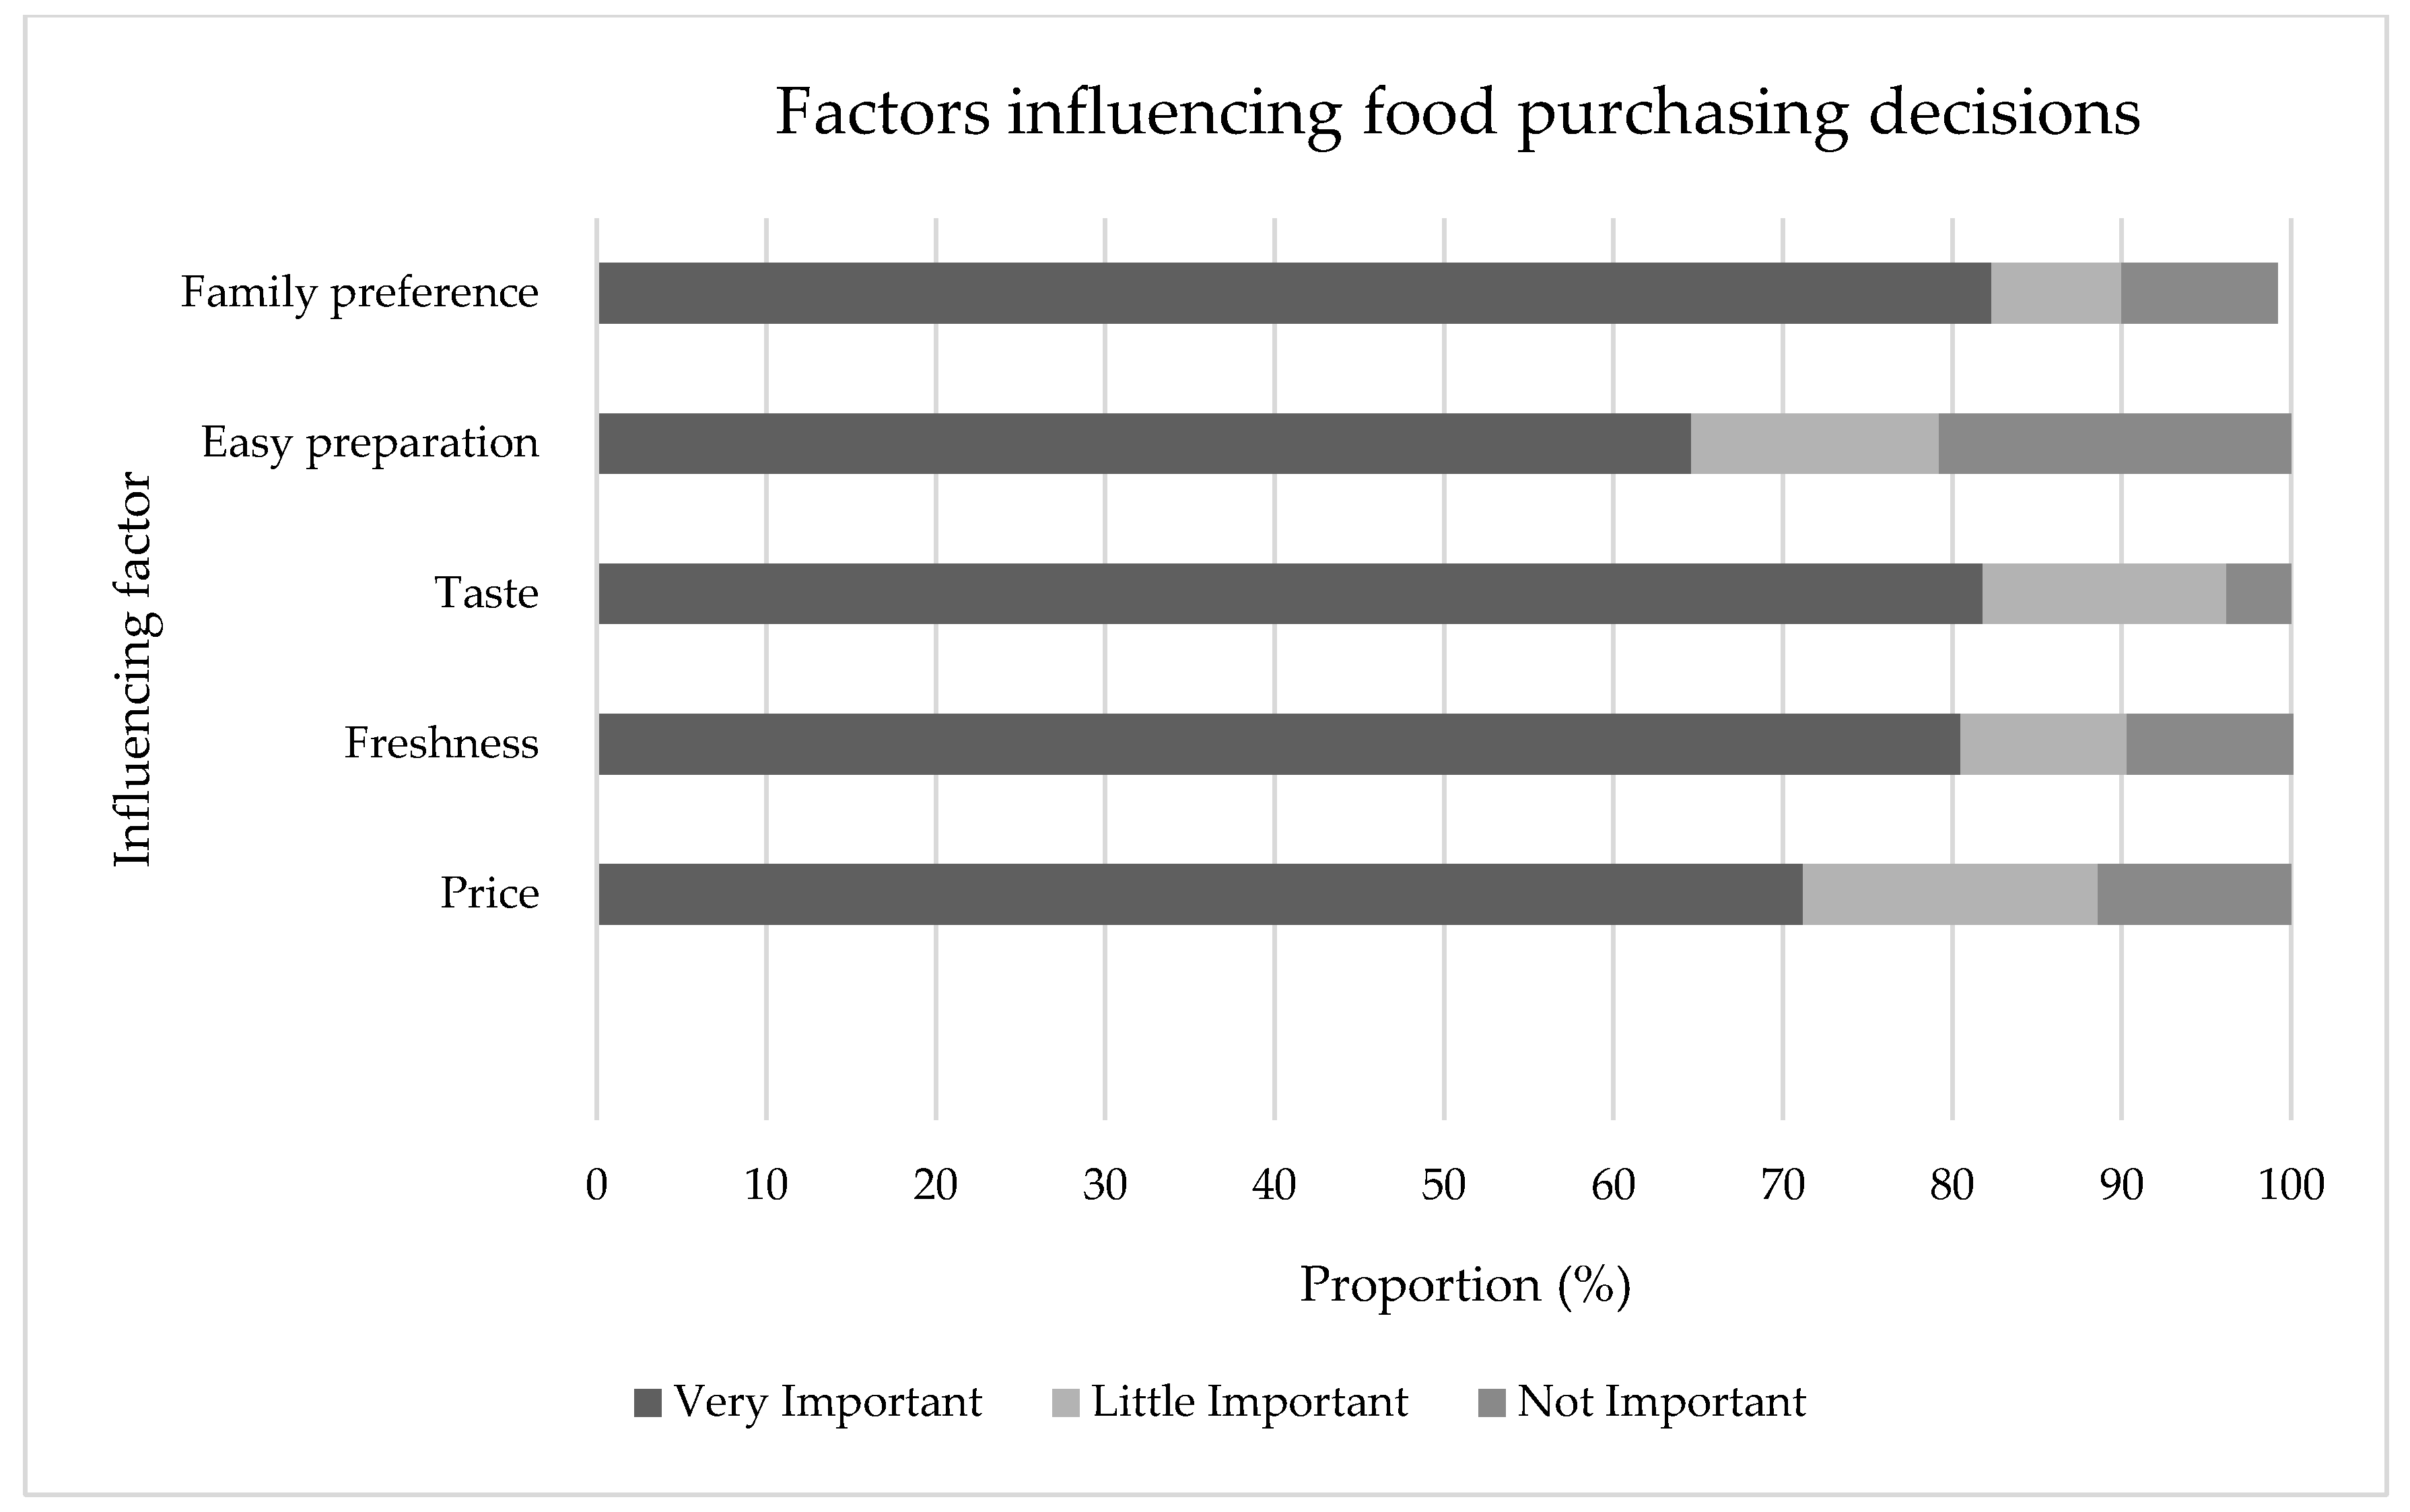
3.2.5. Influences on Food Purchasing Behaviors
4. Discussion
Limitations
5. Conclusions
Author Contributions
Funding
Acknowledgments
Conflicts of Interest
References
- World Health Organization. The Double Burden of Malnutrition: Policy Brief; WHO/NMH/NHD/17.3; World Health Organization: Geneva, Switzerland, 2017; pp. 1–12. [Google Scholar]
- Food and Agriculture Organization of the United Nations. Dynamic Development, Shifting Demographic, Changing Diets; Food and Agriculture Organization of the United Nations: Rome, Italy, 2018; pp. 1–157. [Google Scholar]
- Baker, P.; Friel, S. Food systems transformations, ultra-processed food markets and the nutrition transition in Asia. Glob. Health 2016, 12, 80. [Google Scholar] [CrossRef] [PubMed]
- Tsuchiya, C.; Tagini, S.; Cafa, D.; Nakazawa, M. Socio-environmental and behavioral risk factors associated with obesity in the capital (Honiara), the Solomon Islands case-control study. Obes. Med. 2017, 7, 34–42. [Google Scholar] [CrossRef]
- Matheson, D.; Park, K.; Soakai, T.S. Pacific island health inequities forecast to grow unless profound changes are made to health systems in the region. Aust. Health Rev. 2017, 41, 590–598. [Google Scholar] [CrossRef] [PubMed] [Green Version]
- Eme, P.E.; Burlingame, B.; Douwes, J.; Kim, N.; Foliaki, S. Quantitative estimates of dietary intake in households of South Tarawa, Kiribati. Asia Pac. J. Clin. Nutr. 2019, 28, 131–138. [Google Scholar] [CrossRef] [PubMed]
- Charlton, K.; Russell, J.; Gorman, E.; Hanich, Q.; Delisle, A.; Campbell, B.; Bell, J. Fish, food security and health in Pacific Island countries and territories: A systematic literature review. BMC Public Health 2016, 16. [Google Scholar] [CrossRef] [PubMed]
- Sahal Estimé, M.; Lutz, B.; Strobel, F. Trade as a structural driver of dietary risk factors for noncommunicable diseases in the Pacific: An analysis of household income and expenditure survey data. Glob. Health 2014, 10, 48. [Google Scholar] [CrossRef] [PubMed]
- Underhill, S.J.R.; Joshua, L.; Zhou, Y. A Preliminary Assessment of Horticultural Postharvest Market Loss in the Solomon Islands. Horticulturae 2019, 5, 5. [Google Scholar] [CrossRef]
- Dey, M.M.; Gosh, K.; Valmonte-Santos, R.; Rosegrant, M.W.; Chen, O.L. Economic impact of climate change and climate change adaptation strategies for fisheries sector in Solomon Islands: Implication for food security. Mar. Policy 2016, 67, 171–178. [Google Scholar] [CrossRef]
- Andersen, A.B.; Thilstead, S.H.; Schwarz, A.M. Food and Nutrition Security in Solomon Islands; CGIAR Research Program on Aquatic Agricultural Systems: Penang, Malaysia, 2013; pp. 1–16. [Google Scholar]
- Jones, C.S.; Schwarz, A.-M.; Sulu, R.; Tikai, P. Foods and Diets of Communities Involved in Inland Aquaculture in Malaita Province, Solomon Islands; AAs-2014-30; CGIAR Research Program on Aquatic Agricultural Systems: Penang, Malaysia, 2014. [Google Scholar]
- Thornton, L.; Pearce, J.; Ball, K. Sociodemographic factors associated with healthy eating and food security in socio-economically disadvantaged groups in the UK and Victoria, Australia. Public Health Nutr. 2014, 17, 20–30. [Google Scholar] [CrossRef]
- Miller, V.; Yusuf, S.; Chow, C.K.; Dehghan, M.; Corsi, D.J.; Lock, K.; Popkin, B.; Rangarajan, S.; Khatib, R.; Lear, S.A.; et al. Availability, affordability, and consumption of fruits and vegetables in 18 countries across income levels: Findings from the Prospective Urban Rural Epidemiology (PURE) study. Lancet Glob. Health 2016, 4, e695–e703. [Google Scholar] [CrossRef]
- D’Angelo, H.; Suratkar, S.; Song, H.-J.; Stauffer, E.; Gittelsohn, J. Access to food source and food source use are associated with healthy and unhealthy food-purchasing behaviors among low-income African-American adults in Baltimore City. Public Health Nutr. 2011, 14, 1632–1639. [Google Scholar] [CrossRef] [PubMed]
- Mader, E.; Busse, H. Hungry in the Heartland: Using Community Food Systems as a Strategy to Reduce Rural Food Deserts. J. Hunger Environ. Nutr. 2011, 6, 45–53. [Google Scholar] [CrossRef]
- Solomon, C.A.; Batada, A.; Zillante, A.; Kennedy, A.; Hudak, K.M.; Racine, E.F. Food cost is the least of my worries: A qualitative study exploring food and beverage purchasing decisions among parents enrolled in the WIC program. J. Hunger Environ. Nutr. 2018, 13, 497–506. [Google Scholar] [CrossRef]
- Sanlier, N.; Seren Karakus, S. Evaluation of food purchasing behavior of consumers from supermarkets. Br. Food J. 2010, 112, 140–150. [Google Scholar] [CrossRef]
- Stevens, B.; Watt, K.; Brimbecombe, J.; Clough, A.; Judd, J.; Lindsay, D. The role of seasonality on the diet and household food security of pregnant women living in rural Bangladesh: A cross-sectional study. Public Health Nutr. 2017, 20, 121–129. [Google Scholar] [CrossRef] [PubMed]
- Solomon Islands Government. Provincial Profile of the 2009 Population & Housing Census: Malaita; Housing, S.I.P., Ed.; Solomon Islands Government: Honiara, Solomon Islands, 2009.
- CartoGIS Services. Map of the Solomon Islands; College of Asia and the Pacific, The Australian National University: Canberra, Australia, 2018; p. Map of the Solomon Islands. [Google Scholar]
- Thornton, L.E.; Crawford, D.A.; Lamb, K.E.; Ball, K. Where do people purchase food? A novel approach to investigating food purchasing locations. Int. J. Health Geogr. 2017, 16. [Google Scholar] [CrossRef]
- Cleasby, N.; Schwarz, A.-M.; Phillips, M.; Paul, C.; Pant, J.; Oeta, J.; Pickering, T.; Meloty, A.; Laumani, M.; Kori, M. The socio-economic context for improving food security through land based aquaculture in Solomon Islands: A peri-urban case study. Mar. Policy 2014, 45, 89–97. [Google Scholar] [CrossRef]
- Kennedy, G.; Ballard, T.; Dop, M.C. Guidelines for Measuring Household and Individual Dietary Diversity; Food and Agricultural Organizatio of the United Nation: Rome, Italy, 2013. [Google Scholar]
- World Health Organization. Solomon Islands: WHO Statistical Profile; World Health Organisation: Geneva, Switzerland, 2015; Available online: https://www.who.int/gho/countries/slb/country_profiles/en/ (accessed on 25 March 2019).
- Solomon Islands Government. 2009 Population & Housing Census; Solomon Islands National Statistical Office, Ministry of Finance and Treasury: Honiara, Solomon Islands, 2009.
- Caspi, C.E.; Sorensen, G.; Subramanian, S.V.; Kawachi, I. The local food environment and diet: A systematic review. Health Place 2012, 18, 1172–1187. [Google Scholar] [CrossRef] [Green Version]
- Public Health Division of the Pacific Community. Pacific Guidelines for a Healthy Diet and Lifestyle-a Handbook for Health Professionals and Educators; Public Health Division of the Pacific Community: Noumea, New Caledonia, 2017. [Google Scholar]
- Bottcher, C.D.; Underhill, S.J.R.; Aliakbari, J.; Burkhart, S.J. Food access and availability in Auki, Solomon Islands. JHEN 2019. under review. [Google Scholar]
- Santos, J.; McKenzie, B.; Trieu, K.; Farnbach, S.; Johnson, C.; Schultz, J.; Thow, A.; Snowdon, W.; Bell, C.; Webster, J. Contribution of fat, sugar and salt to diets in the Pacific Islands: A systematic review. Public Health Nutr. 2019, 22, 1858–1871. [Google Scholar] [CrossRef]
- Glanz, K.; Basil, M.; Maibach, E.; Goldberg, J.; Snyder, D. Why Americans Eat What They Do: Taste, Nutrition, Cost, Convenience, and Weight Control Concerns as Influences on Food Consumption. J. Am. Diet. Assoc. 1998, 98, 1118–1126. [Google Scholar] [CrossRef]
- Drewnowski, A.; Rock, C.L. The influence of genetic taste markers on food acceptance. Am. J. Clin. Nutr. 1995, 62, 506–511. [Google Scholar] [CrossRef] [PubMed]
- Converter, X.C. Currency Conversion SBD to USD and EURO. Available online: https://www.xe.com/currencyconverter/convert/ (accessed on 16 September 2019).
- Horsey, B.; Swanepoel, E.; Underhill, S.J.R.; Burkhart, S.J. Dietary Diversity of an adult Solomon Islands Population. Nutrients 2019, 11, 1622. [Google Scholar] [CrossRef] [PubMed]
- Burkhart, S.J.; Jones, B.; Underhill, S.J.R.; Swanepoel, E. School Nutrition and Education Programmes Scoping Review and Capacity Needs Assessment; Final Report; Food and Agriculture Organization of the United Nations: Apia, Samoa, 2019. [Google Scholar]


| Demographic Characteristic | |
|---|---|
| Sex | n (%) |
| Male | 49 (36.8) |
| Female | 84 (63.2) |
| Age (years) | mean, (SD) |
| Overall mean | 37.1 (12.19) |
| Male | 39.6 (13.02) |
| Female | 35.7 (12.19) |
| Participant home location | n (%) |
| In Auki Town | 52 (39.1) |
| Out of Auki Town (villages: Ambu, Fasitoro, Finkawi, Kawi, Kilfui, Kilusakwalo, Kunu, Lilisiana, New Kaloka, Numerula, Sikitae, Talakali, Other) | 81 (60.9) |
| Reported no. people in household | mean (range) |
| Current household size | 6 (1–20) |
| Maximum household size | 7 (1–30) |
| Access to own garden | n % |
| Yes | 86 (65.6) |
| No | 45 (34.4) |
| Education level | n (%) |
| Primary years 1–6 | 44 (33.1) |
| Secondary Form 1–3 | 25 (18.8) |
| Secondary Form 4–6 | 31 (23.3) |
| Secondary Form 7 | 3 (2.3) |
| University | 13 (9.8) |
| Technical | 4 (3.0) |
| Unable to attend | 13 (9.8) |
| Job Type ^ | n (%) |
| Total Employed | 65 (49.2) |
| Teacher | 9 (6.8) |
| Market Vendor | 9 (6.8) |
| Retail | 5 (3.8) |
| Police | 3 (2.3) |
| Farm—Home | 2 (1.5) |
| Farm—Subsidiary | 2 (1.5) |
| Other * | 35 (26.5) |
| Total Unemployed | 67 (50.8) |
| Housewife/Looks after family/Takes care of family | 8 (6.1) |
| Retired | 4 (3.05) |
| Student | 4 (3.05) |
| Activity not defined | 51 (38.6) |
| Fresh Food Sources | n (%) |
|---|---|
| Market | 76 (57) |
| Own garden | 30 (22.5) |
| Garden & market | 13 (9.8) |
| Store | 5 (3.8) |
| Market & store | 3 (2.3) |
| Ocean | 2 (1.5) |
| Market & ocean | 2 (1.5) |
| Market, ocean & store | 1 (0.8) |
| Own garden & store | 1 (0.8) |
| Number of Times a Week | Fresh Food (Total n = 130) n (%) | Store Food (Total n = 127) n (%) |
|---|---|---|
| 1 a week | 31 (23.8) | 29 (22.8) |
| 2 a week | 29 (22.3) | 21 (16.5) |
| 3 a week | 34 (26.2) | 25 (19.7) |
| 4 a week | 5 (3.8) | 3 (2.4) |
| 5 a week | 1 (0.8) | 4 (3.1) |
| 6 a week | 3 (2.3) | 1 (0.8) |
| Daily | 27 (20.8) | 44 (34.6) |
| Mean (SD) number of shops a week | 3.25 (2.18) | 3.87 (2.47) |
| Food Group and Item | Number and Proportion of All Participants Who Reported Purchased Item | ||||
|---|---|---|---|---|---|
| Cereal | Gender n (%) # | Location n (%) ^ | |||
| TOTAL n (%) * | Female | Male | Auki town | Out of Auki town | |
| White rice | 117 (88) | 74 (63.2) | 43 (36.8) | 43 (36.8) | 74 (63.2) |
| Bread | 39 (29.3) | 28 (71.8) | 11 (28.2) | 13 (33.3) | 26 (66.7) |
| Noodles | 33 (24.8) | 23 (69.7) | 10 (30.3) | 10 (30.3) | 23 (69.7) |
| Breakfast cracker | 31 (23.3) | 22 (71) | 9 (29) | 12 (38.7) | 19 (61.3) |
| Tubers and roots | |||||
| Sweet potato (white) | 55 (41.4) | 36 (65.4) | 19 (34.5) | 19 (34.5) | 36 (65.4) |
| Sweet potato (other) | 42 (31.6) | 28 (66.6) | 14 (33.3) | 12 (28.6) | 30 (71.4) |
| Taro | 20 (15) | 12 (60) | 8 (40) | 12 (60) | 8 (40) |
| Cassava | 20 (15) | 14 (70) | 6 (30) | 8 (40) | 12 (60) |
| Vegetables | |||||
| Cabbage | 90 (67.7) | 59 (65.5) | 31(34.4) | 35 (38.9) | 55 (61) |
| Tomato | 41 (30.8) | 28 (68.3) | 13 (31.7) | 18 (43.9) | 23 (56.1) |
| Cucumber | 36 (27) | 28 (77.8) | 8 (22.2) | 14 (38.9) | 22 (61.1) |
| Capsicum | 25 (19) | 21 (84) | 4 (16) | 12 (48) | 13 (52) |
| Eggplant | 22 (16.5) | 19 (86.3) | 3 (13.6) | 7 (31.8) | 15 (68.1) |
| Snake bean | 21 (16) | 14 (66.6) | 7 (33.3) | 5 (23.8) | 16 (76.2) |
| Pumpkin | 21 (16) | 16 (76.2) | 5 (23.8) | 5 (23.8) | 16 (76.2) |
| Spring onion | 20 (15) | 13 (65) | 7 (35) | 6 (30) | 14 (70) |
| Fruit | |||||
| Banana | 33 (24.8) | 22 (66.6) | 11 (33.3) | 7 (21.2) | 26 (79) |
| Papaya | 28 (21) | 20 (71.4) | 8 (32) | 10 (35.7) | 18 (72) |
| Watermelon | 27 (20.3) | 23 (85.2) | 4 (14.8) | 12 (44.4) | 15 (55.6) |
| Pineapple | 26 (19.5) | 20 (76.9) | 6 (23) | 8 (30.8) | 18 (69.2) |
| Coconut | 23 (17.2) | 13 (56.6) | 10 (43.5) | 7 (30.4) | 16 (70) |
| Mango | 20 (15) | 14 (70) | 6 (30) | 4 (20) | 16 (80) |
| Plantain | 18 (13.5) | 12(66.7) | 6 (44.4) | 5 (27.8) | 13 (72.2) |
| Meat and eggs | |||||
| Tinned fish | 76 (57.1) | 50 (66) | 26 (34.2) | 28 (36.8) | 48 (63.2) |
| Fresh fish | 39 (29.3) | 27 (69.2) | 12 (31) | 16 (41) | 23 (59) |
| Eggs | 18 (13.5) | 13 (72.2) | 5 (27.8) | 6 (33.3) | 12 (66.7) |
| Seafood crab | 11 (12) | 7 (58.3) | 4 (36.3) | 5 (45.4) | 6 (54.4) |
| Nuts ** | |||||
| Ngali nut | 37 (27.8) | 25 (67.63) | 12 (32.4) | 11 (29.7) | 26 (70.2) |
| Peanuts | 15 (11.3) | 10 (66.7) | 5 (33.3) | 6 (40) | 9 (60) |
| Dairy | |||||
| Milk powder | 18 (13.5) | 12 (66.47) | 6 (33.3) | 3 (16.7) | 15 (83.3) |
| Fats *** | |||||
| Coconut cream | 38 (28.6) | 30 (79) | 8 (21) | 16 (42) | 22 (58) |
| Coconut milk | 37 (28) | 24 (65) | 13 (35.1) | 12 (32.4) | 25 (68) |
| Coconut oil | 18 (13.5) | 13 (72.2) | 5 (27.8) | 4 (22.2) | 14 (77.8) |
| Peanut oil | 13 (9.8) | 10 (77) | 3 (23) | 4 (31) | 9 (69.2) |
| Discretionary | |||||
| Sugar | 80 (60.1) | 49 (61.2) | 31(39) | 29 (36.2) | 51 (64) |
| Cake | 22 (16.5) | 16 (72.7) | 6 (27.2) | 5 (22.7) | 17 (77.2) |
| Soft drink | 22 (16.5) | 15 (68.1) | 7 (31.8) | 10 (45.4) | 12 (54.5) |
| Flavored ice block | 20 (15) | 16 (80) | 4 (20) | 7 (35) | 13 (65) |
| Sweet bun | 15 (11.3) | 9 (60) | 6 (40) | 3 (20) | 12 (80) |
| Sweet biscuit | 12(9) | 9 (75) | 3 (25) | 6 (50) | 6 (50) |
| Condiments ^^ | |||||
| Tea | 95 (71.4) | 60 (63.1) | 35 (36.8) | 35 (36.8) | 60 (63.1) |
| Salt | 69 (52) | 51 (73.9) | 18 (26) | 20 (29) | 49 (71) |
| Soy sauce | 26 (19.5) | 20 (76.9) | 6 (23) | 7 (27) | 19 (73) |
| Coffee | 18 (13.5) | 15 (83.3) | 3 (16.7) | 1 (5.6) | 17 (94.4) |
| Curry | 11 (82.7) | 7 (63.6) | 4 (36.3) | 6 (54.5) | 5 (45.4) |
© 2019 by the authors. Licensee MDPI, Basel, Switzerland. This article is an open access article distributed under the terms and conditions of the Creative Commons Attribution (CC BY) license (http://creativecommons.org/licenses/by/4.0/).
Share and Cite
Bottcher, C.; Underhill, S.J.R.; Aliakbari, J.; Burkhart, S.J. Food Purchasing Behaviors of a Remote and Rural Adult Solomon Islander Population. Foods 2019, 8, 464. https://doi.org/10.3390/foods8100464
Bottcher C, Underhill SJR, Aliakbari J, Burkhart SJ. Food Purchasing Behaviors of a Remote and Rural Adult Solomon Islander Population. Foods. 2019; 8(10):464. https://doi.org/10.3390/foods8100464
Chicago/Turabian StyleBottcher, Charis, Steven J. R. Underhill, Judith Aliakbari, and Sarah J. Burkhart. 2019. "Food Purchasing Behaviors of a Remote and Rural Adult Solomon Islander Population" Foods 8, no. 10: 464. https://doi.org/10.3390/foods8100464