Digital Image Filtering Optimization Supporting Iberian Ham Quality Prediction

 ,
, 

Abstract
:1. Introduction
2. Materials and Methods
2.1. Ham Samples
2.2. Image Acquisition
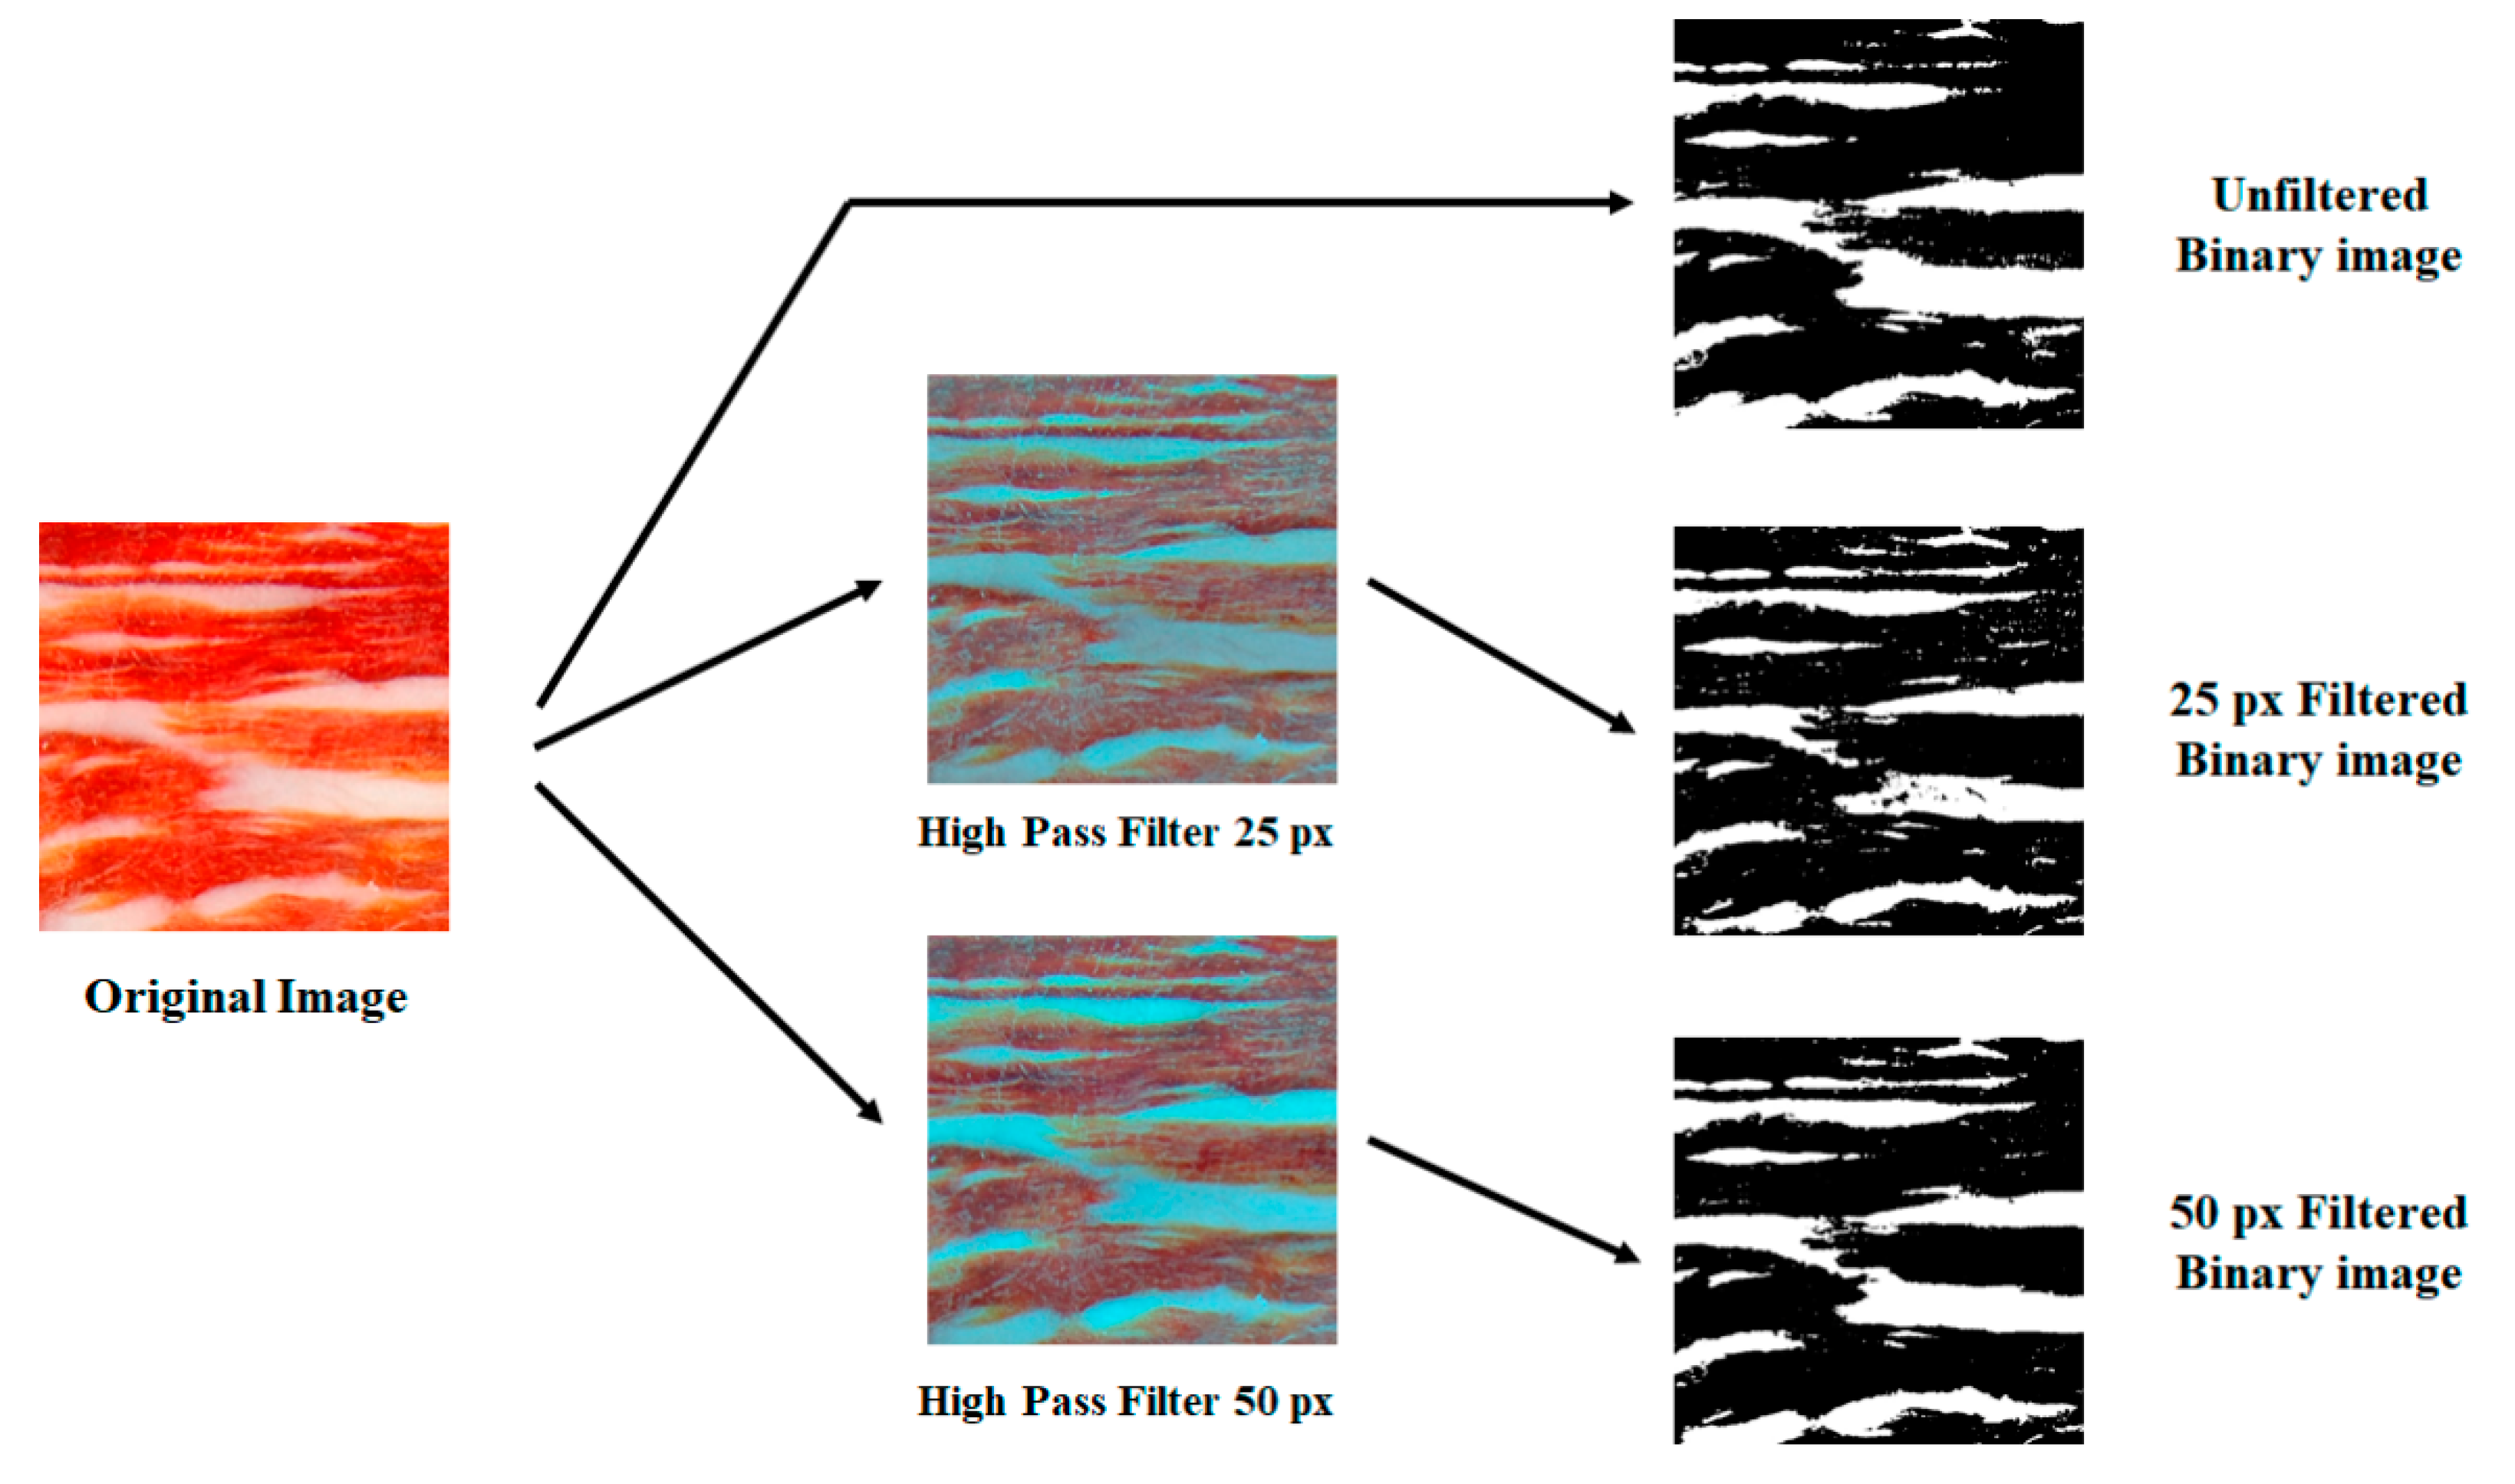
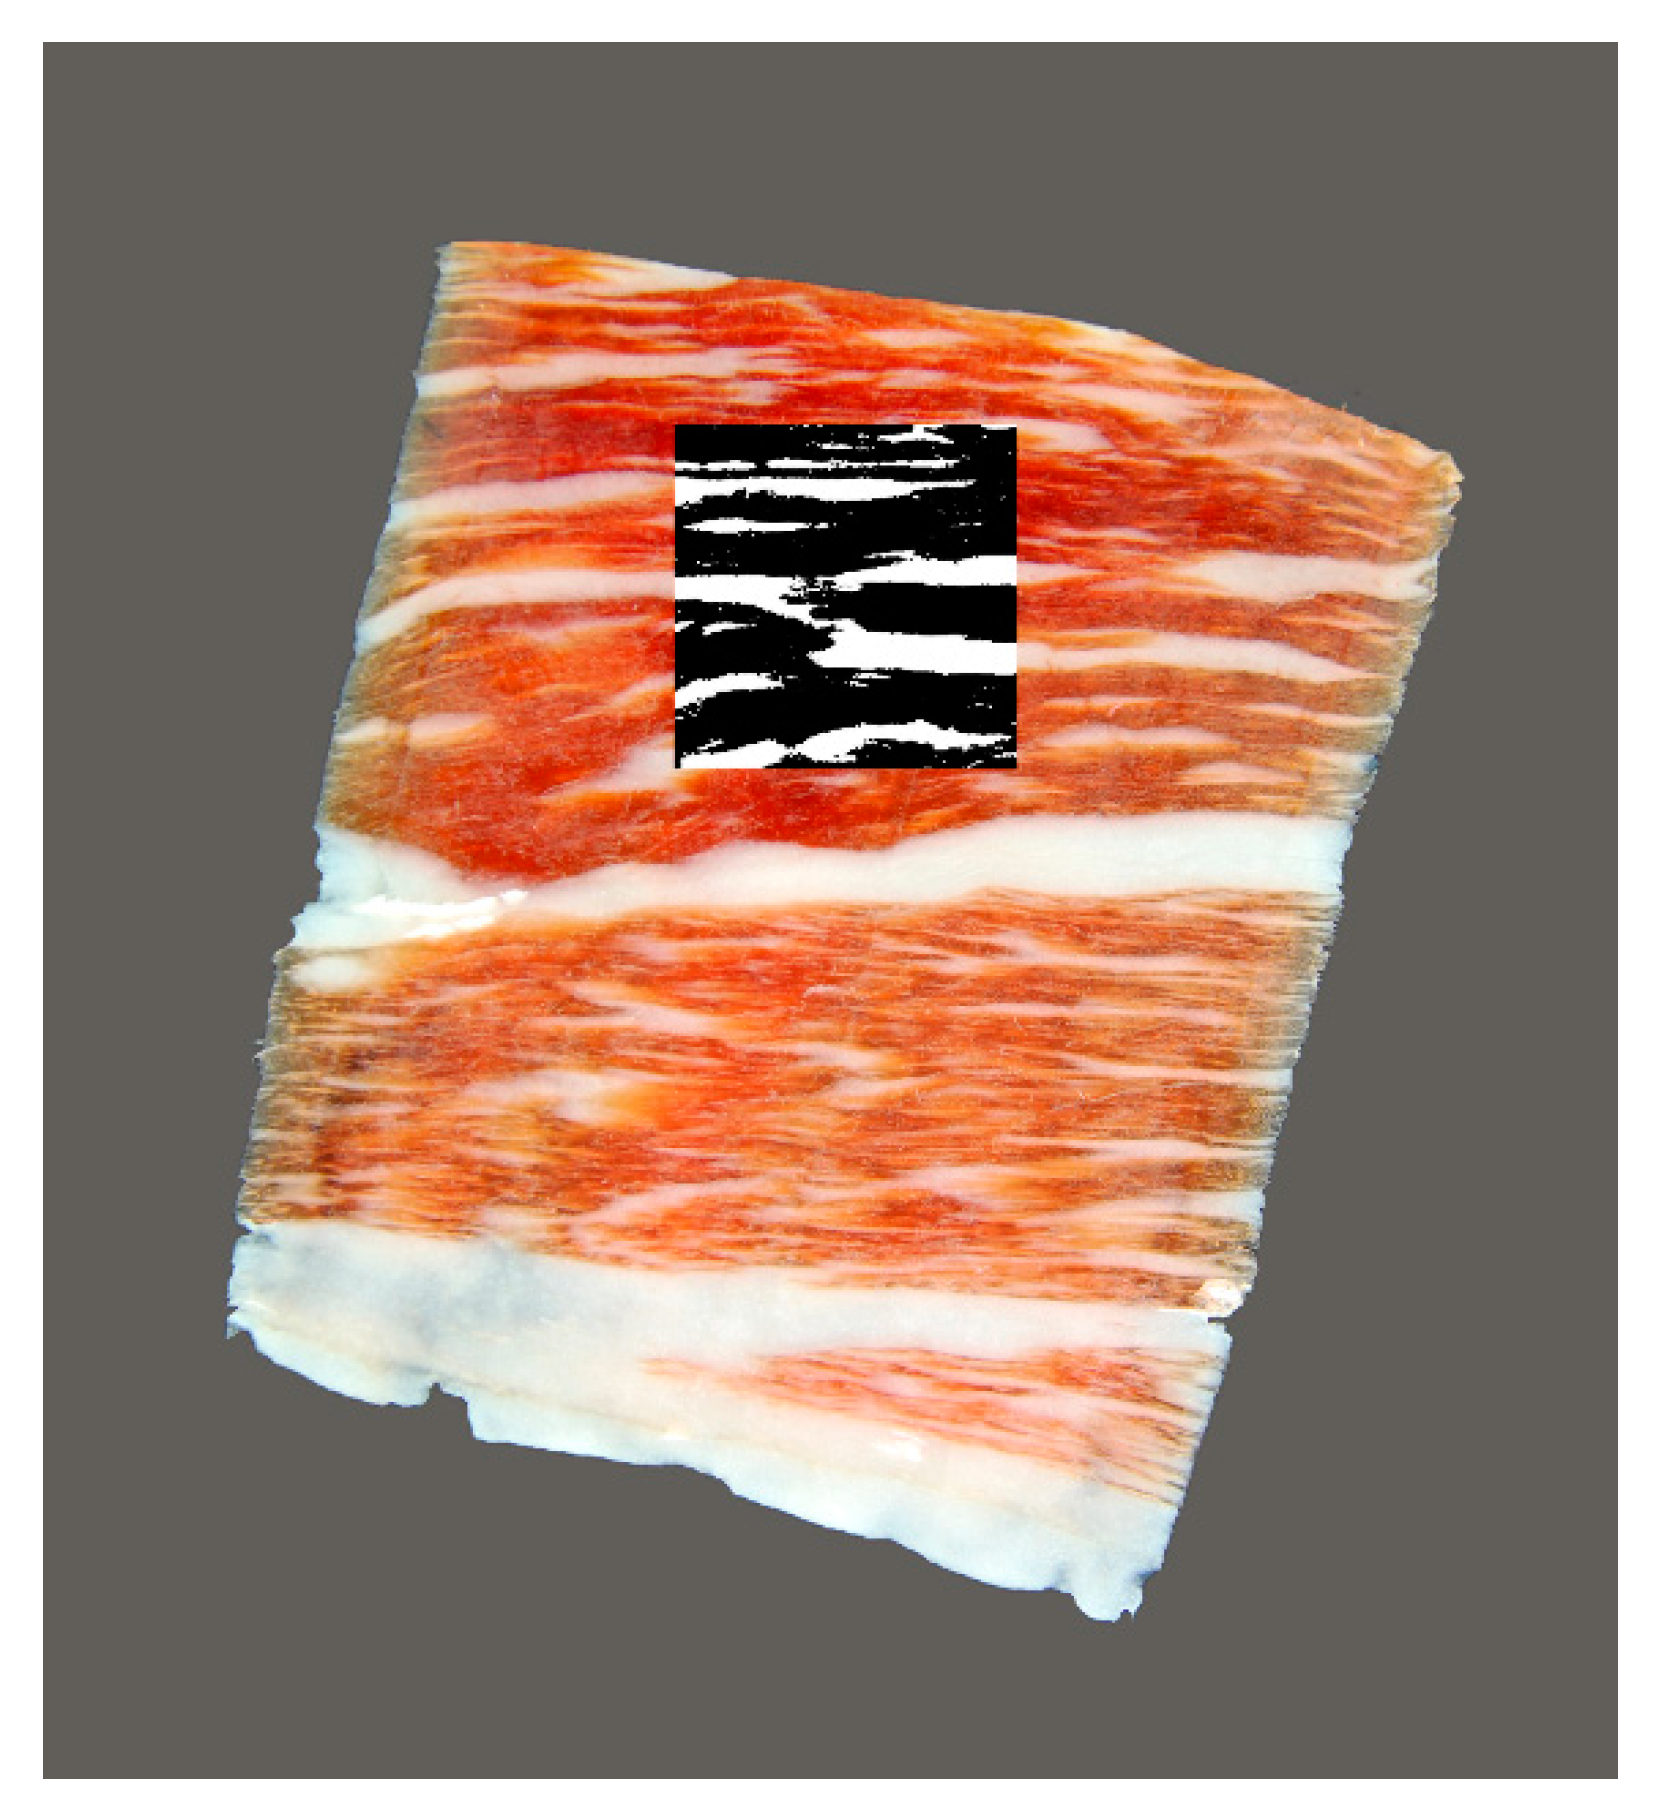
2.3. Image Processing
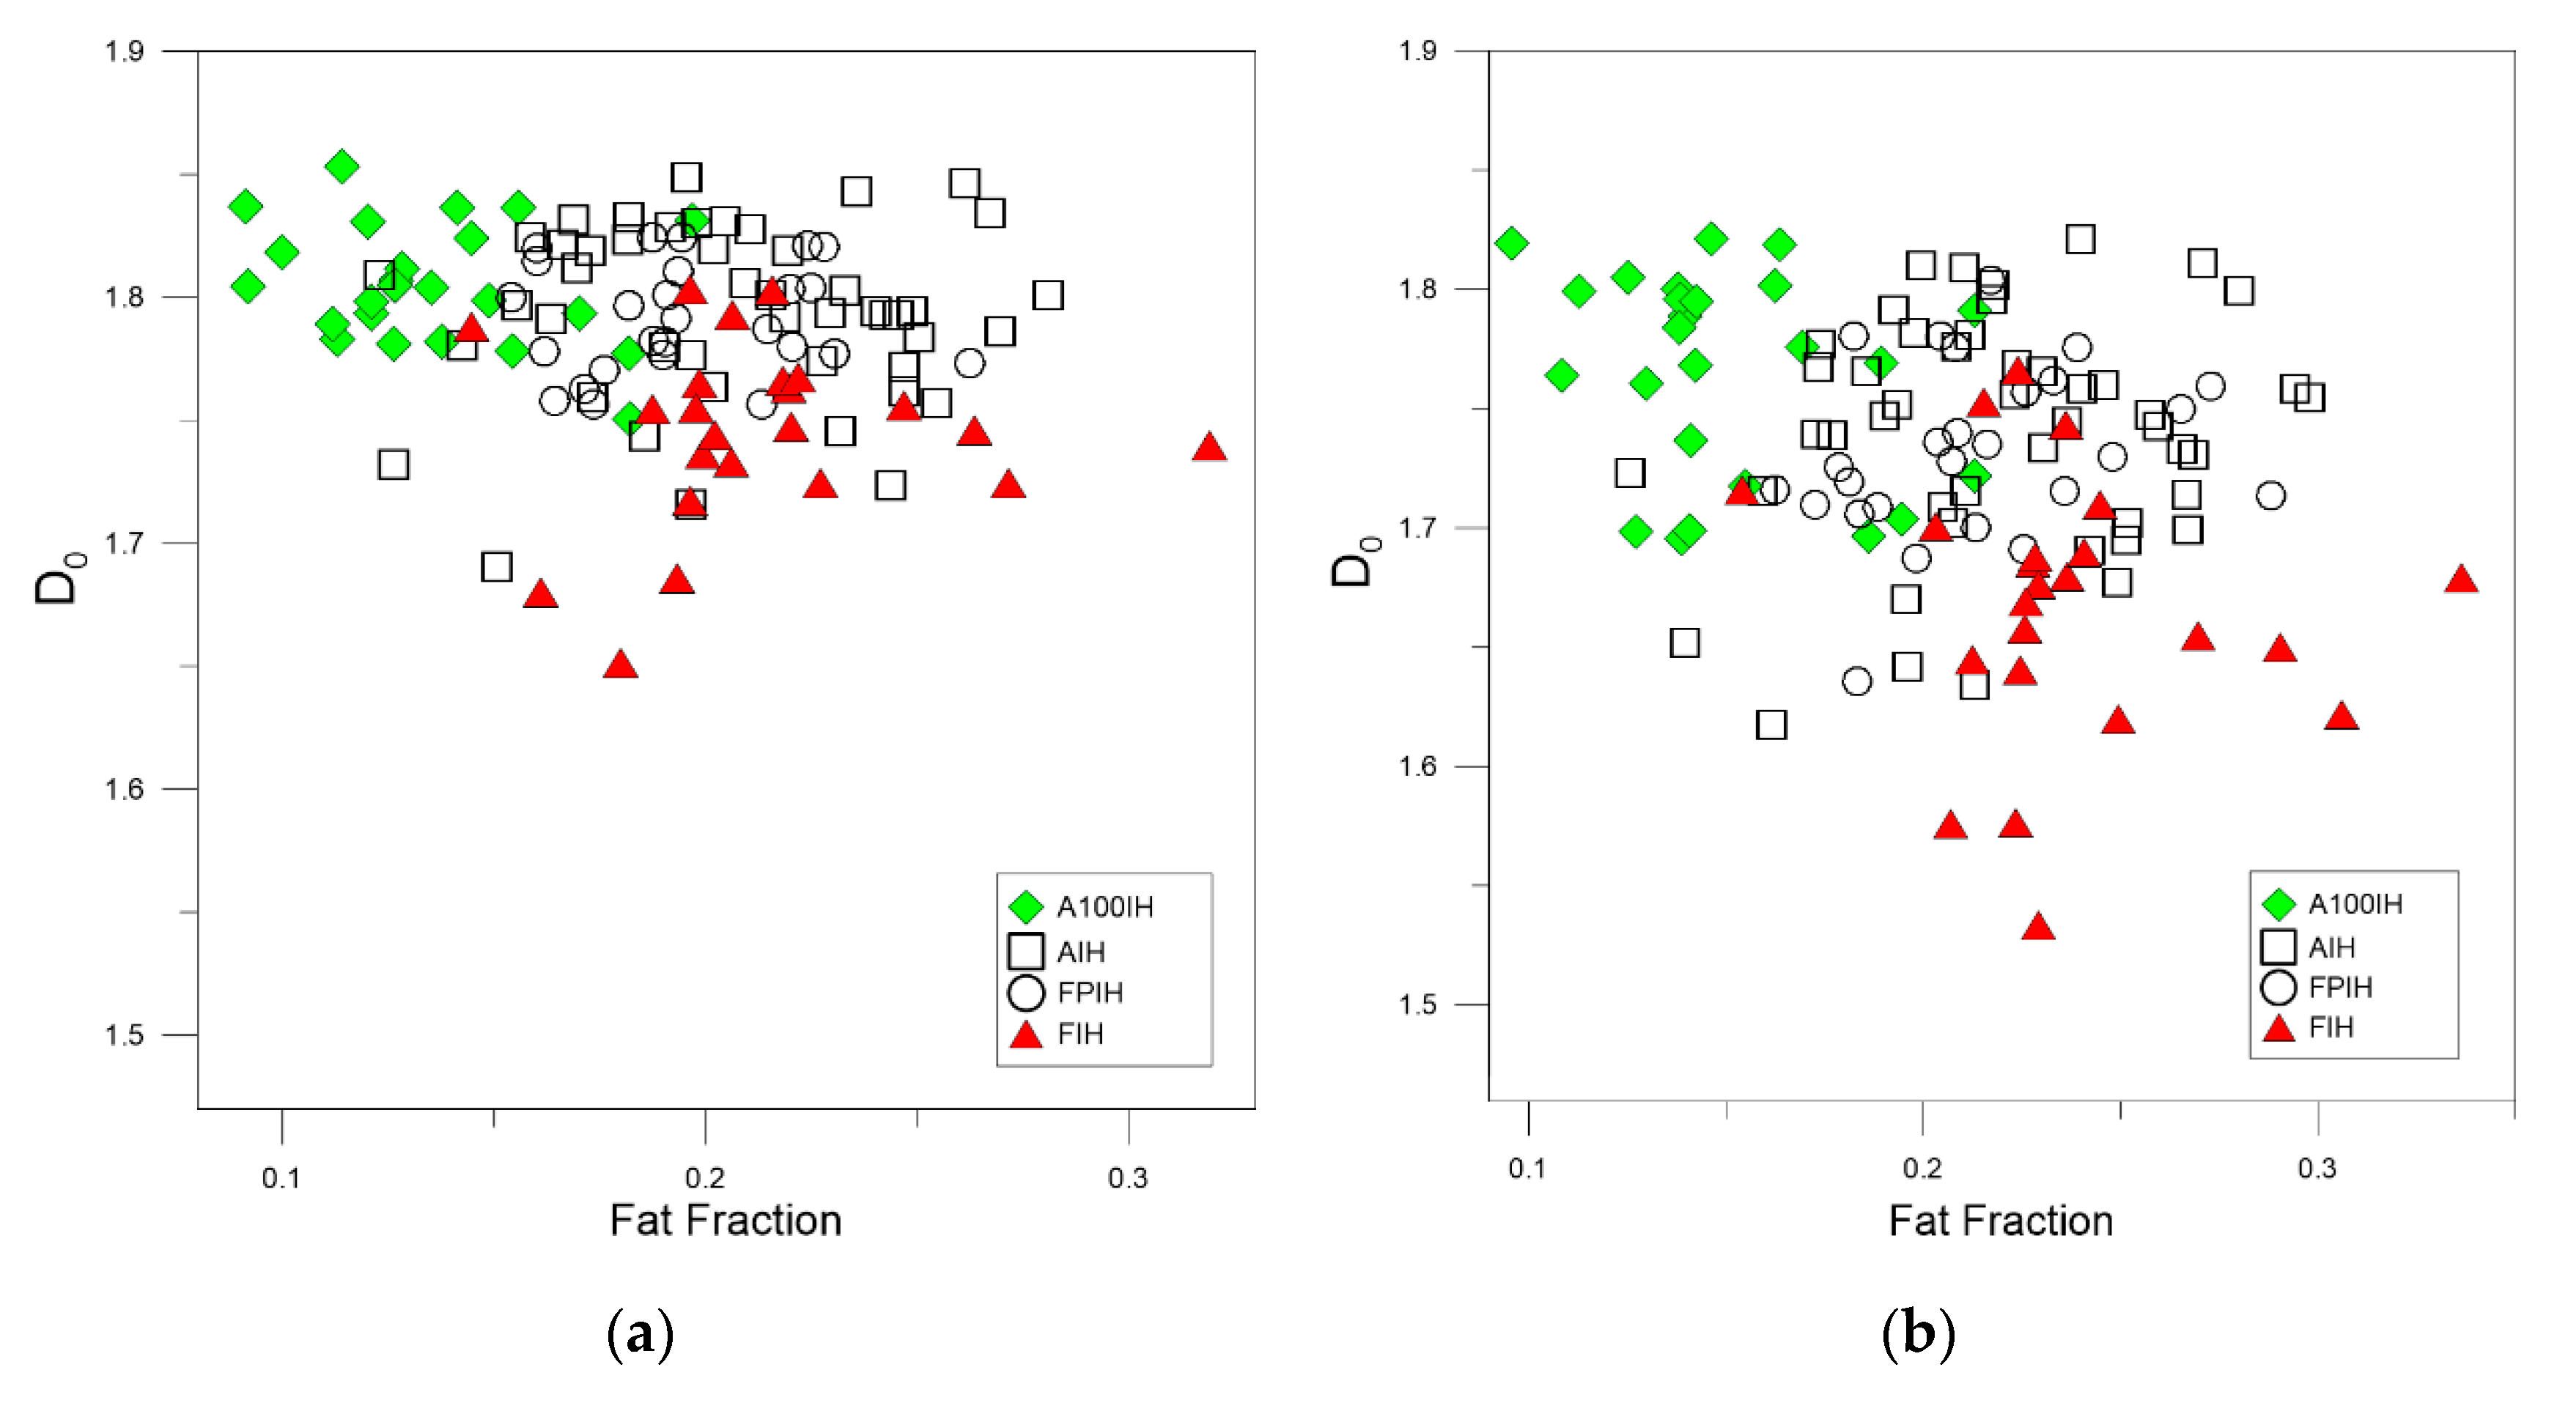
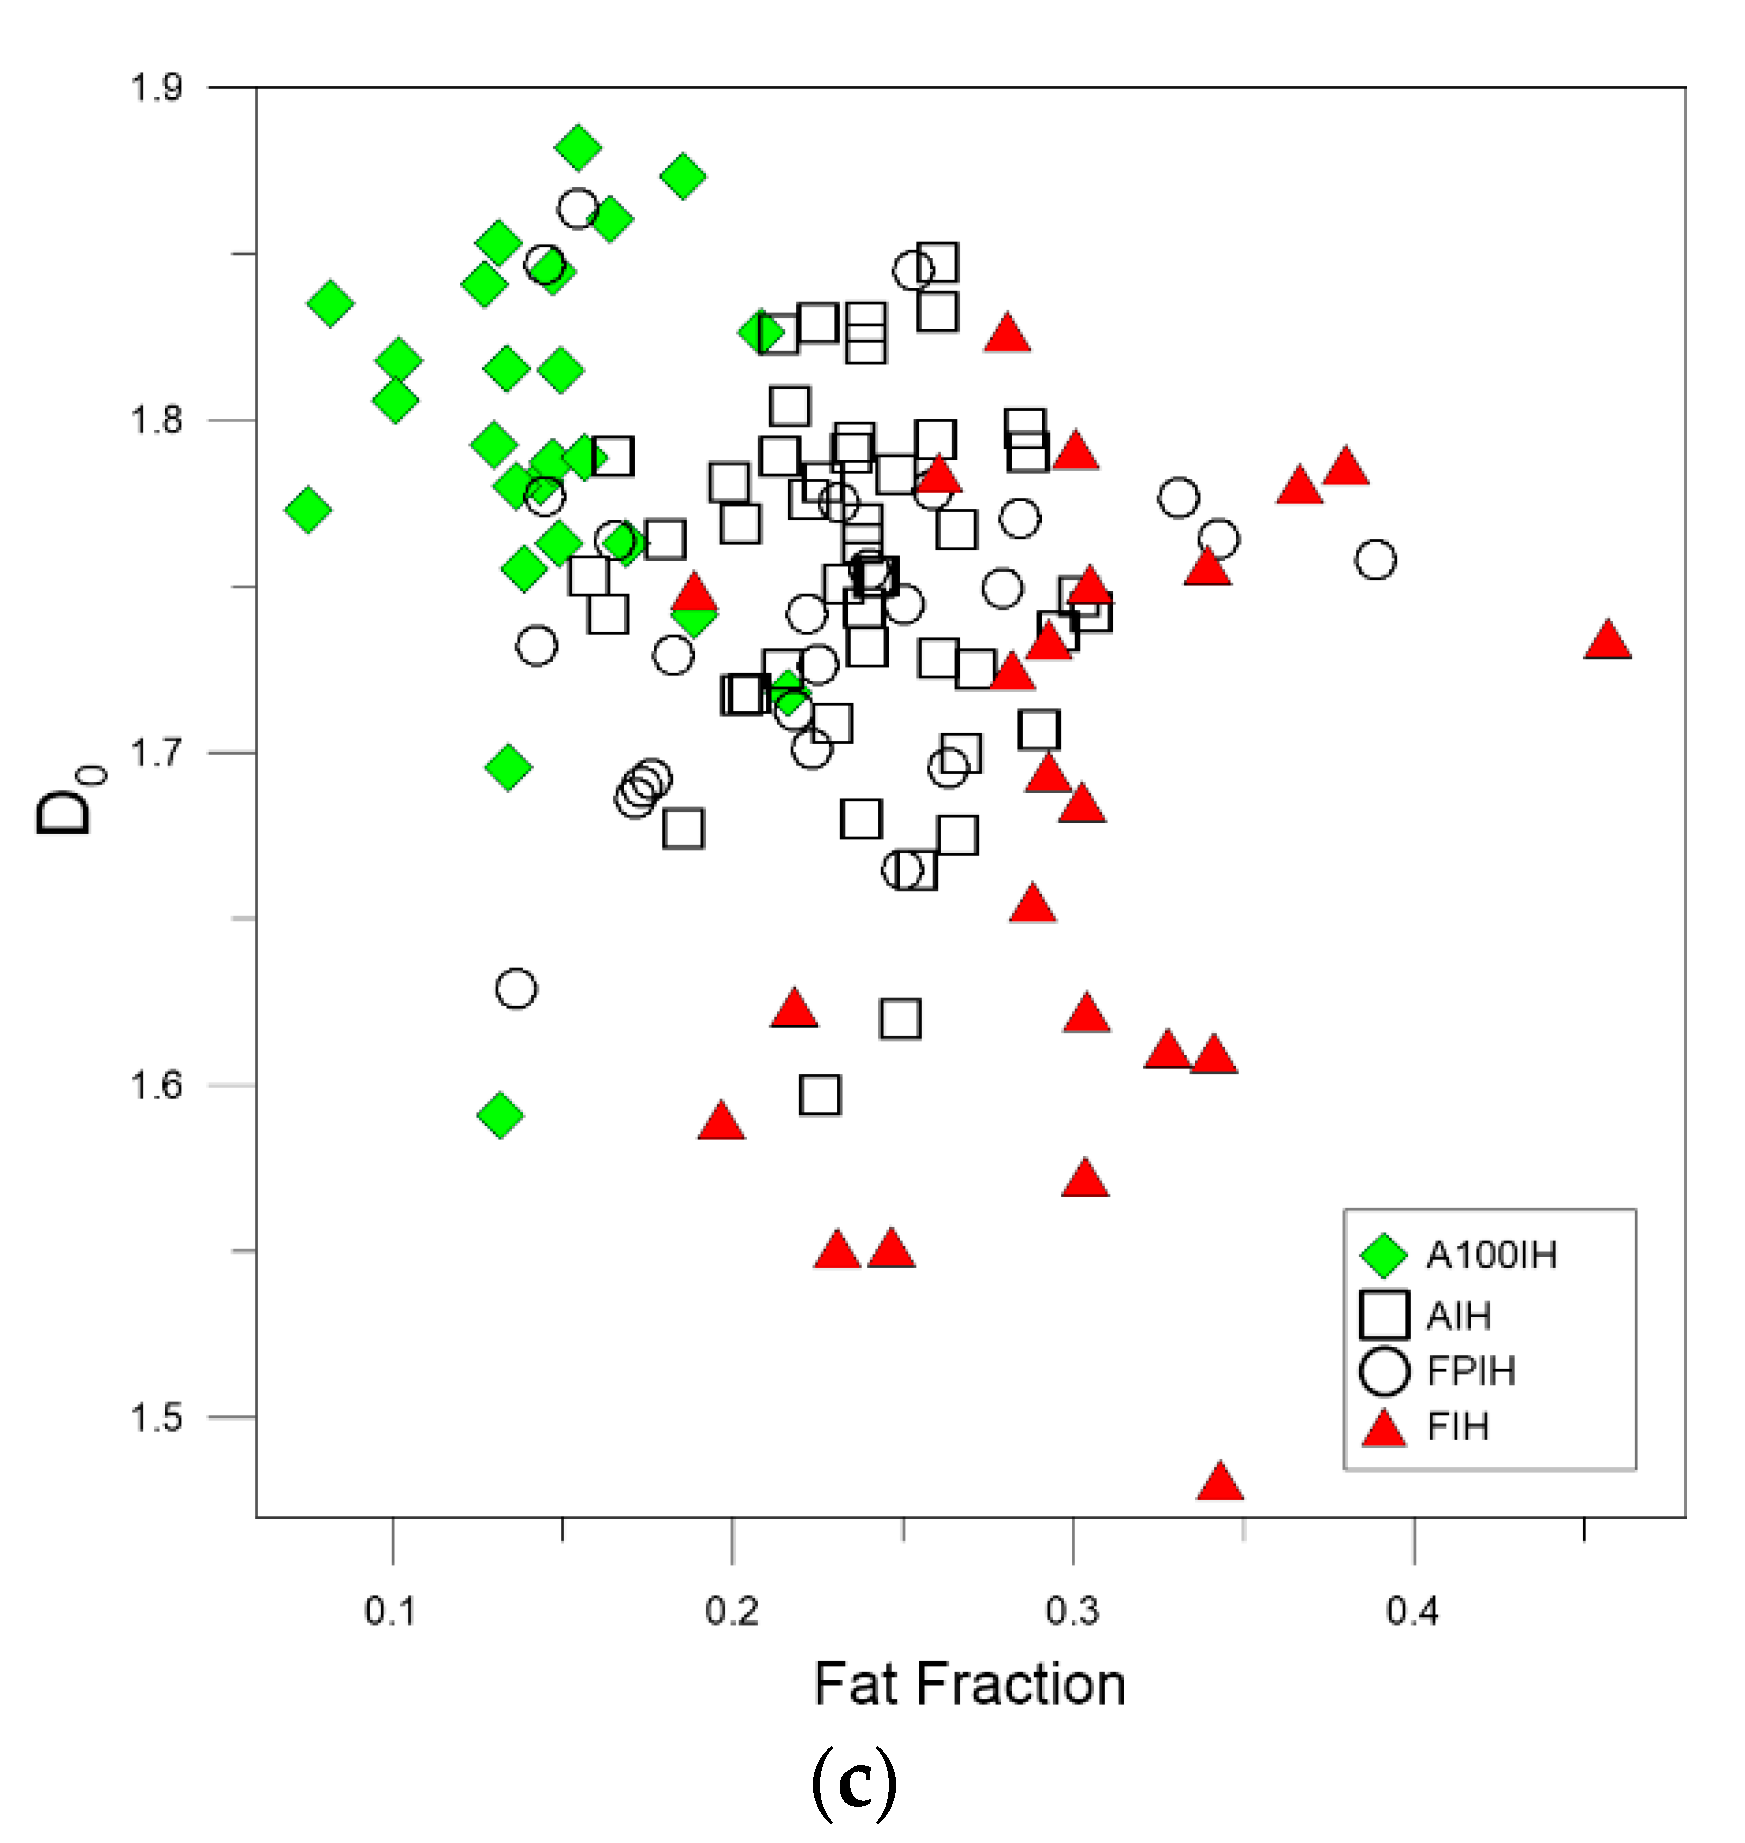
3. Results and Discussion
4. Conclusions
Author Contributions
Funding
Acknowledgments
Conflicts of Interest
References
- Garrido-Fernández, A.; León-Camacho, M. Assessing the effect of season, montanera length and sampling location on T Iberian pig fat by compositional data analysis and standard multivariate statistics. Food Chem. 2019, 295, 377–386. [Google Scholar] [CrossRef] [PubMed]
- Arroyo-Manzanares, N.; Martín-Gómez, M.; Jurado-Campos, N.; Garrido-Delgado, R.; Arce, C.; Arce, L. Target vs spectral fingerprint data analysis of Iberian ham samples for avoiding labelling fraud using headspace–gas chromatography–ion mobility spectrometry. Food Chem. 2018, 246, 65–73. [Google Scholar] [CrossRef] [PubMed]
- Ventanas, S.; Ventanas, J.; Ruiz, J. Sensory characteristics of Iberian dry-cured loins: Influence of crossbreeding and rearing system. Meat Sci. 2007, 75, 211–219. [Google Scholar] [CrossRef] [PubMed]
- Díaz-Caro, C.; García-Torres, S.; Elghannam, A.; Tejerina, D.; Mesias, F.J.; Ortiz, A. Is production system a relevant attribute in consumers’ food preferences? The case of Iberian dry-cured ham in Spain. Meat Sci. 2019, 158, 107908. [Google Scholar] [CrossRef] [PubMed]
- Giaretta, E.; Mordenti, A.L.; Canestrari, G.; Brogna, N.; Palmonari, A.; Formigoni, A. Assessment of muscle Longissimus thoracis et lumborum marbling by image analysis and relationships between meat quality parameters. PLoS ONE 2018, 13, e0202535. [Google Scholar] [CrossRef] [PubMed] [Green Version]
- Peña, F.; Molina, A.; Avilés, C.; Juárez, M.; Horcada, A. Marbling in the longissimus thoracis muscle from lean cattle breeds. Computer image analysis of fresh versus stained meat samples. Meat Sci. 2013, 95, 512–519. [Google Scholar] [CrossRef] [PubMed]
- Zapotoczny, P.; Szczypin_ski, P.M.; Daszkiewicz, T. Evaluation of the quality of cold meats by computer-assisted image analysis. LWT Food Sci. Technol. 2016, 67, 37–49. [Google Scholar] [CrossRef]
- Dowlati, M.; Mohtasebi, S.S.; Omid, M.; Razavi, S.H.; Jamzad, M.; de la Guardia, M. Freshness assessment of gilthead sea bream (Sparus aurata) by machine vision based on gill and eye color changes. J. Food Eng. 2013, 119, 277–287. [Google Scholar] [CrossRef]
- Ivorra, E.; Sánchez, A.J.; Verdú, S.; Barat, J.M.; Grau, R. Shelf life prediction of expired vacuum-packed chilled smoked salmon based on a KNN tissue segmentation method using hyperspectral images. J. Food Eng. 2016, 178, 110–116. [Google Scholar] [CrossRef]
- Jackman, P.; Sun, D.-W. 10—Computer vision in the fresh and processed meat industries. In Computer Vision Technology in the Food and Beverage Industries; Sun, D.-W., Ed.; Woodhead Publishing: Cambridge, UK, 2012; pp. 255–276. [Google Scholar] [CrossRef]
- Konda Naganathan, G.; Cluff, K.; Samal, A.; Calkins, C.R.; Jones, D.D.; Lorenzen, C.L.; Subbiah, J. Hyperspectral imaging of ribeye muscle on hanging beef carcasses for tenderness assessment. Comput. Electron. Agric. 2015, 116, 55–64. [Google Scholar] [CrossRef]
- Mery, D.; Lillo, I.; Loebel, H.; Riffo, V.; Soto, A.; Cipriano, A.; Aguilera, J.M. Automated Detection of Fish Bones in Salmon Fillets Using X-ray Testing. In Proceedings of the 2010 Fourth Pacific-Rim Symposium on Image and Video Technology, Singapore, 14–17 November 2010; pp. 46–51. [Google Scholar] [CrossRef]
- Wu, D.; Sun, D.W. Colour measurements by computer vision for food quality control—A review. Trends Food Sci. Technol. 2013, 29, 5–20. [Google Scholar] [CrossRef]
- Niazi, M.K.K. Image Filtering Methods for Biomedical Applications. In Digital Comprehensive Summaries of Uppsala Dissertations from the Faculty of Science and Technology; Acta Universitatis Upsaliensis: Uppsala, Sweden, 2011; Volume 852, p. 61. [Google Scholar]
- Yang, C.-C. Image enhancement by the modified high-pass filtering approach. Optik 2009, 120, 886–889. [Google Scholar] [CrossRef]
- Xiao, L.; Li, C.; Wu, Z.; Wang, T. An enhancement method for X-ray image via fuzzy noise removal and homomorphic filtering. Neurocomputing 2016, 195, 56–64. [Google Scholar] [CrossRef]
- Dogra, A.; Bhalla, P. Image Sharpening by Gaussian and Butterworth High Pass Filter. Biomed. Pharmacol. J. 2014, 7, 707–713. [Google Scholar] [CrossRef]
- Lin, W.-C.; Wang, J.-W. Edge detection in medical images with quasi high-pass filter based on local statistics. Biomed. Signal Process. Control 2018, 39, 294–302. [Google Scholar] [CrossRef]
- Ghani, A.S.; Isa, N.A.M. Homomorphic filtering with image fusion for enhancement of details and homogeneous contrast of underwater image. Indian J. Geo Mar. Sci. 2016, 44, 1904–1919. [Google Scholar]
- Verdú, S.; Barat, J.M.; Grau, R. Fresh-sliced tissue inspection: Characterization of pork and salmon composition based on fractal analytics. Food Bioprod. Process. 2019, 116, 20–29. [Google Scholar] [CrossRef]
- Caballero, D.; Antequera, T.; Caro, A.; Amigo, J.M.; ErsbØll, B.K.; Dahl, A.B.; Pérez-Palacios, T. Analysis of MRI by fractals for prediction of sensory attributes: A case study in loin. J. Food Eng. 2018, 227, 1–10. [Google Scholar] [CrossRef] [Green Version]
- He, Q.; Zhu, L.; Shen, Y.; Lin, X.; Xiao, K. Evaluation of the effects of frozen storage on the microstructure of tilapia (Perciformes: Cichlidae) through fractal dimension method. LWT Food Sci. Technol. 2015, 64, 1283–1288. [Google Scholar] [CrossRef]
- Quevedo, R.; Valencia, E.; Cuevas, G.; Ronceros, B.; Pedreschi, F.; Bastías, J.M. Color changes in the surface of fresh cut meat: A fractal kinetic application. Food Res. Int. 2013, 54, 1430–1436. [Google Scholar] [CrossRef]
- Serrano, S.; Perán, F.; Jiménez-Hornero, F.J.; Gutiérrez de Ravé, E. Multifractal analysis application to the characterization of fatty infiltration in Iberian and White pork sirloins. Meat Sci. 2013, 93, 723–732. [Google Scholar] [CrossRef]
- Ávila, M.M.; Durán, M.L.; Caballero, D.; Antequera, T.; Palacios-Pérez, T.; Cernadas, E.; Fernández-Delgado, M. Magnetic Resonance Imaging, texture analysis and regression techniques to non-destructively predict the quality characteristics of meat pieces. Eng. Appl. Artif. Intell. 2019, 82, 110–125. [Google Scholar] [CrossRef]
- Joshi, B.; Beccard, S.; Vilgis, T.A. Fractals in crystallizing food systems. Curr. Opin. Food Sci. 2018, 21, 39–45. [Google Scholar] [CrossRef]
- Ropodi, A.I.; Panagou, E.Z.; Nychas, G.-J.E. Data mining derived from food analyses using non-invasive/non-destructive analytical techniques; determination of food authenticity, quality & safety in tandem with computer science disciplines. Trends Food Sci. Technol. 2016, 50, 11–25. [Google Scholar] [CrossRef]
- Valous, N.A.; Zheng, L.; Sun, D.-W.; Tan, J. Quality Evaluation of Meat Cuts. In Computer Vision Technology for Food Quality Evaluation, 2nd ed.; Sun, D.-W., Ed.; Academic Press: San Diego, CA, USA, 2016; pp. 175–193. [Google Scholar] [CrossRef]
- Pérez-Palacios, T.; Caballero, D.; Caro, A.; Rodríguez, P.G.; Antequera, T. Applying data mining and Computer Vision Techniques to MRI to estimate quality traits in Iberian hams. J. Food Eng. 2014, 131, 82–88. [Google Scholar] [CrossRef]
- Caballero, D.; Caro, A.; Rodríguez, P.G.; Durán, M.L.; del Mar Ávila, M.; Palacios, R.; Antequera, T.; Pérez-Palacios, T. Modeling salt diffusion in Iberian ham by applying MRI and data mining. J. Food Eng. 2016, 189, 115–122. [Google Scholar] [CrossRef]
- Pérez-Palacios, T.; Caballero, D.; Antequera, T.; Durán, M.L.; Ávila, M.; Caro, A. Optimization of MRI Acquisition and Texture Analysis to Predict Physico-chemical Parameters of Loins by Data Mining. Food Bioprocess Technol. 2017, 10, 750–758. [Google Scholar] [CrossRef]
- Caballero, D.; Pérez-Palacios, T.; Caro, A.; Amigo, J.M.; Dahl, A.B.; ErsbØll, B.K.; Antequera, T. Prediction of pork quality parameters by applying fractals and data mining on MRI. Food Res. Int. 2017, 99, 739–747. [Google Scholar] [CrossRef]
- Barbon, A.P.A.; Barbon, S.; Mantovani, R.G.; Fuzyi, E.M.; Peres, L.M.; Bridi, A.M. Storage time prediction of pork by Computational Intelligence. Comput. Electron. Agric. 2016, 127, 368–375. [Google Scholar] [CrossRef]
- Da Costa Barbon, A.P.A.; Barbon, S.; Campos, G.F.C.; Seixas, J.L.; Peres, L.M.; Mastelini, S.M.; Andreo, N.; Ulrici, A.; Bridi, A.M. Development of a flexible Computer Vision System for marbling classification. Comput. Electron. Agric. 2017, 142, 536–544. [Google Scholar] [CrossRef]
- Serrano, S.; Perán, F.; de Ravé, E.G.; Cumplido, A.; Jiménez-Hornero, F.J. Multifractal analysis application to the study of fat and its infiltration in Iberian ham: Influence of racial and feeding factors and type of slicing. Meat Sci. 2019, 148, 55–63. [Google Scholar] [CrossRef]
- Benguigui, L.; Czamanski, D.; Marinov, M.; Portugali, Y. When and where is a city fractal? Environ. Plan. B Plan. Des. 2000, 27, 507–519. [Google Scholar] [CrossRef] [Green Version]
- Chen, Y.; Wang, J.; Feng, J. Understanding the fractal dimensions of urban forms through spatial entropy. Entropy 2017, 19, 600. [Google Scholar] [CrossRef] [Green Version]


| Batch | A100IH | AIH | FPIH | FIH |
|---|---|---|---|---|
| 1 | 12 | 26 | 12 | 11 |
| 2 | 13 | 21 | 14 | 12 |
| Method | Ham Design | Fractal Dimension | |||||
|---|---|---|---|---|---|---|---|
| D0 | D1 | D2 | |||||
| Mean | Standard Error | Mean | Standard Error | Mean | Standard Error | ||
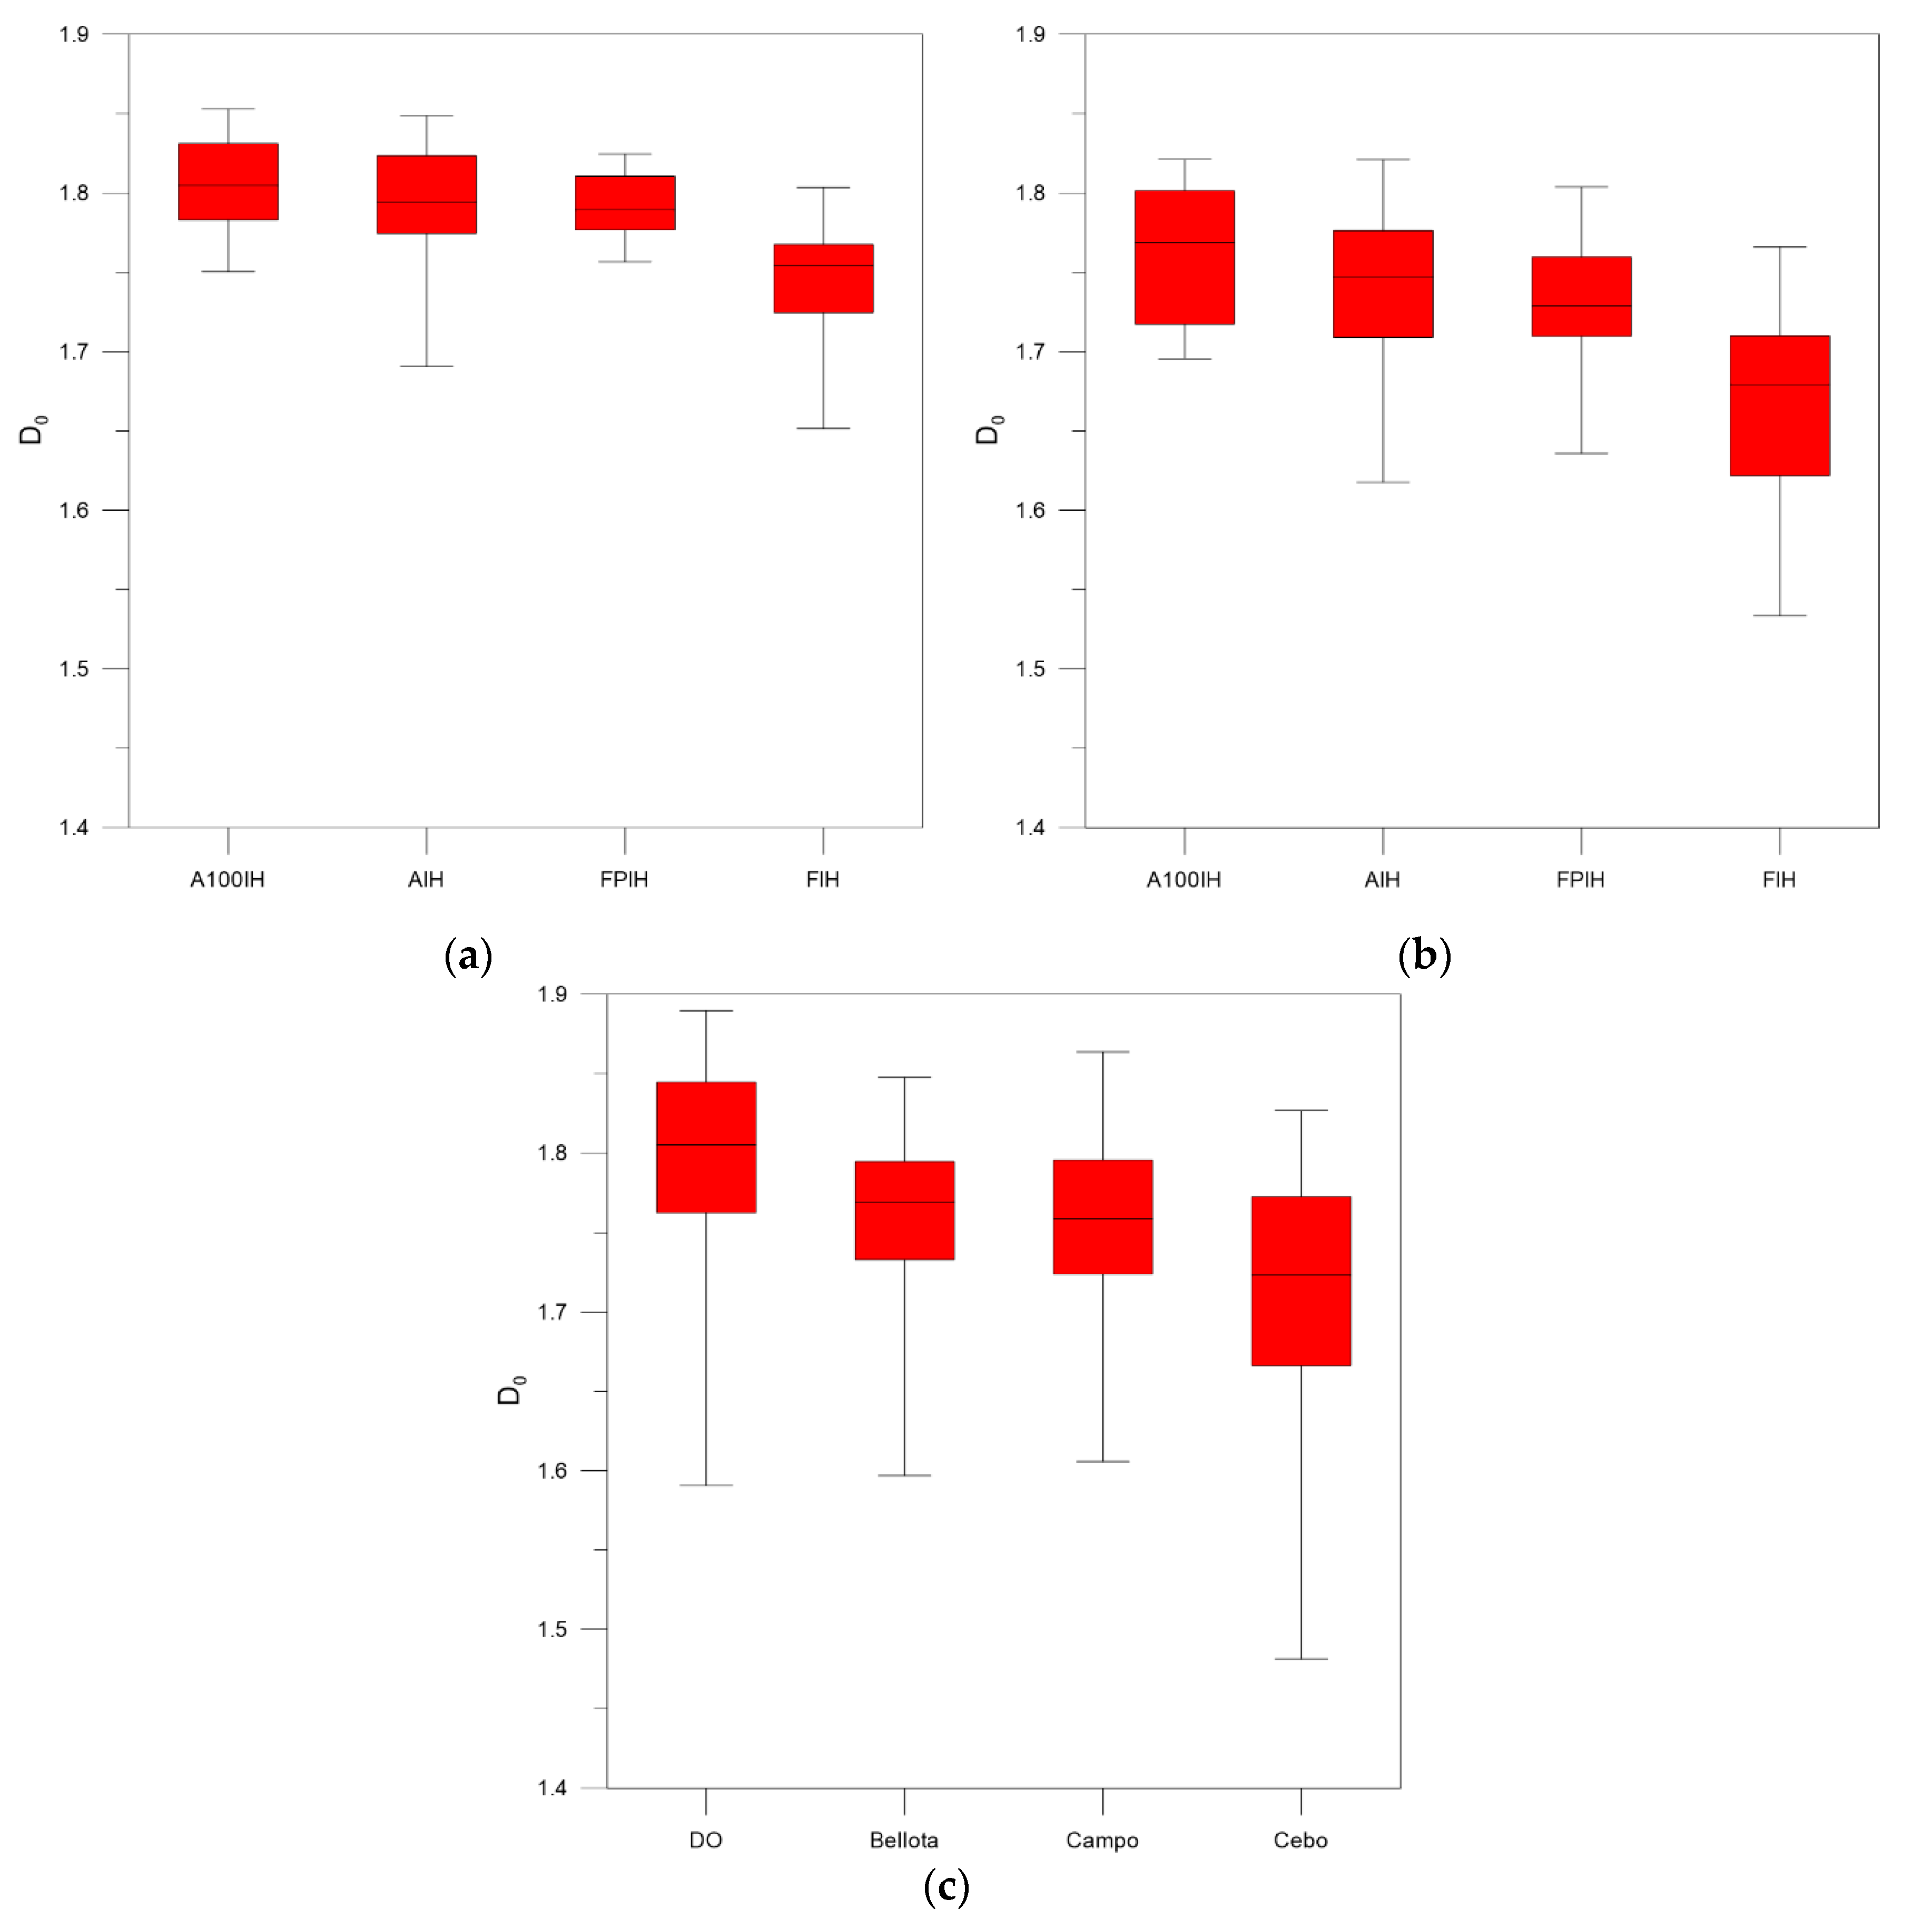
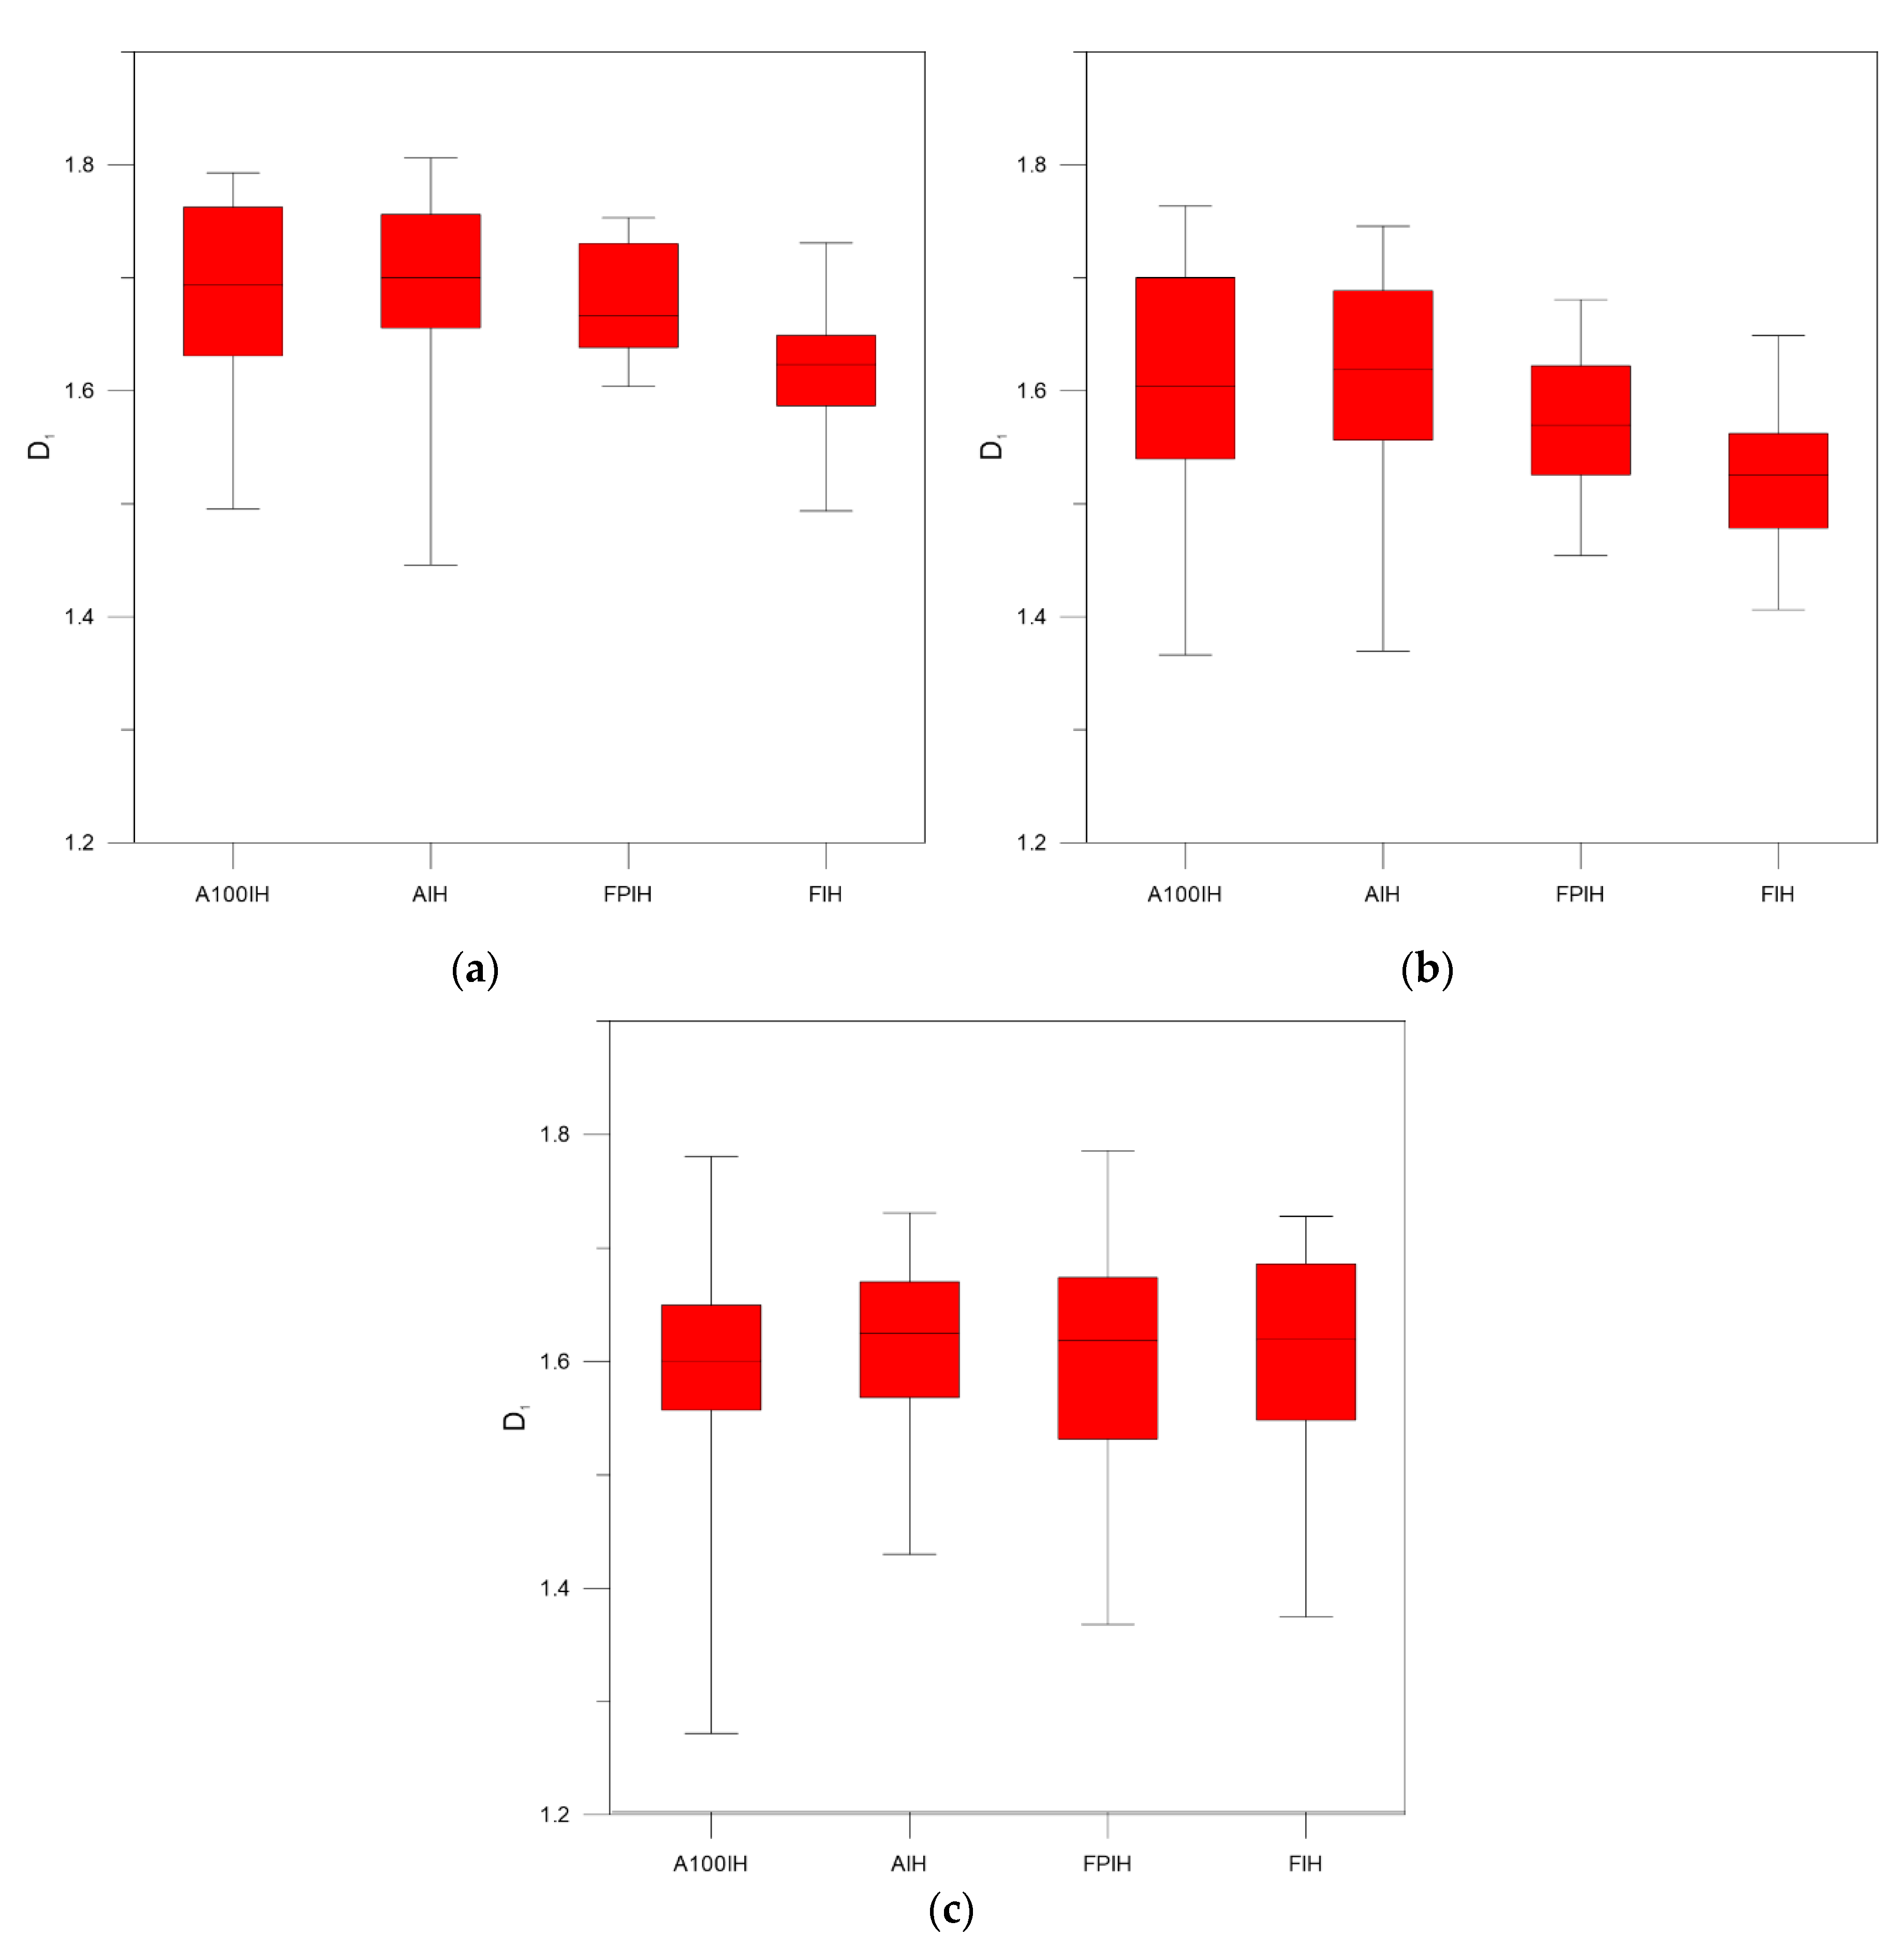
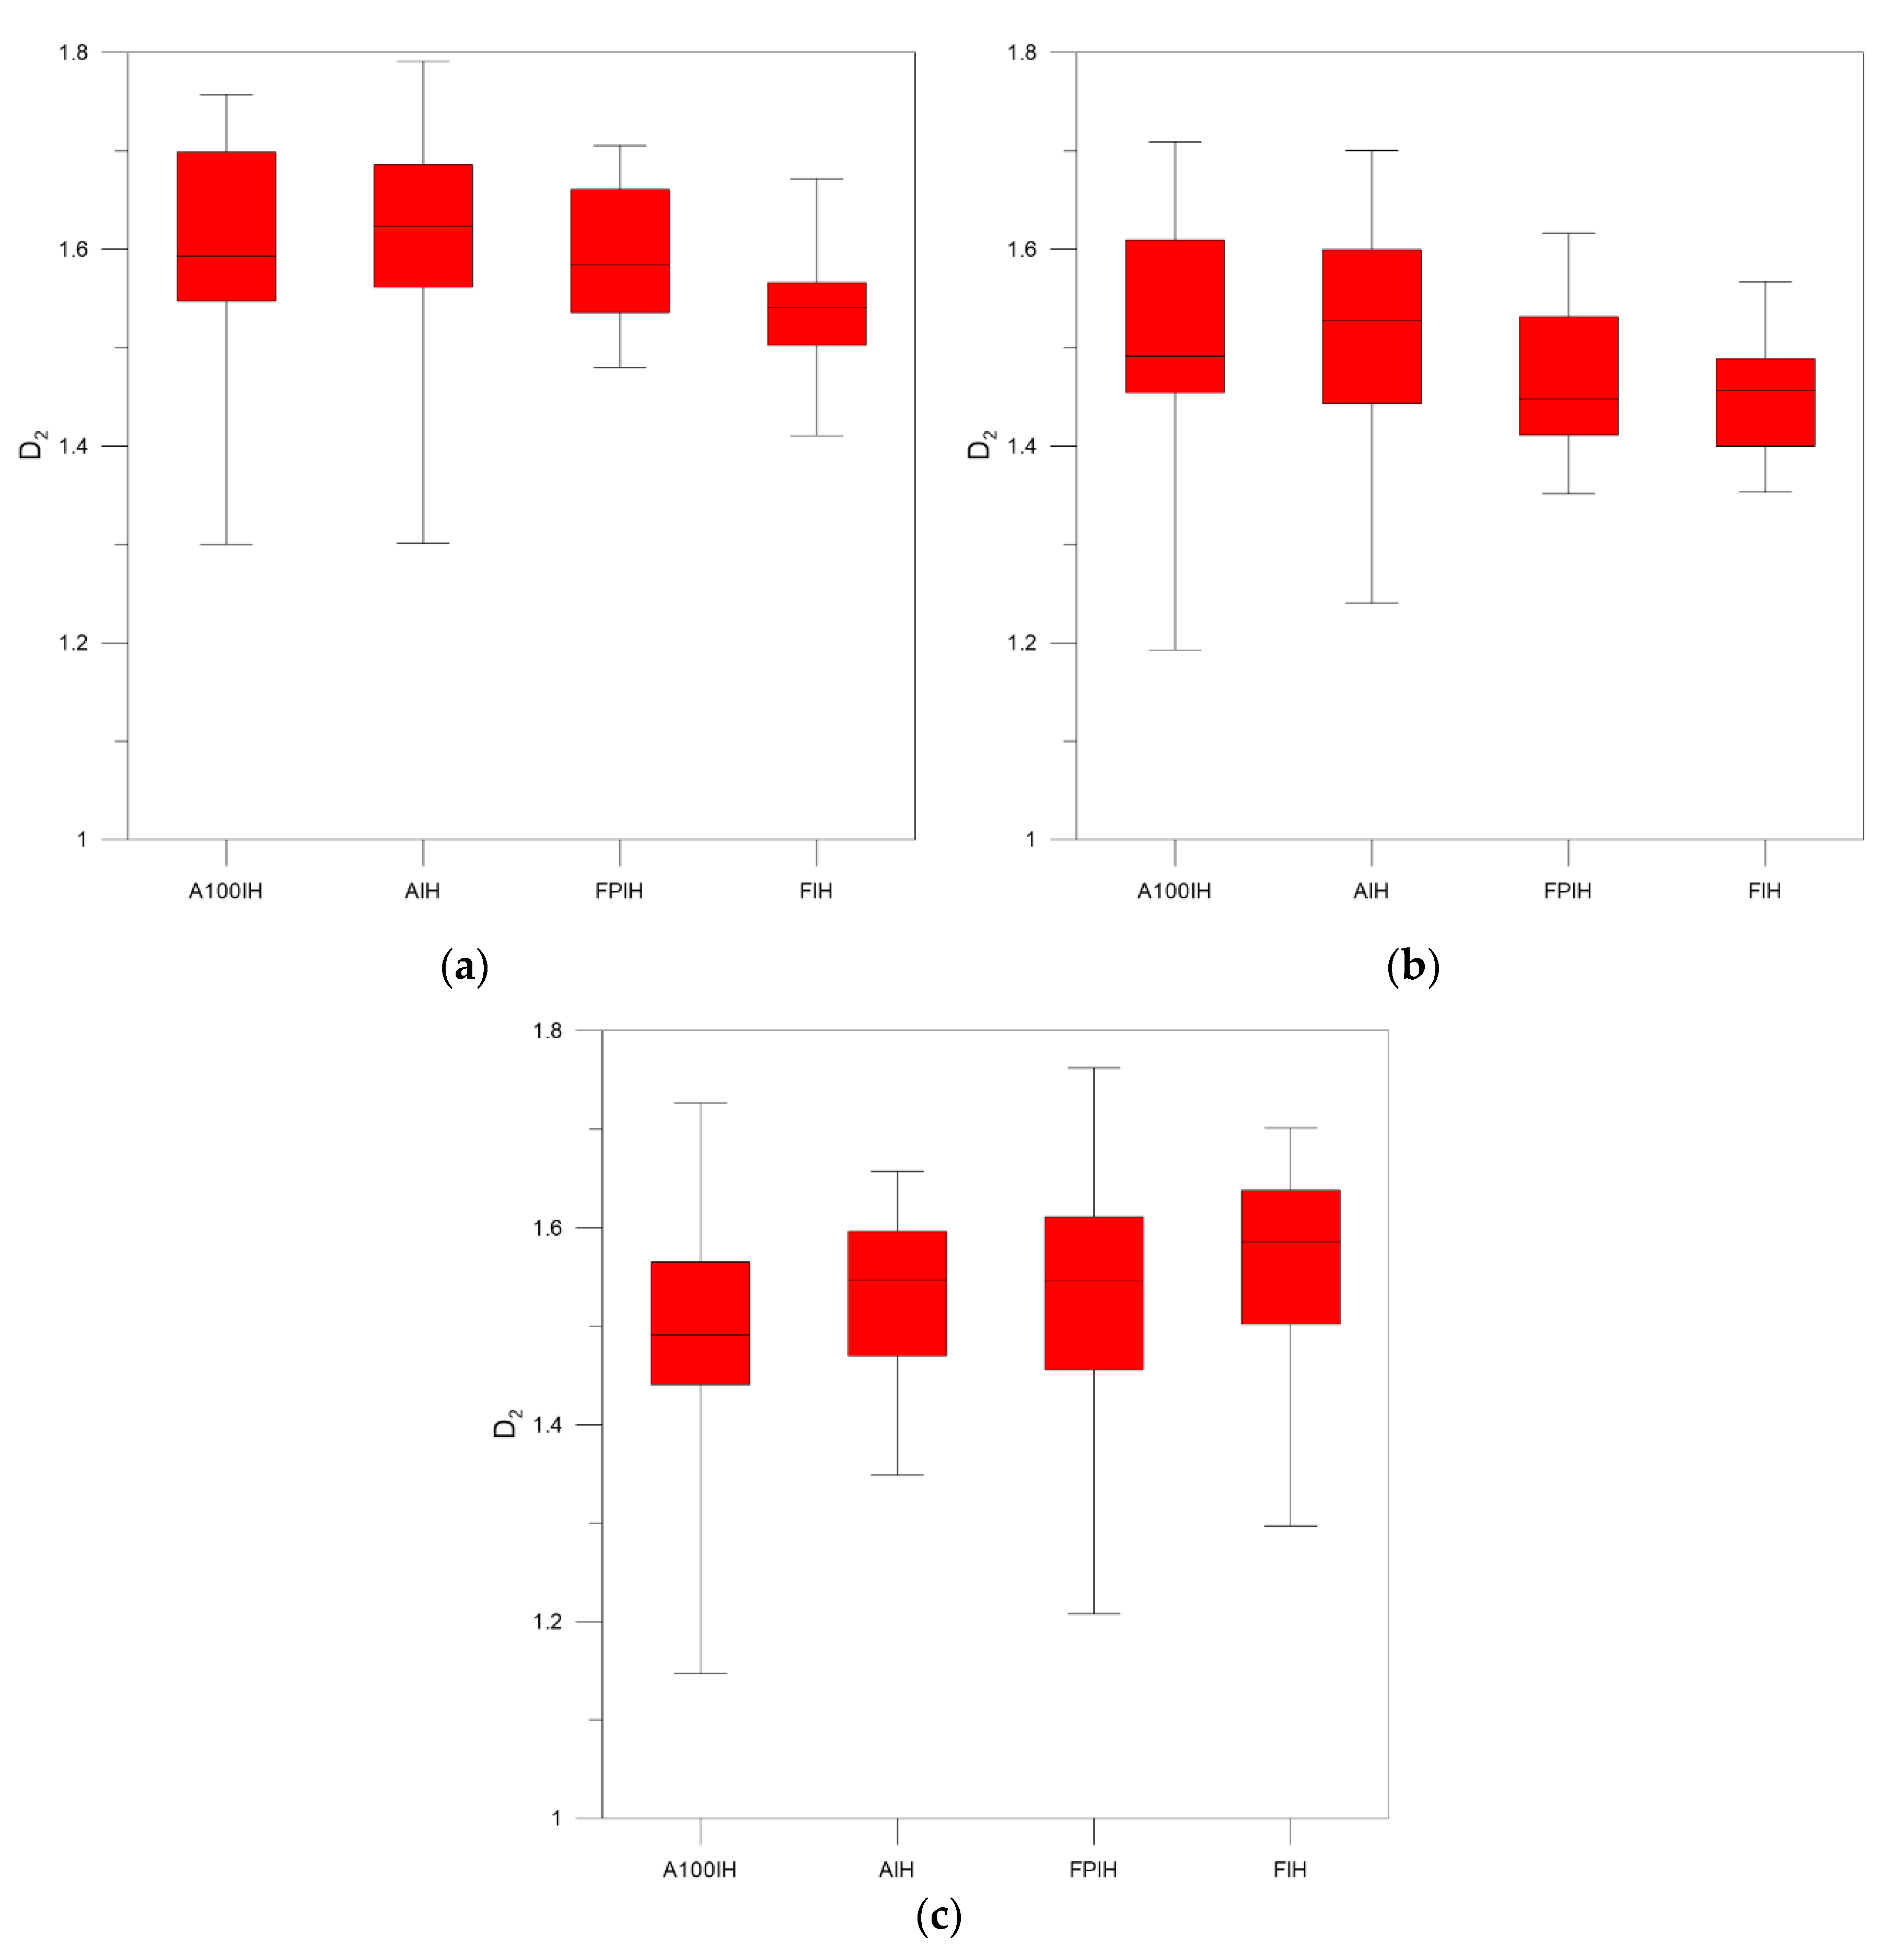
| Unfiltered Image | A100IH | 1.7991 | 0.0094 | 1.5967 | 0.0148 | 1.4885 | 0.0171 |
| AIH | 1.7609 | 0.0051 | 1.6184 | 0.0067 | 1.5364 | 0.0078 | |
| FPIH | 1.7520 | 0.0075 | 1.6011 | 0.0131 | 1.5269 | 0.0165 | |
| FIH | 1.7101 | 0.0120 | 1.6055 | 0.0143 | 1.5589 | 0.0148 | |
| High-Pass Filter 25 Pixels | A100IH | 1.8051 | 0.0048 | 1.6761 | 0.0146 | 1.5889 | 0.0209 |
| AIH | 1.7939 | 0.0053 | 1.6906 | 0.0113 | 1.6140 | 0.0154 | |
| FPIH | 1.7914 | 0.0043 | 1.6760 | 0.0092 | 1.5875 | 0.0139 | |
| FIH | 1.7456 | 0.0079 | 1.6174 | 0.0113 | 1.5410 | 0.0128 | |
| High-Pass Filter 50 Pixels | A100IH | 1.7650 | 0.0087 | 1.6021 | 0.0182 | 1.4978 | 0.0232 |
| AIH | 1.7400 | 0.0071 | 1.6043 | 0.0135 | 1.5147 | 0.0163 | |
| FPIH | 1.7324 | 0.0071 | 1.5747 | 0.0119 | 1.4714 | 0.0151 | |
| FIH | 1.6666 | 0.0118 | 1.5193 | 0.0122 | 1.4456 | 0.0118 | |
© 2019 by the authors. Licensee MDPI, Basel, Switzerland. This article is an open access article distributed under the terms and conditions of the Creative Commons Attribution (CC BY) license (http://creativecommons.org/licenses/by/4.0/).
Share and Cite
Perán-Sánchez, F.; Serrano, S.; Gutiérrez de Ravé, E.; Sánchez-López, E.; Cumplido, A.; Jiménez-Hornero, F.J. Digital Image Filtering Optimization Supporting Iberian Ham Quality Prediction. Foods 2020, 9, 25. https://doi.org/10.3390/foods9010025
Perán-Sánchez F, Serrano S, Gutiérrez de Ravé E, Sánchez-López E, Cumplido A, Jiménez-Hornero FJ. Digital Image Filtering Optimization Supporting Iberian Ham Quality Prediction. Foods. 2020; 9(1):25. https://doi.org/10.3390/foods9010025
Chicago/Turabian StylePerán-Sánchez, Francisco, Salud Serrano, Eduardo Gutiérrez de Ravé, Elena Sánchez-López, Ana Cumplido, and Francisco J. Jiménez-Hornero. 2020. "Digital Image Filtering Optimization Supporting Iberian Ham Quality Prediction" Foods 9, no. 1: 25. https://doi.org/10.3390/foods9010025
APA StylePerán-Sánchez, F., Serrano, S., Gutiérrez de Ravé, E., Sánchez-López, E., Cumplido, A., & Jiménez-Hornero, F. J. (2020). Digital Image Filtering Optimization Supporting Iberian Ham Quality Prediction. Foods, 9(1), 25. https://doi.org/10.3390/foods9010025