Article

Formulation and Preparation of Water-In-Oil-In-Water Emulsions Loaded with a Phenolic-Rich Inner Aqueous Phase by Application of High Energy Emulsification Methods

Department of Biotechnology and Food Science, University of Burgos, Plaza Misael Bañuelos s/n, 09001 Burgos, Spain
*
Author to whom correspondence should be addressed.
Foods 2020, 9(10), 1411; https://doi.org/10.3390/foods9101411
Submission received: 3 September 2020 / Revised: 30 September 2020 / Accepted: 2 October 2020 / Published: 5 October 2020

Abstract

:
Currently, industry is requesting proven techniques that allow the use of encapsulated polyphenols, rather than free molecules, to improve their stability and bioavailability. Response surface methodology (RSM) was applied in this work to determine the optimal composition and operating conditions for preparation of water-in-oil-in-water (W/O/W) emulsions loaded with phenolic rich inner aqueous phase from olive mill wastewater. A rotor-stator mixer, an ultrasonic homogenizer and a microfluidizer processor were tested in this study as high-energy emulsification methods. Optimum results were obtained by means of microfluidizer with 148 MPa and seven cycles input levels yielding droplets of 105.3 ± 3.2 nm in average size and 0.233 ± 0.020 of polydispersity index. ζ-potential, chemical and physical stability of the optimal W/O/W emulsion were also evaluated after storage. No droplet size growth or changes in stability and ζ-potential were observed. Furthermore, a satisfactory level of phenolics retention (68.6%) and antioxidant activity (89.5%) after 35 days of storage at room temperature makes it suitable for application in the food industry.

Graphical Abstract

1. Introduction

Emulsions are generally used for the encapsulation of bioactive compounds in aqueous solutions. They consist of at least two immiscible liquids (oil and water), one of them dispersed as small droplets in the other [1,2]. Typically, droplet diameters in food systems range from 0.1 to 100 μm [3]. Emulsions can be classified as oil-in-water (O/W) or water-in-oil (W/O) emulsions, depending on whether the dispersed phase is oil or water, respectively. Furthermore, there are several types of multiple emulsions, such as oil-in-water-in-oil (O/W/O) or water-in-oil-in-water (W/O/W) emulsions [4,5]. Emulsifiers are commonly added as stabilizers to obtain a kinetically stable system [6].
The formation, stability, and properties of emulsions depend on the characteristics (polarity, water solubility, viscosity, density, etc.) of the oil phase and the type and concentration of components present in the aqueous phase [2,7,8,9,10,11]. The choice of surfactant used as emulsifier is very important in the food industry because it must be able not only to create and stabilize the dispersed phase droplets, but also be biodegradable and nontoxic [12].
Several studies on encapsulation and delivery of polyphenols have been published in recent years [6,13,14,15,16,17,18,19,20,21,22,23,24,25,26,27,28]. The use of encapsulated polyphenols present in phenolic-rich extracts (e.g., green tea, mango peel, olive leaf or grape seed [27,28,29,30,31]) instead of free molecules improves both the stability and bioavailability of the molecules in vitro and in vivo [32,33] using single and multiple emulsions and nanoemulsions.
Emulsion preparation always involves the use of primary homogenization (direct preparation from two separate liquids) and/or secondary homogenization (droplet size reduction in existing emulsions) [33]. The control of homogenization conditions (temperature, pressure and cycles) is required to obtain emulsions with the desired properties (droplet size, stability, and encapsulation and delivery of biocompounds) [34].
Water-in-oil-in-water (W/O/W) double emulsions are formed by small water droplets within larger oil droplets dispersed in an aqueous continuous phase [2]. They are much better encapsulation systems for hydrophilic polyphenols than O/W emulsions, because the release of polyphenols can be prolonged and better controlled [4,33,35,36,37]. However, both O/W and W/O/W emulsions are highly susceptible to instability, mainly by flocculation, coalescence and Ostwald ripening, that will affect the delivery of encapsulated polyphenols. Reducing the droplet size greatly improves the stability and shelf life of emulsions [38,39], but it should be kept in mind that the very small size and therefore the very large specific surface area of the droplets in nanoemulsions may promote the chemical degradation of encapsulated compounds [40].
In this study, response surface methodology (RSM) was applied to determine the optimal composition and operating conditions for the preparation of W/O/W double emulsions loaded with phenolic rich inner aqueous phase from olive mill wastewater. The emulsion formulation was first optimized and then operating conditions to obtain a double nanoemulsion using high energy emulsification methods were examined. In addition to droplet size analysis, physical and chemical stability of double emulsions over time for the optimal formulation were also evaluated.

2. Materials and Methods

2.1. Materials

Olive mill wastewater (OMW) used in this study was obtained by means of a three-phase olive oil extraction and centrifugation system and was kindly provided by Mamalan Agro Industrial Company (Zanjan, Iran). Miglyol 812 oil, a mixture of C6-C12 medium chain triglycerides (MCT), was supplied by Sasol GmbH (Hamburg, Germany). Folin-Ciocalteu reagent and hydrochloric acid (37%) were purchased from VWR International Eurolab (Llinars del Vallès, Spain) and Acros Organics (Geel, Belgium), respectively. Sodium carbonate, methanol, gallic acid, 2,2-diphenyl-1-picrylhydrazyl (DPPH), 6-hydroxy-2,5,7,8-tetramethylchroman-2-carboxylic acid (Trolox), sorbitan monooleate (Span 80) and polyoxyethylene (20) sorbitan monooleate (Tween 80) were purchased from Sigma-Aldrich (Darmstadt, Germany). Milli-Q water (Millipore, St. Louis, MO, USA) was used in all samples.

2.2. Preparation of Phenolic Rich Olive Mill Aqueous Phase

OMW was first centrifuged (Eppendorf 5804, Hamburg, Germany) for 30 min at 4000 rpm in order to separate the remaining solid particles, obtaining a liquid phase with a pH value of 4.85 (GLP-21 pH-meter, Crison, Barcelona, Spain). Afterwards, based on the method described by Bazzarelli et al. [41], acidification with HCl (37%) was performed by 0.003% (v/w) addition to reach pH = 1.8. After 24 h, the pretreated OMW was used in a two-stage membrane treatment process including ultrafiltration (UF) followed by nanofiltration (NF).
Both UF and NF were performed in batch concentration mode using a stainless steel HP4750 high-pressure stirred cell of 300 mL capacity supplied by Sterlitech Corporation (Kent, WA, USA). For this purpose, an UF flat sheet polysulfone membrane (US100, 100 kDa, Microdyn-Nadir, Wiesbaden, Germany) was used and the permeate obtained from UF was entered to the same stirred cell module equipped with a NF flat sheet polyamide-thin film composite membrane (NF90, 200 Da, Dow Filmtec, Minneapolis, MN, USA). Transmembrane pressures of 5 bar and 10 bar for UF and NF processes, respectively, were supplied by a nitrogen cylinder. Membrane surface area was 14.6 cm2 and both UF and NF treatments were performed at room temperature. The retentate solution obtained by NF treatment was used as the inner aqueous phase in the optimal formulation of W/O/W nanoemulsions.

2.3. Preparation of Primary Emulsion (W/O)

W/O emulsions were prepared by mixing Miglyol 812 and Span 80 in amounts described by response surface methodology (RSM) and shown in Table 1. Then the aqueous dispersed phase was added dropwise and the mixture was stirred for 10 min at 500 rpm. The prepared W/O emulsions were immediately used as the dispersed phase in the preparation of W/O/W double emulsions.

2.4. Preparation of Double Emulsion (W/O/W)

W/O/W emulsions were prepared by the dropwise addition of the dispersed phase (W/O emulsion) to a continuous phase formed by Milli-Q water and the Tween 80 surfactant.
The primary goal for preparation of double emulsion was optimization of formulation. For this purpose, emulsification process was performed with 26 different compositions based on RSM experimental design (Table 1). The emulsification was performed by using a high intensity ultrasonic homogenizer, described below, for 6 min effective time, in 5 s pulses (5 s off and 5 s on) and 50% amplitude.
The second goal was emulsification of optimized formulation with different high energy methods in order to achieve the optimal operating conditions. A high speed blender (Miccra D9 equipped with a DS-5/K-1 rotor-stator, ART Prozess & Labortechnik, Mülheim, Germany), a high intensity ultrasonic homogenizer (Sonics VCX 500, 500 W, 20 kHz, Newtown, CT, USA) with a titanium alloy microtip probe of 3 mm diameter, and a microfluidizer high shear fluid processor (LM20, Microfluidics, Westwood, MA, USA) were the equipment used for the formation of W/O/W emulsions.

2.5. Droplet Size Analysis of the Emulsions

Droplet size distribution, mean droplet diameter and polydispersity index (PDI) of samples were measured by dynamic light scattering (DLS) using a Zetasizer Nano ZS apparatus (Malvern Instruments Ltd., Malvern, UK). Measurements were performed by triplicate at 25 °C. The PDI is a dimensionless measure of the width of the size distribution ranging from 0 to 1, a higher value being indicative of a broader distribution of particle size.

2.6. ζ-Potential

ζ-potential was also measured with the aforementioned Zetasizer Nano ZS apparatus, using the laser Doppler velocimetry technique. The measurement was conducted six times for each diluted sample at 25 °C. The ζ-potential was calculated using Henry’s equation and the Smoluchowski approximation.

2.7. Total Phenolic Content

Total phenolic content (TPC) of samples was measured using Folin-Ciocalteu standard method [42] with some modifications. Briefly, a standard calibration curve (R2 = 0.998) was prepared using gallic acid solution. 100 µL of sample was added to a test tube. Then 2.8 mL of distilled water, 2 mL of 7.5% sodium carbonate solution and 100 μL of Folin-Ciocalteu reagent were added to the test tube and mixed. After 60 min of incubation in darkness at room temperature, the absorbance was measured spectrophotometrically at 750 nm wavelength (U-2000 spectrophotometer, Hitachi, Tokyo, Japan). TPC was expressed as milligrams of gallic acid equivalents per liter of sample (mg GA/L).

2.8. Antioxidant Activity

Antioxidant activity (AA) of the samples was measured by the DPPH free radical scavenging activity method described by Shen et al. [43]. Briefly, 1 mg of DPPH reagent (2,2-diphenyl-1-picrylhydrazyl) was dissolved in 50 mL of methanol and stored in darkness at 4 °C for 4 h. In order to perform DPPH assay, 60 μL of sample were mixed with 2940 μL of DPPH reagent solution. For the control sample 60 μL of the solvent (in this case Milli-Q water) were used. The mixtures were allowed to stand in darkness at room temperature for 60 min. Then the absorbance was measured at 517 nm wavelength using the U-2000 spectrophotometer. A standard calibration curve (R2 = 0.995) was prepared using Trolox solution, and antioxidant activity was expressed as milligrams of Trolox equivalents per liter of sample (mg Trolox/L).

2.9. Chemical Stability Measurements

The percentage of phenolic compounds held within the aqueous phase after 35 days of storage at room temperature was measured following the method proposed by Regan and Mulvihill [44]. Thus, 3 g of optimal double emulsions were mixed with 3 g of phosphate buffer solution (pH 7) and centrifuged (Eppendorf 5804 centrifuge) at 4500 rpm for 90 min. Then, the lower phase was collected carefully for total phenolic content (TPC) and antioxidant activity (AA) analysis. The percentage of encapsulated compounds (E) was identified by using Equation (1):
E ( % ) = ( 1 C 2 C 1 ) × 100
where C2 is the concentration of phenolic compounds found in the aqueous phase after centrifugation and C1 is the initial concentration of phenolic compounds in the inner aqueous phase [22,44].

2.10. Physical Stability Measurements

Stability of W/O/W emulsions was measured in terms of their droplet growth ratio. Since emulsions tend to aggregate during storage, the droplet size of the emulsions was measured after 1 day and also 35 days after preparation. Two different storage conditions were evaluated: 4 °C and room temperature in darkness. Furthermore, optical characterization of the optimal double emulsion was done by static multiple light scattering (S-MLS) using a Turbiscan Lab Expert equipment (Formulaction Co., L’Union, France). The apparatus send a light beam from an electroluminescent diode (λ = 880 nm) through a cylindrical glass cell containing the sample. The emulsion sample (20 mL) without dilution was placed in a cylindrical glass cell and two synchronous optical sensors received the light transmitted through the sample (180° from the incident light) and the light backscattered by the droplets in the sample (45° from the incident light). The optical reading head scans the height of the sample in the cell (about 40 mm), by acquiring transmission and backscattering data every 40 μm. Transmitted and backscattered light were monitored as a function of time and cell height for 35 days at 25 °C [45,46].

2.11. Experimental Design

Data were analyzed by a response surface methodology (RSM) using a central composite design (CCD) of type 23 + star with two replicates of the central point. Statgraphics Centurion 18 software (Statgraphics Technologies, Inc., Warrenton, VA, USA) was used in this study. The effects of four variable factors, each with 3 levels, were studied on the droplet size of the nanoemulsions, this being the response variable (Y). The following factors were studied: aqueous phase content in W/O emulsions (X1: 4-20% w/w), surfactant content in W/O emulsions (X2: 4–20% w/w), W/O content in W/O/W emulsions (X3: 10–40% w/w), and surfactant content in W/O/W emulsions (X4: 4–10% w/w). The model generated 26 experimental runs shown in Table 1. The following second-degree polynomial equation (Equation (2)) was used to express the predicted response (Y) as a function of the independent variables (X1, X2, X3 and X4):
Y = a 0 + a 1 X 1 + a 2 X 2 + a 3 X 3 + a 4 X 4 + a 11 X 1 2 + a 12 X 1 X 2 + a 13 X 1 X 3 + a 14 X 1 X 4 + a 22 X 2 2 + a 23 X 2 X 3 + a 24 X 2 X 4 + a 33 X 3 2 + a 34 X 3 X 4 + a 44 X 4 2
where Y represents the response variable (droplet size in this case), a0 is a constant, and ai, aii and aij are the linear, quadratic and interactive coefficients, respectively.
After optimization of the W/O/W formulation, three experimental designs based on RSM were applied in order to determine the optimal emulsification method. The three aforementioned apparatus were tested: a rotor-stator mixer, an ultrasonic homogenizer and a microfluidizer processor. For this purpose, the CCD model generated 10 experimental runs with two replicates of the central point for each emulsification method, as shown in Table 2. The factors selected were rotation speed (X1: 11,000–29,000 rpm) and time (X2: 5–15 min) for the rotor-stator mixer, sonication time (X1: 5–15 min) and amplitude (X2: 20–60%) for ultrasonic homogenizer (while temperature (30 °C) and pulses (5 s off and 5 s on) were kept constant), and pressure (X1: 50–150 MPa) and number of cycles (X2: 1–11) for microfluidizer processor. The related data can be seen in Table 2. The following polynomial equation (Equation (3)) was used to express predicted responses (Y) as a function of the independent variables (X1, X2) under study:
Y = a 0 + a 1 X 1 + a 2 X 2 + a 3 X 3 + a 11 X 1 2 + a 22 X 2 2 + a 12 X 1 X 2
where Y represents the response variable (droplet size), a0 is a constant, and ai, aii and aij are the linear, quadratic and interactive coefficients, respectively.
The value of the factors and their effect on the response was determined by analysis of variance (ANOVA) and LSD (lesser significant difference) test. The model was adjusted by means of multiple linear regressions (MLR) and its validity was determined by ANOVA. The level of significance of each coefficient was evaluated through the values of the statistical parameters F and p (probability), with a confidence level of 95% [47].

3. Results and Discussion

3.1. Determination of W/O/W Double Emulsion Formulation

3.1.1. Model Fitting of Formulation

One response variable, the droplet size, and four experimental factors were used on the CCD for the optimization of formulation, as shown in Table 1. PDI of the LSD measurements is also shown in Table 1. The default model is quadratic with 15 coefficients, and it has been fit to the response variable. The R-squared statistic indicates that the model as fitted explains 80.57% of the variability in particle size. Three of the coefficients (a3, a4, and a34) of the quadratic polynomial model, Equation (2), have p-values less than 0.05, indicating that they are significantly different from zero at the 95% confidence level (Table 3). F-ratio values indicate that, for the range of studied variables, W/O content in W/O/W composition (X3) had stronger influence on the droplet size of the emulsions than the other independent variables. F-ratio values also indicate that the interaction with the highest incidence was the one occurring between the W/O concentration in W/O/W (X3) and surfactant content in W/O/W emulsion (X4).

3.1.2. Response Surface Analysis

In order to study the effect of the independent variables on the droplet size, surface responses of the quadratic polynomial model were generated by varying two of the independent variables within the experimental range while holding the other two constant at the central points. Figure 1a was generated by varying the surfactant content in W/O (X2) and surfactant content in W/O/W (X4), keeping constant the aqueous phase content in W/O (X1) and W/O content in W/O/W (X3) at their central values. It shows that increasing X4 in the lower levels of X2 causes an increase in emulsion particle size which is unfavorable, while for higher levels of X2 no considerable variations in particle size were observed. The effect of X1 and X4 on the particle size of the emulsion at a fixed content of X2 and X3 in their central values can be seen in Figure 1b. This figure shows that the increase in X1 and X4 hardly affects the particle size, except at the higher levels for both factors. The effect of X1 and X2 changing on particle size at the central values of X3 and X4 is depicted in Figure 1c. It shows that changes of X1 and X2 hardly affect the particle size. The effects of X3 and X4 variations on particle size at central values of X1 and X2 are shown in Figure 1d: a particle size increase is observed as X3 increases, being this effect greater at higher levels of X4. Figure 1e depicts the effect of X2 and X3 on particle size at central values of X1 and X4. Somehow, X2 variation hardly modifies the particle size, while increasing X3 has a significant effect on particle size growth. Figure 1f shows the effect of X1 and X3 variation on particle size at central levels of X2 and X4. A significant growth in particle size with the increase in X1 is only observed at the highest levels of X3 factor. It can be concluded that these figures prove the significance of X3 and X4 over other factors on particle size, as well as the interaction between both factors represented in Figure 1d.

3.1.3. Optimization of Double Emulsion Formulation

Following Stoke’s law, the stability of emulsion would increase as the droplet size decreases. Furthermore, the emulsion with higher resistance and control to creaming should also be homogenously distributed in particle size [48]. Numerical optimization of W/O/W emulsion formulation loaded with phenolic rich inner aqueous phase was carried out through design expert software, using desirability function. The W/O/W optimal formulation is expected to be those leading to a stable emulsion with minimum droplet size. Optimum formulation with 98.8% desirability was predicted for 20% (w/w) of aqueous phase content (X1), 4% (w/w) Span 80 surfactant content (X2), 10% (w/w) of aqueous phase (W/O) content (X3), and 4.6% (w/w) of Tween 80 surfactant content (X4). Because some of these optimal values are in the lower range of those selected in the CCD matrix, data extrapolation was performed. It was carried out through expert design software to expand factor input levels and to evaluate the possibility of achieving a better response beyond the levels considered. Formulation optimization process for main response (minimum particle size) yields 100% desirability for 20.3% (w/w) of aqueous phase content (X1), 3.7% (w/w) Span 80 surfactant content (X2), 9.8% (w/w) of aqueous phase (W/O) content (X3), and 4.1% (w/w) of Tween 80 surfactant content (X4). The predicted optimal response is very close to that obtained without extrapolation, which reveals the validity of the experimental design carried out. Three experimental replicates of the optimal formulation were made (20.3% X1, 3.7% X2, 9.8% X3 and 4.1% X4). The average droplet size of these samples was 232.5 ± 2.9 nm and the PDI was 0.274 ± 0.013, indicating a narrow distribution in droplet size. As expected, the results were very close to those obtained in run 16 of Table 1.

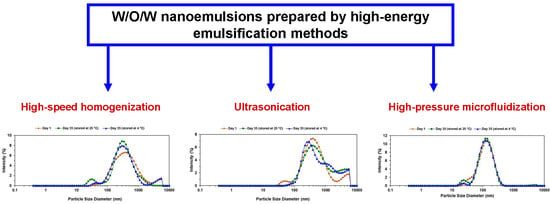
3.2. Effect of the High Energy Emulsification Method on Double Emulsion Droplet Size

Under suitable homogenization conditions, the final droplet size depends strongly on the characteristics of the oil and emulsifier used [34,49,50,51,52,53,54,55,56,57,58,59,60]. In general, small droplet sizes can be obtained more effectively by low-energy approaches than by high-energy approaches, but the former are more limited in the types of oils and emulsifiers that can be used [11].
Microfluidizers generate intense disruptive forces when two fast-moving emulsion streams impinge upon each other within an interaction chamber, leading to highly efficient droplet disruption [11]. Ultrasonic homogenizers use high-intensity ultrasonic waves to create the intense disruptive forces needed to fracture oil and water phases into very small droplets [53,61,62,63]. Ultrasound requires less energy expenditure than other high-energy methods, but sonicator probe-induced contamination is an important drawback. For scale-up applicability, commercial homogenizers based on sonication have been developed in which nanoemulsion is made to flow through a special column capable of producing ultrasonic waves [64]. Rotor-stator mixers are mechanical homogenizers especially used for high viscosity and high disperse phase volume fraction dispersions, e.g., in pharmaceuticals, cosmetics and food processing [65,66,67].
After obtaining the optimal W/O/W double emulsion formulation, the second aim of this work was to achieve the optimal operating conditions for its preparation. For this purpose, the following methods and factors were studied: ultrasonic homogenizer by varying time and amplitude, rotor-stator mixer by varying time and rotor speed, and microfluidizer processor by varying pressure and cycle numbers.

3.2.1. Model Fitting of Emulsification Method

Three experimental designs based on RSM were prepared by the application of rotor-stator mixer, ultrasonic homogenizer and microfluidizer processor. For this purpose, the CCD model generated 10 experimental runs with two replicates of central point for each emulsification apparatus. The average droplet size and PDI of the experiments corresponding to the CCD design is given in Table 2.
The default model is quadratic and statistical models have been fit to the response variables. The R-squared statistic indicates that the fitted model explains 84.23%, 56.13% and 86.18% of the variability in particle size for rotor-stator mixer, ultrasonic homogenizer and microfluidizer processor, respectively. Regarding the rotor-stator mixer, the F-ratio values indicate that the time factor (X2) has a stronger influence on the droplet size of the emulsions than the rotational speed factor (X1). In the ultrasonic homogenizer, the F-ratio values indicate that time (X1) has a slightly stronger influence on the droplet size of double emulsions than the amplitude (X2), whereas for microfluidizer processor pressure (X1) has considerable stronger influence on the droplet size of the emulsions than the number of cycles (X2), as shown in Table 4.
ANOVA showed the significance of the coefficients of the quadratic polynomial models (Equation (3)). Regarding the high speed mixer and microfluidizer, only one coefficient in each model has a p-value less than 0.05, indicating that it is significantly different to zero with 95% confidence level. Moreover, no coefficient has a p-value less than 0.05 for the ultrasonic homogenizer model (Table 4).

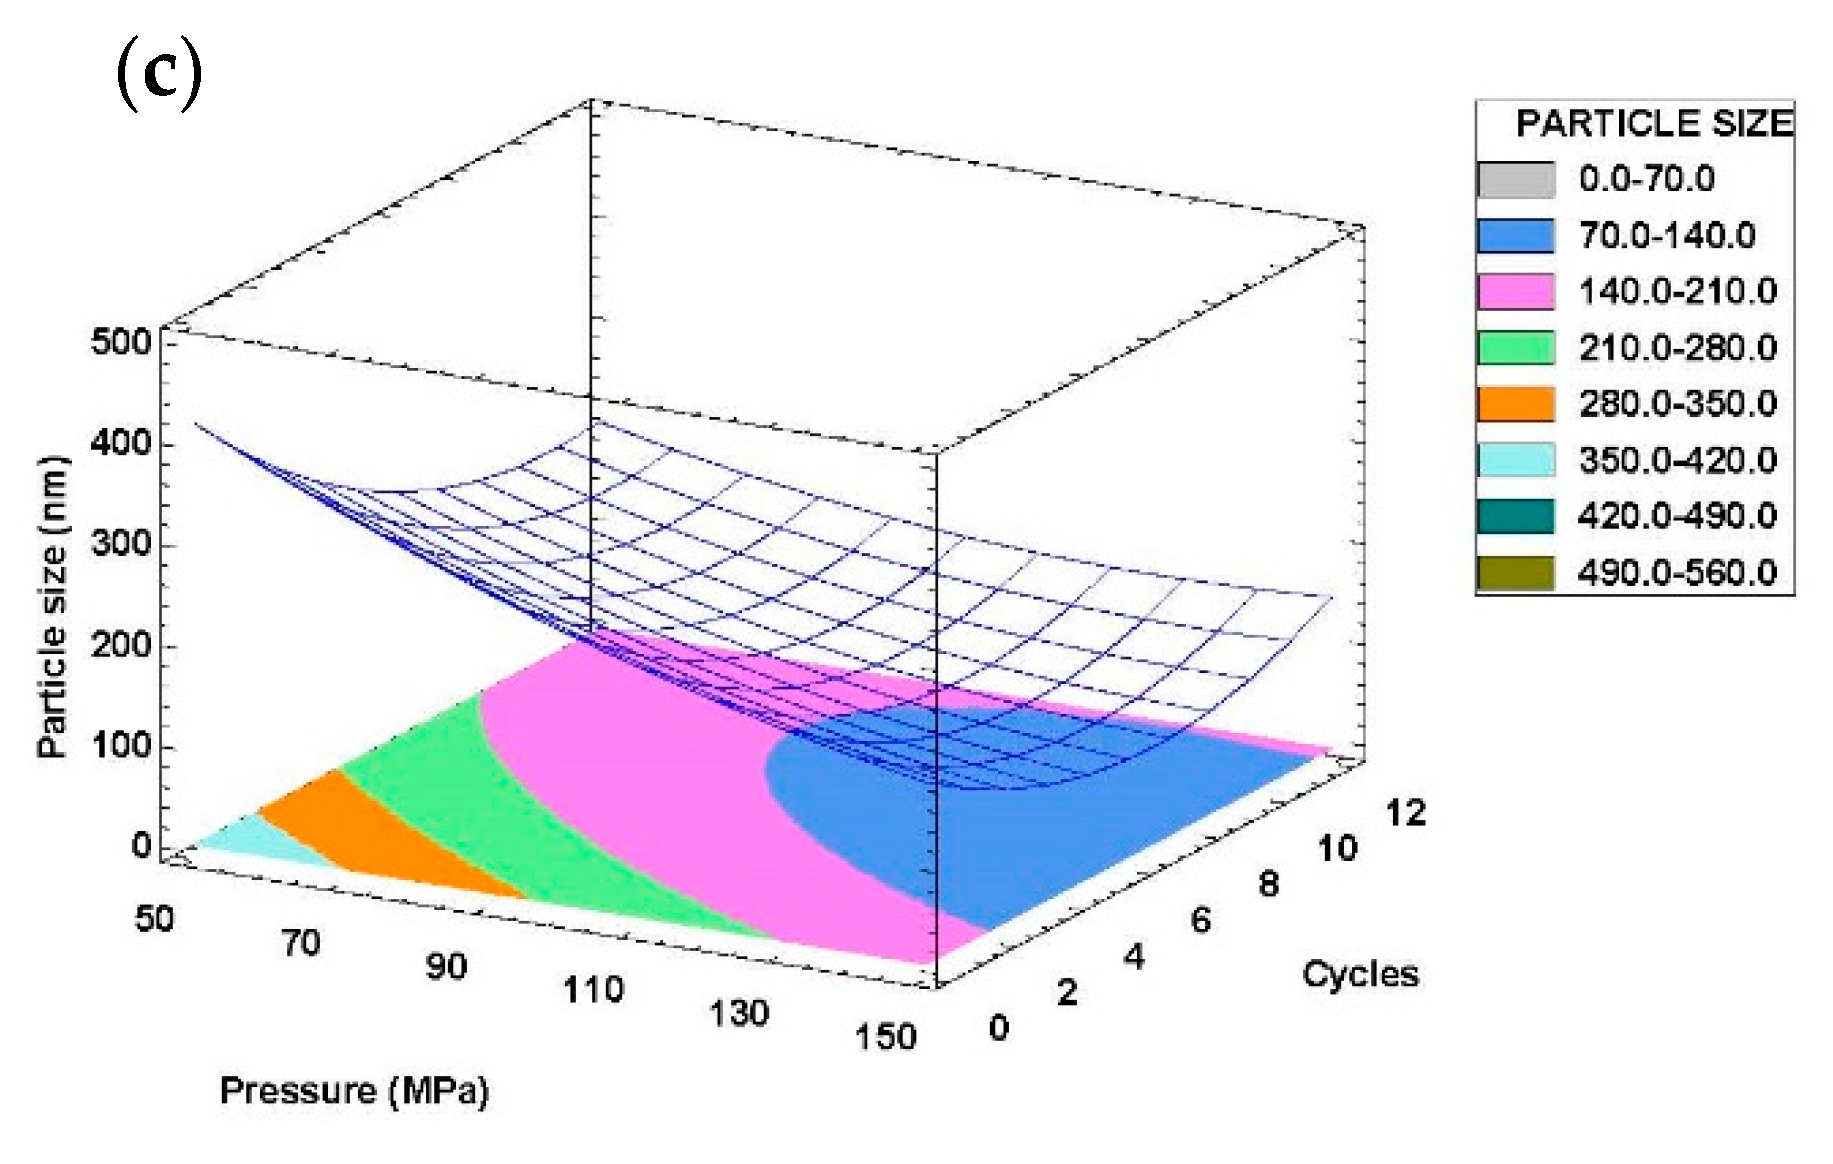
3.2.2. Response Surface Analysis

In order to study the effect of the emulsification methods and operating conditions on the droplet size, surface response plots of the quadratic polynomial model were generated. Figure 2a shows the effects of time and rotation speed in rotor-stator mixer on the emulsion droplet size. This figure shows that regardless of time level, 20,000–23,000 rpm is the optimal range for rotation speed. However, increasing time causes a continuous decrease in particle size which is favorable.
Figure 2b shows the interaction of time and amplitude on the achieved particle size in ultrasonic homogenizer; as it can be observed, amplitude hardly affects the particle size except for lower time levels. Furthermore, increasing time is significant on reducing particle size [68], as it causes an increase in temperature and cavitation intensity which accelerates the breakdown of droplets [57,69]. Somehow, the minimum particle size would be achieved for high time and lower amplitude levels.
In emulsions prepared by microfluidization the mean droplet diameter decreased with increasing homogenization pressure. It is in accordance with the study performed by Bai et al. [49], in which the mean droplet diameter decreased from around 213 to 150 nm as the homogenization pressure increased from 4 to 14 kbar. The decrease in droplet size with increasing pressure can be attributed to the increase in the magnitude of the disruptive forces generated within the homogenization chamber. Therefore double emulsions containing small droplets with a narrow particle size distribution can be produced by using microfluidizer processor. Figure 2c shows the interaction between pressure and cycles and their effect on particle size in microfluidizer emulsification tests. It can be observed that increasing pressure is significantly effective in decreasing particle size at middle cycle levels. Somehow, the minimum particle size can be achieved at 140–150 MPa pressure levels and 6–7 cycles.

3.2.3. Optimization of W/O/W Emulsion Preparation Conditions

The optimal conditions for the emulsification of the phenolic rich olive mill aqueous phase used in this work would be those leading to a stable double emulsion with minimum droplet size. Numerical optimization was performed through design expert software, using desirability function method. Regarding the W/O/W emulsification by rotor-stator mixer, the combined optimum ingredient levels for average particle size with 100% desirability were predicted to be achieved by emulsification at 20,000 rpm and 10 min. The predicted response at optimal value was 169.4 nm for particle size and polydispersity index (PDI) of 0.546, while observed results were 301.7 ± 12.1 nm and 0.439 ± 0.030 for particle size and PDI, respectively (Table 2). This large difference between predicted and observed results is due to imprecision in the average size for heterogeneous populations, as revealed the high PDI values.
In the case of optimal double emulsion prepared by ultrasonic homogenizer, response of 316.15 nm for particle size and PDI of 0.453 with 100% desirability was predicted while emulsification for 10 min at 20% amplitude was the combined optimum factor levels. The observed results, as shown in Table 2, were 338.5 ± 16.5 nm and 0.468 ± 0.021 for particle size and PDI, respectively. The narrow difference between the predicted and observed responses can verify the reliability of the ultrasonic assisted experimental design.
Best results were obtained with microfluidizer processor (Table 2). Numerical optimization performed by the design expert software predicted the optimal factor levels as 148 MPa of pressure and 7 cycles. The predicted response was 96.03 nm and 0.330 for particle size and PDI, respectively, whereas the observed responses for the mentioned factor levels were 105.3 ± 3.2 nm and 0.233 ± 0.020 for particle size and PDI, respectively. The narrow difference between the predicted and observed responses can also verify the reliability of the microfluidizer experimental design. Therefore, it can be concluded from the observed responses of optimal points from three emulsification methods that microfluidizer processor can be considered as the optimal method to achieve double emulsions with lower particle size and PDI.

3.3. Effect of the High Energy Emulsification Method on Double Emulsion Droplet Size

3.3.1. Stability Evaluations During Storage

The stability of the optimized double emulsions during their storage was evaluated by two methods. The first one was the comparative evaluation of droplet size (at room temperature and 4 °C) after 1 day and 35 days from emulsification in order to study the possible droplet growth. The second method was the backscattering (BS) evolution over time using Turbiscan Lab Expert apparatus to detect possible creaming, sedimentation, coalescence, flocculation or Ostwald ripening effect. Sedimentation, creaming and flocculation phenomena are unexpected, while those of coalescence and Ostwald ripening are more likely in the behavior of nanoemulsions [55].
Figure 3 shows the changes in droplet size between 1 day and 35 days of storage at 4 °C and room temperature. As it can be seen from Figure 3a, there is no considerable change in droplet size distribution of rotor-stator optimal W/O/W emulsion during the storage period while the intensity increased regardless of storage temperature condition. According to Figure 3b, which shows the droplet size distribution of emulsion prepared in ultrasonic homogenizer, average droplet size did not vary considerably but PDI was increased during the storage period. It is already mentioned the advantage of optimal W/O/W prepared by microfluidizer processor over other devices due to significantly better average droplet size. Furthermore, it showed the best droplet growth stability, as shown in Figure 3c: neither average droplet size nor PDI was changed after 35 days of storage at both 4 °C and room temperature. ζ-potential was also measured for this sample and the results indicated the stable value of −2.7 mV after 1 day and 35 days of emulsification.
There is a direct relationship between the increased emulsion droplet diameter and creaming, which is the formation of a lipid rich cream layer on the liquid surface as a result of the generation of big lipid droplets from smaller ones due to weak steric repulsions [18,33]. The coalescence process mainly takes place after double emulsion production and is thus stronger influenced by geometrical parameters, like inner and outer droplet sizes and dispersed phase concentrations, than by process parameters [59]. Both phenomena negatively affect emulsion stability, a very important factor determining its shelf life in commercial food and beverage applications [33,70].
BS profiles monitored during 35 days at 25 °C are depicted in Figure 4. As it is shown in Figure 4a,b, creaming instability occurs in emulsification by rotor-stator mixer and ultrasonic homogenizer. In contrast, the optimal W/O/W emulsion prepared by microfluidizer processor, Figure 4c, showed no considerable destabilization during the storage period and the sample was also visually stable, maintaining the same bluish color and semitransparent appearance after 35 days.
The rotor-stator mixer sample happened to exhibit visual creaming instability after a few hours of storage. Nevertheless, double emulsion obtained by using ultrasonic homogenizer showed a slightly larger droplet size but visual instability was not observed after the same storage period. Similar results were obtained by Einhorn-Stoll et al. [71], who observed a rapid destabilization of emulsions prepared by a single step with the Ultra-Turrax homogenizer. However, both chemical analysis and physical appearance indicated slight levels of creaming after few days of storage (Figure 4b). The shifting of the curves in Figure 4b,c could be attributed to the presence of air bubbles in cells or being a little shaken during each analysis.

3.3.2. Retention Properties of Nanoemulsions

As it was aforementioned the OMW used in this study was acidified to pH = 1.8 prior to membrane treatment in order to increase the content of selective bioactive compounds. The effect of pH on physical stability of different emulsions has been previously determined by several authors. Recently, the effect of pH on curcumin emulsions was investigated [72]. The authors found that more than 85% of curcumin was present after one month of storage at 37 °C when acidic conditions were employed. However, emulsions at pH 7.0, 7.4 and 8.0 contained only 62, 60, and 53% of the initial curcumin, respectively, thus demonstrating low stability. The effect of pH on the stability of emulsions stabilized by pectin-zein complexes has also been studied by Juttulapa et al. [73]: they found a greater cross-linking polymer network at pH 4 than pH 7, providing thus a smaller droplet size distribution.
Chemical stability of W/O/W emulsion was evaluated by measurements of retention levels of total phenolic content (TPC) and antioxidant activity (AA) after 35 days of storage at room temperature. TPC and AA measurements were done on the W/O/W double emulsion using the optimal formulation prepared by microfluidizer processor at 148 MPa and 7 cycles. Polyphenols are very sensitive compounds that can be easily degraded over time; therefore, their encapsulation in suitable double emulsions is an effective solution to prevent the degradation of phenolic compounds at a satisfactory level. The phenolic rich inner aqueous phase used in this study (after membrane treatments and before emulsification) had a TPC of 1399.8 ± 17.9 mg GA/L and 286.5 ± 0.3 mg Trolox/L of AA. After 35 days of storage at room temperature, 68.6% and 89.5% retentions of TPC and AA, respectively, were preserved.
In related studies, Akhtar et al. [74] reported 72% rutin and anthocyanin flavonoids retention after 10 days of storage in a W/O/W nanoemulsion system, but a polymodal droplet size distribution and inner phase leakage were observed. Gomes et al. [75] studied the retention of gallic acid in W/O and O/W emulsion systems with soybean oil, obtaining a 15% reduction in gallic acid content after 7 days of storage. Mohammadi et al. [22] reported 22% of phenolic compounds release by preparing double emulsions stabilized only with whey protein concentrate (WPC) containing olive leaf extract after 20 days. Furthermore, in the study performed by Gadkari et al. [18] it was noted that when the emulsions were stored at temperatures of 277 K, 300 K and 310 K, the green tea polyphenols present in emulsions were degraded by 4.25%, 15.97% and 22.78%, respectively. It can be concluded that the results obtained in the present study are in the usual retention range of phenols encapsulated in emulsions with applications for the food industry.

4. Conclusions

Response surface methodology was applied in this work to determine both the optimal composition and operating conditions for preparation of W/O/W nanoemulsion loaded with phenolic rich inner aqueous phase from olive mill wastewater. The optimal formulation for primary W/O emulsion was 20.3% (w/w) of phenolic rich aqueous solution as dispersed phase and 3.7% (w/w) of Span 80 in MCT oil as continuous phase. The optimal composition for W/O/W emulsion was 9.8% (w/w) of W/O as dispersed phase and 4.1% (w/w) of Tween 80 in Milli-Q water as external phase. Three methods were tested to obtain the optimal emulsification conditions: mechanical homogenization (rotor-stator mixer), ultrasonic homogenization and microfluidization. Optimum results were achieved by microfluidization at 148 MPa and 7 cycles input levels, obtaining a W/O/W nanoemulsion with an average droplet diameter of 105.3 ± 3.2 nm and a polydispersity index of 0.233 ± 0.02. Samples obtained by rotor-stator mixer and ultrasonic homogenizer showed creaming instability after few days of emulsification, while emulsion obtained by microfluidization showed no droplet size growth or changes in stability and ζ-potential after 35 days of storage at 25 °C. Furthermore, it showed a satisfactory level of phenolics retention (68.6%) and antioxidant activity (89.5%) after 35 days of storage, which are suitable for application in the food or pharmaceutical industry.

Author Contributions

Conceptualization, I.E. and J.M.B.; Formal analysis, S.M.N. and J.M.B.; Funding acquisition, I.E.; Investigation, S.M.N.; Methodology, J.M.B.; Project administration, I.E.; Resources, I.E.; Supervision, J.M.B.; Validation, S.M.N.; Writing—original draft, S.M.N.; Writing—review and editing, I.E. and J.M.B. All authors have read and agreed to the published version of the manuscript.

Funding

This research was funded by the Junta de Castilla y León (JCyL) and the European Regional Development Fund (ERDF) through grant number BU301P18, and also by the Agencia Estatal de Investigación (grant number PID2019-104950RB-I00/AEI/10.13039/501100011033).

Acknowledgments

The authors would like to thank Junta de Castilla y León and the European Social Fund (ESF) for the contract of Davinia Benito-Bedoya through the Youth Employment Initiative (YEI) programme.

Conflicts of Interest

The authors declare no conflict of interest. The funders had no role in the design of the study; in the collection, analyses, or interpretation of data; in the writing of the manuscript, or in the decision to publish the results.

References

  1. Friberg, S.; Larsson, K.; Sjöblom, J. Food Emulsions, 4th ed.; CRC Press: Boca Raton, FL, USA, 2003. [Google Scholar]
  2. McClements, D.J. Food Emulsions: Principles, Practices, and Techniques, 3rd ed.; CRC Press: Boca Raton, FL, USA, 2015. [Google Scholar]
  3. McClements, D.J.; Decker, E.A.; Park, Y.; Weiss, J. Structural Design Principles for Delivery of Bioactive Components in Nutraceuticals and Functional Foods. Crit. Rev. Food Sci. Nutr. 2009, 49, 577–606. [Google Scholar] [CrossRef] [PubMed]
  4. Bénichou, A.; Aserin, A.; Garti, N. Double emulsions stabilized with hybrids of natural polymers for entrapment and slow release of active matters. Adv. Colloid Interface Sci. 2004, 29–41. [Google Scholar] [CrossRef] [PubMed]
  5. Van Der Graaf, S.; Schroën, K.; Boom, R. Preparation of double emulsions by membrane emulsification—a review. J. Membr. Sci. 2005, 251, 7–15. [Google Scholar] [CrossRef]
  6. Fang, Z.; Bhandari, B. Encapsulation of polyphenols – a review. Trends Food Sci. Technol. 2010, 21, 510–523. [Google Scholar] [CrossRef]
  7. Anton, H.; Gayet, P.; Benoit, J.-P.; Saulnier, P. Nano-emulsions and nanocapsules by the PIT method: An investigation on the role of the temperature cycling on the emulsion phase inversion. Int. J. Pharm. 2007, 344, 44–52. [Google Scholar] [CrossRef]
  8. Anton, H.; Vandamme, T.F. The universality of low-energy nano-emulsification. Int. J. Pharm. 2009, 377, 142–147. [Google Scholar] [CrossRef]
  9. Tadros, T.; Izquierdo, P.; Esquena, J.; Solans, C. Formation and stability of nano-emulsions. Adv. Colloid Interface Sci. 2004, 303–318. [Google Scholar] [CrossRef]
  10. Wooster, T.J.; Golding, M.; Sanguansri, P. Impact of Oil Type on Nanoemulsion Formation and Ostwald Ripening Stability. Langmuir 2008, 24, 12758–12765. [Google Scholar] [CrossRef]
  11. McClements, D.J.; Rao, J. Food-Grade Nanoemulsions: Formulation, Fabrication, Properties, Performance, Biological Fate, and Potential Toxicity. Crit. Rev. Food Sci. Nutr. 2011, 51, 285–330. [Google Scholar] [CrossRef]
  12. Llinares, R.; Santos, J.; Trujillo-Cayado, L.A.; Ramírez, P.; Muñoz, J. Enhancing rosemary oil-in-water microfluidized nanoemulsion properties through formulation optimization by response surface methodology. LWT 2018, 97, 370–375. [Google Scholar] [CrossRef]
  13. Ahmad, M.; Mudgil, P.; Gani, A.; Hamed, F.; Masoodi, F.A.; Maqsood, S. Nano-encapsulation of catechin in starch nanoparticles: Characterization, release behavior and bioactivity retention during simulated in-vitro digestion. Food Chem. 2019, 270, 95–104. [Google Scholar] [CrossRef] [PubMed]
  14. Ballesteros, L.F.; Ramirez, M.J.; Orrego, C.E.; Teixeira, J.A.; Mussatto, S.I. Encapsulation of antioxidant phenolic compounds extracted from spent coffee grounds by freeze-drying and spray-drying using different coating materials. Food Chem. 2017, 237, 623–631. [Google Scholar] [CrossRef] [PubMed] [Green Version]
  15. Bhushani, J.A.; Kurrey, N.K.; Anandharamakrishnan, C. Nanoencapsulation of green tea catechins by electrospraying technique and its effect on controlled release and in-vitro permeability. J. Food Eng. 2017, 199, 82–92. [Google Scholar] [CrossRef]
  16. Alves, A.D.C.S.; Mainardes, R.M.; Khalil, N.M. Nanoencapsulation of gallic acid and evaluation of its cytotoxicity and antioxidant activity. Mater. Sci. Eng. C 2016, 60, 126–134. [Google Scholar] [CrossRef]
  17. Di Mattia, C.; Sacchetti, G.; Mastrocola, D.; Pittia, P.; Di Mattia, C.D. Effect of phenolic antioxidants on the dispersion state and chemical stability of olive oil O/W emulsions. Food Res. Int. 2009, 42, 1163–1170. [Google Scholar] [CrossRef]
  18. Gadkari, P.V.; Shashidhar, M.; Balaraman, M. Delivery of green tea catechins through Oil-in-Water (O/W) nanoemulsion and assessment of storage stability. J. Food Eng. 2017, 199, 65–76. [Google Scholar] [CrossRef]
  19. Ghanbari, R.; Anwar, F.; Alkharfy, K.M.; Gilani, A.H.; Saari, N. Valuable Nutrients and Functional Bioactives in Different Parts of Olive (Olea europaea L.)—A Review. Int. J. Mol. Sci. 2012, 13, 3291–3340. [Google Scholar] [CrossRef]
  20. Kumari, A.; Yadav, S.K.; Pakade, Y.B.; Singh, B.; Yadav, S.C. Development of biodegradable nanoparticles for delivery of quercetin. Colloids Surf. B Biointerfaces 2010, 80, 184–192. [Google Scholar] [CrossRef]
  21. Matos, M.; Gutiérrez, G.; Coca, J.; Pazos, C. Preparation of water-in-oil-in-water (W1/O/W2) double emulsions containing trans-resveratrol. Colloids Surf. A Physicochem. Eng. Asp. 2014, 442, 69–79. [Google Scholar] [CrossRef]
  22. Mohammadi, A.; Jafari, S.M.; Assadpour, E.; Esfanjani, A.F. Nano-encapsulation of olive leaf phenolic compounds through WPC–pectin complexes and evaluating their release rate. Int. J. Biol. Macromol. 2016, 82, 816–822. [Google Scholar] [CrossRef]
  23. Mohammadi, A.; Jafari, S.M.; Esfanjani, A.F.; Akhavan, S. Application of nano-encapsulated olive leaf extract in controlling the oxidative stability of soybean oil. Food Chem. 2016, 190, 513–519. [Google Scholar] [CrossRef] [PubMed]
  24. Pisoschi, A.M.; Pop, A.; Cimpeanu, C.; Turcuş, V.; Predoi, G.; Iordache, F. Nanoencapsulation techniques for compounds and products with antioxidant and antimicrobial activity—A critical view. Eur. J. Med. Chem. 2018, 157, 1326–1345. [Google Scholar] [CrossRef] [PubMed]
  25. Sari, T.; Mann, B.; Kumar, R.; Singh, R.; Sharma, R.; Bhardwaj, M.; Athira, S. Preparation and characterization of nanoemulsion encapsulating curcumin. Food Hydrocoll. 2015, 43, 540–546. [Google Scholar] [CrossRef]
  26. Tolun, A.; Altintas, Z.; Artik, N. Microencapsulation of grape polyphenols using maltodextrin and gum arabic as two alternative coating materials: Development and characterization. J. Biotechnol. 2016, 239, 23–33. [Google Scholar] [CrossRef] [PubMed]
  27. Tuyishime, M.A.; Matabaro, E.; Habinshuti, I.; Hitabatuma, A.; Korma, S.A.; Ali, A.H. Green tea polyphenols-proteins nanocomplexes foaming behavior, nanoemulsions and their applications. IJAIR 2016, 5, 149–156. [Google Scholar]
  28. Lu, W.; Kelly, A.L.; Miao, S. Emulsion-based encapsulation and delivery systems for polyphenols. Trends Food Sci. Technol. 2016, 47, 1–9. [Google Scholar] [CrossRef]
  29. Velderrain-Rodríguez, G.R.; Acevedo-Fani, A.; González-Aguilar, G.A.; Martín-Belloso, O. Encapsulation and stability of a phenolic-rich extract from mango peel within water-in-oil-in-water emulsions. J. Funct. Foods 2019, 56, 65–73. [Google Scholar] [CrossRef]
  30. Estévez, M.; Güell, C.; De Lamo-Castellví, S.; Ferrando, M. Encapsulation of grape seed phenolic-rich extract within W/O/W emulsions stabilized with complexed biopolymers: Evaluation of their stability and release. Food Chem. 2019, 272, 478–487. [Google Scholar] [CrossRef]
  31. Ye, Q.; Li, T.; Li, J.; Liu, L.; Dou, X.; Zhang, X. Development and evaluation of tea polyphenols loaded water in oil emulsion with zein as stabilizer. J. Drug Deliv. Sci. Technol. 2020, 56, 101528. [Google Scholar] [CrossRef]
  32. Ahmed, K.; Li, Y.; McClements, D.J.; Xiao, H. Nanoemulsion- and emulsion-based delivery systems for curcumin: Encapsulation and release properties. Food Chem. 2012, 132, 799–807. [Google Scholar] [CrossRef]
  33. McClements, D.J. Encapsulation, protection, and release of hydrophilic active components: Potential and limitations of colloidal delivery systems. Adv. Colloid Interface Sci. 2015, 219, 27–53. [Google Scholar] [CrossRef] [PubMed]
  34. Yuan, Y.; Gao, Y.; Zhao, J.; Mao, L. Characterization and stability evaluation of β-carotene nanoemulsions prepared by high pressure homogenization under various emulsifying conditions. Food Res. Int. 2008, 41, 61–68. [Google Scholar] [CrossRef]
  35. Garti, N.; Bisperink, C. Double emulsions: Progress and applications. Curr. Opin. Colloid Interface Sci. 1998, 3, 657–667. [Google Scholar] [CrossRef]
  36. Cournarie, F.; Savelli, M.-P.; Rosilio, V.; Bretez, F.; Vauthier, C.; Grossiord, J.-L.; Seiller, M. Insulin-loaded W/O/W multiple emulsions: Comparison of the performances of systems prepared with medium-chain-triglycerides and fish oil. Eur. J. Pharm. Biopharm. 2004, 58, 477–482. [Google Scholar] [CrossRef] [PubMed]
  37. McClements, D.J.; Decker, E.A.; Weiss, J. Emulsion-Based Delivery Systems for Lipophilic Bioactive Components. J. Food Sci. 2007, 72, R109–R124. [Google Scholar] [CrossRef]
  38. Li, Y.; Le Maux, S.; Xiao, H.; McClements, D.J. Emulsion-Based Delivery Systems for Tributyrin, a Potential Colon Cancer Preventative Agent. J. Agric. Food Chem. 2009, 57, 9243–9249. [Google Scholar] [CrossRef]
  39. Mun, S.; McClements, D.J. Influence of Interfacial Characteristics on Ostwald Ripening in Hydrocarbon Oil-in-Water Emulsions. Langmuir 2006, 22, 1551–1554. [Google Scholar] [CrossRef]
  40. Mao, L.; Xu, D.; Yang, J.; Yuan, F.; Gao, Y.; Zhao, J. Effects of small and large molecule emulsifiers on the characteristics of β-carotene nanoemulsions prepared by high pressure homogenization. Food Technol. Biotechnol. 2009, 47, 336–342. [Google Scholar]
  41. Bazzarelli, F.; Poerio, T.; Mazzei, R.; D’Agostino, N.; Giorno, L. Study of OMWWs suspended solids destabilization to improve membrane processes performance. Sep. Purif. Technol. 2015, 149, 183–189. [Google Scholar] [CrossRef]
  42. Hoff, J.E.; Singleton, K.I. A method for determination of tannins in foods by means of immobilized protein. J. Food Sci. 1977, 42, 1566–1569. [Google Scholar] [CrossRef]
  43. Shen, Q.; Zhang, B.; Xu, R.; Wang, Y.; Ding, X.; Li, P. Antioxidant activity in vitro of the selenium-contained protein from the Se-enriched Bifidobacterium animalis 01. Anaerobe 2010, 16, 380–386. [Google Scholar] [CrossRef] [PubMed]
  44. Regan, J.O.; Mulvihill, D.M. Water soluble inner aqueous phase markers as indicators of the encapsulation properties of water-in-oil-in-water emulsions stabilized with sodium caseinate. Food Hydrocoll. 2009, 23, 2339–2345. [Google Scholar] [CrossRef]
  45. Allende, D.; Cambiella, A.; Benito, J.M.; Pazos, C.; Coca, J. Destabilization-Enhanced Centrifugation of Metalworking Oil-in-Water Emulsions: Effect of Demulsifying Agents. Chem. Eng. Technol. 2008, 31, 1007–1014. [Google Scholar] [CrossRef]
  46. Rebolleda, S.; Sanz, M.T.; Benito, J.M.; Beltrán, S.; Escudero, I.; González-Sanjosé, M.L. Formulation and characterisation of wheat bran oil-in-water nanoemulsions. Food Chem. 2015, 167, 16–23. [Google Scholar] [CrossRef] [Green Version]
  47. Ghorbannezhad, P.; Bay, A.; Yolmeh, M.; Yadollahi, R.; Moghadam, J.Y. Optimization of coagulation–flocculation process for medium density fiberboard (MDF) wastewater through response surface methodology. Desalin. Water Treat. 2016, 57, 26916–26931. [Google Scholar] [CrossRef]
  48. Hu, Y.-T.; Ting, Y.; Hu, J.-Y.; Hsieh, S.-L. Techniques and methods to study functional characteristics of emulsion systems. J. Food Drug Anal. 2017, 25, 16–26. [Google Scholar] [CrossRef]
  49. Bai, L.; Huan, S.; Gu, J.; McClements, D.J. Fabrication of oil-in-water nanoemulsions by dual-channel microfluidization using natural emulsifiers: Saponins, phospholipids, proteins, and polysaccharides. Food Hydrocoll. 2016, 61, 703–711. [Google Scholar] [CrossRef] [Green Version]
  50. Ganesan, P.; Karthivashan, G.; Park, S.Y.; Kim, J.; Choi, D.-K. Microfluidization trends in the development of nanodelivery systems and applications in chronic disease treatments. Int. J. Nanomed. 2018, 13, 6109–6121. [Google Scholar] [CrossRef] [Green Version]
  51. Jafari, S.M.; He, Y.; Bhandari, B. Nano-Emulsion Production by Sonication and Microfluidization—A Comparison. Int. J. Food Prop. 2006, 9, 475–485. [Google Scholar] [CrossRef]
  52. Jafari, S.M.; He, Y.; Bhandari, B. Production of sub-micron emulsions by ultrasound and microfluidization techniques. J. Food Eng. 2007, 82, 478–488. [Google Scholar] [CrossRef]
  53. Kentish, S.; Wooster, T.; Ashokkumar, M.; Balachandran, S.; Mawson, R.; Simons, L. The use of ultrasonics for nanoemulsion preparation. Innov. Food Sci. Emerg. Technol. 2008, 9, 170–175. [Google Scholar] [CrossRef]
  54. Khadem, B.; Sheibat-Othman, N. Theoretical and Experimental Investigations of Double Emulsion Preparation by Ultrasonication. Ind. Eng. Chem. Res. 2019, 58, 8220–8230. [Google Scholar] [CrossRef]
  55. Kumar, H.; Kumar, V. Ultrasonication assisted formation and stability of water-in-oil nanoemulsions: Optimization and ternary diagram analysis. Ultrason. Sonochem. 2018, 49, 79–88. [Google Scholar] [CrossRef] [PubMed]
  56. Li, P.-H.; Chiang, B.-H. Process optimization and stability of d-limonene-in-water nanoemulsions prepared by ultrasonic emulsification using response surface methodology. Ultrason. Sonochem. 2012, 19, 192–197. [Google Scholar] [CrossRef]
  57. Mehmood, T.; Ahmad, A.; Ahmed, A.; Ahmed, Z. Optimization of olive oil based O/W nanoemulsions prepared through ultrasonic homogenization: A response surface methodology approach. Food Chem. 2017, 229, 790–796. [Google Scholar] [CrossRef]
  58. Qian, C.; McClements, D.J. Formation of nanoemulsions stabilized by model food-grade emulsifiers using high-pressure homogenization: Factors affecting particle size. Food Hydrocoll. 2011, 25, 1000–1008. [Google Scholar] [CrossRef]
  59. Schuch, A.; Wrenger, J.; Karbstein, H.P. Production of W/O/W double emulsions. Part II: Influence of emulsification device on release of water by coalescence. Colloids Surf. A Physicochem. Eng. Asp. 2014, 461, 344–351. [Google Scholar] [CrossRef]
  60. Yukuyama, M.N.; Kato, E.T.M.; De Araujo, G.L.B.; Löbenberg, R.; Monteiro, L.M.; Lourenço, F.R.; Bou-Chacra, N.A. Olive oil nanoemulsion preparation using high-pressure homogenization and d-phase emulsification—A design space approach. J. Drug Deliv. Sci. Technol. 2019, 49, 622–631. [Google Scholar] [CrossRef]
  61. Leong, T.; Wooster, T.; Kentish, S.; Ashokkumar, M. Minimising oil droplet size using ultrasonic emulsification. Ultrason. Sonochem. 2009, 16, 721–727. [Google Scholar] [CrossRef] [Green Version]
  62. Lin, C.-Y.; Chen, L.-W. Comparison of fuel properties and emission characteristics of two- and three-phase emulsions prepared by ultrasonically vibrating and mechanically homogenizing emulsification methods. Fuel 2008, 87, 2154–2161. [Google Scholar] [CrossRef]
  63. Đorđević, V.; Belščak-Cvitanović, A.; Drvenica, I.; Komes, D.; Nedovic, V.; Bugarski, B.M. Nanoscale nutrient delivery systems. In Nutrient Delivery. Nanotechnology in the Agri-Food Industry; Grumezescu, A.M., Ed.; Academic Press: London, UK, 2017; Volume 5, pp. 87–139. [Google Scholar]
  64. Singh, Y.; Meher, J.G.; Raval, K.; Khan, F.A.; Chaurasia, M.; Jain, N.K.; Chourasia, M.K. Nanoemulsion: Concepts, development and applications in drug delivery. J. Control. Release 2017, 252, 28–49. [Google Scholar] [CrossRef] [PubMed]
  65. Atiemo-Obeng, V.A.; Calabrese, R.V. Rotor-stator mixing devices. In Handbook of Industrial Mixing: Science and Practice, 1st ed.; Paul, E.L., Atiemo-Obeng, V.A., Kresta, S.M., Eds.; Wiley: Hoboken, NJ, USA, 2003; pp. 479–505. [Google Scholar]
  66. Mortensen, H.H.; Innings, F.; Håkansson, A. The effect of stator design on flowrate and velocity fields in a rotor-stator mixer—An experimental investigation. Chem. Eng. Res. Des. 2017, 121, 245–254. [Google Scholar] [CrossRef]
  67. Zhang, J.; Xu, S.; Li, W. High shear mixers: A review of typical applications and studies on power draw, flow pattern, energy dissipation and transfer properties. Chem. Eng. Process. Process. Intensif. 2012, 57, 25–41. [Google Scholar] [CrossRef]
  68. Anarjan, N.; Mirhosseini, H.; Baharin, B.S.; Tan, C.P. Effect of processing conditions on physicochemical properties of astaxanthin nanodispersions. Food Chem. 2010, 123, 477–483. [Google Scholar] [CrossRef]
  69. Gaikwad, S.G.; Pandit, A.B. Ultrasound emulsification: Effect of ultrasonic and physicochemical properties on dispersed phase volume and droplet size. Ultrason. Sonochem. 2008, 15, 554–563. [Google Scholar] [CrossRef]
  70. Yang, Y.; Leser, M.E.; Sher, A.A.; McClements, D.J. Formation and stability of emulsions using a natural small molecule surfactant: Quillaja saponin (Q-Naturale®). Food Hydrocoll. 2013, 30, 589–596. [Google Scholar] [CrossRef]
  71. Einhorn-Stoll, U.; Weiss, M.; Kunzek, H. Influence of the emulsion components and preparation method on the laboratory-scale preparation of o/w emulsions containing different types of dispersed phases and/or emulsifiers. Food/Nahrung 2002, 46, 294–301. [Google Scholar] [CrossRef]
  72. Kharat, M.; Du, Z.; Zhang, G.; McClements, D.J. Physical and Chemical Stability of Curcumin in Aqueous Solutions and Emulsions: Impact of pH, Temperature, and Molecular Environment. J. Agric. Food Chem. 2017, 65, 1525–1532. [Google Scholar] [CrossRef]
  73. Juttulapa, M.; Piriyaprasarth, S.; Sriamornsak, P. Effect of pH on Stability of Oil-in-Water Emulsions Stabilized by Pectin-Zein Complexes. Adv. Mater. Res. 2013, 747, 127–130. [Google Scholar] [CrossRef]
  74. Akhtar, M.; Murray, B.S.; Afeisume, E.I.; Khew, S.H. Encapsulation of flavonoid in multiple emulsion using spinning disc reactor technology. Food Hydrocoll. 2014, 34, 62–67. [Google Scholar] [CrossRef]
  75. Gomes, A.; Costa, A.L.R.; Perrechil, F.D.A.; Cunha, R.L. Role of the phases composition on the incorporation of gallic acid in O/W and W/O emulsions. J. Food Eng. 2016, 168, 205–214. [Google Scholar] [CrossRef] [Green Version]
Figure 1. Response surface plots of interactions between two input factors, while holding the other two constants at their central points, on particle size of W/O/W emulsions. X1: Aqueous phase content in W/O emulsion; X2: Surfactant content in W/O emulsion; X3: W/O content in W/O/W emulsion; X4: Surfactant content in W/O/W emulsion. (a) X2 vs. X4; (b) X1 vs. X4; (c) X1 vs. X2; (d) X3 vs. X4; (e) X2 vs. X3; (b) X1 vs. X3.
Foods 09 01411 g001
Figure 2. Response surface plots of interaction between emulsification input factors on particle size: (a) Rotor-stator mixer; (b) Ultrasonic homogenizer; (c) Microfluidizer processor.
Foods 09 01411 g002aFoods 09 01411 g002b
Figure 3. Particle size distribution of W/O/W emulsions (optimal formulations) prepared by three different devices after 1 day, and after 35 days of storage at room temperature and at 4 °C: (a) Rotor-stator mixer; (b) Ultrasonic homogenizer; (c) Microfluidizer processor.
Foods 09 01411 g003aFoods 09 01411 g003b
Figure 4. Backscattering profiles of W/O/W emulsions (optimal formulations) prepared by three devices through 35 days of storage at 25 °C: (a) Rotor-stator mixer; (b) Ultrasonic homogenizer; (c) Microfluidizer processor.
Foods 09 01411 g004aFoods 09 01411 g004b
Table 1. Experimental matrix of W/O/W formulations based in a central composite design (CCD).
RunIndependent VariablesResponse Variables
Aqueous Phase Content in W/O Emulsion
(X1, % w/w)
Surfactant Content in W/O Emulsion
(X2, % w/w)
W/O Content in W/O/W Emulsion
(X3, % w/w)
Surfactant Content in W/O/W Emulsion
(X4, % w/w)
Droplet Size (Y, nm)Polydispersity Index (PDI)
MeanSDMeanSD
11212107470.43.70.4260.043
22012257415.212.80.3570.068
3204404512.214.80.5610.033
42020104279.718.10.4390.015
5124257344.810.10.4860.032
620440101767119.50.5920.071
7420104388.76.30.4580.020
82041010470.34.70.4370.024
92020404478.319.10.6070.076
101212254316.213.00.5710.027
11441010363.511.40.3290.054
121220257371.87.40.4540.009
131212407768.917.30.6200.009
1420204010182858.30.5010.015
151212257585.819.10.5530.041
16204104242.65.60.2830.011
174201010330.010.40.2730.011
18420404923.624.30.6100.045
191212257857.413.30.4870.047
2044104232.32.50.3650.045
2120201010216.35.00.4600.032
224440101336246.60.9070.162
2312122510795.711.50.5140.017
244204010362.58.40.5740.018
25412257476.54.20.4670.006
2644404415.537.90.8720.190
W/O: water-in-oil. W/O/W: water-in-oil-in-water. SD: standard deviation.
Table 2. Experimental matrix based in a central composite design (CCD) for W/O/W double emulsion preparation by three high-energy emulsification methods.
RunRotor-Stator Mixer
Independent VariablesResponse Variables
Rotation Speed (X1, rpm)Time (X2, min)Droplet Size (Y, nm)Polydispersity Index (PDI)
MeanSDMeanSD
1290002735.638.10.9030.028
2200002468.24.00.5850.016
31100021255174.60.3920.147
4110006580.021.90.4870.032
51100010352.910.50.5540.076
6290006530.410.20.4840.029
72900010325.52.60.5390.007
82000010301.712.10.4390.030
9200006474.59.70.4570.032
10200006366.49.50.5510.019
RunUltrasonic Homogenizer
Independent VariablesResponse Variables
Time (X1, min)Amplitude (X2, %)Droplet Size (Y, nm)Polydispersity Index (PDI)
MeanSDMeanSD
111020338.516.40.4680.021
12660434.616.90.4360.010
13620388.12.40.4680.013
14220622.726.60.5650.101
15640460.43.90.4320.014
161040394.13.10.3680.042
171060375.21.40.3500.043
18260484.53.50.4290.009
19640667.56.80.4100.013
20240482.37.90.4290.004
RunMicrofluidizer Processor
Independent VariablesResponse Variables
Pressure (X1, MPa)Cycles (X2)Droplet Size (Y, nm)Polydispersity Index (PDI)
MeanSDMeanSD
21501393.57.60.3870.037
2215011120.81.90.3160.009
231501128.81.90.3780.007
241006105.81.20.4680.009
25506195.36.90.2810.017
261001253.48.20.4220.005
2710011118.51.30.4540.004
285011234.16.30.4240.032
291006187.32.80.3000.003
301506134.84.80.3870.053
Table 3. Analysis of variance of the regression coefficients of the quadratic model (Equation (2)) for the droplet size of W/O/W emulsions.
SourceRegression CoefficientsF-Ratiop-Value
a01029.33--
a1−46.54621.270.2841
a275.84510.170.6882
a3−47.527719.370.0011
a4−171.8889.000.0121
a11−0.4076120.020.8878
a120.1491210.020.8973
a130.8611982.050.1805
a146.085684.080.0683
a22−1.775580.400.5421
a23−0.1793230.090.7714
a24−4.86382.610.1345
a330.6565020.670.4309
a343.787645.560.0379
a449.334760.220.6509
Table 4. Analysis of variance of the regression coefficients of the quadratic Equation (3) for the W/O/W emulsion preparation by three high-energy emulsification methods.
SourceRotor-Stator MixerUltrasonic HomogenizerMicrofluidizer Processor
Regression CoefficientsF-Ratiop-ValueRegression CoefficientsF-Ratiop-ValueRegression CoefficientsF-Ratiop-Value
a02570.49--497.885--616.672--
a1−0.1397242.060.2242−20.31733.440.1372−4.5289213.050.0225
a2−166.55712.690.02357.396580.040.8426−48.20186.200.0675
a112.7045 × 10−63.900.1195−1.801340.170.69930.01079430.690.4523
a120.003416672.110.22030.5465620.680.45580.15142.330.2014
a223.050890.190.6827−0.1391790.640.46751.915432.180.2140

