Article

Prediction of the Limiting Flux and Its Correlation with the Reynolds Number during the Microfiltration of Skim Milk Using an Improved Model

by
Carolina Astudillo-Castro
1,*,
Andrés Cordova
1,*,
Vinka Oyanedel-Craver
2,
Carmen Soto-Maldonado
3,
Pedro Valencia
4,
Paola Henriquez
1 and
Rafael Jimenez-Flores
5
1
Department of Food Engineering, Pontificia Universidad Católica de Valparaíso, Waddintgon 716, Valparaíso 2360100, Chile
2
Civil and Environmental Engineering, College of Engineering, University of Rhode Island, Fascitelli Center for Advanced Engineering 317, 2 East Alumni Avenue, Kingston, RI 02881, USA
3
Regional Center for Studies in Healthy Food. Av. Universidad 330, Placilla, Sector Curauma, Valparaíso 2340000, Chile
4
Department of Chemical and Environmental Engineering, Universidad Técnica Federico Santa Maria Avenida España 1680, Valparaíso 2340000, Chile
5
Department of Food Science and Technology, The Ohio State University, Building 064, 2015 Fyffe Ct. Columbus, OH 43210, USA
*
Authors to whom correspondence should be addressed.
Foods 2020, 9(11), 1621; https://doi.org/10.3390/foods9111621
Submission received: 28 September 2020 / Revised: 28 October 2020 / Accepted: 2 November 2020 / Published: 6 November 2020
(This article belongs to the Special Issue Membrane Technology in Food Processing)

Abstract

:
Limiting flux (JL) determination is a critical issue for membrane processing. This work presents a modified exponential model for JL calculation, based on a previously published version. Our research focused on skim milk microfiltrations. The processing variables studied were the crossflow velocity (CFV), membrane hydraulic diameter (dh), temperature, and concentration factor, totaling 62 experimental runs. Results showed that, by adding a new parameter called minimum transmembrane pressure, the modified model not only improved the fit of the experimental data compared to the former version (R2 > 97.00%), but also revealed the existence of a minimum transmembrane pressure required to obtain flux (J). This result is observed as a small shift to the right on J versus transmembrane pressure curves, and this shift increases with the flow velocity. This fact was reported in other investigations, but so far has gone uninvestigated. The JL predicted values were correlated with the Reynolds number (Re) for each dh tested. Results showed that for a same Re; JL increased as dh decreased; in a wide range of Re within the turbulent regime. Finally, from dimensionless correlations; a unique expression JL = f (Re, dh) was obtained; predicting satisfactorily JL (R2 = 84.11%) for the whole set of experiments

1. Introduction

The fractionation of milk compounds prior to their use is an interesting approach to obtain a maximum profits in the milk industry [1]. This approach is a good use of the fractions obtained from the milk and provides a base for the development of new products with functional properties [2]. For example, to concentrate casein micelles by microfiltration (MF) involves obtaining “native whey” in permeate. This process is gaining more attention from dairy producers because it reduces the large amounts of whey obtained during cheese making. Instead, the production of “native whey” leads to a more sustainable process because the whey has not suffered chemical modifications. Unlike the whey obtained from cheese making, native whey has no presence of added mineral salts, enzymes, and other process additives [3] that hamper the filtration process. In addition, soluble proteins such as β-lactoglobulin and α-lactoalbumin are in their native state. Therefore, native whey is considered the best starting point for obtaining proteins with intact functional properties [4].
Due to the “flux paradox”, experimental research on membrane technology is a must to predict proper operating conditions because the gel polarization model underpredicts the flux by 1 to 2 orders of magnitude in colloidal suspensions, hindering the selection of operating conditions that meet the needs of large-scale production [5]. This fact has led for the proposal of several models in order to better understand the mechanisms underlying a microfiltration process and to obtain more accuracy in flux prediction [5,6,7,8]. However, most of these models are only valid for some specific particle sizes and/or laminar flow ranges. The last does not reflect the reality since it is well known that microfiltration processes in the dairy industry are principally carried out in a turbulent regime [9]. Therefore, extreme care must be exercised to check the specifics of the case and compare these with the respective model assumptions [10].
To address the abovementioned difficulties, prediction of the limiting flux (JL) is a practical way to set up membrane operations. JL corresponds to the maximum flux value obtained under some processing conditions that cannot be increased further by increasing the transmembrane pressure (ΔPT). A side effect of this condition is cake compaction, leading to fast flux decline and irreversible fouling [11]. On the other hand, the critical flux (Jc) theory proposed by Field et al. (1995) describes a condition where, despite reaching a lower initial flux value compared to the JL, irreversible fouling does not form on the membrane, and the operation performance is improved [12]. Based on this theory, Astudillo-Castro (2015) proposed an exponential model describing the nonlinear behavior of flux versus ΔPT [13]. The model predicts the JL and JC along with the ΔPT values at which they occur. It has been applied at different concentration factors and temperatures during the concentration of casein micelles by microfiltration [13] as well for the purification of prebiotic oligosaccharides by nanofiltration [14,15], providing an operational criterion that allows a stable flux. Regardless, it may be impractical to use this model at low ΔPT, as deviations between the experimental and predicted values have been observed. Normally, a shift in the J versus ΔPT curve is expected when the osmotic pressure of the retained particles begins to become significant, as occurs in nanofiltration processes. However, milk proteins that are retained in microfiltration with 0.1 to 0.2 μm membranes would not generate such an effect because its osmotic pressures is negligible, and therefore, it is assumed that if J = 0, then ΔPT = 0. However, it has been observed that the J versus ΔPT curves for milk microfiltration do not necessarily start at that origin, instead there is a slight shift to the right. This phenomenon can be also observed directly from results presented by other authors during skim milk microfiltrations, as well as by extrapolation of the curves at low ΔPT [9,16,17,18,19,20,21]. In practical terms this implies the existence of a minimal transmembrane pressure (ΔPT)min, even small, that must be applied to achieve permeate flux in microfiltrations. The best to our knowledge, this (ΔPT)min has not been reported.
On the other hand, since flux also strongly depends on the hydrodynamic conditions, another practical approach for predicting the JL is by its relationship with dimensionless numbers such as the Reynolds number (Re) [22]. Under laminar flow (Re < 2100) and constant CFV, a decrease in dh increases the wall shear stress, which may result in an increased JL; however, there is not a simple relationship between the wall shear stress as a function of the CFV and dh for turbulent flows such as those commonly used in skim milk microfiltration [20]. The unstable mixing of the fluid within the flow channel leads to differences in the way in which back-diffusion occurs [23]. When examining this subject further, the literature shows that previous researchers have found that the JL is a linear function of the Re, but those works were performed by keeping the dh constant [9,24,25]. Later, Hurt et al. (2015b) evaluated the effect of the dh (3 mm and 4 mm) with respect the JL obtained during skim milk microfiltration [20]. Results showed that the JL was significantly lower for the 3 mm compared with that for the 4 mm dh membranes, regardless of the protein concentration. Such differences were explained because different CFVs were used in each test (5.5 m/s and 7 m/s for the 3 and 4 mm dh membranes, respectively) since the system was set for operating with a constant pressure drop, resulting in the CFV as a function of the dh. Despite the value of this work, JL values were obtained by graphical representations instead of a model. The predictive JL exponential model [13] proposed by Astudillo-Castro (2015) turns out to be practical, but in light of the aforementioned discussion, several research questions are raised: What drive the displacement of the J vs. ΔPT curves resulting on the appearance of a ΔPT,min > 0? How much the robustness of the JL prediction improve by including ΔPT,min (offset in the x-axis) in the model previously reported? Despite several works that have related JL and Re by empirical equations, what is the relationship between JL and Re? Are a function type JL = f (Re) enough to describe the phenomena such as was previously reported?
The objectives of this research were to assess the modification of the JL prediction model proposed by Astudillo-Castro (2015) by considering the displacement of the operational curves from the origin on skim milk microfiltrations performed at different processing conditions, that is, flow, temperature, concentration factor, and dh. Our second objective was to study if there is a single relationship between the JL (obtained by the modified exponential model) and the Re regardless of the dh of the membrane and to identify the hydrodynamic parameters that cause this eventual relationship. Finally, we aimed to deliver a single expression for predicting the JL for the entire set of conditions studied.

2. Materials and Methods

2.1. Materials

A Membralox T1-70 module (Pall) for ceramic membranes (0.14 μm, Tami) of 10 mm in external diameter and 25 cm in length was used. Three hydraulic diameters (dh) of 2, 3.6, and 6 mm were tested, and the filtration areas for these membranes were 0.01090 m2, 0.00940 m2, and 0.00147 m2, respectively. The membrane area differences are due the number of channels in each one, as detailed in Table 1. Figure 1 shows the experimental setup.
Three rotatory vane pumps (Fluid o-Tech) were used in order to obtain different flows inside the module. The experiments were carried out under constant flow conditions. Table 1 shows the information on the flow (Q) provided by the pumps and the CFV. Additionally, an analytical balance (Radwag, WTB 2000, Radom, Poland) connected to a computer recorded the measuring permeate mass, in order to compute flux (J) in terms of L/(m2∙h).
The membrane resistance was calculated from plotting (J) flux versus ΔPT data collected from a tests using deionized water at 50 °C and fitted to the classic resistance model [26] in Equation (1):
J = Δ P T μ · R M
where ΔPT is the transmembrane pressure (Pa), μ is the water viscosity at 50 °C (Pa·s), and RM is the membrane resistance (m−1). For the new membranes, the average membrane resistance values were 4.57∙1011 m−1, 9.48∙1011 m−1, and 5.43∙1011 m−1 for the dh values of 2, 3.6, and 6 mm, respectively. Moreover, in Supplementary Materials (Table S1), the properties and Re for water are given.
Commercial low heat skimmed milk powder (Hormel Foods, MN, USA) was used for preparing all milk solutions with different total protein concentrations (1.5, 3, 4.5, and 9% w/w), thus representing different concentration factors (CF) of 0.5, 1.0, 1.5, and 3.0, respectively (for example, CF = 0.5 corresponds to diluted skim milk with half of the solids and casein concentration in regular skim milk). All of these milk solutions were reconstituted [13] with deionized water (<5 μS/cm). The average particle diameter for the reconstituted skim milk was determined using a laser diffraction (Mastersizer X, Malvern Instruments, 0.63 µm laser wavelength, MSX1, UK). Table 2 summarizes the physical properties of each milk solution. The density was measured as stated elsewhere, and the viscosity was determined on a DV - II + Pro Brookfield viscometer (Middleboro, MA, USA). For preventing the proliferation of microorganism’s, samples were treated with sodium azide (0.1%). All properties were measured in triplicate.

2.2. Experimental Runs

The equipment start-up and the flux versus transmembrane pressure curves were performed according to the methodology previously stated in detail [13]. The curves were performed with the skim milk solutions described above in the total recirculation mode to generate a pseudo-steady state. The permeate valve was manipulated manually, and the ΔPT was gradually increased setting different values in the studied range (Table 1). For each experimental point, the flux versus time curves were drawn until a pseudo-stationary value (J∞) of flux was reached. Each step lasted 30 min, and for all of the experiments, J∞ was achieved within 30 min. Once this value was reached, average of J was calculated.
Each one of the membranes’ dh of 2, 3.6, and 6 mm was treated as block of a Box-Bhenken experimental design with three central points considering the following factors: the flow rate (2.31, 5.31, and 7.85 L/min), the concentration factor (0.5, 1.0, and 1.5), and the temperature (40, 50, 60 °C), i.e., 18 runs per each membrane. To evaluate a wider range of Re values, some additional tests with 3.0 times the concentration factor in the mentioned flow rate and temperature ranges were also performed (Supplementary Materials Tables S2–S4). In this way, a total of 62 flux versus ΔPT curves were performed to relate the JL value with the Re.
After conducting each experiment, the membrane was rinsed with deionized water and cleaned using 1% (w/v) Ultrasil® 11 at 60 °C and 1 bar in full recirculation mode during the first 30 min and in the concentration mode in the last 30 min [13]. Subsequently, two or three rinse cycles (45 min each) were performed, until no detergent residues were detected [27]. The effectiveness of the membrane cleaning procedure was then checked by measuring and comparing its hydraulic resistance to the initial membrane resistance, both determined using Equation (1).

2.3. Mathematical Modeling and JL Prediction

Astudillo-Castro (2015) proposed that the variation in permeate flux, as a factor of the transmembrane pressure exerted, is proportional to the difference between the maximum permeate flux obtained experimentally (JL), and the flux observed at a certain ΔPT, according to the Equation (2):
d J d Δ P T = α · ( J L J ) ,
Where α is a proportionality constant. The modified model considered that when the transmembrane pressure reaches the minimum value, there is no permeate flux, i.e., a minimum transmembrane pressure ((ΔPT)Min), where ΔPT = (ΔPT)Min → J = Then, by variable separation and integration of Equation (2), can be obtained Equation (3):
0 J d J ( J L J ) = ( Δ P T ) M i n Δ P T α · d Δ P T .
Integrating Equation (3) results in the following equation.
ln ( J L J L J ) = α · ( Δ P T ( Δ P T ) M i n ) .
Then, when clearing the flux value, Equation (5) is obtained
J = J L ( 1 exp ( α · ( Δ P T ( Δ P T ) M i n ) ) ) .
If the Equation (5) is derivate and the resulting expression is evaluated at the intersection of axis of ΔPT ((ΔPT)Min,0), then the slope of a tangent straight line from this point is obtained (JL·α). Therefore, the tangent straight line to the curve to ((ΔPT)Min, 0) is represented by the equation
J = J L · α · ( Δ P T ( Δ P T ) M i n ) .
When ΔPT → ∞, the limit for Equation (6) gives
J = J L .
To find the value for the critical transmembrane pressure ((ΔPT)C)), Equations (6) and (7) were intersected, with the aim to obtain the point ((ΔPT)C, JC).
J L = J L · α · ( ( Δ P T ) C ( Δ P T ) M i n )
Then, rearranging the terms, the value of α value can be determinate by
α = 1 ( Δ P T ) C ( Δ P T ) M i n .
Finally, the modified exponential model is
J = J L · ( 1 exp ( ( Δ P T ( Δ P T ) M i n ( Δ P T ) C ( Δ P T ) M i n ) ) ) .
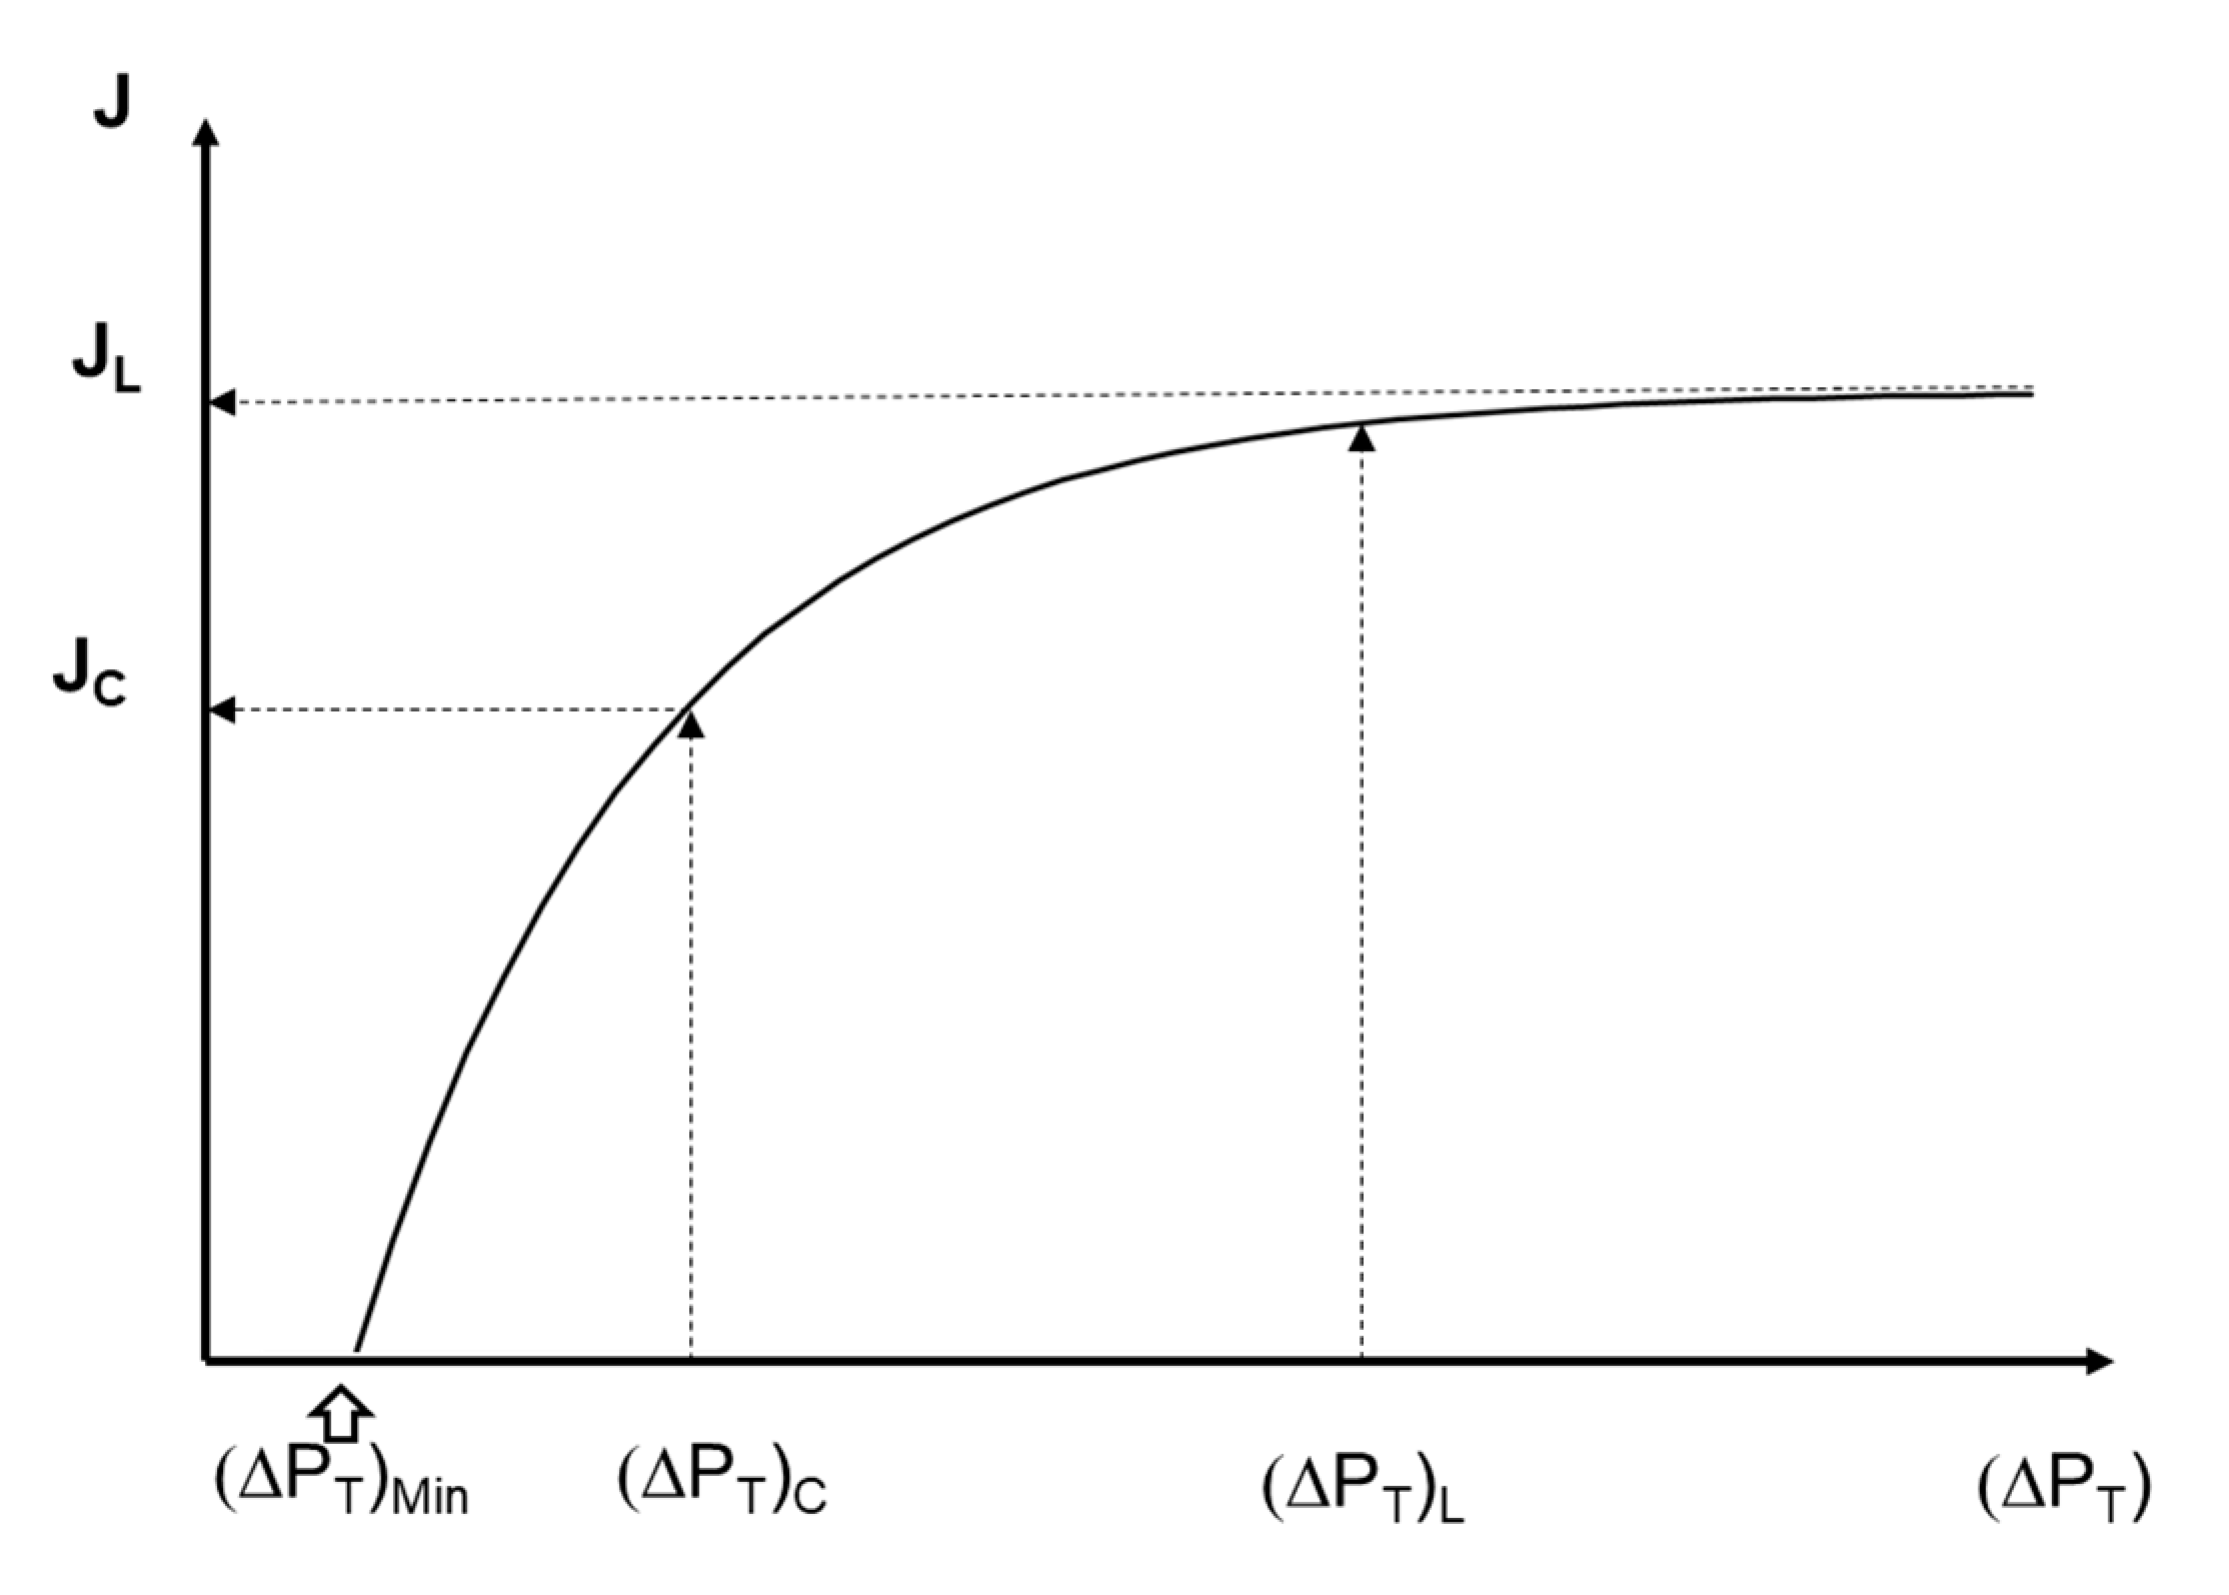
Additionally, by evaluating Equation (10) at ΔPT = (ΔPT)C, Equation (11) is obtained, and it directly relates the critical flux value with the limiting flux (JL).
J [ ( Δ P T ) C ]   =   J C = 0.632 · J L .
Finally, for the calculation of the limiting transmembrane pressure (ΔPT)L, it was considered that this value was reached when the flux value was at least 95% of the limiting flux value, resulting in:
( Δ P T ) L ( Δ P T ) M i n + 3 · ( ( Δ P T ) C ( Δ P T ) M i n ) .
Equation (10) has an asymptotic behavior towards JL as ΔPT is increased, and it is an easy way to obtain the critical flux JC, which is the point geometrically where a deviation from the linear relationship between the J and ΔPT appears [12]. For clarity, Figure 2 summarizes the parameters calculated by this model in a J versus ΔPT curve.

2.4. Chemical Analysis

The total protein contents (caseins and soluble proteins) in skim milk solutions were determined by the bicinchoninic acid method (BCA) using the Protein Research Reagents Kit (Pierce) [13]. The fraction of casein micelles was precipitated with acetic acid (1.2 M) until reaching their isoelectric point (pH = 4.6), and the supernatant containing the soluble proteins and lactose was subjected to precipitation with trichloroacetic acid [28,29]. The apparent rejection coefficients were calculated according to Suárez et al., (2006) [30].

2.5. Statistical Analyses

Data obtained from J versus ΔPT curves were fitted in each case to Equation (10) using nonlinear squares minimum computations [31]. Results were expressed as the average flux taken when pseudo-steady state was reached. The parameters fitted by this procedure were JL, (ΔPT)Min, and (ΔPT)C. The goodness-of-fit of the experimental data to the model was evaluated using ANOVA regression analysis (p < 0.05), by plotting experimental values against predicted values in order to determine statistics related to the goodness-of-fit, specifically, the coefficient of correlation (R2) and the root mean square error (RMSE). Since experimental flux data were not significantly different compared to the JL values predicted by Equation (10), the relationship between Re and JL values was determined by using the predicted ones. Moreover, Kolmogorov-Smirnov tests were performed for checking if the residues fitted to a normal distribution, validating the models and detecting biases [31,32]. The same statistical validations were performed for the other expressions here presented.

3. Results

3.1. Flux Versus ΔPT Curves: Effect of the Processing Conditions

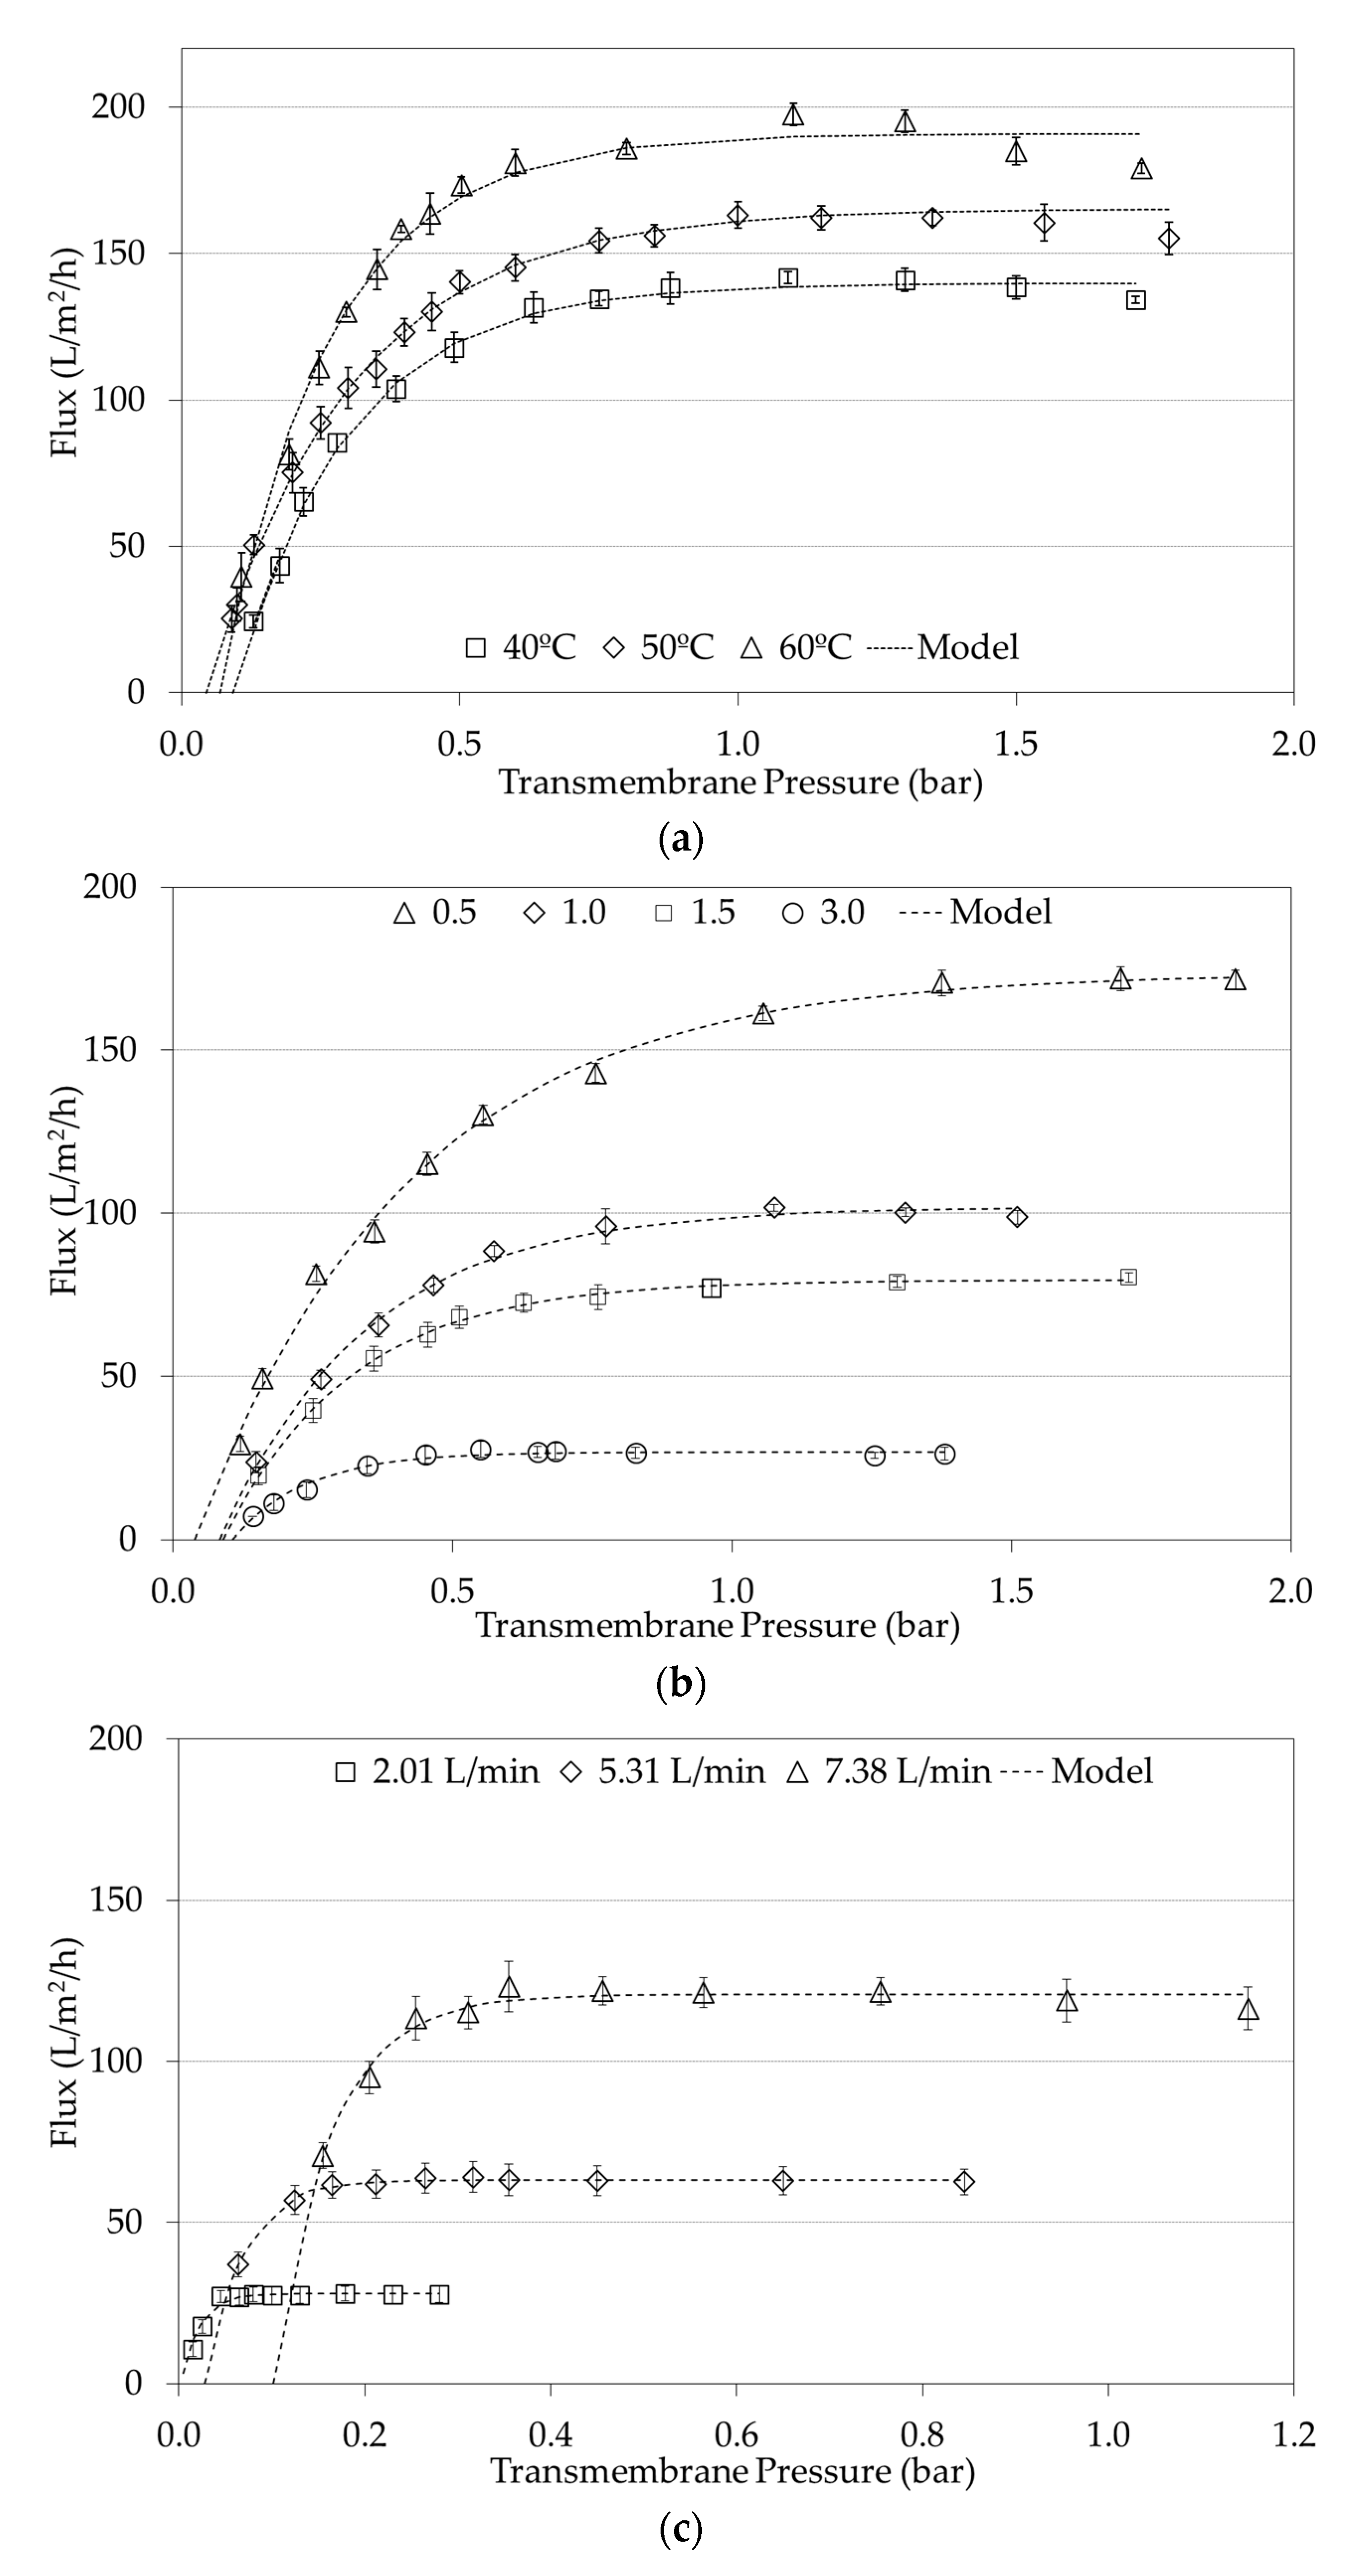
Since a total of 62 experiments were evaluated under a Box-Bhenken experimental scheme with complementary experiments, the Figures in this following section present the most illustrative results. Figure 3 considers the variables of temperature, concentration factor, and CFV, which had significant effects in the limiting flux [13,26]. The effect of temperature (40, 50, and 60 °C) is shown in Figure 3a for the membrane with a 6 mm using the concentration factor of 0.5 at 7.38 L/min. As expected, JL increases significantly with temperature [13], a phenomenon observed regardless of the dh, FC, and flow values studied. Figure 3b shows the effect of the concentration factor (0.5, 1.0, 1.5, and 3.0) on the J vs. ΔPT curves experiments conducted with a 3.6 mm dh membrane, while keeping the temperature (60 °C) and flow (7.38 L/min) constant. These results clearly show how JL decreases as the concentration factor increases, a situation well known to be involved in the membrane process due to an increased viscosity in the colloidal dispersion [13,33,34]. Finally, Figure 3c shows the effect of the flow (2.01, 5.31, and 7.38 L/min) on the J vs. ΔPT curves with the membrane with a 2 mm dh (temperature fixed at 60 °C and a concentration factor of 1.5). As expected, the increase in temperature and flow has a positive effect on the JL, but the concentration factor has a negative effect on this parameter [26,35]. Therefore, the JL can be modified by manipulating the hydrodynamic conditions, such as flow or CFV, and the system physico−chemical properties, i.e., concentration factor and temperature [13]. It is worth noting the fact that all curves are offset from the origin to some extent, regardless of the process conditions. However, this effect becomes even more noticeable as the flow increases by shifting the curves to the right. In terms of the modified model, this can be reflected in a higher (ΔPT)Min. For example, in Figure 3c the (ΔPT)Min at 2.01 L/min was 0.003 bar, but at 7.38 L/min it was 0.102 bar. The aforementioned values are also reported as fitted model parameters in Table 3. Besides, the osmotic pressure of casein micelles in milk is in the order of 1000 Pa [36,37], the existence of (ΔPT)Min would be consequence of an interaction among osmotic pressure and the CFV applied. In practical terms, this finding implies the existence of a minimal transmembrane pressure (ΔPT)min that must be applied to achieve permeate flux in microfiltrations. Despite this relatively small value, ((ΔPT)min) is important because the ΔPT used during the operation are also small; therefore, (ΔPT)min becomes numerically significant, as can be observed in Table 4 (see Section 3.3) when is compared with (ΔPT)C.
The above agrees with the well-known effect of increased flow resulting in increased CFV, the creation of turbulence, and changes in the hydrodynamic conditions [38,39], with the consequence of reducing membrane fouling [40]. An increased turbulence in turn increases the wall shear stress, increasing the back transport of particles to the bulk. Therefore, a minimum transmembrane pressure might be required, so that the flux of particles toward the membrane is greater than the back transport from the membrane, allowing the flux obtention. In summary, the higher the feed flow was, the greater the (ΔPT)Min value required to obtain permeate flux. This finding can be observed in all the curves of Figure 3, confirming the need to modify the model previously published by Astudillo-Castro (2015) in order to improve the fitting of data and the accuracy in the predicted JL.

3.2. Effect of the Processing Conditions on the Protein Stability and Rejection

Owing to the stability of the proteins under the rheological conditions assayed, it was found that these conditions would not be sufficient to produce significant alterations in the whey proteins, nor would there be an effect due to the passage of milk into the pumps. For example, under high CFV and temperature levels (e.g., 4.64 m/s and 60 °C), the 7.7% of the whey proteins were denatured after 180 min of operation, while at 40 °C, no significant changes (p < 0.05) were observed (Supplementary Materials Figure S1). Therefore, a low whey protein denaturation effect was due to the increase in temperature instead of the CFV.
On the other hand, high casein micelle retention and low retention for soluble proteins are expected during skim milk microfiltration with membranes of 0.14 μm. In all experiments, the casein micelle apparent rejection coefficient was higher than 99.90% regardless of the experimental set up, probably caused by the average particle diameter of 0.24 µm for the reconstituted skim milk. Besides, the lowest soluble protein rejection was achieved at 60 °C at low ΔPT. For example, at ΔPT lower than 0.5 bar and 60 °C, the apparent retention coefficient was in the range of 20 to 40%, which was expected for this kind of microfiltration [25,41,42].

3.3. Modified Exponential Model for JL Prediction

Table 3 shows an example of the fitted parameters for the modified exponential model (Equation (10)) for 13 of the 62 performed, according to the curves shown in Figure 3 and Figure 4. All curves were fitted to the model with R2 > 97%. It is worth noting that for a good fit to Equation (10), the points of the J versus ΔPT curve must be evenly distributed below and above the JL value as shown in Figure 3. That means that the ΔPT values must be increased to ensure completely encompassing the area limited by mass transfer. Additionally, since the model has 3 parameters to be adjusted, it is desirable that each curve has at least 6 experimental points (which is the most observable case in literature) improving the robustness of the prediction model [31]. Hence, the addition of the parameter (ΔPT)Min to the original exponential model improved data fit for the modified one, without significantly affecting the model parsimony.
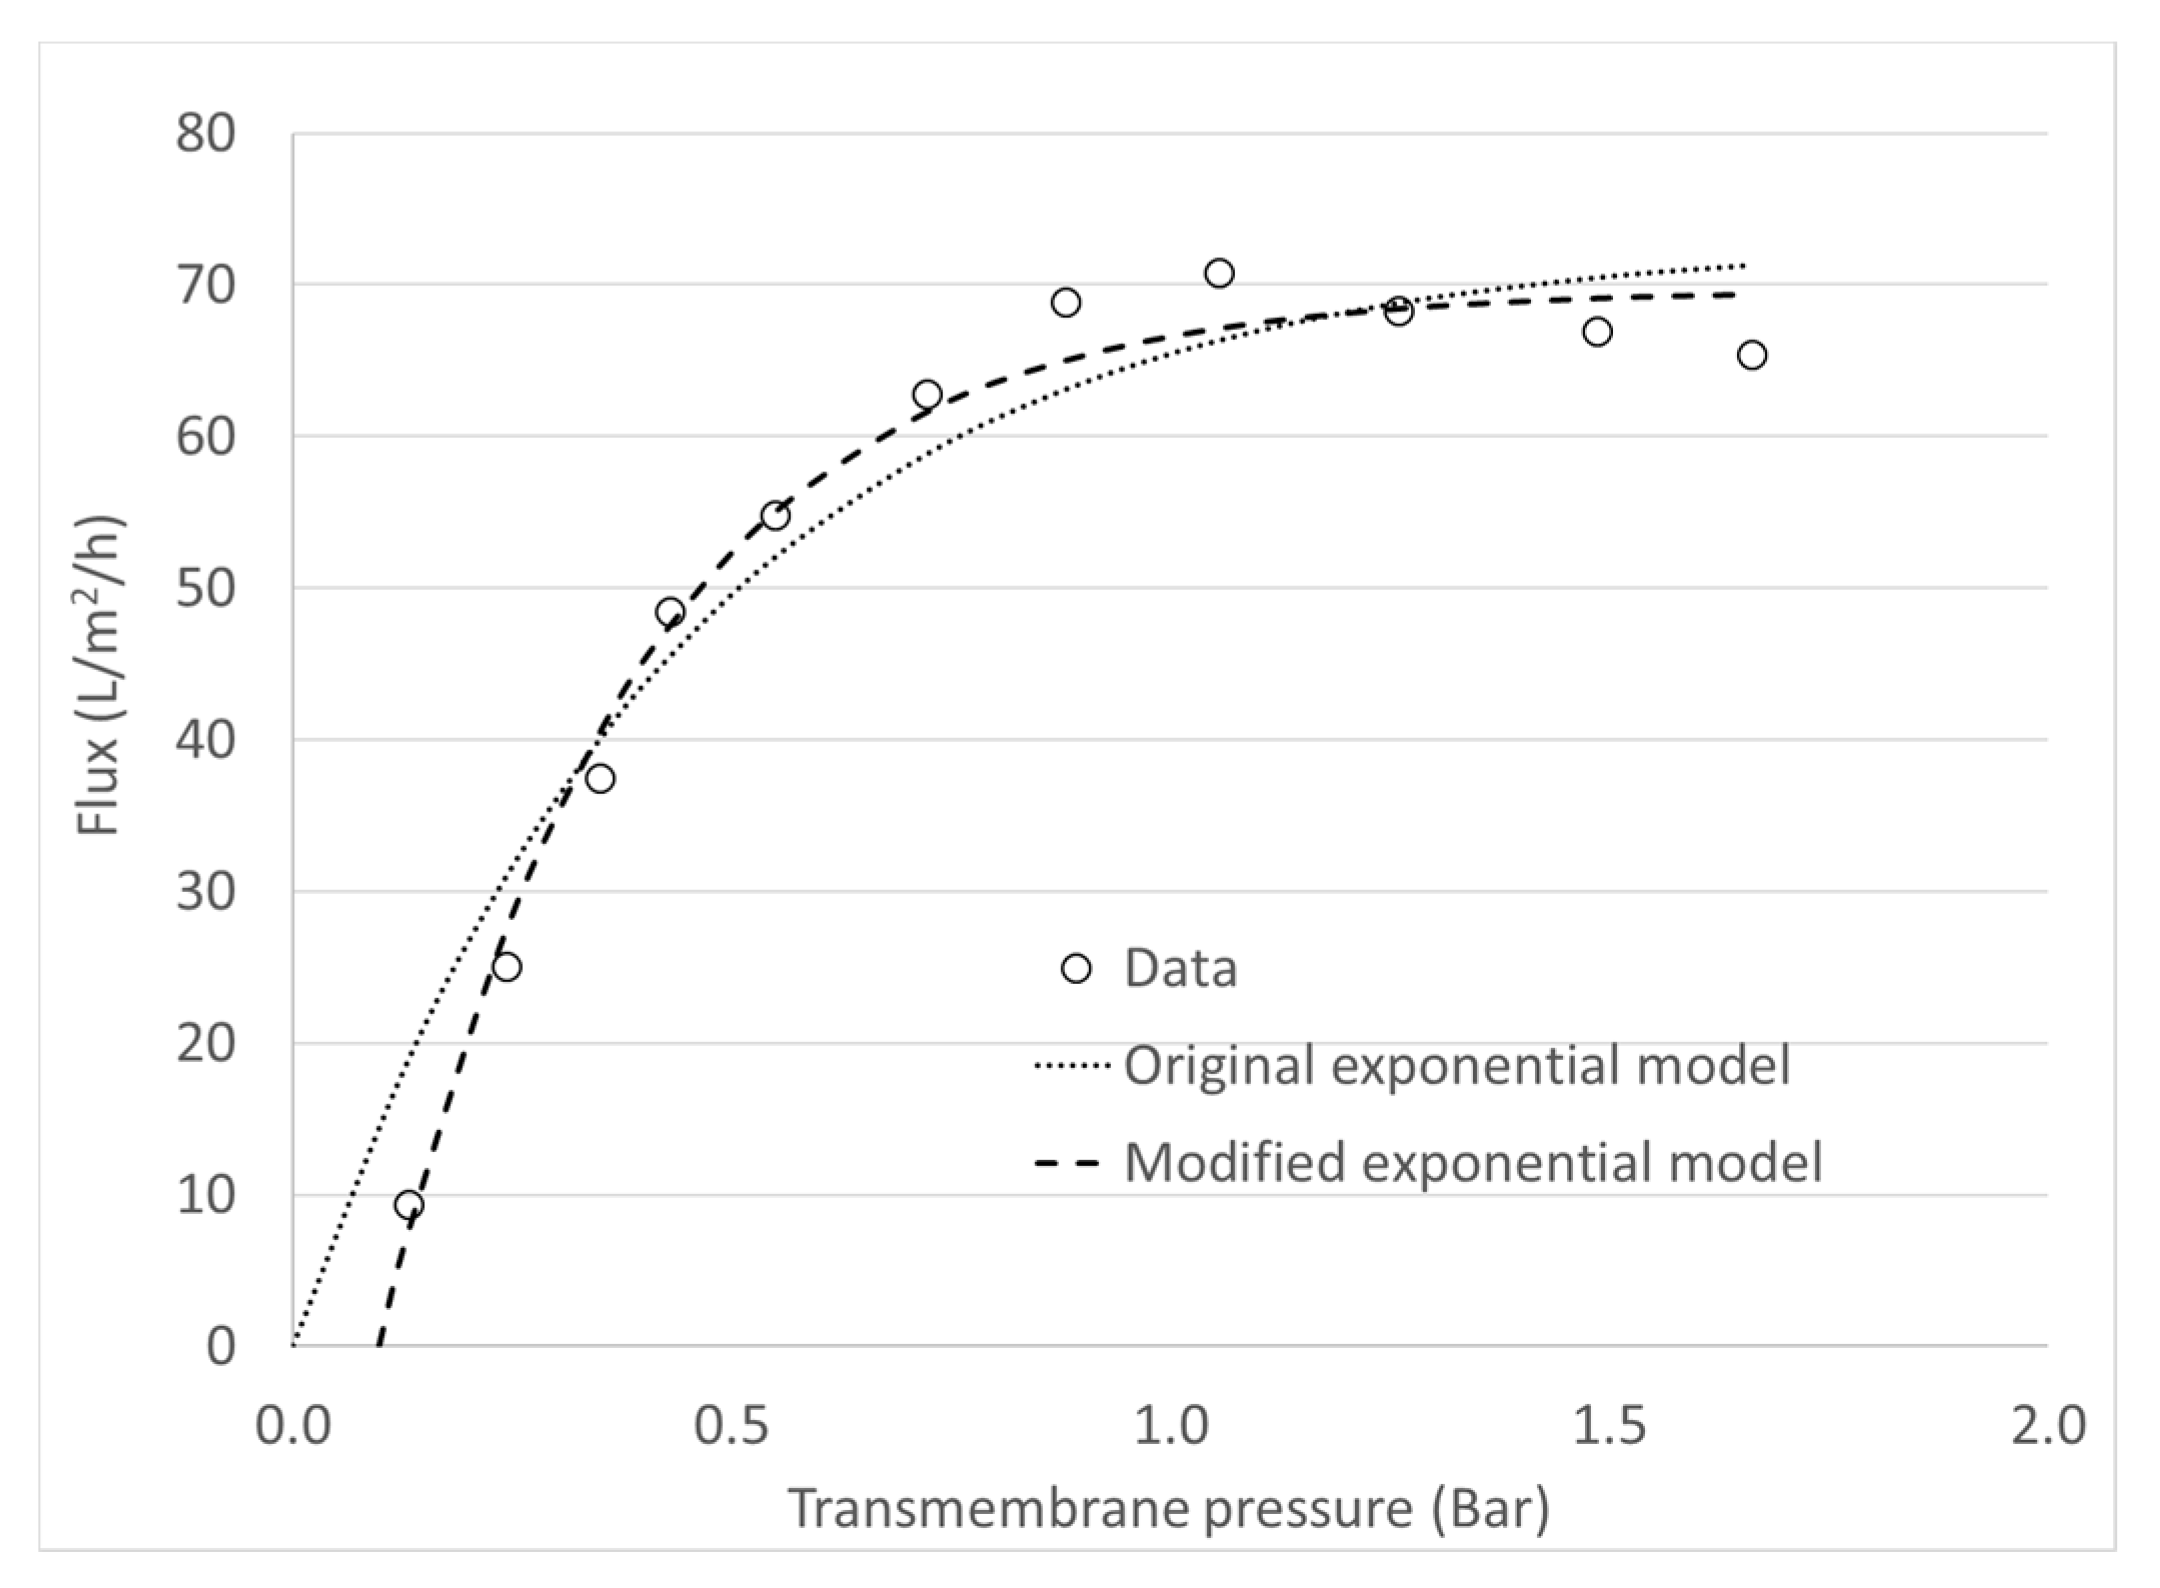
Figure 4 shows an example when average flux data is plotted with the original exponential model and the modified exponential model. It is evident how incorporating this new parameter not only provides a physical interpretation of a phenomenon that was previously disregarded, but also reduces the global distance that exists between the experimental points and the values predicted by the model. In statistical terms, this distance is measured by the Root Mean Square Error (RMSE). In Figure 4, the RMSE of the original model was 4.89, while in the modified model it was 2. The reduction of the RMSE was observed in all the experimental runs, regardless of the processing conditions when using the modified equation (not shown data). This improvement therefore translates into a lower error in the prediction of the value of JL, resulting in a better accuracy when building a relationship between this parameter and the Re. In addition, for all of the curves of J vs. ΔPT, the ANOVA regressions yielded significant fitting of the model to the experimental data (p < 0.05), and no bias was detected because according to the Kolmogorov-Smirnov tests the residues fitted to a normal distribution (p < 0.005).

3.4. Effect of the dh on the JL

Figure 5 shows an example of the effect of the dh on J versus ΔPT curves at the highest flow (7.38 L/min), at CF = 1.5 and 50 °C. It is interesting to note the order of greatest to smallest JL values that the curves had for all cases—i.e., keeping constant the process variables except dh—was the same behavior: JL 2 mm > JL 6 mm > JL 3.6 mm, as can be seen in Figure 5.
This result could occur because, for the same flow, the CFV changed as result of the dh. According to Table 1, CFV2mm > CFV6mm > CFV3.6mm, which is same order of the JL obtained for each case. However, the CFV6 mm was slightly higher (8.0%) than CFV3.6 mm. Then, the fact of JL 6mm>JL 3.6mm is a result of τ W 6mm> τ W 3.6mm. Indeed, τw is defined in Equation (13):
τ w = Δ P · d h 4 · L ,
where ΔP is the drop pressure, dh is the hydraulic diameter, and L is the membrane length [43]. Hence, the higher dh higher τw. Besides ΔP is a quadratic function of CFV, therefore, a higher CFV implies higher ΔP. Le Berre and Daufin (1996) showed that the effect of an increase in the shear stress generates a qualitative and quantitative effect during microfiltration since a decrease in the porosity and thickness of the layer deposited on the membrane is achieved, thus removing the casein micelles back into the bulk suspension, while soluble proteins break through the membrane [44]. In this way, the concentration in the boundary layer cannot remain constant, leading to a significant improvement in the flux [45].

3.5. Effect of the dh on the Relationship between JL and Re

There are a few investigations that relate the limiting flux with Reynolds number. Table 4 lists most of correlations that have been reported between the Reynolds number and the limit flux for skim milk microfiltration. The correlations submitted by Samuelsson et al. (1997a, 1997b) show a linear relationship between Re and JL. Krstić et al.’s work (2002) shows several expressions where J is proportional to Re up to c (J α Rec), where c < 1 for all membranes analyzed with or without turbulence promoters [24,25,46]. However, Krstić et al. (2002) did not report the limiting flux [46], but they reported the permeate flux measured under constant transmembrane pressure. However, according to the J versus ΔPT curve inspection, it can be observed that the transmembrane pressure used by them would be in a zone where the limiting flux was already achieved; therefore, it was possible to compare. Later, Baruah et al. (2003) found a linear relationship between JL and Re, but they did not report any expression for relating both parameters [6]. On the other hand, Gésan-Guiziou et al. (1999) observed that JC increased differently with Re, when different dh are used [43]. Most recently, Hurt et al. (2015) reported a linear relationship using ceramic membrane with graded permeability, but they were not able to obtain a single correlation for their results using two membranes with dh values of 3 and 4 mm [20]. They introduced a modified Reynolds number by substituting the hydraulic diameter for the membrane length, obtaining a correlation of R2 = 92.09% (n = 18).
It is worth mentioning that in some works shown in Table 4, the temperature and/or concentration factor were kept constant. In these cases, the Re was modified only by the effect of the CFV. For example, Krstić et al.’s work (2002) was carried out for a concentration factor of 1.0 during milk microfiltration in a full recirculation mode [46]. The exception is work of Krstić et al., (2004) where different concentration factors (1 to 2) [47] were used; however, no mathematical relationships were reported.
Figure 6 shows the JL versus Re for three hydraulic diameters, i.e., 2, 3.6, and 6 mm dh membranes, considering the total 62 experimental runs. It can be observed that the three curves have the same shape, but for the same turbulence state (i.e., the same Reynolds number), the JL values are inversely proportional to the dh, that is JL 2mm > JL 3.6mm > JL 6mm. This result could occur because smaller channels increase the back transport of substances towards the bulk solution by reducing the concentration of particles on the membrane surface and have the effect of reducing the polarization concentration, which consequently increases the flux [48].
Despite that, for each hydraulic diameter, a fine correlation could be found for the JL versus Re, which is a dimensionless number that does not explain the difference in the JL among the three dh tested. Similar behavior was found for 3 and 4 mm dh during milk microfiltration [20]. The higher dispersion of data was found for the 2 mm membrane, this could be explained due to the constriction from the flow channel (10 mm) to the membrane channel (2 mm) is the greatest.
Table 5 shows the equations for the correlations obtained for each dh membrane by considering linear models. A generalized linear model for this case can be expressed as:
J L = a · R e
Moreover, a quadratic model was considered based on the shape of the curves shown in Figure 6:
J L = ( a · R e + b ) · R e
In both types of correlations JL has the same units (L/m2/h). It can also be observed that relationship models of Re to JL exhibited satisfactory fitting since all R2 were higher than 77.43%. Additionally, ANOVA regression routines showed that all data were significantly represented by these equations (p > 0.05), while the Kolmogorov-Smirnov test performed on the residues showed no bias (data not shown), thus demonstrating the validation of these correlations. In the linear models, a greater increase in the slope values (a) is observed as the dh decreases. This increase means that for the same Re, there is a greater effect on the JL as the hydraulic channel becomes thinner. On the other hand, the quadratic models had better fits compared to the linear models, but included an additional parameter, thus reducing in one degree of freedom. In this case, the a values were inversely proportional to the dh, while the parameter b also tends to decrease to some extent as the hydraulic channel widens. It is worth mentioning that all of these correlation models are valid under transition to turbulent regime since Re > 2300.
For the large Re range studied in this work, it is clear that quadratic behavior fits better to experimental data, compared with the previous works showed in Table 4. Hence, the phenomenon obeys to a potential law (n > 1).
Based on the above, and with the aim of obtaining one single expression, the dimensionless correlation between Sherwood (Sh), Schmidt (Sc), and Re [49] was considered:
S h = k · d h D = a · R e b · S c c .
Then, by replacing the definition of Sh = k∙dh/D, where D is the diffusion coefficient, and clearing the mass transfer coefficient (k), Equation (17) is obtained.
k = a · D d h · R e b · S c c .
Under steady-state conditions, the convective solute flow to the membrane surface will be balanced by the solute flux through the membrane plus the diffusive flow from the membrane surface to the bulk [49], giving the following expression for boundary layer:
( C G C P C B C P ) = E x p ( J k ) ,
where CG, CB, and CP are the solute concentration in the gel layer, bulk, and permeate, respectively. By clearing k, Equation (19) is obtained.
k = J · L n ( C B C P C G C P ) .
By replacing Equation (19) in Equation (17) and clearing J:
J = a · L n ( C B C P C M C P ) · D d h · R e b · S c c .
Moreover, in steady state J = JL and considering all the other variables, except Re and dh, absorbed by a new constant value called a , the Equation (21) is obtained.
J L = a · R e b d h .
By correlation of the data in this current investigation, the Equation (22) is obtained for JL in L/m2/h and dh in m.
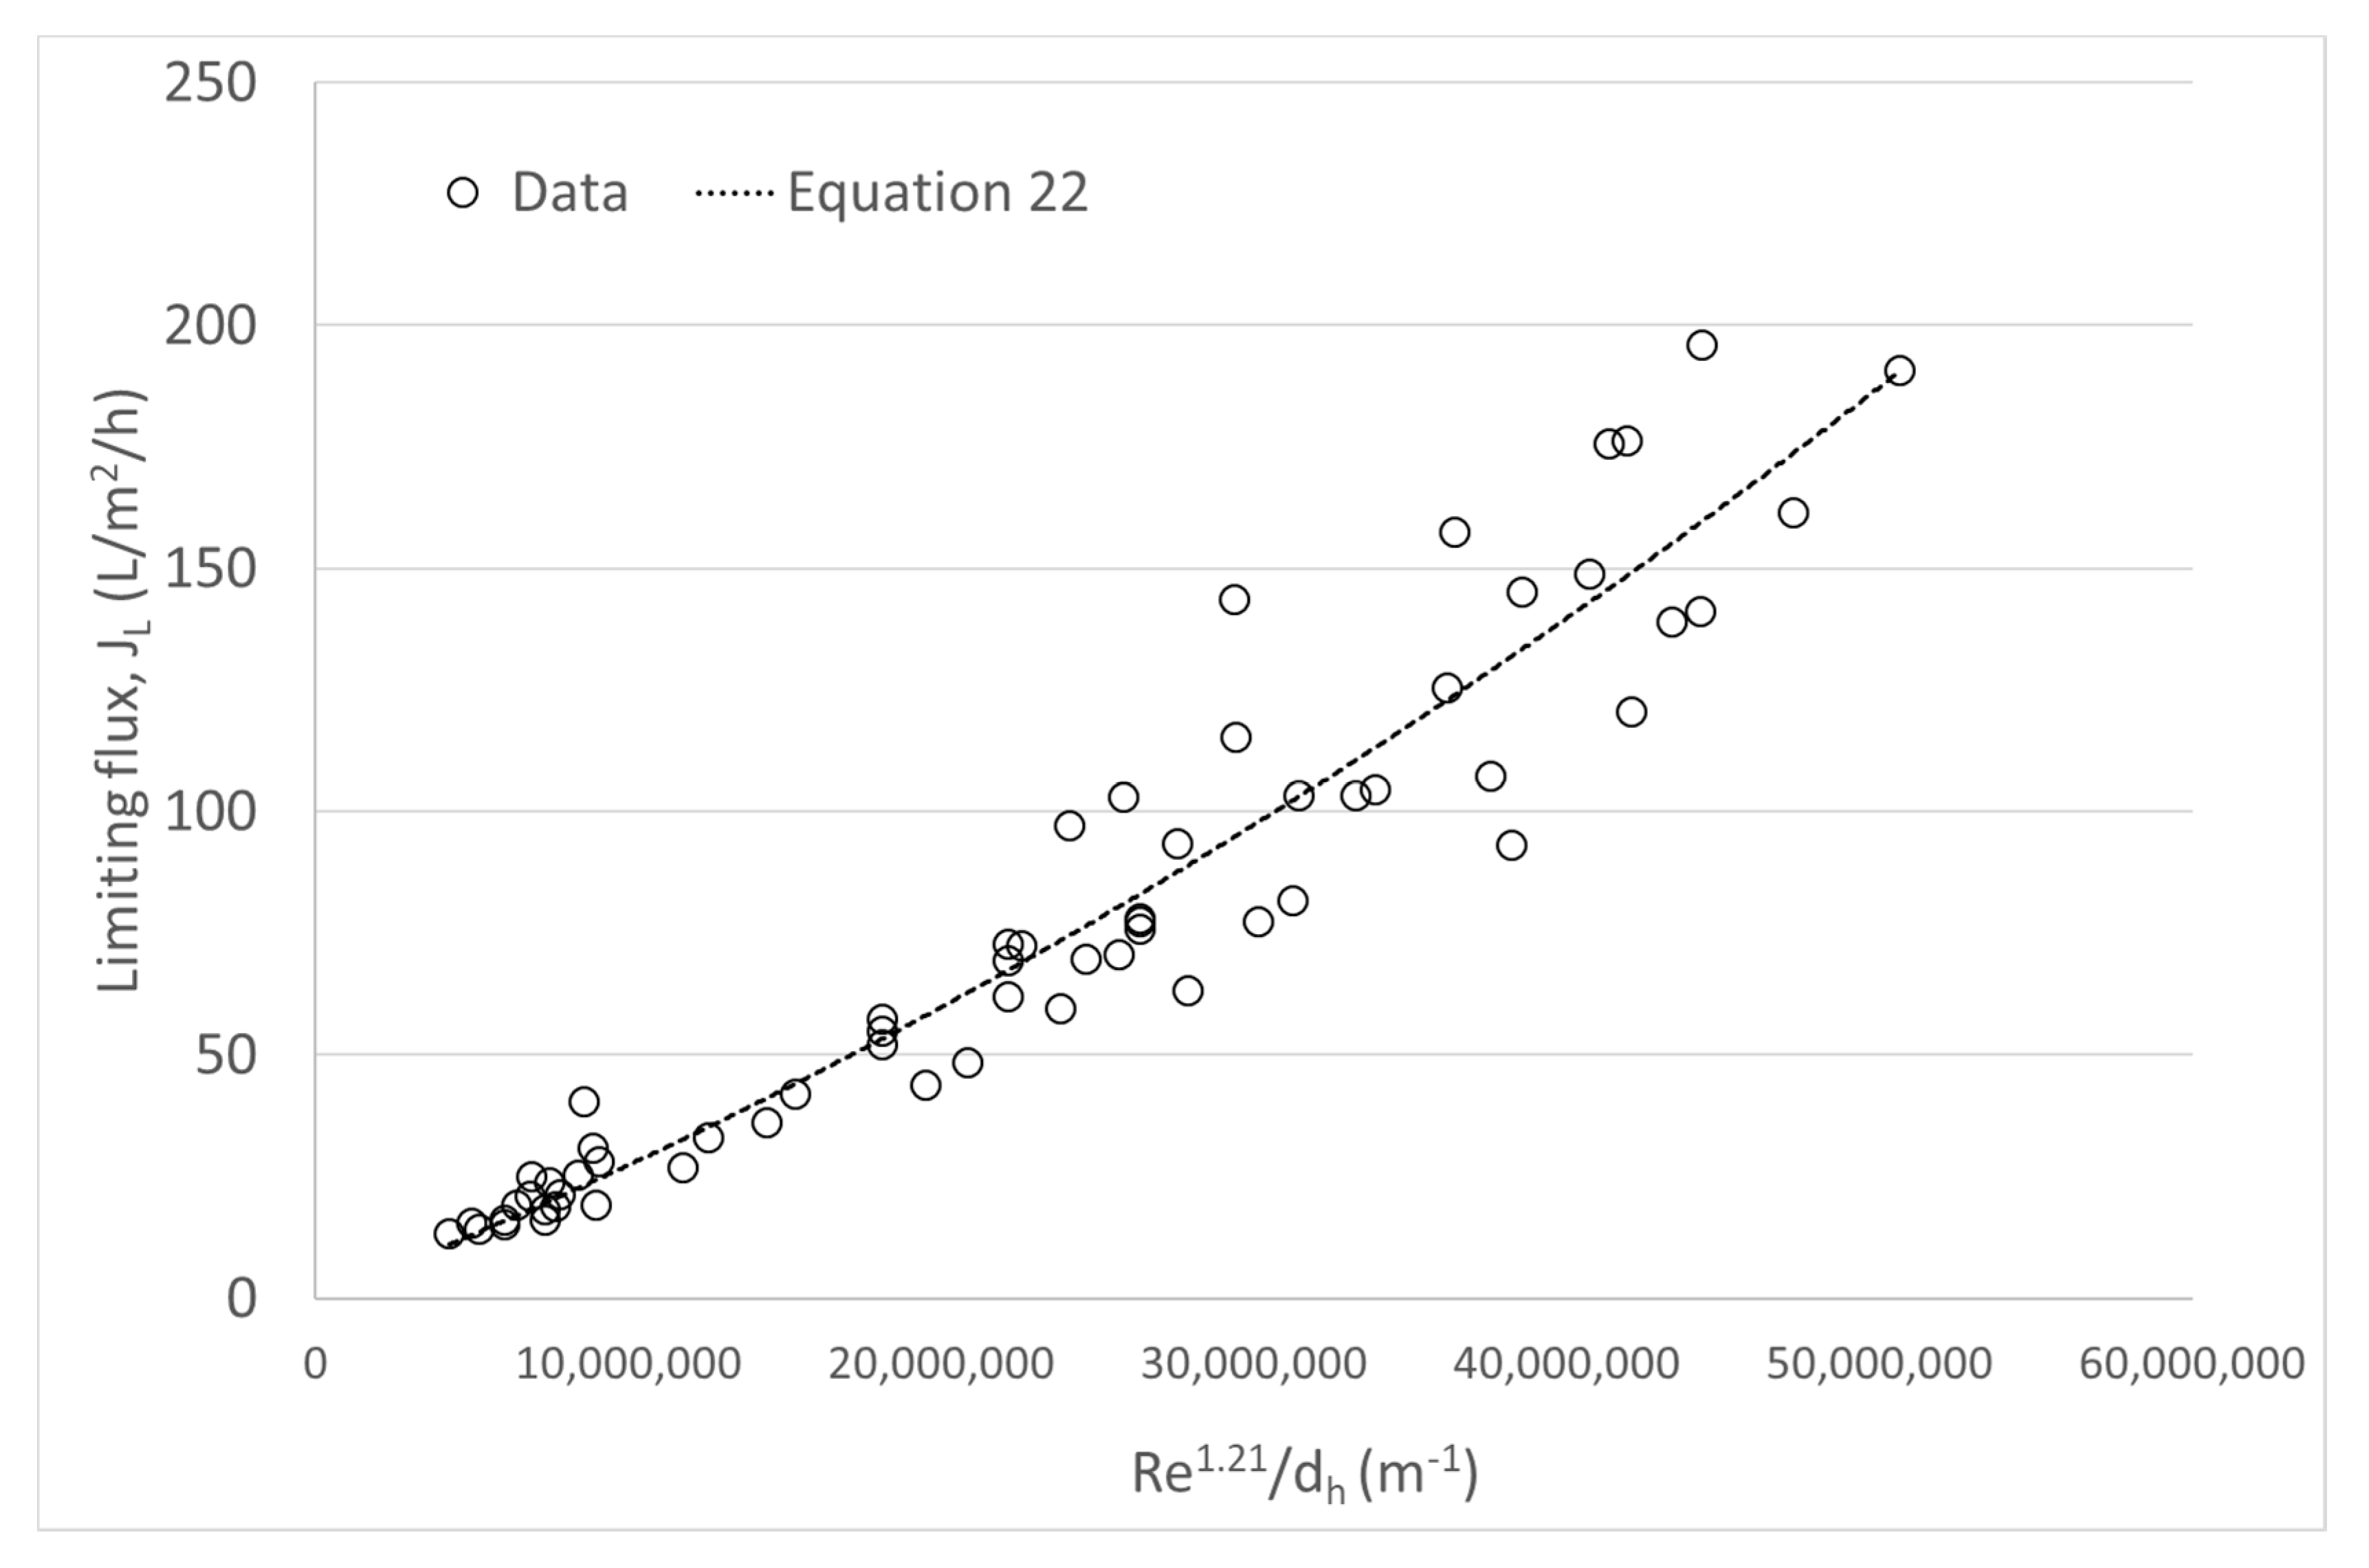
J L = 3.29 · 10 6 · R e 1.21 d h .
Equation (22) shows the correlation of JL = f (Re,dh) for the whole set of experimental conditions (n = 62), considering simultaneously the 3 dh values studied. The correlation robustly explained the variability of the phenomenon (R2 = 88.97% and RSME = 16.93). For graphical purposes, JL vs. Reb/dh was depicted, obtaining Figure 7.
Finally, a single expression for predicting JL as function of the Re and dh has been found. Therefore, this kind of expression which comes from a dimensionless number is more appropriate for describe this phenomenon.

4. Conclusions

A previously reported exponential model for JL determination in skim milk microfiltration was modified. The inclusion of a new parameter, (ΔPT)Min, reflected the existence of minimum transmembrane pressure required to obtain flux. This phenomenon has been generally obviated, but literature suggests its appearance in skim milk microfiltrations. From the 62 processing conditions assayed, results showed that the higher the feed flow, the greater the value of (ΔPT)Min as result of rightward shift of the J versus ΔPT curves. This fact can be explained because an increased turbulence increases the wall shear stress, thus increasing the back transport of particles to the bulk. In this way, the modified exponential model not only provides a parameter with physical meaning, but also substantially improved the fit of the data of the operational curves compared to the former model version. The above involves obtaining JL predictions with better accuracy.
On the other hand, a nonlinear empiric relationship between JL and the Re was obtained for each dh. Results showed that for a same Re, JL increased as dh decreased, in a wide range of Re within the turbulent regime (2653 < Re < 33846). Even though these correlations had an adequate degree of adjustment (R2 ≥ 81.36%), they were only valid for one dh. From dimensionless correlations a unique expression JL = f(Re,dh) was obtained that satisfactorily predicted the JL (R2 = 84.11%). The practical implications of this finding are useful when selecting the membranes for a skimmed milk MF process; for the same level of turbulence, membranes with a lower dh will produce higher fluxes with a better packing capacity. However, the use of membranes with lower dh creates a higher pressure drop at the same flow rate, which involves higher cost for electricity for pumping and cooling. All these consequences must be evaluated simultaneously to select a proper dh, resulting in a truly more sustainable process.

Supplementary Materials

The following are available online at https://www.mdpi.com/2304-8158/9/11/1621/s1, Figure S1: Evolution of the percentage of proteins respect their original concentration under extreme shear stress conditions: 231 Pa at 40 °C, and shear stress of 214 Pa at 60 °C, Table S1: Properties and Reynolds number for wáter, Table S2: Experimental runs and results for JL according to Box Behnken design for the 2 mm dh membrane, Table S3: Experimental runs and results for JL according to Box Behnken design for the 3.6 mm dh membrane and additional runs, Table S4: Experimental runs and results for JL according to Box Behnken design for the 6 mm dh membrane and additional runs.

Author Contributions

Conceptualization, C.A.-C. and A.C.; methodology and experiments, C.A.-C., P.H. and, C.S.-M.; validation, P.V.; investigation, V.O.-C.; resources, C.A.-C.; data curation, P.V.; writing-original draft preparation, C.A.-C. and A.C.; writing-review and editing, R.J.-F.; funding acquisition, C.A.-C. All authors have read and agreed to the published version of the manuscript.

Funding

This research was funded by FONDECYT-CONICYT grant number 11110402.

Acknowledgments

The authors would like to acknowledge to Department of Food Engineering PUCV by its support during the execution of this research. Also CREAS GORE-CONICYT is acknowledged.

Conflicts of Interest

The authors declare no conflict of interest.

References

  1. Brans, G.; Schroën, C.G.P.H.; van der Sman, R.G.M.; Boom, R.M. Membrane fractionation of milk: State of the art and challenges. J. Memb. Sci. 2004, 243, 263–272. [Google Scholar] [CrossRef]
  2. Skrzypek, M.; Burger, M. Isoflux® ceramic membranes-Practical experiences in dairy industry. Desalination 2010, 250, 1095–1100. [Google Scholar] [CrossRef]
  3. Heino, A.T.; Uusi-Rauva, J.; Rantamäki, P.R.; Tossavainen, O. Functional properties of native and cheese whey protein concentrate powders. Int. J. Dairy Technol. 2007, 60, 277–285. [Google Scholar] [CrossRef]
  4. Jørgensen, C.E.; Abrahamsen, R.K.; Rukke, E.-O.; Johansen, A.-G.; Schüller, R.B.; Skeie, S.B. Optimization of protein fractionation by skim milk microfiltration: Choice of ceramic membrane pore size and filtration temperature. J. Dairy Sci. 2016, 99, 6164–6179. [Google Scholar] [CrossRef] [PubMed]
  5. Green, G.; Belfort, G. Fouling of ultrafiltration membranes: Lateral migration and the particle trajectory model. Desalination 1980, 35, 129–147. [Google Scholar] [CrossRef]
  6. Baruah, G.L.; Couto, D.; Belfort, G. A predictive aggregate transport model for microfiltration of combined macromolecular solutions and poly-disperse suspensions: Testing model with transgenic goat milk. Biotechnol. Prog. 2003, 19, 1533–1540. [Google Scholar] [CrossRef] [PubMed]
  7. Zydney, A.L.; Colton, C.K. A concentration polarization model for the filtrate flux in cross-flow microfiltration of particulate suspensions. Chem. Eng. Commun. 1986, 47, 1–21. [Google Scholar] [CrossRef]
  8. Ould-Dris, A.; Jaffrin, M.Y.; Si-Hassen, D.; Neggaz, Y. Effect of cake thickness and particle polydispersity on prediction of permeate flux in microfiltration of particulate suspensions by a hydrodynamic diffusion model. J. Memb. Sci. 2000, 164, 211–227. [Google Scholar] [CrossRef]
  9. Hurt, E.E.; Adams, M.C.; Barbano, D.M. Microfiltration: Effect of retentate protein concentration on limiting flux and serum protein removal with 4-mm-channel ceramic microfiltration membranes1. J. Dairy Sci. 2015, 98, 2234–2244. [Google Scholar] [CrossRef] [Green Version]
  10. Baruah, G.L.; Belfort, G. A predictive aggregate transport model for microfiltration of combined macromolecular solutions and poly-disperse suspensions: Model development. Biotechnol. Prog. 2003, 19, 1524–1532. [Google Scholar] [CrossRef]
  11. Bacchin, P.; Aimar, P.; Field, R. Critical and sustainable fluxes: Theory, experiments and applications. J. Memb. Sci. 2006, 281, 42–69. [Google Scholar] [CrossRef] [Green Version]
  12. Field, R.W.; Wu, D.; Howell, J.A.; Gupta, B.B. Critical flux concept for microfiltration fouling. J. Memb. Sci. 1995, 100, 259–272. [Google Scholar] [CrossRef]
  13. Astudillo-Castro, C.L. Limiting flux and critical transmembrane pressure determination using an exponential model: The effect of concentration factor, temperature, and cross-flow velocity during casein micelle concentration by microfiltration. Ind. Eng. Chem. Res. 2015, 54, 414–425. [Google Scholar] [CrossRef]
  14. Córdova, A.; Astudillo, C.; Santibañez, L.; Cassano, A.; Ruby-Figueroa, R.; Illanes, A. Purification of galacto-oligosaccharides (GOS) by three-stage serial nanofiltration units under critical transmembrane pressure conditions. Chem. Eng. Res. Des. 2017, 117, 488–499. [Google Scholar] [CrossRef]
  15. Córdova, A.; Astudillo, C.; Giorno, L.; Guerrero, C.; Conidi, C.; Illanes, A.; Cassano, A. Nanofiltration potential for the purification of highly concentrated enzymatically produced oligosaccharides. Food Bioprod. Process. 2016, 98, 50–61. [Google Scholar] [CrossRef]
  16. Guerra, A.; Jonsson, G.; Rasmussen, A.; Nielsena, E.W.; Edelsten, D. Low cross-flow velocity microfiltration of skim milk for removal of bacterial spores. Int. Dairy J. 1997, 7, 849–861. [Google Scholar] [CrossRef]
  17. Springer, F.; Carretier, E.; Veyret, D.; Dhaler, D.; Moulin, P. Numerical and experimental methodology for the development of a new membrane prototype intended to microfiltration bioprocesses. Application to milk filtration. Chem. Eng. Process. Process Intensif. 2011, 50, 904–915. [Google Scholar] [CrossRef]
  18. Jaffrin, M.Y.; Ding, L.-H.; Akoum, O.; Brou, A. A hydrodynamic comparison between rotating disk and vibratory dynamic filtration systems. J. Memb. Sci. 2004, 242, 155–167. [Google Scholar] [CrossRef]
  19. Adams, M.C.; Hurt, E.E.; Barbano, D.M. Effect of ceramic membrane channel geometry and uniform transmembrane pressure on limiting flux and serum protein removal during skim milk microfiltration. J. Dairy Sci. 2015, 98, 7527–7543. [Google Scholar] [CrossRef] [Green Version]
  20. Hurt, E.E.; Adams, M.C.; Barbano, D.M. Microfiltration: Effect of channel diameter on limiting flux and serum protein removal. J. Dairy Sci. 2015, 98, 3599–3612. [Google Scholar] [CrossRef] [PubMed]
  21. Piry, A.; Heino, A.; Kühnl, W.; Grein, T.; Ripperger, S.; Kulozik, U. Effect of membrane length, membrane resistance, and filtration conditions on the fractionation of milk proteins by microfiltration. J. Dairy Sci. 2012, 95, 1590–1602. [Google Scholar] [CrossRef]
  22. Fontes, S.R. Mass transfer in microfiltration with laminar and turbulent flow of macromolecular solutions. J. Memb. Sci. 2005, 249, 207–211. [Google Scholar] [CrossRef]
  23. Adams, M.C.; Barbano, D.M. Effect of ceramic membrane channel diameter on limiting retentate protein concentration during skim milk microfiltration. J. Dairy Sci. 2016, 99, 167–182. [Google Scholar] [CrossRef] [Green Version]
  24. Samuelsson, G.; Huisman, I.; Trägårdh, G.; Paulsson, M. Predicting limiting flux of skim milk in crossflow microfiltration. J. Memb. Sci. 1997, 129, 277–281. [Google Scholar] [CrossRef]
  25. Samuelsson, G.; Dejmek, P.; Trägårdh, G.; Paulsson, M. Minimizing whey protein retention in cross-flow microfiltration of skim milk. Int. Dairy J. 1997, 7, 237–242. [Google Scholar] [CrossRef]
  26. Cheryan, M. Ultrafiltration and Microfiltration Handbook; CRC Press: Boca Raton, FL, USA, 1998; ISBN 1566765986. [Google Scholar]
  27. Astudillo, C.; Parra, J.; González, S.; Cancino, B. A new parameter for membrane cleaning evaluation. Sep. Purif. Technol. 2010, 73, 286–293. [Google Scholar] [CrossRef]
  28. Koontz, L. TCA precipitation. Methods Enzymol. 2014, 541, 3–10. [Google Scholar] [CrossRef]
  29. Church, F.; Swaisgood, H.; Porter, D.; Catignani, G. Spectrophotometric assay using o-phthaldialdehyde for determination of proteolysis in milk and isolated milk proteins. J. Dairy Sci. 1983, 66, 1219–1227. [Google Scholar] [CrossRef]
  30. Suárez, E.; Lobo, A.; Álvarez, S.; Riera, F.A.; Álvarez, R. Partial demineralization of whey and milk ultrafiltration permeate by nanofiltration at pilot-plant scale. Desalination 2006, 198, 274–281. [Google Scholar] [CrossRef]
  31. Montgomery, D. Analysis and Experimental Design, 5th ed.; John Wiley & Sons: New Jersey, NJ, USA, 2001. [Google Scholar]
  32. Ryan, T.P. Modern Engineering Statistics; Wiley-Interscience: Hoboken, NJ, USA, 2007. [Google Scholar]
  33. Wu, D.; Howell, J.; Field, R. Critical flux measurement for model colloids. J. Memb. Sci. 1999, 152, 89–98. [Google Scholar] [CrossRef]
  34. Carić, M.; Milanović, S.; Krstić, D.; Tekić, M. Fouling of inorganic membranes by adsorption of whey proteins. J. Memb. Sci. 2000, 165, 83–88. [Google Scholar] [CrossRef]
  35. Nordin, A.-K.; Jönsson, A.-S. Flux decline along the flow channel in tubular ultrafiltration modules. Chem. Eng. Res. Des. 2009, 87, 1551–1561. [Google Scholar] [CrossRef]
  36. Bouchoux, A.; Cayemitte, P.-E.; Jardin, J.; Gésan-Guiziou, G.; Cabane, B. Casein micelle dispersions under osmotic stress. Biophys. J. 2009, 96, 693–706. [Google Scholar] [CrossRef]
  37. Bouchoux, A.; Qu, P.; Bacchin, P.; Gésan-Guiziou, G. A general approach for predicting the filtration of soft and permeable colloids: The milk example. Langmuir 2014, 30, 22–34. [Google Scholar] [CrossRef]
  38. Alexiadis, A.; Bao, J.; Fletcher, D.F.; Wiley, D.E.; Clements, D.J. Analysis of the dynamic response of a reverse osmosis membrane to time-dependent transmembrane pressure variation. Ind. Eng. Chem. Res. 2005, 44, 7823–7834. [Google Scholar] [CrossRef]
  39. Zhang, W.; Zhu, Z.; Jaffrin, M.; Ding, L. Hydraulic conditions on effluent quality, flux behavior, and energy consumption in a shear-enhanced membrane filtration using Box-Behnken response surface. Ind. Eng. Chem. Res. 2014, 53, 7176–7185. [Google Scholar] [CrossRef]
  40. Krstić, D.M.; Koris, A.K.; Tekić, M.N. Do static turbulence promoters have potential in cross-flow membrane filtration applications? Desalination 2006, 191, 371–375. [Google Scholar] [CrossRef]
  41. Lawrence, N.D.; Kentish, S.E.; O’Connor, A.J.; Barber, A.R.; Stevens, G.W. Microfiltration of skim milk using polymeric membranes for casein concentrate manufacture. Sep. Purif. Technol. 2008, 60, 237–244. [Google Scholar] [CrossRef]
  42. Hurt, E.; Zulewska, J.; Newbold, M.; Barbano, D.M. Micellar casein concentrate production with a 3X, 3-stage, uniform transmembrane pressure ceramic membrane process at 50 °C. J. Dairy Sci. 2010, 93, 5588–5600. [Google Scholar] [CrossRef]
  43. Gésan-Guiziou, G.; Daufin, G.; Boyaval, E.; Le Berre, O. Wall shear stress: Effective parameter for the characterisation of the cross-flow transport in turbulent regime during skimmed milk microfiltration. Lait 1999, 79, 347–354. [Google Scholar] [CrossRef]
  44. Le Berre, O.; Daufin, G. Skimmilk crossflow microfiltration performance versus permeation flux to wall shear stress ratio. J. Memb. Sci. 1996, 117, 261–270. [Google Scholar] [CrossRef]
  45. Zhen, X.; Yu, S.; Wang, B.; Zheng, H. Flux enhancement during ultrafiltration of produced water using turbulence promoter. J. Environ. Sci. 2006, 18, 1077–1081. [Google Scholar] [CrossRef]
  46. Krstić, D.M.; Tekić, M.N.; Carić, M.D.; Milanović, S.D. The effect of turbulence promoter on cross-flow microfiltration of skim milk. J. Memb. Sci. 2002, 208, 303–314. [Google Scholar] [CrossRef]
  47. Krstic, D.M.; Tekic, M.N.; Caric, M.D.; Milanovic, S.D. Static turbulence promoter in cross-flow microfiltration of skim milk. Desalination 2004, 163, 297–309. [Google Scholar] [CrossRef]
  48. Pafylias, I.; Cheryan, M.; Mehaia, M.; Saglam, N. Microfiltration of milk with ceramic membranes. Food Res. Int. 1996, 29, 141–146. [Google Scholar] [CrossRef]
  49. Mulder, M. Basic Principles of Membrane Technology; Springer: Amsterdam, The Netherlands, 1996; ISBN 978-0-7923-4248-9. [Google Scholar]
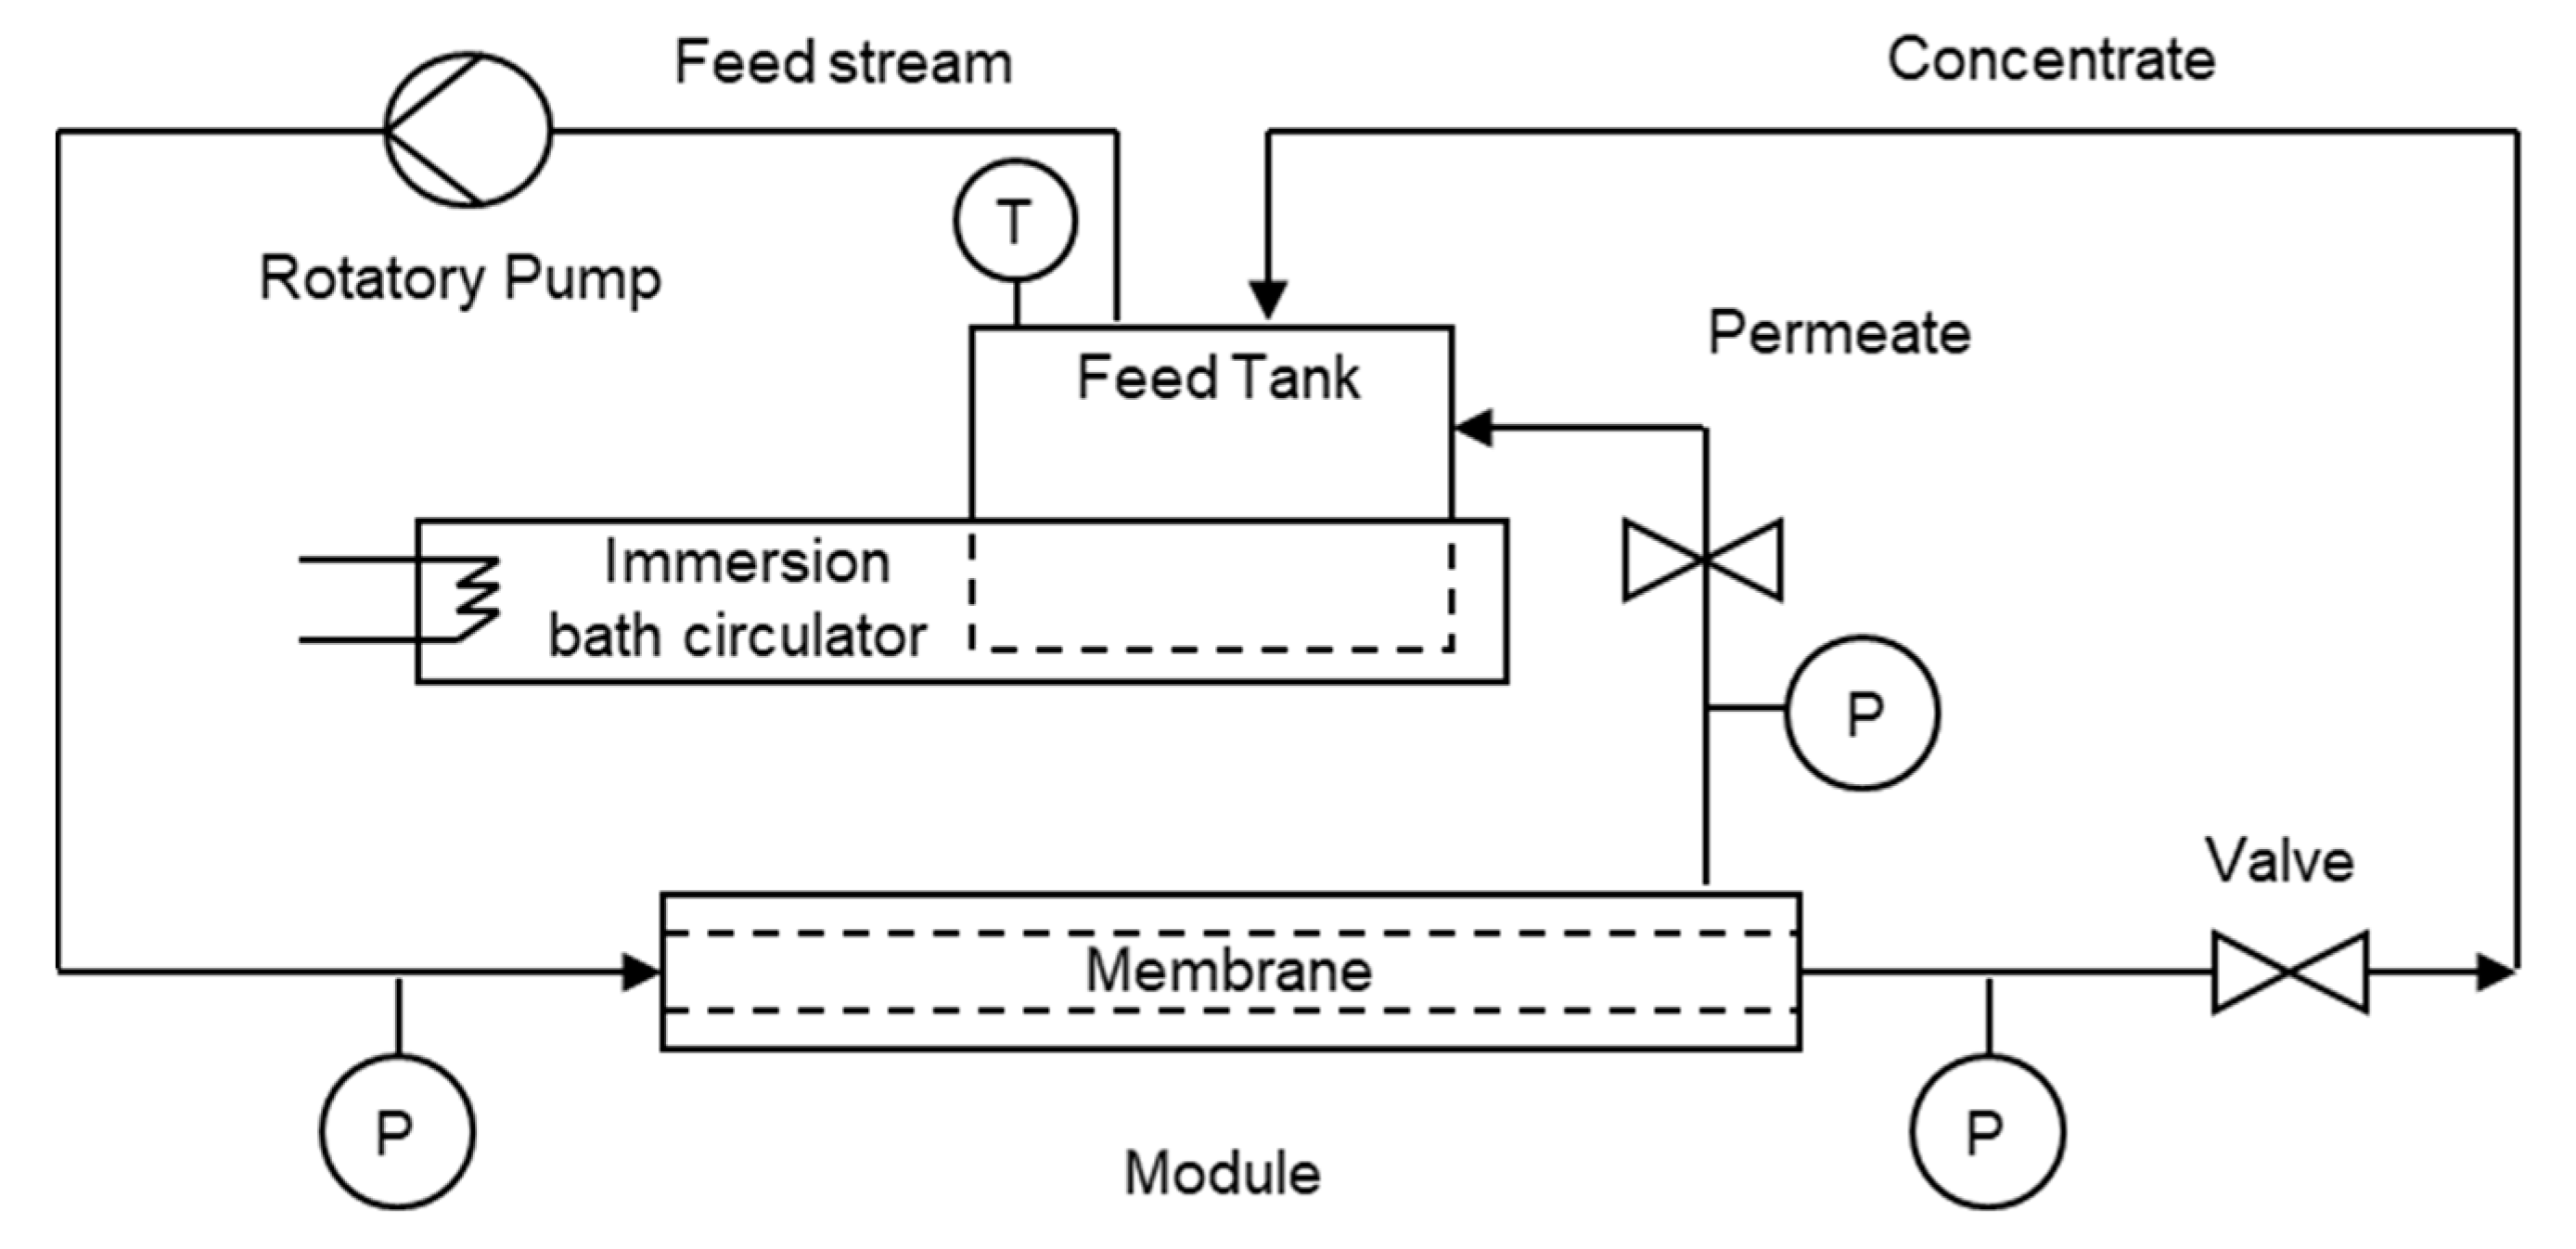
Figure 1. Full recirculation mode setup. P and T are the pressure and temperature gauges, respectively.
Foods 09 01621 g001
Figure 2. Generalized example of the graphical local of the parameter fitted by Equations (10)–(12).
Foods 09 01621 g002
Figure 3. Effects of processing conditions on the flux versus transmembrane pressure. (a) Effect of Temperature. Experimental conditions: concentration factor of 0.5 at 7.38 L/min using the membrane with a dh of 6 mm. (b) Effect of the Concentration Factor. Experimental conditions: flow of 7.38 L/min at 60 °C using the membrane with a dh of 3.6 mm. (c) Effect of Flow. Experimental conditions: concentration factor of 1.5 at 60 °C using the membrane with a dh of 2 mm.
Foods 09 01621 g003
Figure 4. Comparison of data fitting to the original exponential model and the modified exponential model. Experimental conditions: Concentration factor of 1.0 with flow of 7.38 L/min at 40 °C using the membrane with a dh of 3.6 mm.
Foods 09 01621 g004
Figure 5. Flow of 7.38 L/min. Experimental conditions: concentration factor 1.5 at 50 °C.
Foods 09 01621 g005
Figure 6. Limiting flux versus Reynolds number curves during skim milk microfiltration for three hydraulic diameters (2, 3.6, and 6 mm). Model type: JL = (aRe + b) Re.
Foods 09 01621 g006
Figure 7. JL versus Reb/dh curve during skim milk microfiltration using data from three hydraulic diameters: 2, 3.6, and 6 mm (n = 62), where b was fixed at 1.21.
Foods 09 01621 g007
Table 1. Flow and crossflow velocity (CFV) for each pump and hydraulic diameter.
PumpΔPT Working Range (bar)Average Flow, Q (L/min)Average Cross Flow CFV (m/s)
dh = 2 mm
(7 Channels)
dh = 3.6 mm
(3 Channels)
dh = 6 mm
(1 Channel)
07110.02–0.72.01 *1.521.101.18
25110.1–1.55.31 *4.022.903.13
4110.1–1.87.85 *5.954.284.63
(*) Values experimentally measured and previously reported by Astudillo-Castro (2015).
Table 2. Physico-chemical properties of the tested skim milk solutions.
Total Protein (% w/w)1.534.59Temperature (°C)
Concentration Factor0.511.53
Density (kg/m3)994.8 ± 3.51011.8 ± 6.11023.4 ± 1.51075.7 ± 4.440
990.7 ± 5.71007.7 ± 3.71021.8 ± 3.1 50
986.0 ± 6.31002.9 ± 2.81015.4 ± 0.71073.2 ± 3.260
Viscosity (cP)0.912 ± 0.0101.231 ± 0.0141.525 ± 0.0093.904 ± 0.02240
0.861 ± 0.0101.108 ± 0.0131.288 ± 0.008 50
0.809 ± 0.0130.986 ± 0.0091.051 ± 0.0112.490 ± 0.01860
Table 3. Model prediction and parameters determination (average values).
T (°C)CFQ (L/min)dh (mm)JL (L/m2/h)(ΔPT)C (bar)(ΔPT)Min(bar)R2RMSEFigure
400.57.386139.70.2990.09299.952.443a
500.57.386165.30.3030.04599.511.833a
600.57.386190.80.2660.06898.615.33a
600.57.383.6173.70.3830.03999.953.043b
601.07.383.6101.80.2640.08399.961.613b
601.57.383.679.50.2300.08999.870.713b
603.07.383.626.70.1310.10697.521.013b
601.52.01227.900.0220.00398.670.833c
601.55.31263.310.0690.02899.990.543c
601.57.382120.80.1630.10297.342.703c
501.57.382107.40.1840.09599.471.665
501.57.383.669.50.3090.05699.701.005
501.57.38677.40.1570.04099.771.015
Table 4. Correlations between the limiting flux and the Reynolds number reported in the literature.
Membrane and Experimental ConditionsEquationReference
Ceramic 0.14 μm; dh = 6 mm; L = 138 mm, Skim milk MF. Data (n = 8) was adjusted to an empirical relation.JL (m/s) = 6.94·10−10·Re[24]
Ceramic 0.14 μm; dh = 6 mm; v = 1.5–8 m/s; T = 15 and 55 °C, Skim milk MF. (Length no reported, but the filtration area was 26 cm2, implying L = 138 mm).
Data (n = 8) was adjusted to an empirical relation.
JL (L/(m2·h)) = 0.0025 Re[25]
Ceramics (0.05, 0.1 and 0.2 µm); T = 50 °C, Skim milk MF; v ≥ 0.45 m/s, with and without turbulence promoters; ΔPT = 65 kPa. L = 250 mm and dh = 6.8 mm.
Data was adjusted to an empirical relation.
J α Re0.15Re < 2700Without turbulence promoter[46]
J α Re0.80Re > 2700
J α Re0.85Re > 2000With turbulence promoter
Ceramics 0.1 µm (3 mm dh ceramic graded permeability and 4 mm dh); T = 50 °C.
Milk with different total protein concentrations (8–9–10%). L = 1.02 m. Data was adjusted to an empirical relation.
JL (kg/m2/h) = 0.00764·Re
Only for the 4 mm dh membrane using n = 9.
[20]
JL (kg/m2/h) = 3.07·10−5 ReLength based
where ReLength based is a modified Re as follows:
Re Legth   based   = ρ · C F V · L μ
where L is the membrane length, which is 1.02 m for both membranes. In this case n = 18.
Table 5. Correlations between the limiting flux and the Reynolds number for skim milk MF.
Hydraulic DiameterRangeEquationDetermination Coefficient (R2)RSME
dh = 2 mm2653 < Re < 12234JL = (5.81·10−7·Re + 6.20·10−3) Re81.73%19.72
JL = 0.01204·Re77.46%21.91
dh = 3.6 mm2658 < Re < 18773JL = (3.17·10−7·Re + 2.38·10−3)·Re95.23%9.77
JL = 0.00681·Re86.10%16.69
dh = 6 mm4752 < Re < 33846JL = (8.95·10−8·Re + 2.23·10−3)·Re95.33%11.10
JL = 0.00451·Re89.46%16.68
Publisher’s Note: MDPI stays neutral with regard to jurisdictional claims in published maps and institutional affiliations.