Article

Optical Absorption and Scattering Properties at 900–1650 nm and Their Relationships with Soluble Solid Content and Soluble Sugars in Apple Flesh during Storage

1
College of Food Science and Technology, Nanjing Agricultural University, Nanjing 210095, China
2
College of Light Industry and Food Engineering, Nanjing Forestry University, Nanjing 210037, China
*
Author to whom correspondence should be addressed.
Foods 2020, 9(12), 1881; https://doi.org/10.3390/foods9121881
Submission received: 10 November 2020 / Revised: 11 December 2020 / Accepted: 15 December 2020 / Published: 17 December 2020
(This article belongs to the Special Issue Postharvest Management of Fruits and Vegetables)

Abstract

:
Soluble solid content (SSC) is regarded as the most significant internal quality associated with the taste and maturity in fruits. Evaluating the relationship between the optical properties and soluble sugars facilitates exploration of the mechanism of optical techniques in SSC assessment. In this research, absorption coefficient (μa) and reduced scattering coefficient (μs) of Fuji apple during storage were obtained using automatic integrating sphere (AIS) at 905–1650 nm. Relationships between μa, μs and SSC, and soluble sugars contents, were investigated. The result showed that SSC, the content of total soluble sugars (TSS), fructose, glucose and sucrose were all decreasing after storage, and the same trend appeared in the change of μa and μs. In the whole wavelength range, both μa and μs were positively related to SSC and soluble sugars contents. The correlations between μa and SSC, and soluble sugars contents, showed increasing tendencies with increasing wavelengths, while for μs, correlations had the opposite trend. The strongest correlations between μa and SSC, and soluble sugars contents, were observed in the correlation of μa with sucrose, with an r of 0.934. Furthermore, a partial least square (PLS) model for sucrose based on μa was built with the coefficient of determination of prediction (Rp2) and the root mean square error of prediction (RMSEP) of 0.851 and 1.047, respectively. The overall results demonstrate that optical properties at the range of 905–1650 nm could be used to evaluate SSC of apples and this may due to the strong correlation between sucrose content and μa.

1. Introduction

Apple fruit is highly valued by consumers for its crispy texture and sweet and sour taste. Soluble sugars in apple fruit largely affect sweetness, and they are the main components of soluble solids [1]. Compared with obtaining the content of soluble sugars, it is faster and more economical to measure soluble solids content (SSC). SSC is measured via the fruit juice. Therefore, SSC is used as a significant property for assessing the sweetness of sugars in apples, and the non-destructive evaluation of SSC by optical techniques have been investigated for many years [2,3,4,5,6], inclusive of near-infrared spectroscopy (NIR) and hyperspectral imaging (HSI).
Light transfer in tissues contains absorption or scattering, and the process of interaction mainly depends on the different chemical components and structures of tissues. By collecting light that is reflected back from or transmitted through the tissue based on NIR and HSI techniques, the chemical as well as structural characteristics of tissues can be acquired [7]. The prediction models for SSC can be built based on chemometrics methods by using the captured spectra and the standard measurements, and some satisfactory results have been obtained [8,9,10,11,12]. The calibration models can then be used to predict new samples after establishing and validating. However, it leads to limitation in illustrating the chemical and structural properties of interest from the meaningful information presented in obtained spectra due to the overarching behaviors of absorption and scattering in tissues collected by NIR and HSI techniques which cannot separate these two properties [13]. Besides, the accuracy of NIR and HSI techniques is limited, because the techniques are based on the Lambert-Beer law, which often discards the scattering effect. Furthermore, the obtained properties of reflectance or transmittance are dependent on the instrument types and light source/detecting probe setup [14]. There are, in general, inherent shortcomings with NIR and HSI techniques, which present great challenge in internal quality assessment of agri-food products.
The optical parameters measurement resulted in separate and quantized information of the absorption and scattering properties by calculating the absorption coefficient (μa) and reduced scattering coefficient (μs) [15,16]. The current measurement techniques are developed to measure absorption and scattering properties, mainly including integrating sphere (IS) [17,18], spatially-resolved (SR) [19], time-resolved (TR) [20] and frequency-domain (FD) [21]. In addition, the techniques are based on the light transfer theory, which involves inverse adding double (IAD), Monte Carlo (MC), and diffuse approximation (DA), and the optical properties can be obtained by IS with IAD [22,23]. Such methods have opened up the opportunity to attribute internal quality parameters, both chemical composition and structure information, to optical properties of tissues for investigating the one to one relationship between them [24,25,26,27]. He et al. [28] applied an automatic integrating sphere (AIS) system combined with IAD strategies to acquiring the μa and μs spectra of pear tissues in 400–1150 nm. Using a single integrating sphere, Wang et al. [29] estimated the absorption and scattering properties of healthy and diseased onion skin and flesh over the range of 550–880 nm and 950–1650 nm.
Many studies in Vis-NIR (400–1100 nm) have been conducted. The findings showed that μa around 525 and 675 nm were affected by anthocyanin and chlorophyll. In addition, μa at 630 nm is attributed to total galacturonic acid (GA) in residue insoluble pectin (RIP), with an r of 0.64 [30]. μa and μs at 675 nm are noticed for area and equivalent diameter of apple tissue cells (r = 0.581–0.941) [31]. Nowadays, there are few studies on optical properties in longer wavelength ranges (above 1100 nm). However, the absorption property features above 1100 nm contain more important and obvious bonds, C-H, O-H, C-C, than the features observed in the Vis-NIR range [24,32]. Thus, enhanced sensitivity of optical properties related to tissue components can be obtained compared to the wavelength range above 1100 nm [33,34]. The increase in SSC causes an increase in the signal of absorption at 1198 nm, while water cored tissue caused a characteristic decline in light scattering coefficients [35]. However, the relationship between them has not been quantified, and the relationships between absorption and scattering properties and the compositions in SSC are also not clear yet.
Therefore, this research aimed to comprehensively clarify the mechanism of detecting SSC by optical technology and provide information for accurately developing improved SSC detectors of Fuji apple during storage by optical technology. In the work, the μa and μs of apple fleshes in longer wavelength range NIR (905–1650 nm) were calculated based on the AIS system with the IAD method, and internal quality (SSC and the contents of soluble sugars) was measured. Finally, relationships between μa, μs and SSC, the contents of total soluble sugar (TSS), fructose, glucose and sucrose were investigated, then the potential for predicting the SSC was evaluated.

2. Materials and Methods

2.1. Sample Collection and Storage

The Fuji apples were provided by an orchard in Xuzhou, Jiangsu Province, China. In total, 60 apple samples were stored at 0 ± 1 °C with relative humidity (RH 95%) in normal atmosphere (NA) for 150 days. The measurement took place during 0–150 days, at 30-day intervals and in total 10 individual apples were picked and measured randomly after placing at room temperature for 5 h on each occasion. Another 60 samples were stored at 25 °C with RH 95% in NA for 50 days, and 10 apples were picked from 0 day at about 10-day intervals up to 50 days.

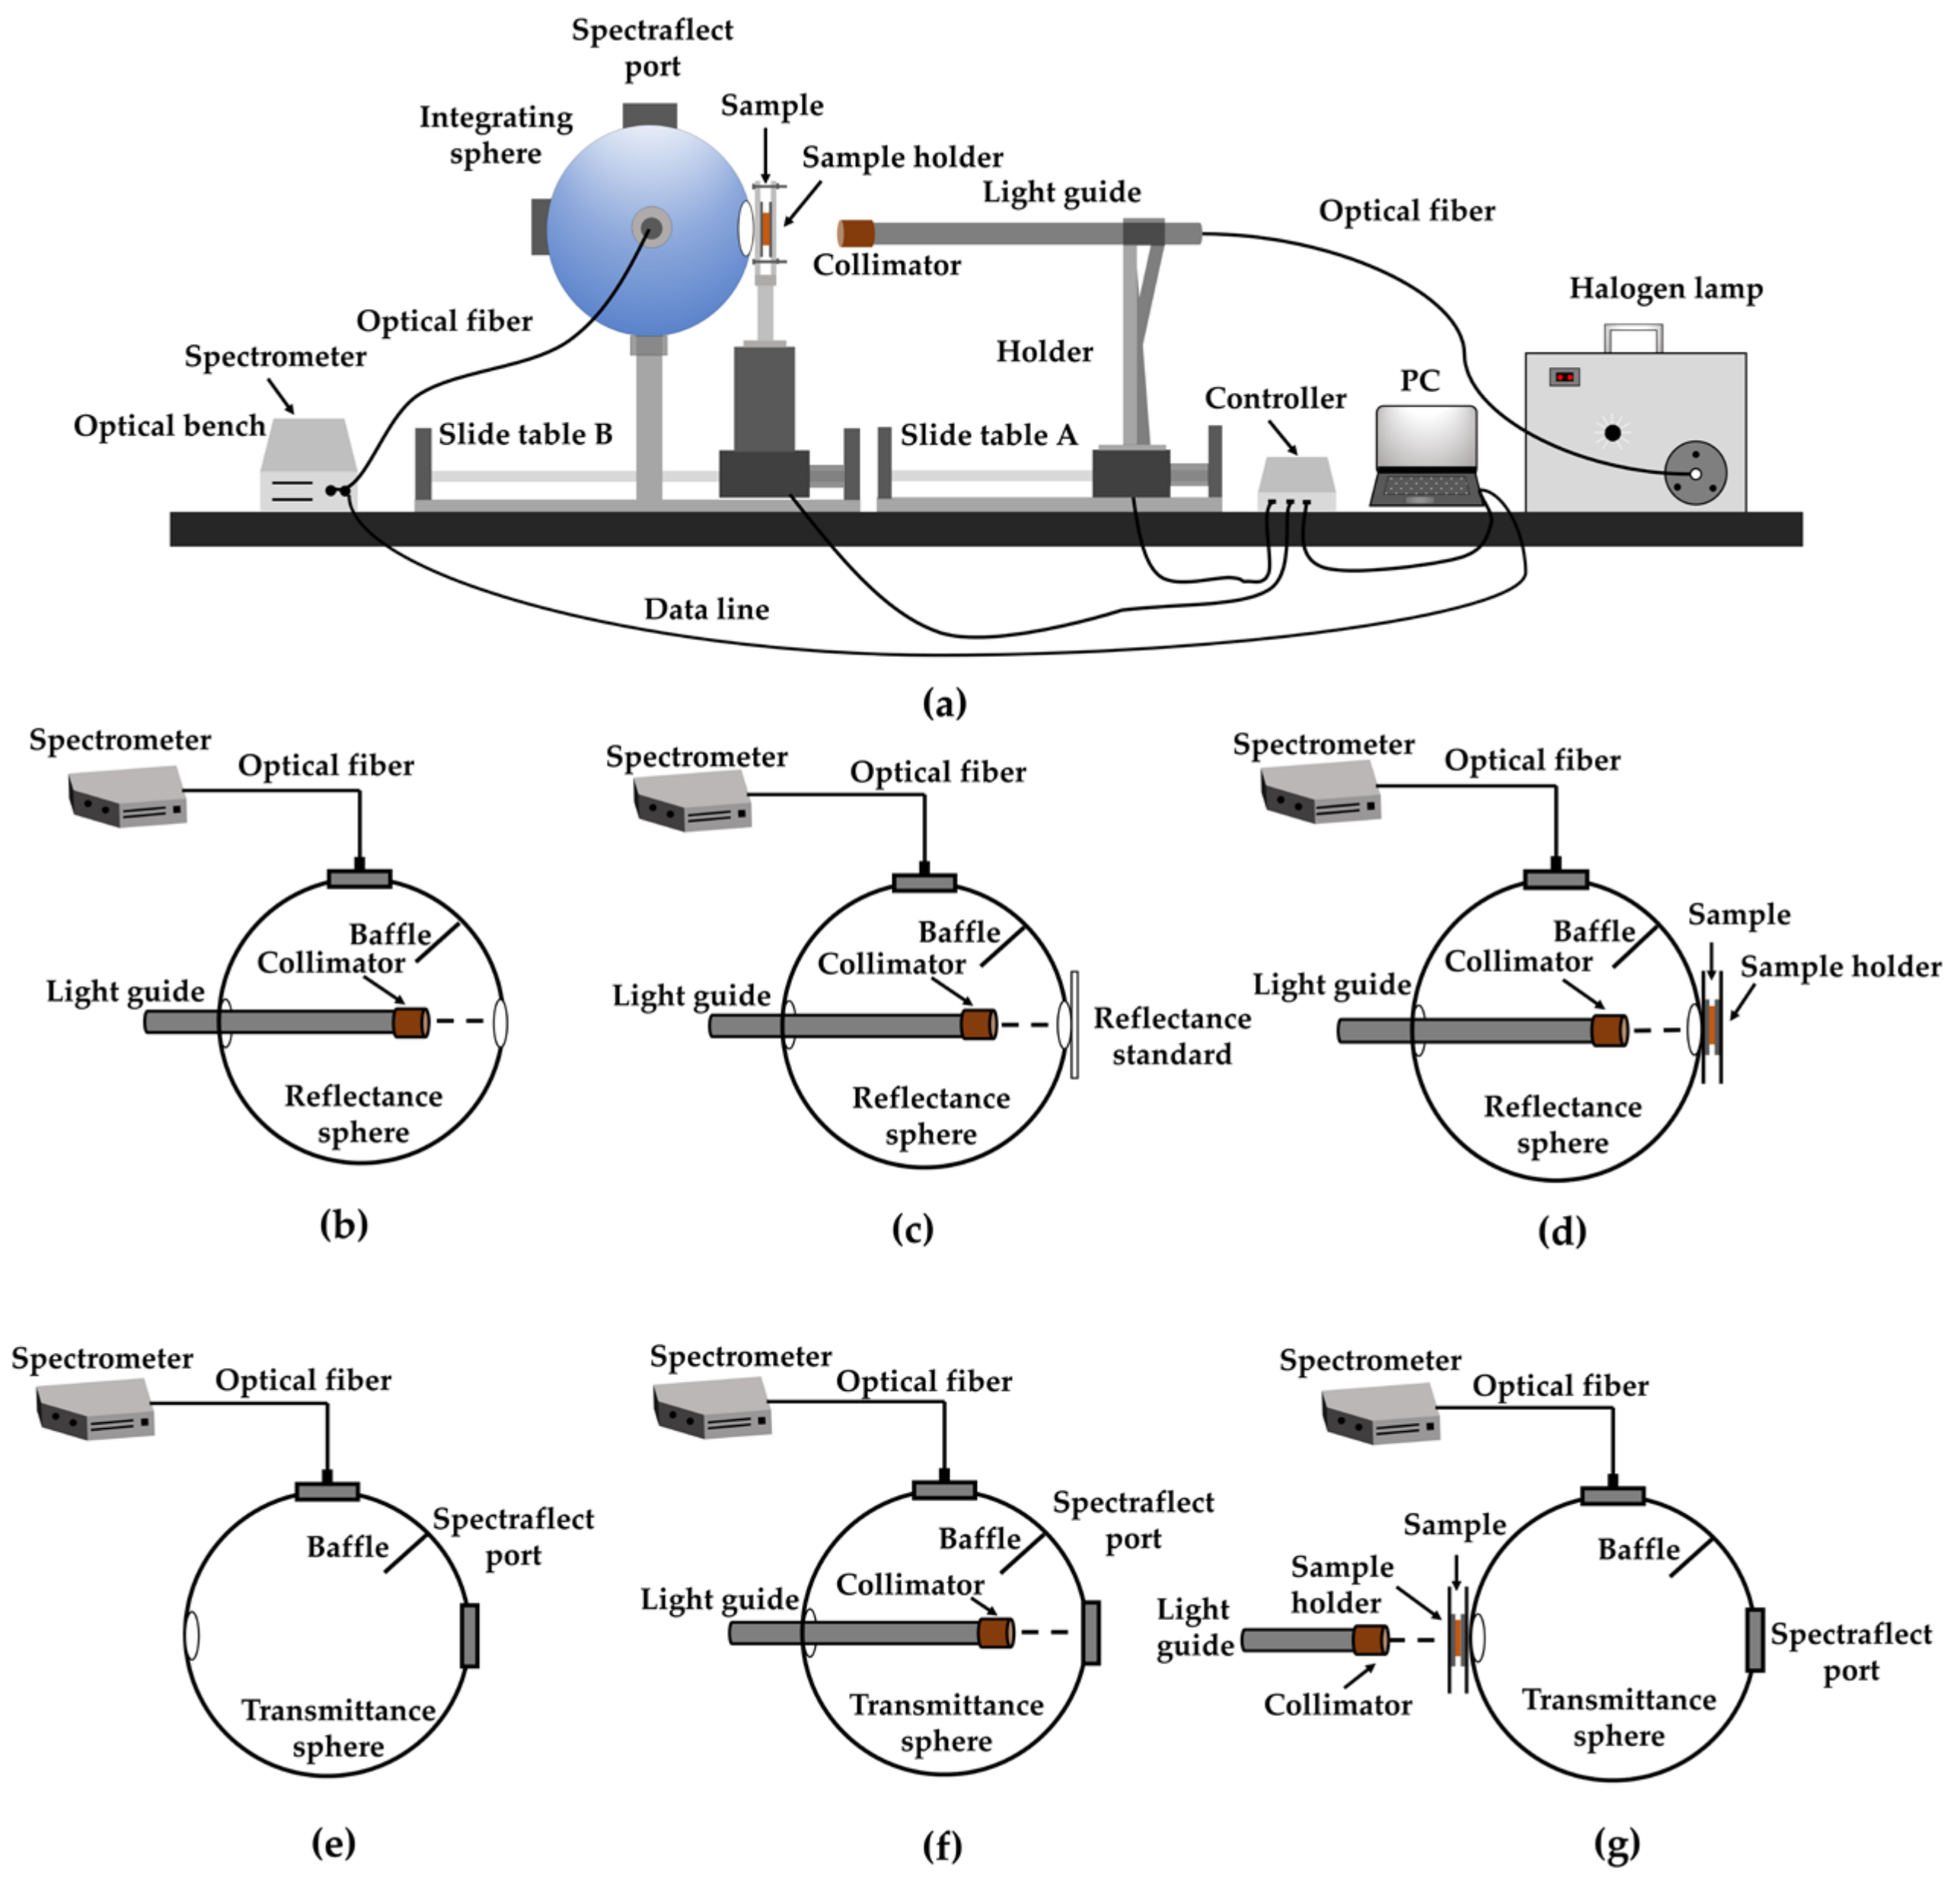
2.2. Optical Properties

The automatic integrating sphere system with IAD was employed to measure the μa and μs. The diffuse reflectance and diffuse transmittance of the samples, reference and dark noise were needed to calculate μa and μs, and the spectral signals (905–1650 nm) were collected by a spectrometer (SW2520, Isuzu Optics, Taiwan, China). Different measurement configurations were presented in Figure 1, while specific components of instruments, and measurements′ detailed descriptions, are presented by Wei et al. [36] and Prahl [37].
The accuracy of the estimated μa and μs was validated with both pure water and 1% Intralipid® (Sigma Aldrich, St. Louis, MO, USA). The main ingredients were soybean oil, glycerin and egg yolk phospholipids. In addition, the particle size distribution in the solution was relatively uniform and stable, also very close to the main scattering particles (chylomicrons) in biological tissues. Thus, it was taken as standard scattering resolution. The scattering resolution was established by diluting 20% stock solution with water. The reference μa and μs values were described by Van et al. [38] and Deng et al. [39]. The performance of this methodology was validated and the results were reported by Wei et al. [36].
According to the Monte Carlo simulation of Ma et al. [35], the penetration depth of light at 1198 nm is 3.3 mm in the whole tissue of Fuji apple. To ensure the penetration effect of light and the sample volume needed for chemical detection, two 2.5 mm thick flesh slices were cut from each sample apple in the opposite side. The samples were then cut into slices with 2.5 mm thickness × 30 mm width × 35 mm length and the thickness of each slice was measured by using digital calipers. The sample slices were then sandwiched with two pieces of quartz glasses to measure the spectral signals. The specific description of measurements can be found in Wei et al. [36] and Ma et al. [40].

2.3. SSC and Soluble Sugars Contents Measurements

The juice of the fresh slices was obtained to assess the SSC by a hand-held refractometer (PAL-1, ATAGO, Tokyo, Japan) after spectral measurement. The measurement range, resolution and accuracy of the instrument were 0.0–53.0% °Brix, 0.1% °Brix and ±0.2% °Brix, respectively. In addition, fructose, glucose, and sucrose contents were quantified by high performance liquid chromatography (HPLC) as described further in Wei et al. [36]. For each sample, two grams of apple flesh homogenate was taken in a centrifuge tube with 30 mL of distilled water in a water bath at 80 °C and centrifuged at 12,000 r/min for 20 min. Supernatants were collected and diluted five-fold., and the solution was filtered through a 0.45 μm filter. Sugars were separated by a Zorbax carbohydrate 70-A column (Agilent, Santa Clara, CA, USA) using a solvent of acetonitrile:water (75:25, v/v). The flow rate was 0.8 mL/min at 40 °C. Different concentrations of the sugar standard solution were made for glucose, fructose and sucrose, then the content of the three sugars in the samples was established by comparing each peak retention time and peak area with those of the standard.

2.4. Statistical Analysis

All the quantitative comparations between the different soluble sugars of the examined apple flesh were subjected to Variance analysis, which were tested for p < 0.05 using the SPSS Statistics 20 package (IBM). The correlation between the contents of soluble sugars and soluble solids was investigated using the Pearson method of analysis with significant p < 0.05 in IBM SPSS 20. The partial least square regression (PLS) models of SSC, TSS and soluble sugars contents were built based on μa and μs separately using MATLAB R2010b® in order to choose the most important soluble sugar parameter that determined optical properties of apple flesh. Finally, the model performance was evaluated by the determination coefficient of prediction (Rp2) with the root mean square error of prediction (RMSEP), and the determination coefficient of calibration (Rc2) with the root mean square error of calibration (RMSEC).

3. Results and Discussion

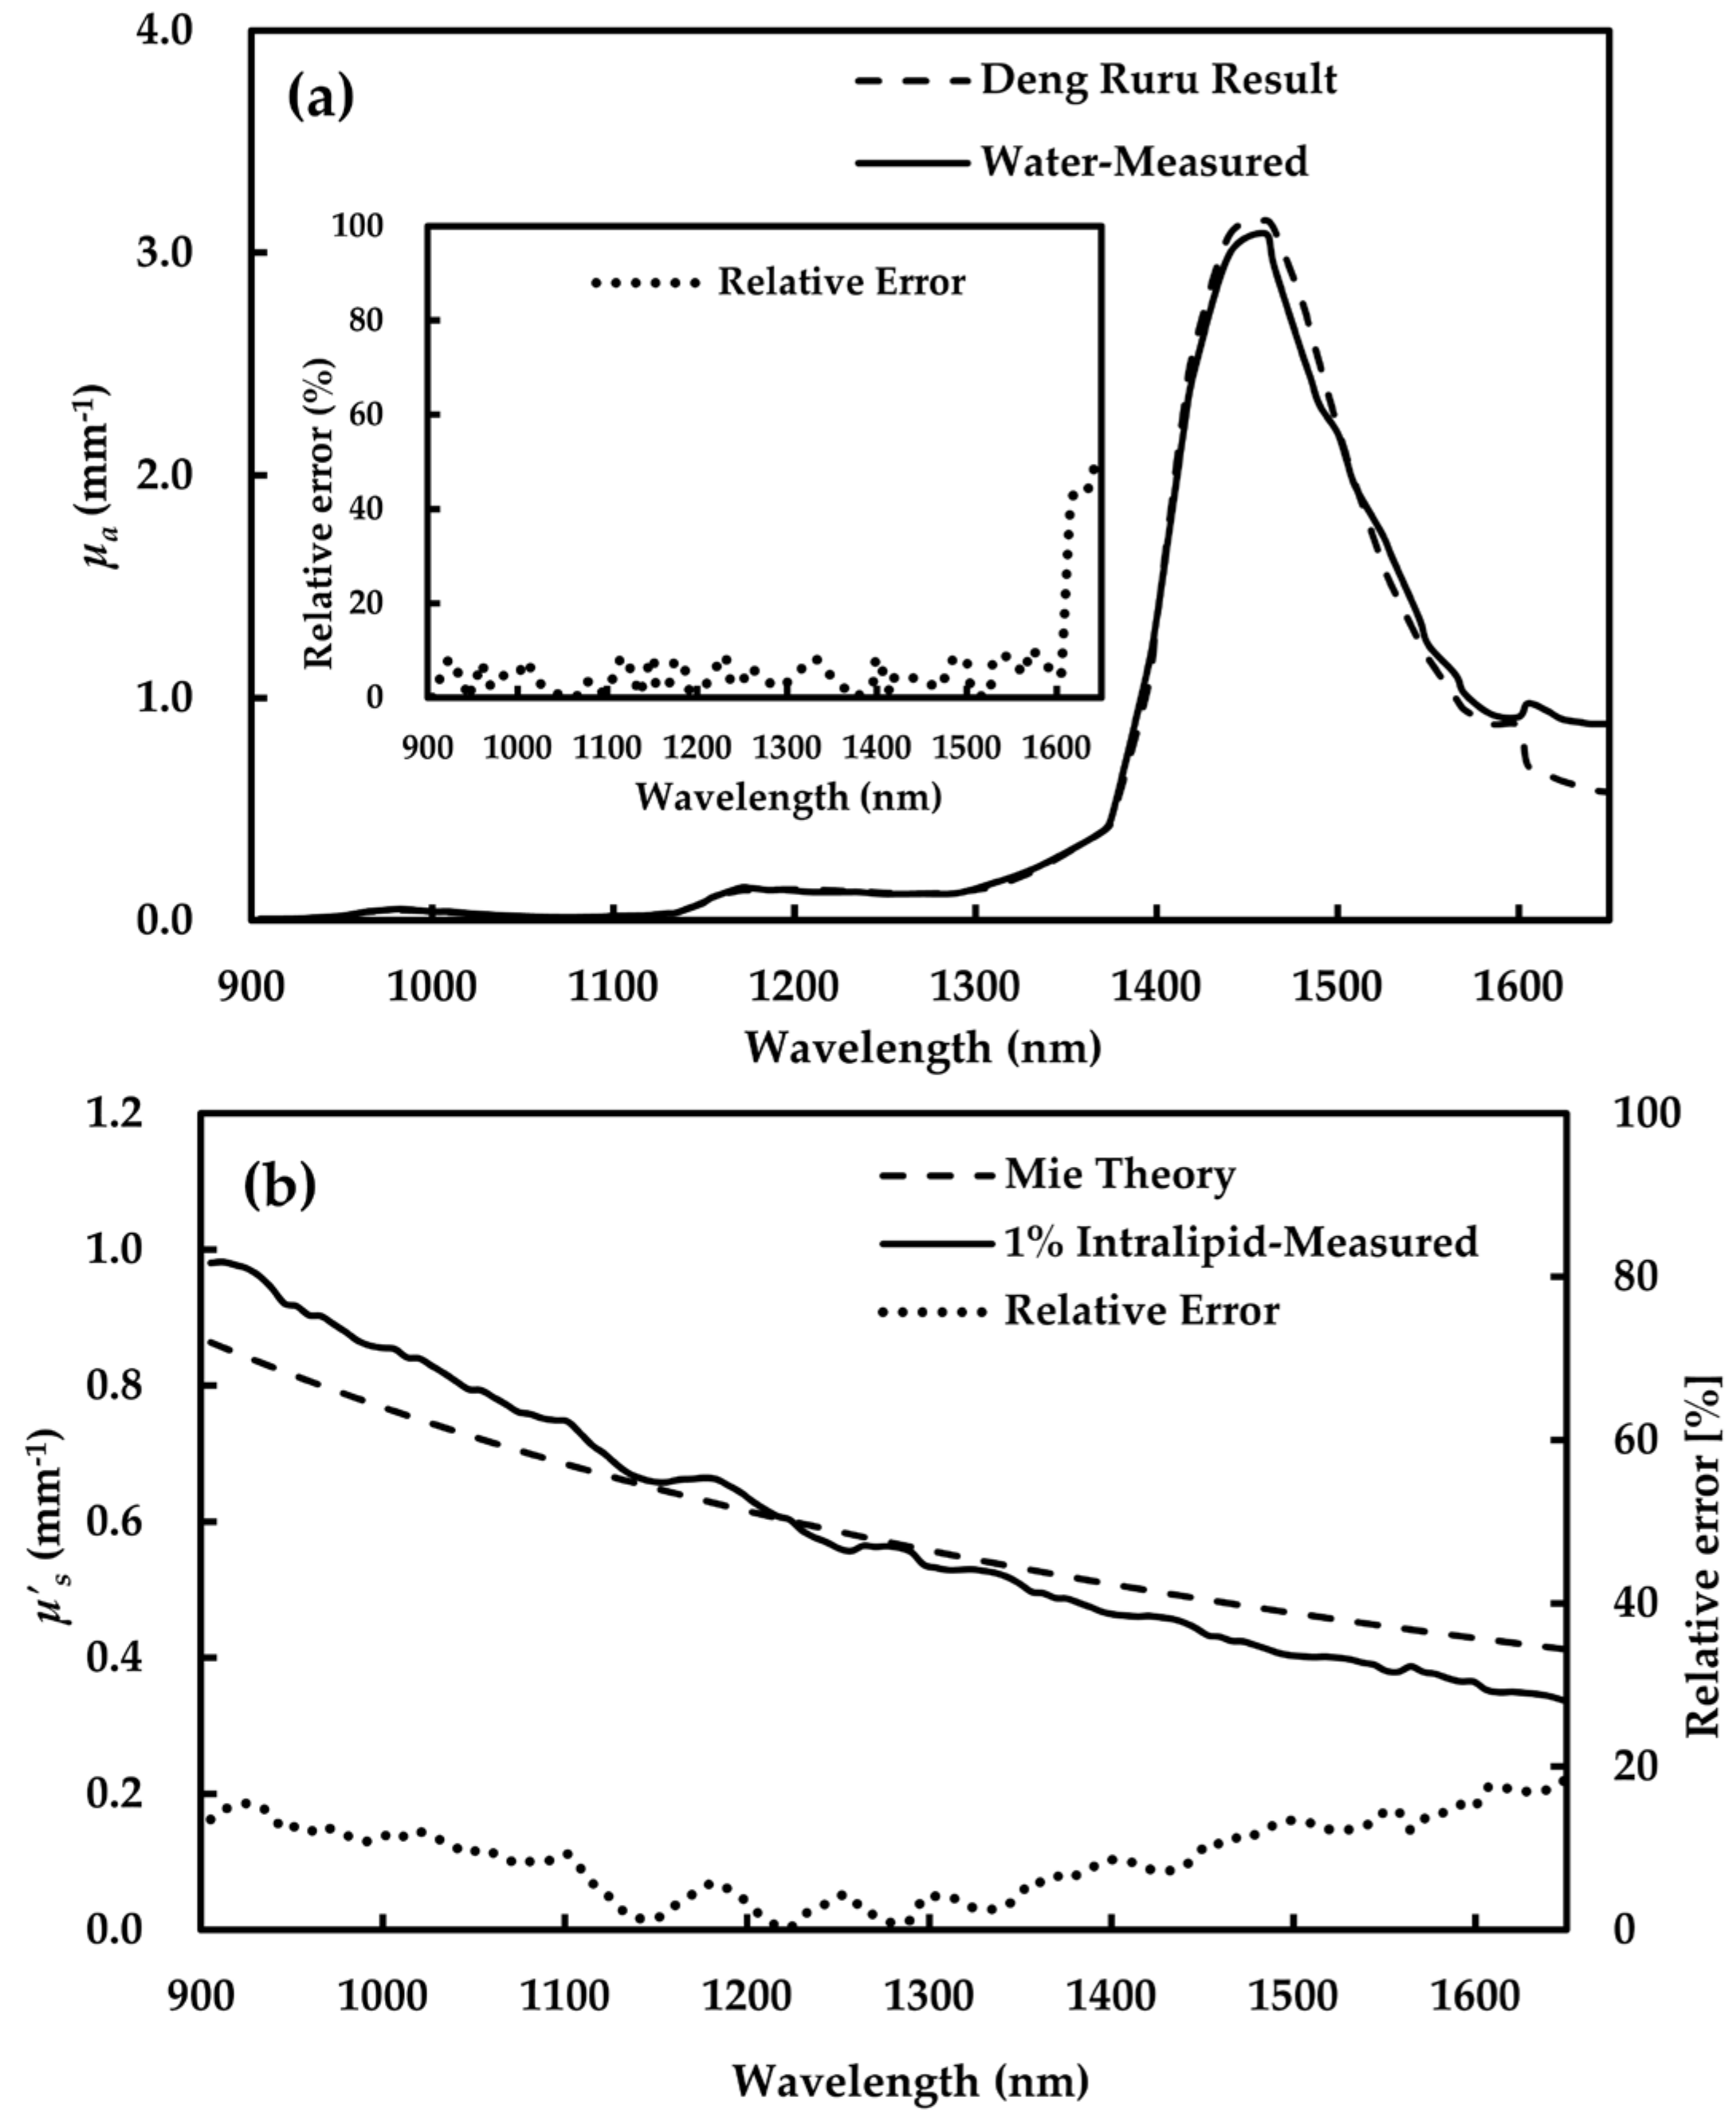
3.1. Validation Results of Optical Properties

The system in Figure 2a shows the curves of μa of water obtained by AIS and μa reported by Deng et al. [39]. The results are in agreement with previous reports, which find that there are three absorption peaks at 1485, 1169 and 980 nm. In addition, the relative error of μa values at 905–1600 nm ranged from 0.03% to 10.25%. Figure 2b presents the curve of μs values of 1% Intralipid based on AIS. A comparison of the measured μs and reference value based on Mie theory revealed that both profiles showed a downward trend with the increase in wavelengths [38], and the mean relative error was 9.20%. However, the relative error of μa and μs after 1600 nm clearly increases. This is due to a low signal-to-noise ratio of the spectrometer, or more detected interference signals. Therefore, μa and μs at 905–1600 nm were taken as the effective data in this study.

3.2. Spectral Analysis

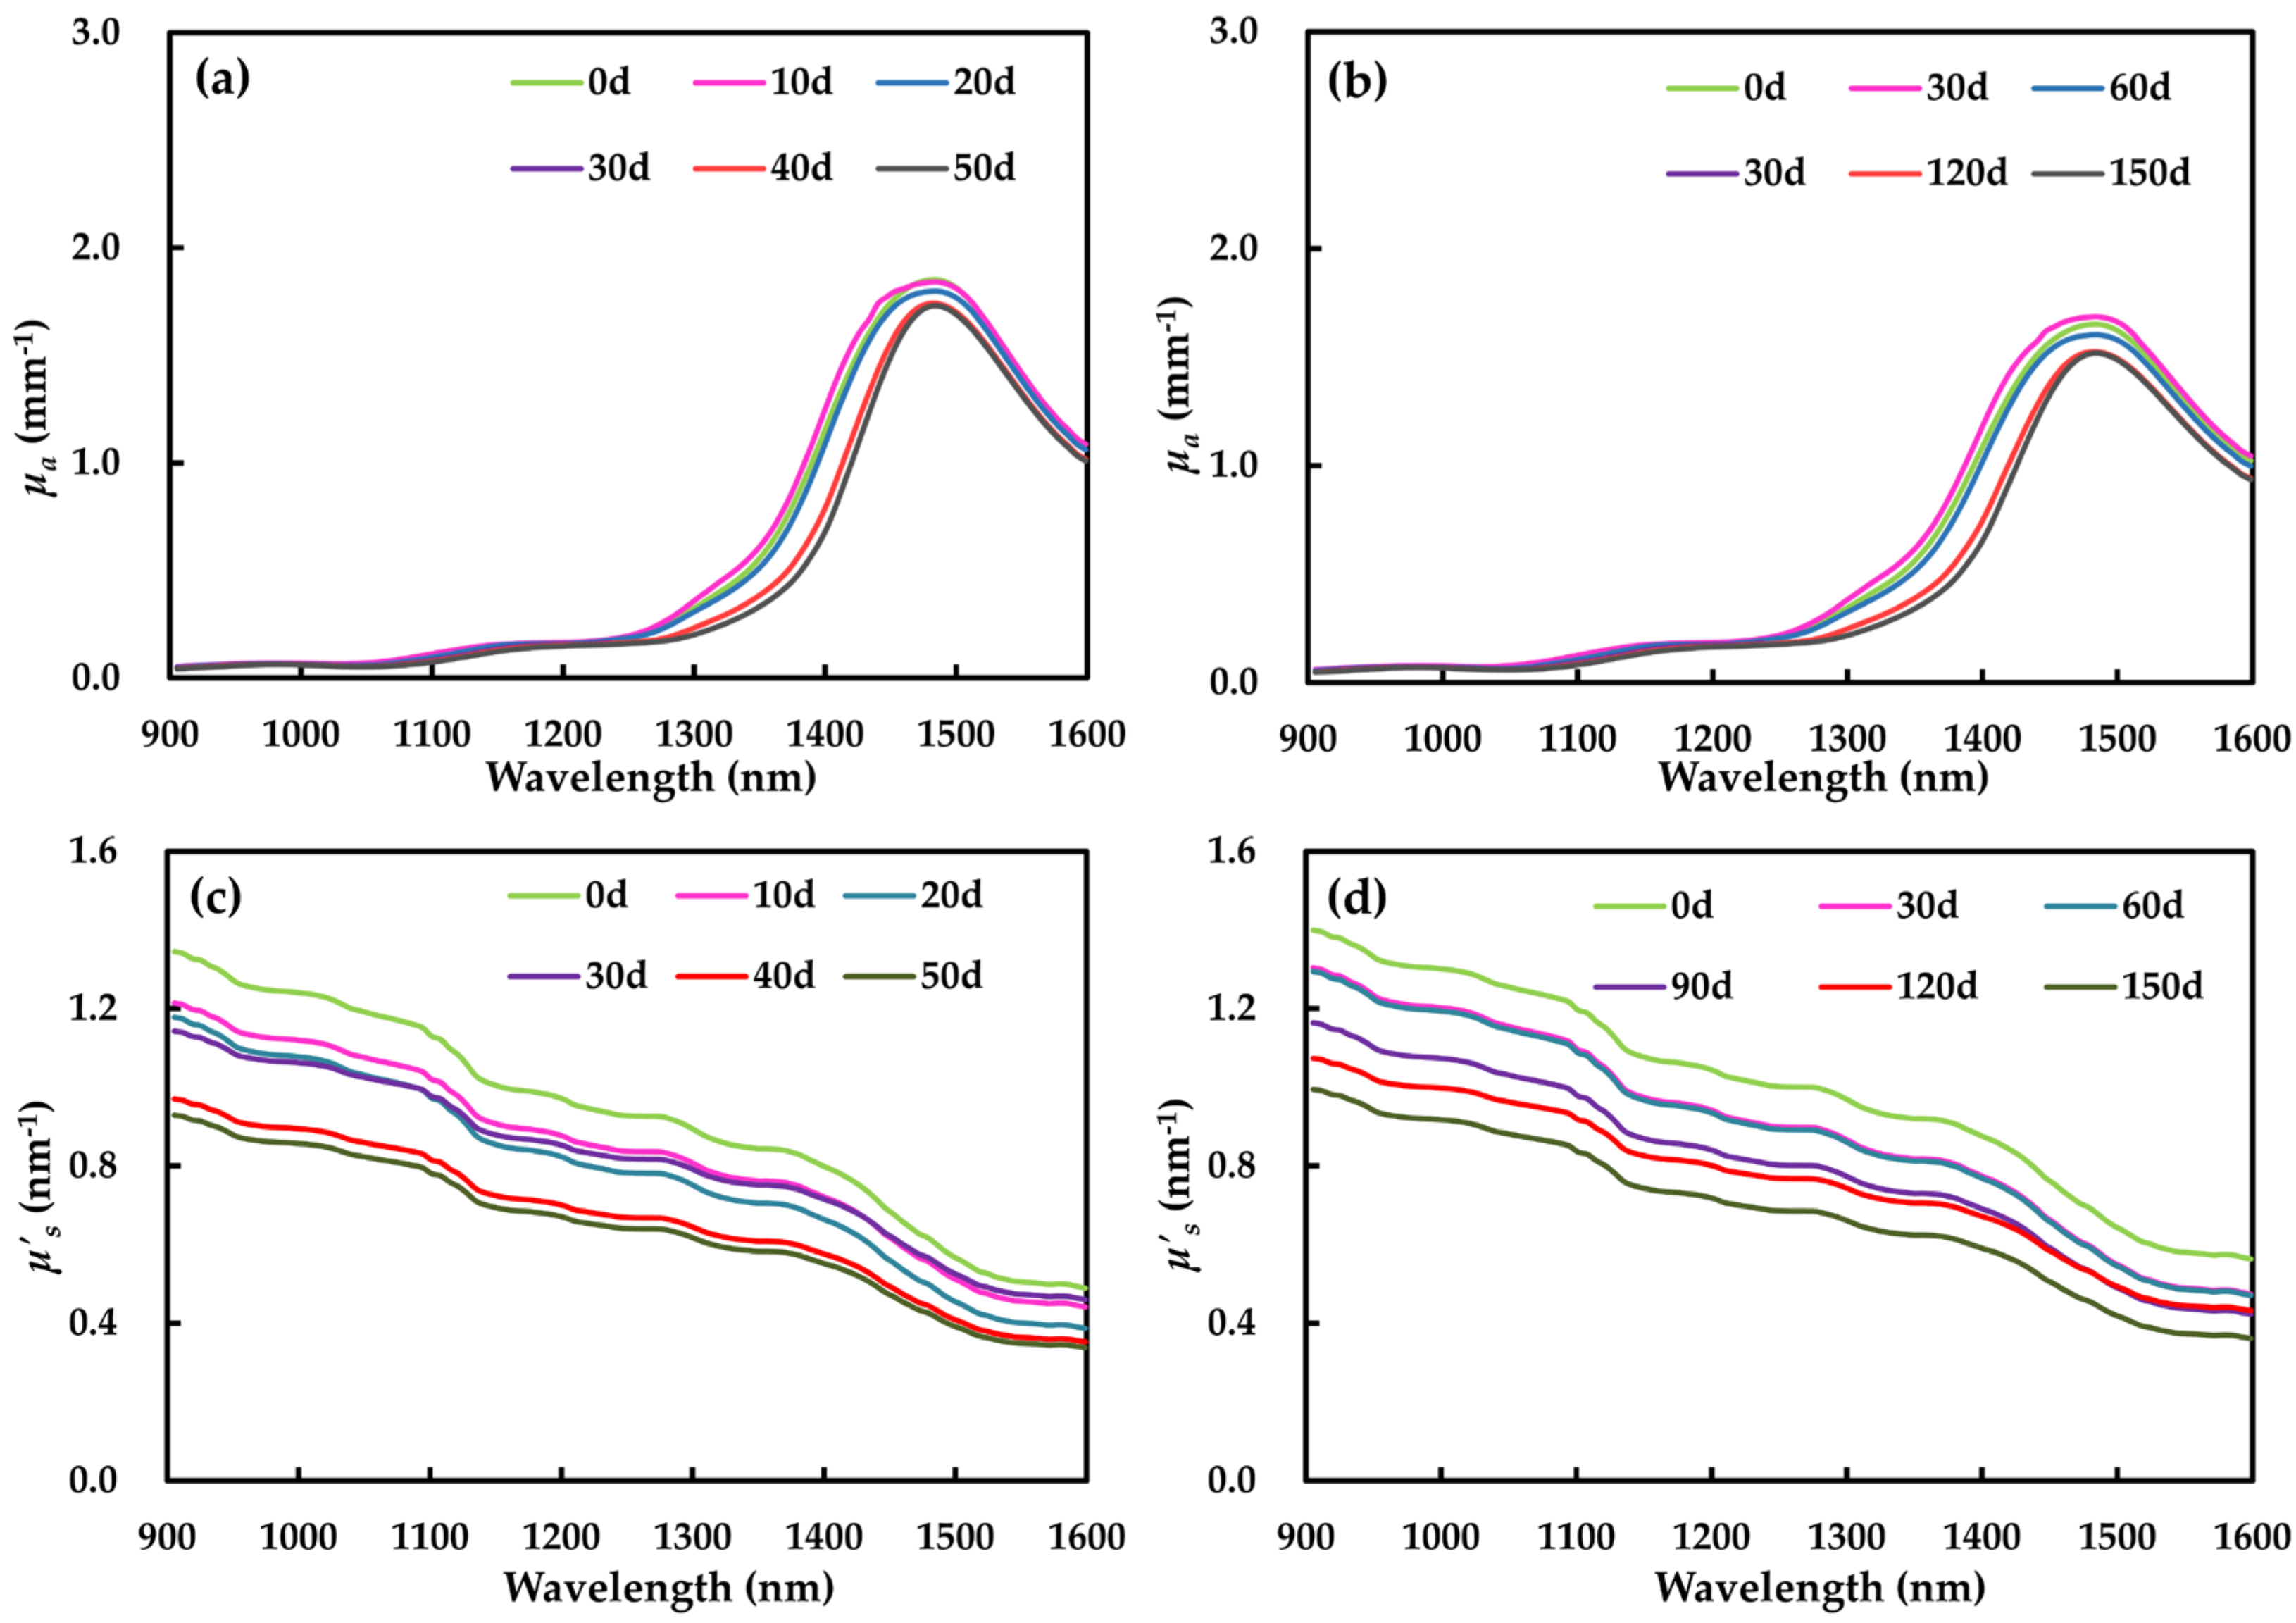
3.2.1. Absorption Coefficient

The results obtained from the mean μa spectra of apple samples storage at 25 and 0 °C are set out in Figure 3a,b. The graphs show that there has been a similar spectral trend, peaking at 980, 1169 and 1485 nm, which corresponds to the vibration absorption of O-H, C-H and C-C [41]. In addition, the absorption at 1485 nm was significantly stronger than that at 980 and 1169 nm, with values (1.52–1.88 mm−1) being 10 times higher than that of the others. In addition, the μa value peaked at1485 nm when the apple was stored at 25 °C after 10 days. There was no significant difference between day 0 and day 20, and μa decreased significantly on the 30th, 40th and 50th days. At 0 °C, μa at 1485 nm showed a similar trend with that at 25 °C, with the largest value on the 30th day during storage.
The μa values of apple flesh stored at 25 and 0 °C were within 0.04 and 1.88, and within 0.05 and 1.67 mm−1, respectively. Generally, the μa values in this study were comparable to those reported in other research. In the study by Ma et al. [35], the μa values of apple samples were 0.00–0.50 mm−1, measured by HIS at 1000–1800 nm. The research of Saeys et al. reported the μa values of Royal Gala (0.00–2.20 mm−1) based on IS at 350–2200 nm [33]. An important issue that emerged from the data is the dramatic difference in absorption values of apple flesh measured by different techniques. The μa obtained using IS is much higher than that with HIS. This may be due to the different sample tissue state, different varieties of apples, different wavelength ranges as well as different measured method in the absorption property [42].

3.2.2. Reduced Scattering Coefficient

Compared with absorption coefficient, the reduced scattering coefficient displays different changing patterns in the spectral region of 905–1600 nm (Figure 3c,d). The μs spectral was flatter and steadily decreased with increasing wavelength. In addition, the μ’s spectral changed consistently as storage time progressed, which was in accordance with studies of He et al. [28] and Cen et al. [31]. The scattering coefficient at 905–1600 nm was in 0.34–1.40 mm−1, which was smaller than μs of Royal Gala (1.00–1.50 mm−1) [33]. This may be related to different apple cultivars [43]. Within the short wave near infrared region (905–1100 nm), the scattering property was still stronger than the absorption property. μs was more than seven times the value of μa, ranging from 0.80 to 1.40 mm−1 at 25 °C, and from 0.04 to 0.11 mm−1 at 0 °C. This result was also reported in Wei et al. [36]. In the range of medium wave near infrared (1100–1600 nm), the scattering property gradually declined, and the absorption became the dominant optical property as the wavelength increased [33].

3.3. SSC and Soluble Sugars Contents

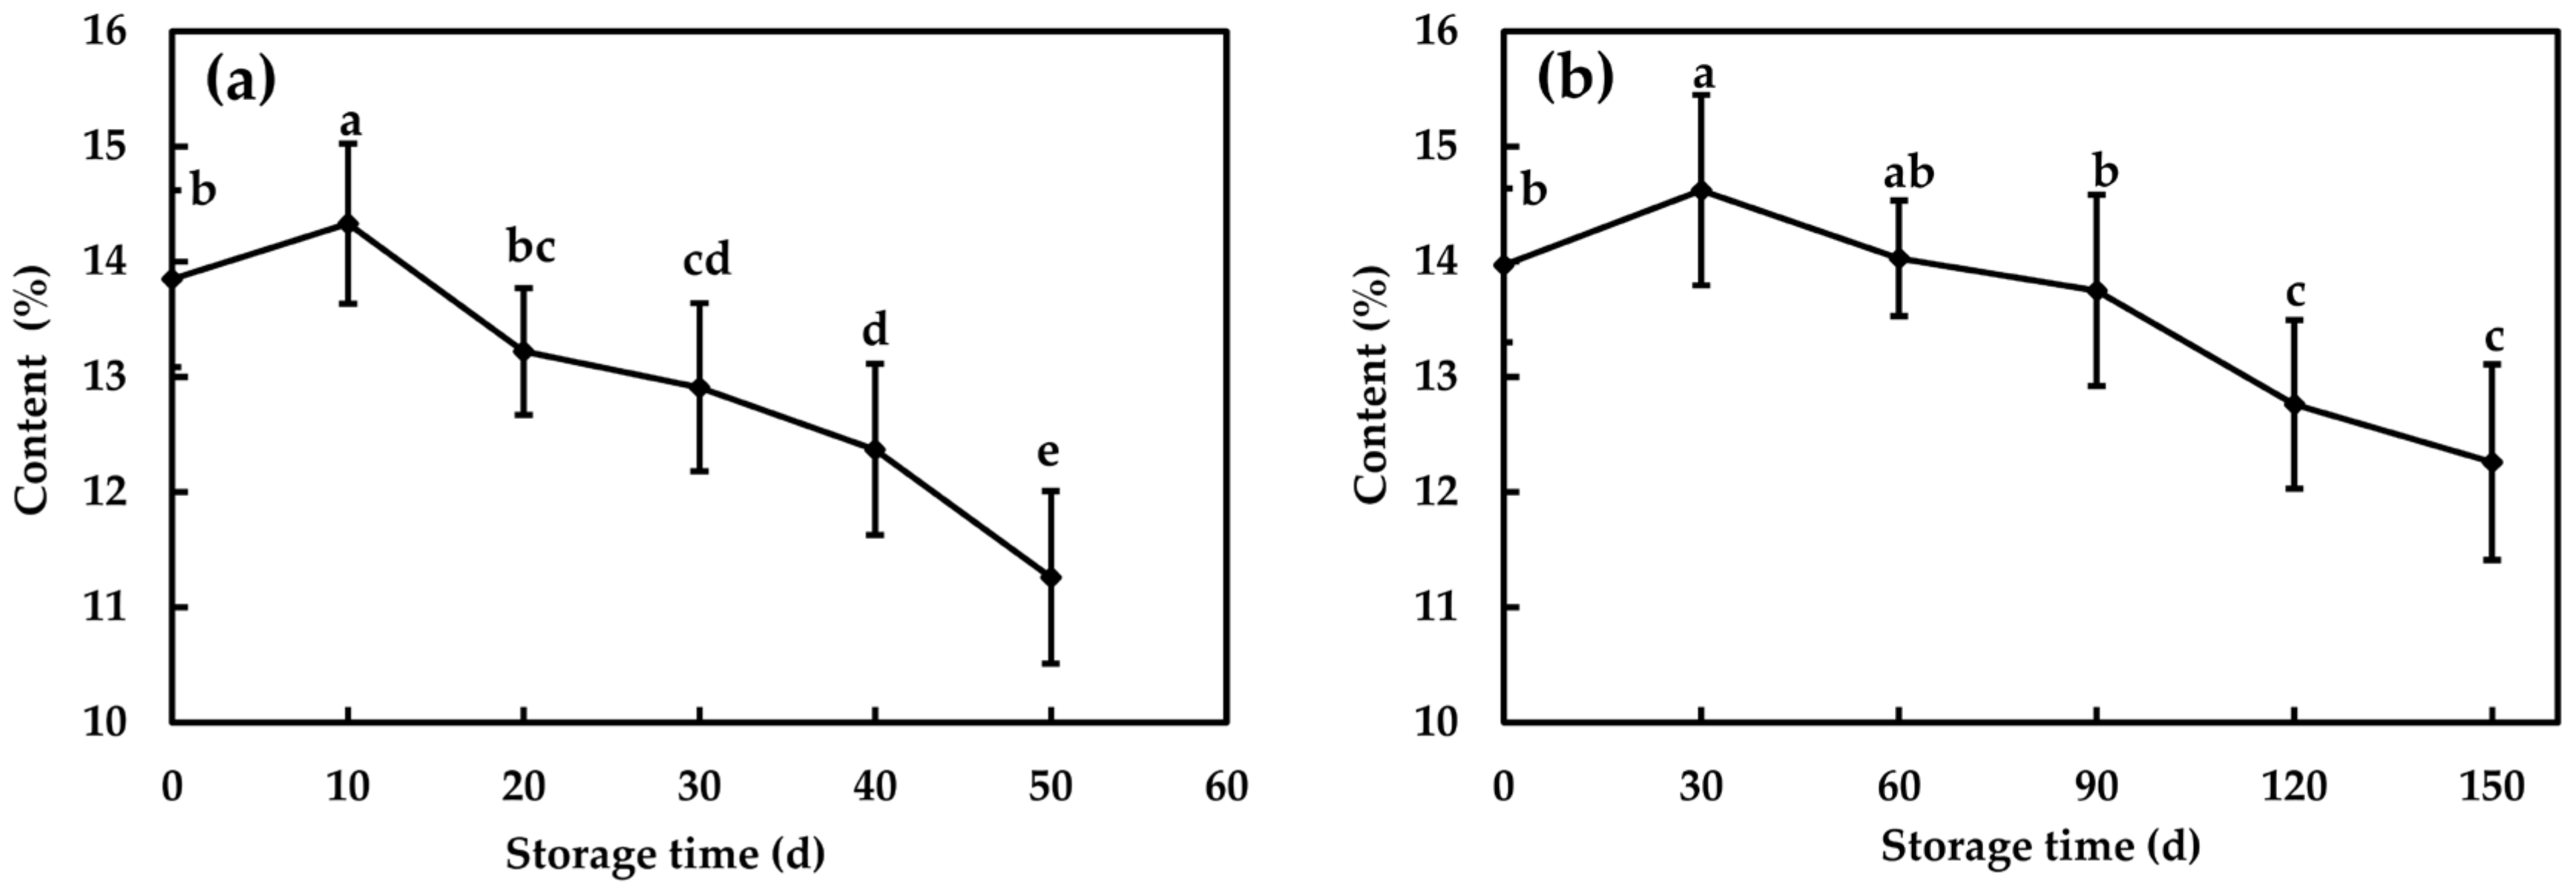
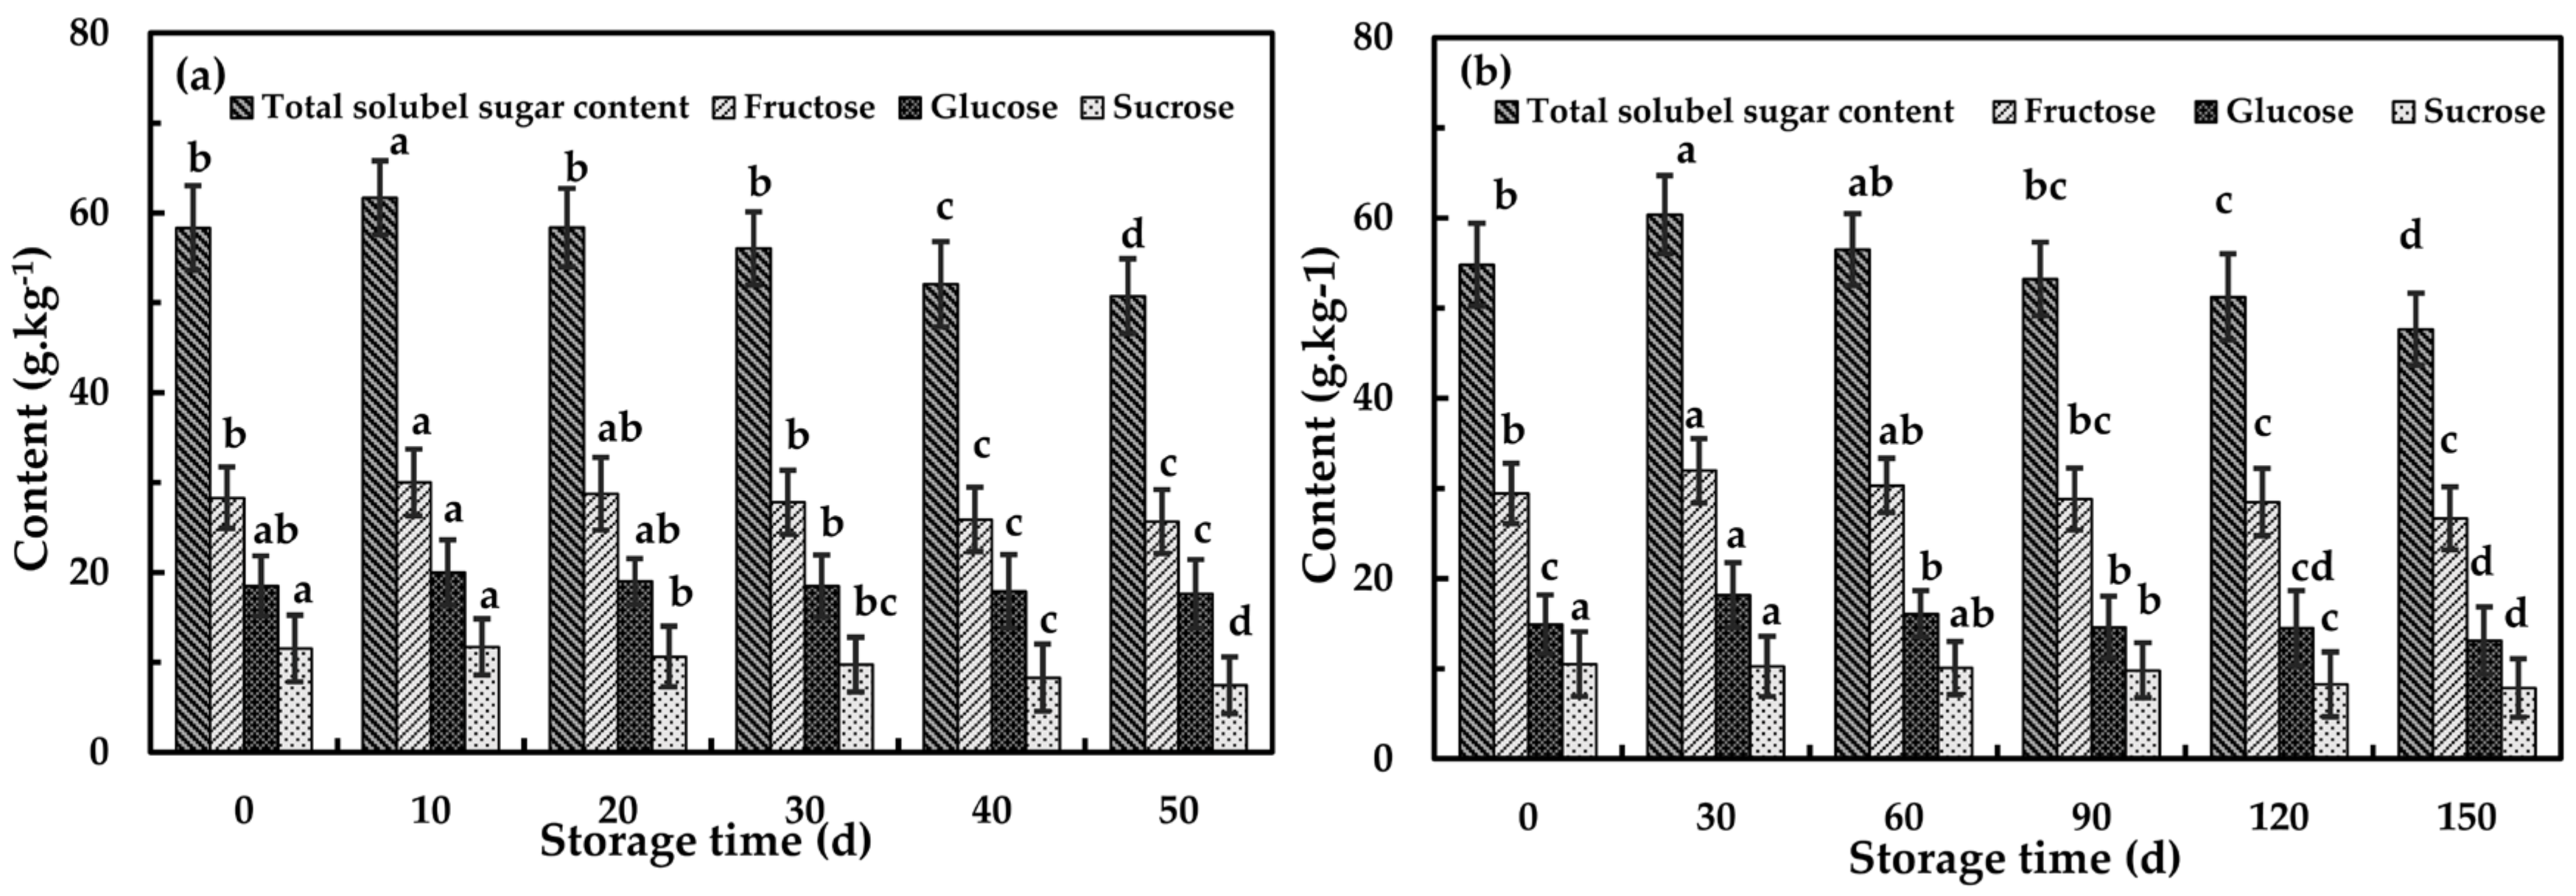
3.3.1. Changes of Contents of Soluble Solid and Soluble Sugars

At 25 and 0 °C, SSC showed the trend of increasing before decreasing, and separately reached the maximum value on the 10th and 30th day (Figure 4). As shown in Figure 5, the TSS, fructose and glucose contents of flesh increased significantly due to starch hydrolysis, while the sucrose content remained at a high level, with no significant change in the early stage of storage at 25 and 0 °C [44]. This was also consistent with the phenomenon that the fruit will turn sweet during the storage after harvest. After storage, SSC declined significantly (p < 0.05), from 13.85% to 11.26% at 25 °C and from 13.97% to 12.26% at 0 °C.
Increasing with storage time, the contents of TSS, fructose, glucose and sucrose gradually declined, and reached the lowest value at the end of storage. At 25 °C, the contents of TSS, fructose and glucose reached the highest value on the 10th day. After 50 days storage, the contents of TSS, fructose and glucose were reduced to 50.72, 25.67 and 17.62 g kg−1, respectively. In addition, the content of sucrose decreased from 11.52 to 7.44 g kg−1. At 0 °C, the TSS, fructose and glucose contents reached the highest value at a slower rate than at 25 °C, and reached the peak on the 30th day, with levels of 60.34, 31.95 and 18.14 g kg−1, respectively. On the 150th day, the TSS, fructose and glucose contents were the lowest, 47.62, 26.66 and 13.09 g kg−1, respectively. The content of sucrose did not change significantly during 60-day storage and reached the minimum value of 7.86 g kg−1 on the 150th day.

3.3.2. Relationships among SSC and Soluble Sugar Contents

Relationships among the contents of TSS, fructose, glucose, sucrose and SSC were measured on a one to one basis, and SSC presented a positive association profile with TSS, fructose, glucose and sucrose during storage at 25 and 0 °C (p < 0.05) in Table 1 and Table 2. It is clear that among TSS and the three soluble sugars, sucrose had the strongest association with the changes of SSC with high corresponding r values of 0.973 at 25 °C and 0.963 at 0 °C. Other soluble sugars had lower contributions to the correlations with SSC, shown as a second relation with TSS and fructose, and finally glucose. The results were consistent with the report by Wei et al. [36]. It should be noted that significant positive correlations were found between TSS with three types of soluble sugars (r > 0.847), and fructose contributed the most to the correlation with TSS, with r values of 0.974 at 25 °C and 0.975 at 0 °C. This could be expected as the content of fructose comprised the largest fraction of the TSS content.

3.4. Optical Properties–SSC–Soluble Sugars Contents Relations

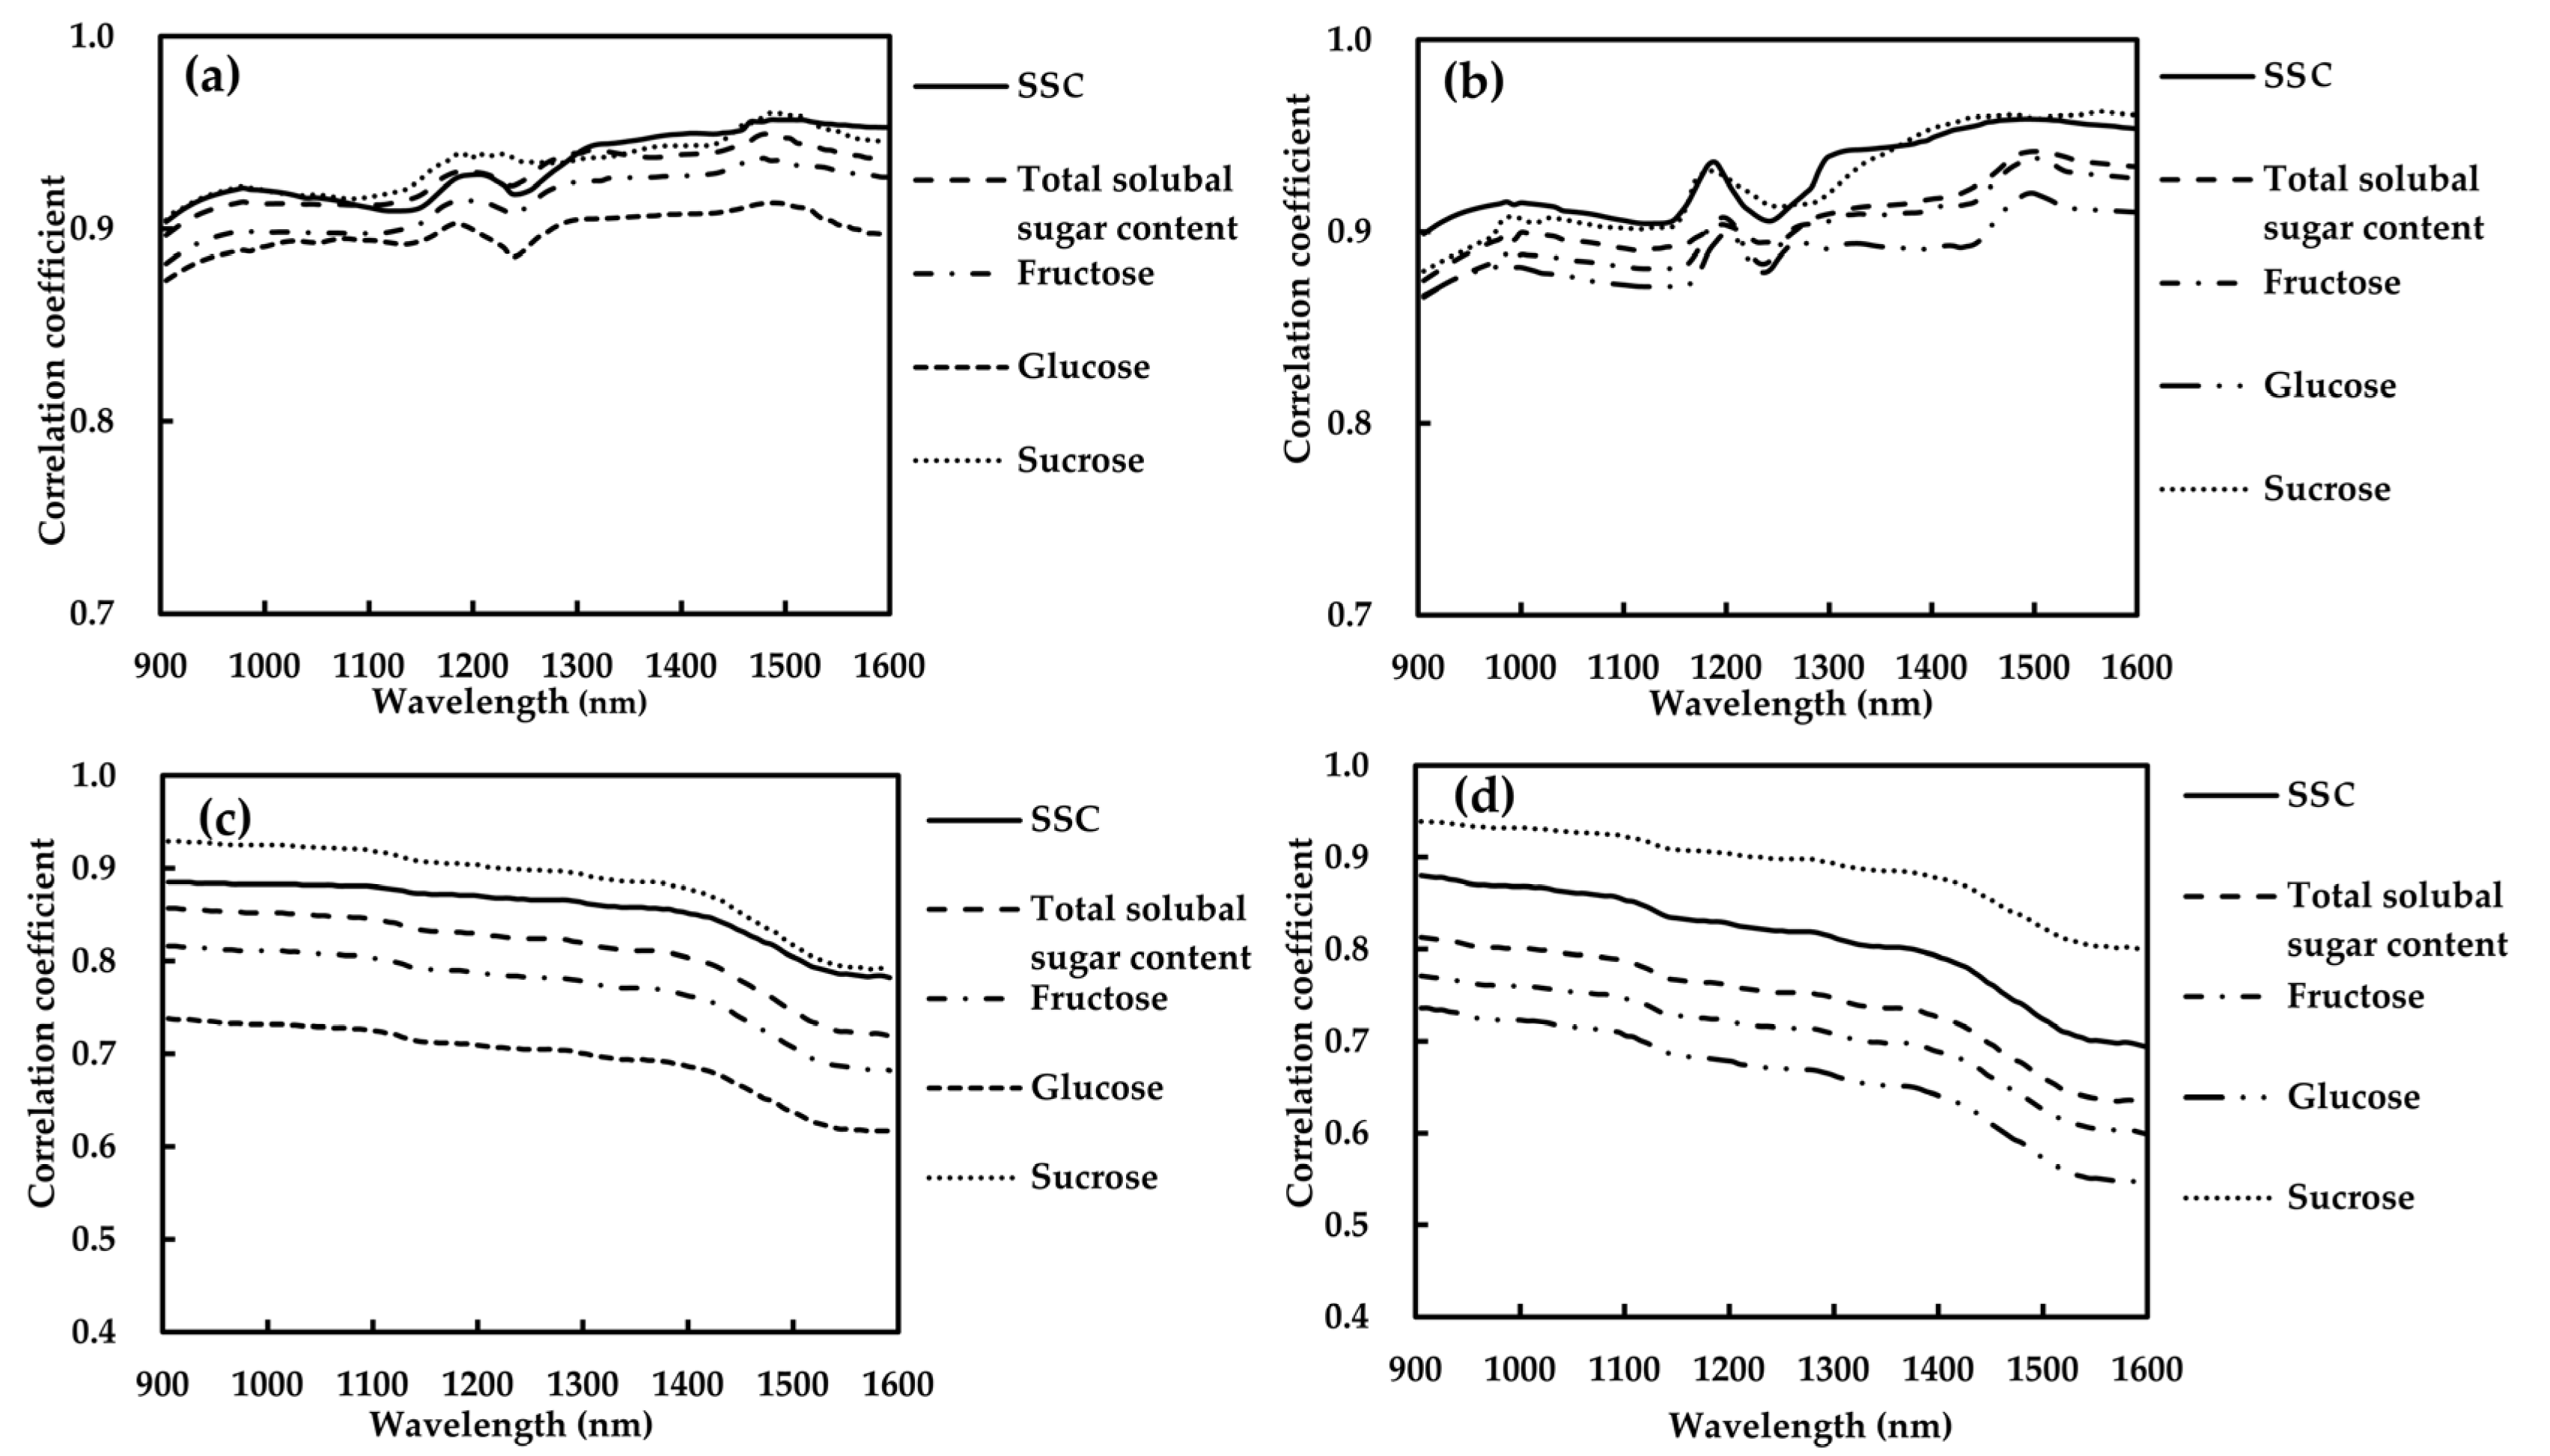
3.4.1. Absorption Coefficient–SSC–Soluble Sugars Contents Relations

The r values between the absorption coefficient of apple flesh at 905–1600 nm and SSC, TSS content and soluble sugars contents at 25 and 0 °C are shown in Figure 6a,b, respectively. The μa was positively associated with SSC, TSS content and soluble sugars contents in the whole range, exhibiting high r values of 0.873–0.960 at 25 °C and 0.863–0.963 at 0 °C. A previous study reported a similar result, specifically that SSC is positively correlated with μa at 1198 nm [35]. At 905–1600 nm, the r profile between μa and the SSC, TSS content and soluble sugars contents had similar patterns, with almost increasing tendencies with increasing wavelengths. Therefore, from Figure 6a,b, we could observe that SSC and soluble sugars presented stronger correlation in the medium-wave near infrared region than in the short-wave near infrared region. Compared to the report of Wei et al. [36], the average r values μa and the SSC and TSS content and soluble sugars contents at 905–1050 nm were different. This may be due to different samples used in the two studies and different rates of accumulation or decomposition of soluble sugars. However, due to increasing response to the content information of chemical components, the correlation between absorption properties and soluble sugars increases with the increasing of the wavelength in the whole visible-medium wave near infrared region in general [45].
Overall, SSC (r = 0.933) and sucrose (r = 0.934) had the highest average correlation coefficients with μa, followed by TSS (r = 0.928), and finally fructose (r = 0.915) and glucose (r = 0.899) at 25 ° C. The phenomena may be connected to the strong correlation between SSC and sucrose content. At 0 ° C, r values of μa and the SSC, TSS content and soluble sugars contents ranged from 0.890 to 0.930. The result also showed that μa peaked at 980, 1169 and 1485 nm, and the correlation at the three peaks increased successively, with r ranges of 0.881–0.922, 0.894–0.938 and 0.913–0.961, which was in good agreement with the successively stronger spectral signal. To further investigate the correlations with SSC and sucrose content, Table 3 plotted the direct linear correlations of μa at 980, 1169 and 1485 nm with SSC and sucrose content (25 °C). The coefficients of determination (R2) of the equations were between 0.848 and 0.921. Results from the equations indicate that SSC and sucrose content gave good linear correlations with μa, with an R2 of 0.915 and 0.921, respectively, which confirms the results shown in Figure 6a.

3.4.2. Scattering Coefficient–SSC–Soluble Sugars Contents Relations

The values of r between μa and either SSC or contents of soluble sugars, when compared with the respective r between μs and the same variables, exhibited different patterns; μs decreased gradually with the increase in wavelength (Figure 6c,d) which may be related to the decreased values of μs over the whole investigated wavelength range. It was also observed that soluble solid and soluble sugars were positively correlated with scattering properties. At 25 °C, the average r values of SSC, TSS fructose, glucose and sucrose with μs were 0.855, 0.811, 0.771, 0.695 and 0.884, respectively. At 0 °C, the average values of r were 0.808, 0.742, 0.704, 0.659 and 0.887, respectively. Moreover, SSC, TSS, fructose and sucrose have higher correlation with μs than glucose. Among the three types of soluble sugars, μs was most related to sucrose (r = 0.789–0.939), followed by fructose (r = 0.599–0.816) and glucose (r = 0.544–0.738). The same result was found in the correlation of SSC and μa with the three soluble sugars. The findings proved that the sucrose contributed the most to the strong relationship between optical properties and SSC.
According to the results of Section 3.4.1 and Section 3.4.2, the correlation between soluble sugars and μa was stronger than that between soluble sugars and μs in the whole visible-medium wave near infrared region. Besides, with the increase in wavelength, the correlation between soluble sugars and μa increased, while the correlation between soluble sugars and μs decreased. It could be inferred that μa was more associated with chemical components, while μs was less correlated with them [7,30,36,46]. Furthermore, previous study presented that scattering property was influenced by microstructure. Rowe et al. [26] measured the optical spectra of apples over the range of 400–1050 nm using IS and obtained an average r of–0.68 between the μs and firmness. Liu et al. showed that μs of kiwifruit had stronger correlation with firmness (r = 0.74–0.87) than with SSC (r = 0.49–0.81) and moisture content (r = 0.59–0.80) [7]. These studies indicated that the absorption and scattering properties had potential to determine the internal quality of apple.

3.5. SSC and Soluble Sugars Contents Predictions

Table 4 generalized the statistics of PLS model results of calibration and prediction using μa and μs at 905–1600 nm for SSC and the contents of soluble sugars of Fuji apple. The Rc2 of the modeling set was higher than the Rp2 of the prediction set, thus these models were reliable. Among the three prediction models of soluble sugars based on μa and μs, the best model was for sucrose content (Rp2 > 0.7365, RMSEP < 1.458 g/kg). In addition, the models relied on μa, and the μs for fructose and glucose content were slightly worse, the Rp2 values of which were in the range of 0.635–0.781 and 0.593–0.725, and the RMSEP values were 1.570–2.216 g/kg and 1.344–1.906 g/kg. A previous study reported similar results in that the prediction results on optical properties for sucrose were better than fructose and glucose [36].
In addition, the Rp2 values of the five prediction models based on μa were in the range of 0.752–0.851, and the RMSEP values of the SSC and soluble sugar models were 0.329% and 1.047–2.062 g/kg, respectively. Li et al. [47] assessed the SSC of apple based on near infrared spectroscopy, with the results of Rp2 and RMSEP in the ranges of 0.576–0.854 and 0.547–0.673%, and the prediction accuracy of SSC was equivalent to the present study. In addition, according to the model results (Table 4), the prediction results based on μa were better than the model results based on μs, which further proved that SSC and soluble sugars were more correlated with μa than μs. The findings obtained from this study made a contribution to the fact the light absorption links to the chemical compositions of materials, and that scattering of photons is a physical procedure that greatly depends on the wave characteristics of photons and the structures of mediums.
In general, the prediction models for sucrose based on μa in this study performed well (Rp2 = 0.851, RMSEP = 1.047). The models for sucrose in 400–1050 nm built with the AIS system, according to the report of Wei et al. [36], were second to the models of our study. According to their study, the models’ Rp2 and RMSEP values were 0.804 and 1.099, respectively. The result might be caused by the presence of the more obvious bonds C-H, O-H, C-C with a longer wavelength, which indicated that the absorption properties of the mid-wave near infrared region are more suitable for the quantitative detection of soluble solids and soluble sugars.

4. Conclusions

The optical properties of Fuji apple during storage in two different storage conditions (25 °C, 50 days; 0 °C, 150 days) were evaluated by the AIS system at 905–1600 nm, and the exact relationships of absorption and scattering properties with SSC and soluble sugars contents were explored. The changes of μa, μs, SSC and soluble sugars contents showed a similar pattern at the two experimented temperatures during storage. Three prominent absorption peaks at 980, 1169 and 1485 nm were noticed for the spectra of μa. In addition, μa and μs were positively associated with SSC and soluble sugars contents (r = 0.659–0.936), and their values are greatly relied on the wavelength. Thus, it could be easily understood that the decreases in SSC and soluble sugar content were accompanied by declines in μa and μs. Additionally, the μa had stronger correlation with these soluble components than with μs. Another important conclusion was that both SSC and μa were more strongly correlated with sucrose content, with r values of 0.933, 0.934 (at 25 °C) and 0.930, 0.927 (at 0 °C). Moreover, partial least square regression (PLS) models for SSC and soluble sugars contents were developed, with the best performance of Rp2 = 0.851 and RMSEP = 1.047, which appeared in the model of sucrose based on μa. Furthermore, due to better measuring bonds of C-H, O-H, C-C at the longer wavelength range, the prediction model at 905–1600 nm performed better than the models developed in the 400–1050 nm range in the report of Wei et al. [36]. Thus, these results made the mechanism for detecting SSC of apples based on optical techniques clear. The strong association between the absorption properties and the sucrose content provided potential and theoretical support in assessing SSC based on optical techniques.
However, this study was carried out on a relatively limited number of fruit and only on apples from one cultivar. Further work needs to involve the investigation of exact relationships between absorption and scattering properties and soluble sugars contents of other varieties of apple flesh, as well as the correlation of optical properties with other components which contribute to quality, such as to firmness.

Author Contributions

Conceptualization, K.T. and L.P.; methodology and data curation, K.W. and L.F. (Li Fang); formal analysis, J.P., L.F. (Li Feng) and J.W.; investigation, K.W.; writing—original draft preparation, L.F. (Li Fang); writing—review and editing, L.P. and K.T.; visualization, L.F. (Li Feng) and J.W.; supervision, K.T. and J.P.; project administration, K.T. and L.P.; funding acquisition, L.P. All authors have read and agreed to the published version of the manuscript.

Funding

This research was funded by Chinese National Foundation of Nature and Science (31671926), Fundamental Research Funds for the Central Universities (KYLH202003) and the Priority Academic Program Development of Jiangsu Higher Education Institutions (PAPD).

Conflicts of Interest

The authors declare no conflict of interest.

References

  1. Li, M.J.; Feng, F.J.; Cheng, L.L. Expression patterns of genes involved in sugar metabolism and accumulation during apple fruit development. PLoS ONE 2012, 7, 33055. [Google Scholar] [CrossRef] [PubMed] [Green Version]
  2. Wei, X.; He, J.; Zheng, S.; Ye, D. Modeling for SSC and firmness detection of persimmon based on NIR hyperspectral imaging by sample partitioning and variables selection. Infrared Phys. Technol. 2019, 103099. [Google Scholar] [CrossRef]
  3. Li, J.; Zhang, H.; Zhan, B.; Wang, Z.; Jiang, Y. Determination of SSC in pears by establishing the multi-cultivar models based on visible-NIR spectroscopy. Infrared Phys. Technol. 2019, 102, 103006. [Google Scholar] [CrossRef]
  4. Fan, S.; Wang, Q.; Tian, X.; Yang, G.; Xia, Y.; Li, J.; Huang, W. Non-destructive evaluation of soluble solids content of apples using a developed portable Vis/NIR device. Biosyst. Eng. 2020, 198, 138–148. [Google Scholar] [CrossRef]
  5. Guo, Z.; Wang, M.M.; Agyekum, A.A.; Wu, J.J.; Chen, Q.S.; Zuo, M. Quantitative detection of apple watercore and soluble solids content by near infrared transmittance spectroscopy. J. Food Eng. 2020, 279, 109955. [Google Scholar] [CrossRef]
  6. Sun, Y.; Wei, K.L.; Liu, Q.; Pan, L.; Tu, K. Classification and discrimination of different fungal diseases of three infection levels on peaches using hyperspectral reflectance imaging analysis. Sensors 2018, 14, 1295. [Google Scholar] [CrossRef] [Green Version]
  7. Liu, Q.; Wei, K.L.; Xiao, H.; Tu, S.C.; Sun, K.; Sun, Y.; Pan, L.Q.; Tu, K. Near-infrared hyperspectral imaging rapidly detects the decay of postharvest strawberry based on water-soluble sugar analysis. Food Anal. Methods 2019, 12, 936–946. [Google Scholar] [CrossRef]
  8. Valero, C.; Ruizaltisent, M.; Cubeddu, R.; Pifferi, A.; Taroni, P.; Torricelli, A.; Valentini, G.; Johnson, D.S.; Dover, C.J. Detection of internal quality in kiwi with time-domain diffuse reflectance spectroscopy. Appl. Eng. Agric. 2004, 20, 223–232. [Google Scholar] [CrossRef]
  9. Oliveira-Folador, G.; Bicudo, M.D.O.; de Andrade, E.F.; Renard, C.M.-G.C.; Bureau, S.; de Castilhos, F. Quality traits prediction of the passion fruit pulp using NIR and MIR spectroscopy. LWT Food Sci. Technol. 2018, 95, 172–178. [Google Scholar] [CrossRef]
  10. Adebayo, S.E.; Hashim, N.; Abdan, K.; Hanafi, M.; Mollazade, K. Prediction of quality attributes and ripeness classification of bananas using optical properties. Hortic. Sci. 2016, 212, 171–182. [Google Scholar] [CrossRef]
  11. Mo, C.Y.; Kim, M.S.; Kim, G.; Lim, J.; Delwiche, S.R.; Chao, K.L.; Li, H.; Cho, B.-K. Spatial assessment of soluble solid contents on apple slices using hyperspectral imaging. Biosyst. Eng. 2017, 159, 10–21. [Google Scholar] [CrossRef]
  12. Pan, L.Q.; Lu, R.F.; Zhu, Q.B.; McGrath, J.M.; Tu, K. Measurement of moisture, soluble solids, sucrose content and mechanical properties in sugar beet using portable visible and near-infrared spectroscopy. Postharvest Biol. Technol. 2015, 102, 42–50. [Google Scholar] [CrossRef]
  13. Xie, D.D.; Guo, W.C. Measurement and Calculation Methods on Absorption and Scattering Properties of Turbid Food in Vis/NIR Range. Food Bioprocess Technol. 2020, 13, 229–244. [Google Scholar] [CrossRef]
  14. Lu, R.F.; Van, B.R.; Saeys, W.; Li, C.; Cen, H. Measurement of optical properties of fruits and vegetables: A review. Postharvest Biol. Technol. 2020, 159, 111003. [Google Scholar] [CrossRef]
  15. Hu, D.; Fu, X.P.; Wang, A.C.; Ying, Y.B. Measurement methods for optical absorption and scattering properties of fruits and vegetables. Trans. ASABE 2015, 58, 1387–1401. [Google Scholar] [CrossRef]
  16. Tuchin, V. Tissue Optics: Light Scattering Methods and Instruments for Medical Diagnosis; SPIE Press: Bellingham, WA, USA, 2007. [Google Scholar]
  17. Pickering, J.W. Double-integrating-sphere system for measuring the optical properties of tissue. Appl. Opt. 1993, 32, 399–410. [Google Scholar] [CrossRef]
  18. López Maestresalas, A.; Aernouts, B.; Van Beers, R.; Arazuri, S.; Jarén, C.; De Baerdemaeker, J.; Saeys, W. Bulk optical properties of potato flesh in the 500–1900 nm range. Food Bioprocess Technol. 2015, 9, 463–470. [Google Scholar] [CrossRef] [Green Version]
  19. Nguyen, N.D.T.; Erkinbaev, C.; Tsuta, M.; De Baerdemaeker, J.; Nicolaï, B.; Saeys, W. Spatially resolved diffuse reflectance in the visible and near-infrared wavelength range for non-destructive quality assessment of ‘Braeburn’ apples. Postharvest Biol. Technol. 2014, 91, 39–48. [Google Scholar] [CrossRef]
  20. Vanoli, M.; Rizzolo, A.; Grassi, M.; Farina, A.; Pifferi, A.; Spinelli, L.; Torricelli, A. Time-resolved reflectance spectroscopy nondestructively reveals structural changes in ‘Pink Lady®’ apples during storage. Procedia Food Sci. 2011, 1, 81–89. [Google Scholar] [CrossRef] [Green Version]
  21. He, X.M.; Fu, X.P.; Li, T.W.; Rao, X.Q. Spatial frequency domain imaging for detecting bruises of pears. J. Food Meas. Charact. 2018, 12, 1266–1273. [Google Scholar] [CrossRef]
  22. Prahl, S.A.; Martin, J.C.; Germet, V.; Welch, A.J. Determining the optical properties of turbid media by using the adding-doubling method. Appl. Opt. 1993, 32, 559–568. [Google Scholar] [CrossRef] [PubMed]
  23. Wang, L.H.; Jacques, S.L.; Zheng, L.Q. Conv-convolution for responses to a finite diameter photon beam incident on multi-layered tissues. Comput. Meth. Prog. Biol. 1997, 54, 141–150. [Google Scholar] [CrossRef]
  24. Zhang, M.Y.; Li, C.Y.; Yang, F.Z. Optical properties of blueberry flesh and skin and Monte Carlo multi-layered simulation of light interaction with fruit tissues. Postharvest Biol. Technol. 2019, 150, 28–41. [Google Scholar] [CrossRef]
  25. Huang, Y.P.; Lu, R.F.; Chen, K. Assessment of Tomato Soluble Solids Content and pH by Spatially-Resolved and Conventional Vis/NIR Spectroscopy. J. Food Eng. 2018, 236, 19–28. [Google Scholar] [CrossRef]
  26. Rowe, P.I.; Künnemeyer, R.; McGlone, A.; Talele, S.; Martinsen, P.; Seelye, R. Relationship between tissue firmness and optical properties of ‘Royal Gala’ apples from 400 to 1050 nm. Postharvest Biol. Technol. 2014, 94, 89–96. [Google Scholar] [CrossRef]
  27. Zhang, S.; Wu, X.H.; Zhang, S.H.; Cheng, Q.L.; Tan, Z.J. An effective method to inspect and classify the bruising degree of apples based on the optical properties. Postharvest Biol. Technol. 2017, 127, 44–52. [Google Scholar] [CrossRef]
  28. He, X.M.; Fu, X.P.; Rao, X.Q.; Fang, Z.H. Assessing firmness and SSC of pears based on absorption and scattering properties using an automatic integrating sphere system from 400 to 1150 nm. Postharvest Biol. Technol. 2016, 121, 62–70. [Google Scholar] [CrossRef]
  29. Wang, W.; Li, C.; Gitaitis, R. Optical properties of healthy and diseased onion tissues in the visible and near-infrared spectral region. Trans. ASABE 2014, 57, 1771–1782. [Google Scholar] [CrossRef]
  30. Vanoli, M.; Zerbini, P.; Spinelli, L.; Torricelli, A.; Rizzolo, A. Polyuronide content and correlation to optical properties measured by time-resolved reflectance spectroscopy in ‘Jonagored’ apples stored in normal and controlled atmosphere. Food Chem. 2009, 115, 1450–1457. [Google Scholar] [CrossRef]
  31. Cen, H.Y.; Lu, R.F.; Mendoza, F.A.; Beaudry, R.M. Relationship of the optical absorption and scattering properties with mechanical and structural properties of apple tissue. Postharvest Biol. Technol. 2013, 85, 30–38. [Google Scholar] [CrossRef]
  32. Hjalmarsson, P.; Thennadil, S.N. Spatially resolved in vivo measurement system for estimating the optical properties of tissue in the wavelength range 1000–1700 nm. In Proceedings of SPIE the International Society for Optical Engineering; Schweitzer, D., Fitzmaurice, M., Eds.; SPIE: Bellingham, DC, USA, 2007; Volume 6628, p. 662805. [Google Scholar]
  33. Saeys, W.; Velazco-Roa, M.A.; Thennadil, S.N.; Ramon, H.; Nicolaï, B.M. Optical properties of apple skin and flesh in the wavelength range from 350 to 2200 nm. Appl. Opt. 2008, 47, 908–919. [Google Scholar] [CrossRef] [PubMed] [Green Version]
  34. Wilson, R.H.; Nadeau, K.P.; Jaworski, F.B.; Tromberg, B.J.; Durkin, A.J. Review of short-wave infrared spectroscopy and imaging methods for biological tissue characterization. J. Biomed. Opt. 2015, 20, 30901. [Google Scholar] [CrossRef] [PubMed]
  35. Ma, T.; Li, X.Z.; Inagaki, T.; Yang, H.; Tsuchikawa, S. Noncontact evaluation of soluble solids content in apples by near-infrared hyperspectral imaging. J. Food Eng. 2018, 224, 53–61. [Google Scholar] [CrossRef]
  36. Wei, K.L.; Ma, C.; Sun, K.; Liu, Q.; Zhao, N.; Sun, Y.; Tu, K.; Pan, L. Relationship between optical properties and soluble sugar contents of apple flesh during storage. Postharvest Biol. Technol. 2020, 159, 111021. [Google Scholar] [CrossRef]
  37. Prahl, S.A. Everything I Think You Should Know about Inverse Adding-Doubling. Available online: https://omlc.ogi.edu/software/iad (accessed on 12 March 2019).
  38. Van Staveren, H.J.; Moes, C.J.; Van, M.J. Light scattering in Intralipid-10% in wavelength range of 400–1100 nm. Appl. Opt. 1991, 30, 4507–4514. [Google Scholar] [CrossRef] [Green Version]
  39. Deng, R.R.; He, Y.Q.; Qin, Y.; Chen, Q.D. Measuring pure water absorption coefficient in the near-infrared spectrum (900–2500 nm). J. Remote Sens. 2012, 16, 192–206. [Google Scholar] [CrossRef]
  40. Ma, C.; Feng, L.; Pan, L.; Wei, K.; Liu, Q.; Tu, K.; Zhao, L.; Peng, J. Relationships between optical properties of peach flesh with firmness and tissue structure during storage. Postharvest Biol. Technol. 2020, 163, 111134. [Google Scholar] [CrossRef]
  41. Van, B.R.; Aernouts, B.; Watte, R.; Schenk, A.; Nicolaï, B.; Saeys, W. Effect of maturation on the bulk optical properties of apple skin and cortex in the 500–1850 nm wavelength range. J. Food Eng. 2017, 214, 79–89. [Google Scholar] [CrossRef]
  42. Fang, Z.H.; Fu, X.P.; He, X.M. Investigation of absorption and scattering characteristics of kiwifruit tissue using a single integrating sphere system. J. Zhejiang Univ. Sci. B 2016, 17, 484–492. [Google Scholar] [CrossRef] [Green Version]
  43. Cubeddu, R.; D’Andrea, C.; Pifferi, A.; Torricelli, A.; Valentini, G.; Johnson, D. Time-resolved reflectance spectroscopy applied to the nondestructive monitoring of the internal optical properties in apples. Appl. Spectrosc. 2001, 55, 1368–1374. [Google Scholar] [CrossRef] [Green Version]
  44. Blažek, J.; Hlušičková, I.; Varga, A. Changes in quality characteristics of Golden Delicious apples under different storage conditions and correlations between them. Hortic. Sci. 2018, 30, 81–89. [Google Scholar] [CrossRef] [Green Version]
  45. Davirai, M.; Helene, H.; Philip, R.; Eyéghè-Bickong, H.A.; Vivier, M.A. A rapid qualitative and quantitative evaluation of grape berries at various stages of development using Fourier-transform infrared spectroscopy and multivariate data analysis. Food Chem. 2016, 190, 253–262. [Google Scholar] [CrossRef]
  46. Tijskens, L.M.M.; Zerbini, P.E.; Schouten, R.E.; Vanoli, M.; Jacob, S.; Grassi, M. Assessing harvest maturity in nectarines. Postharvest Biol. Technol. 2007, 45, 204–213. [Google Scholar] [CrossRef]
  47. Li, X.; Huang, J.; Xiong, Y.; Tan, X.; Zhang, B. Determination of soluble solid content in multi-origin ‘Fuji’ apples by using FT-NIR spectroscopy and an origin discriminant strategy. Comput. Electron. Agric. 2018, 155, 23–31. [Google Scholar] [CrossRef]
Figure 1. Illustration of the setup of automatic single integrating sphere (a), and the schematics for measurements on the reflectance of dark noise Rd (b), reference Rr (c) and sample Rs (d), the transmittance of dark noise Td (e), reference Tr (f) and sample Ts (g).
Foods 09 01881 g001
Figure 2. Absorption (μa) estimation on water (a) and scattering (μs) estimation on 1% Intralipid (b).
Foods 09 01881 g002
Figure 3. Average optical properties of Fuji apple flesh for six storage times: absorption (μa) and scattering (μs) at 25 °C (a,c); absorption (μa) and scattering (μs) at 0 °C (b,d). d, day.
Foods 09 01881 g003
Figure 4. Soluble solid content (SSC) of Fuji apple flesh for six storage times at 25 °C (a) and 0 °C (b). Data at six storage time with different letters are significantly different with p < 0.05. The vertical bars denote standard deviations. d, day.
Foods 09 01881 g004
Figure 5. Soluble sugars contents of Fuji apple flesh for six storage times at 25 °C (a) and 0 °C (b). Columns with different letters for the same cultivar are significantly different with p < 0.05. Standard error is indicated. d, day.
Foods 09 01881 g005
Figure 6. Correlations coefficient of μa and μs with content of soluble solid (SSC), total soluble sugars (TSS) and three types of soluble sugars of apples at 25 °C (a,c) and 0 °C (b,d).
Foods 09 01881 g006
Table 1. Pearson′s linear correlation coefficients among SSC and soluble sugars for 50 days at 25 °C.
SSCTSSFructoseGlucoseSucrose
SSC10.956 **0.921 **0.868 *0.973 **
TSS\10.974 **0.942 **0.921 **
Fructose\\10.957 **0.943 **
Glucose\\\10.841 *
Sucrose\\\\1
* p < 0.05, ** p < 0.01, ‘\’: without value, n = 60 individual apples; soluble solid content (SSC), total soluble sugars (TSS).
Table 2. Pearson′s linear correlation coefficients among SS and soluble sugars for 150 days at 0 °C.
SSCTSSFructoseGlucoseSucrose
SSC10.963 **0.933 **0.870 *0.950 **
TSS\10.975 **0.967 **0.847 *
Fructose\\10.982 **0.795
Glucose\\\10.685
Sucrose\\\\1
* p < 0.05, ** p < 0.01, ‘\’: without value, n = 60 individual apples.
Table 3. Linear fitting equations of soluble solid contents, sucrose contents and the absorption coefficients at 980, 1 189 and 1 498 nm for apple flesh.
Parameters (Independent Variable x)μa (Dependent Variable y)Linear Fitting EquationR2
SSC980 nmy = 0.0021x + 0.03830.848
1189 nmy = 0.0053x +0.10390.859
1498 nmy = 0.0581x + 1.01070.915
Sucrose980 nmy = 0.0022x + 0.03610.850
1189 nmy = 0.005x + 0.10640.880
1498 nmy = 0.036x + 1.41020.921
Table 4. Model results of soluble solid contents and soluble sugar contents for apples.
ParametersOptical PropertyCalibrationPrediction
Rc2RMSECRp2RMSEP
SSCμa0.8510.3140.8330.329
μs0.7390.6930.7260.722
Total soluble sugarμa0.8372.0550.8302.062
μs0.7103.6570.7013.699
Fructoseμa0.7821.5670.7811.570
μs0.6581.9350.6352.216
Glucoseμa0.7691.3380.7521.344
μs0.6111.8210.5931.906
Sucroseμa0.8601.0320.8511.047
μs0.7441.4370.7361.458
The root mean square error of calibration (RMSEC); the coefficient of determination of prediction (Rp2); the root mean square error of prediction (RMSEP).
Publisher’s Note: MDPI stays neutral with regard to jurisdictional claims in published maps and institutional affiliations.

