3.1. Characterization of Phenolic Extracts
Total phenols and flavonoids content were significantly different (
p < 0.05) between phenolic extracts, being HSE, the one with the highest concentration (
Table 2). In the case of phenols content in PSE, the values were higher than those reported by Kureck, et al. [
35] (186.02–275.24 mg GAE/g of extract), and similar to those reported by Contini, et al. [
36] (680.3 ± 11.6 mg GAE/g of extract). On the other hand, the flavonoid content corresponded to approximately 35% and 62% of the phenolic content for PSE and HSE, respectively. That agrees with the reported by de la Rosa, et al. [
37] in pecan nutshells (30%–40%) and Taş and Gökmen [
38] (60%) in hazelnut skins. These results indicated that both nut by-products were a potential source of PC, and the extraction method used was suitable to obtain them. Besides, the differences in the total phenols and flavonoids content could help to explain the differences observed in the properties of the OSS films after the addition of the extracts.
3.2. The Thickness and Water Barrier Properties
The film´s thickness varied from 0.087 mm to 0.091 mm without presenting significant differences (
p ˃ 0.05). Among films, OSS films with 0.100% of PSE, 0.075%, and 0.100% of HSE were significantly (
p < 0.05) thicker than the other films (
Table 3). According to Prietto, et al. [
39], and Knapp, dos Santos, Pilatti-Riccio, Deon, dos Santos and Pinto [
15], the thickness increases by the solid material provided for the extracts. On the other hand, all films had a moisture content of approximately 30%, without any significant (
p ˃ 0.05) effect caused by the addition of extracts. Similar behavior has been reported for cassava starch films with rosemary extract [
13]. Likewise, Feng, et al. [
14] reported that the addition of tea polyphenols to hydroxypropyl starch films did not affect the moisture of the films. In this study, all of the films presented a high moisture content, which could be related to the water absorption capacity provided by the OSA groups to the starch granules [
23].
In the case of water solubility, the OSS films with 0.075 and 0.100% of PSE, 0.050, 0.075, and 0.100% of HSE presented a lower solubility of about from 17%–18%, compared to the OSS film (20.3%) (
Table 3). Similar results were reported in sweet potato OSA starch films with oregano essential oil, by Li, Ye, Lei and Zhao [
9]. According to Ghasemlou, et al. [
40], the hydrophobic compounds, present in the essential oils, reduce the solubility of corn starch films. Nisa, et al. [
41] related the decrease of solubility with the structural strength of the films. Consequently, this is caused by the interactions between the PC present in the green tea extract and in the potato starch. Therefore, the changes in the solubility properties are carried out by the hydrophilic/hydrophobic nature of the PC present in the extracts, and to the interactions between the PC and the starch structure.
The contact angle values for the OSS films are reported in
Table 3. Values indicated that the addition of the PSE and HSE significantly (
p < 0.05) increased this parameter. According to Vogler [
42], the film surface is considered hydrophilic when it presents a contact angle <65 °, and hydrophobic when it presents a contact angle >65 °. In this study, the contact angle of the films gradually increased with the addition of the different concentrations of the extracts, and only the OSS and OSS with 0.025% of PSE films presented a hydrophilic surface. Increases in the contact angle of starch films, with the addition of yerba mate, rosemary, and propolis extracts, have been reported previously [
12,
13,
43]. This could be related to the interaction between the hydroxyl groups of the PC and the starch, whereby the amount of free hydroxyl groups, which could interact with the water, is limited. In reaction, the hydrophobicity of the films increase [
14]. For this reason, the solubility of the films with the increase of PSE and HSE concentration decreased, while their hydrophobicity increased.
Finally, the addition of both extracts did not cause significant changes (
p ˃ 0.05) in the water vapor permeability of OSS films, presenting values of 2.46–2.62 (g mm/h m
2 KPa) (
Table 3). Similar behavior was reported in thermoplastic starch films with a low concentration of terpenes [
44], cassava starch films with propolis extracts [
11], and rosemary extract [
13]. These authors mentioned that the water vapor permeability could be influenced by factors, such as the starch botanical source, the hydrophilic/hydrophobic nature of the extract components, defects in the film’s surface, and others. Then, the lack of change in this property could be related to the decrease of the solubility and the increase of the contact angle due to the interactions between the PC of the extracts with the structural network of the OSS.
3.3. Optical Properties
The OSS film was colorless, whereas the addition of both extracts imparted color to the OSS films, as shown in
Table 4. The
a* and
b* values increased with the addition of both extracts, but the OSS films with HSE presented more significant differences (
p < 0.05) than the OSS films with PSE. This could be related to the highest concentration of phenols and flavonoids present in this sample (
Table 2). Contrary to
a* and
b* values, the
L* values decreased with the addition of PSE and HSE. On the other hand, the highest color difference (
ΔE) was observed in the OSS film with 0.100% of HSE, whereas the lowest values were observed in the OSS film with 0.025% of PSE.
Similar behavior was reported in corn starch film with essential oils [
40], cassava starch film with yerba mate extract [
12], and adzuki bean starch film with cocoa nibs extract [
45]. These results indicated that the type and concentration of the extract has an important role in the color of films.
The transparency of the films was measured in the UV and visible regions at 260 nm and 660 nm, respectively (
Table 5). Film thickness is an important factor in these values. However, due to the lack of differences between the thickness of the films (
Table 3), this is not considered a determining factor in these values. According to the method used, high transmittance indicates high transparency. As can be observed, the OSS film was transparent, and the addition of PSE and HSE decreased transparency. At higher extract concentrations, a decrease in the transparency of the film was observed. A decrease of the transmittance values at the visible region (T
600 nm) of thermoplastic starch films with high concentrations of terpenes was reported [
44]. In addition, Knapp, dos Santos, Pilatti-Riccio, Deon, dos Santos and Pinto [
15] and Qin, et al. [
46] observed a decrease in the transparency of cassava starch films containing yerba mate extract and
Lycium ruthenicum Murr anthocyanins. Like what was seen for color properties, the HSE had a greater impact on the transparency in the UV region (T
280 nm) than the PSE. Probably, this could be a consequence of the highest concentration of PC detected in HSE (
Table 2). So, it indicated that a higher PC content resulted in a higher UV-light absorption or lower percentage transmittance.
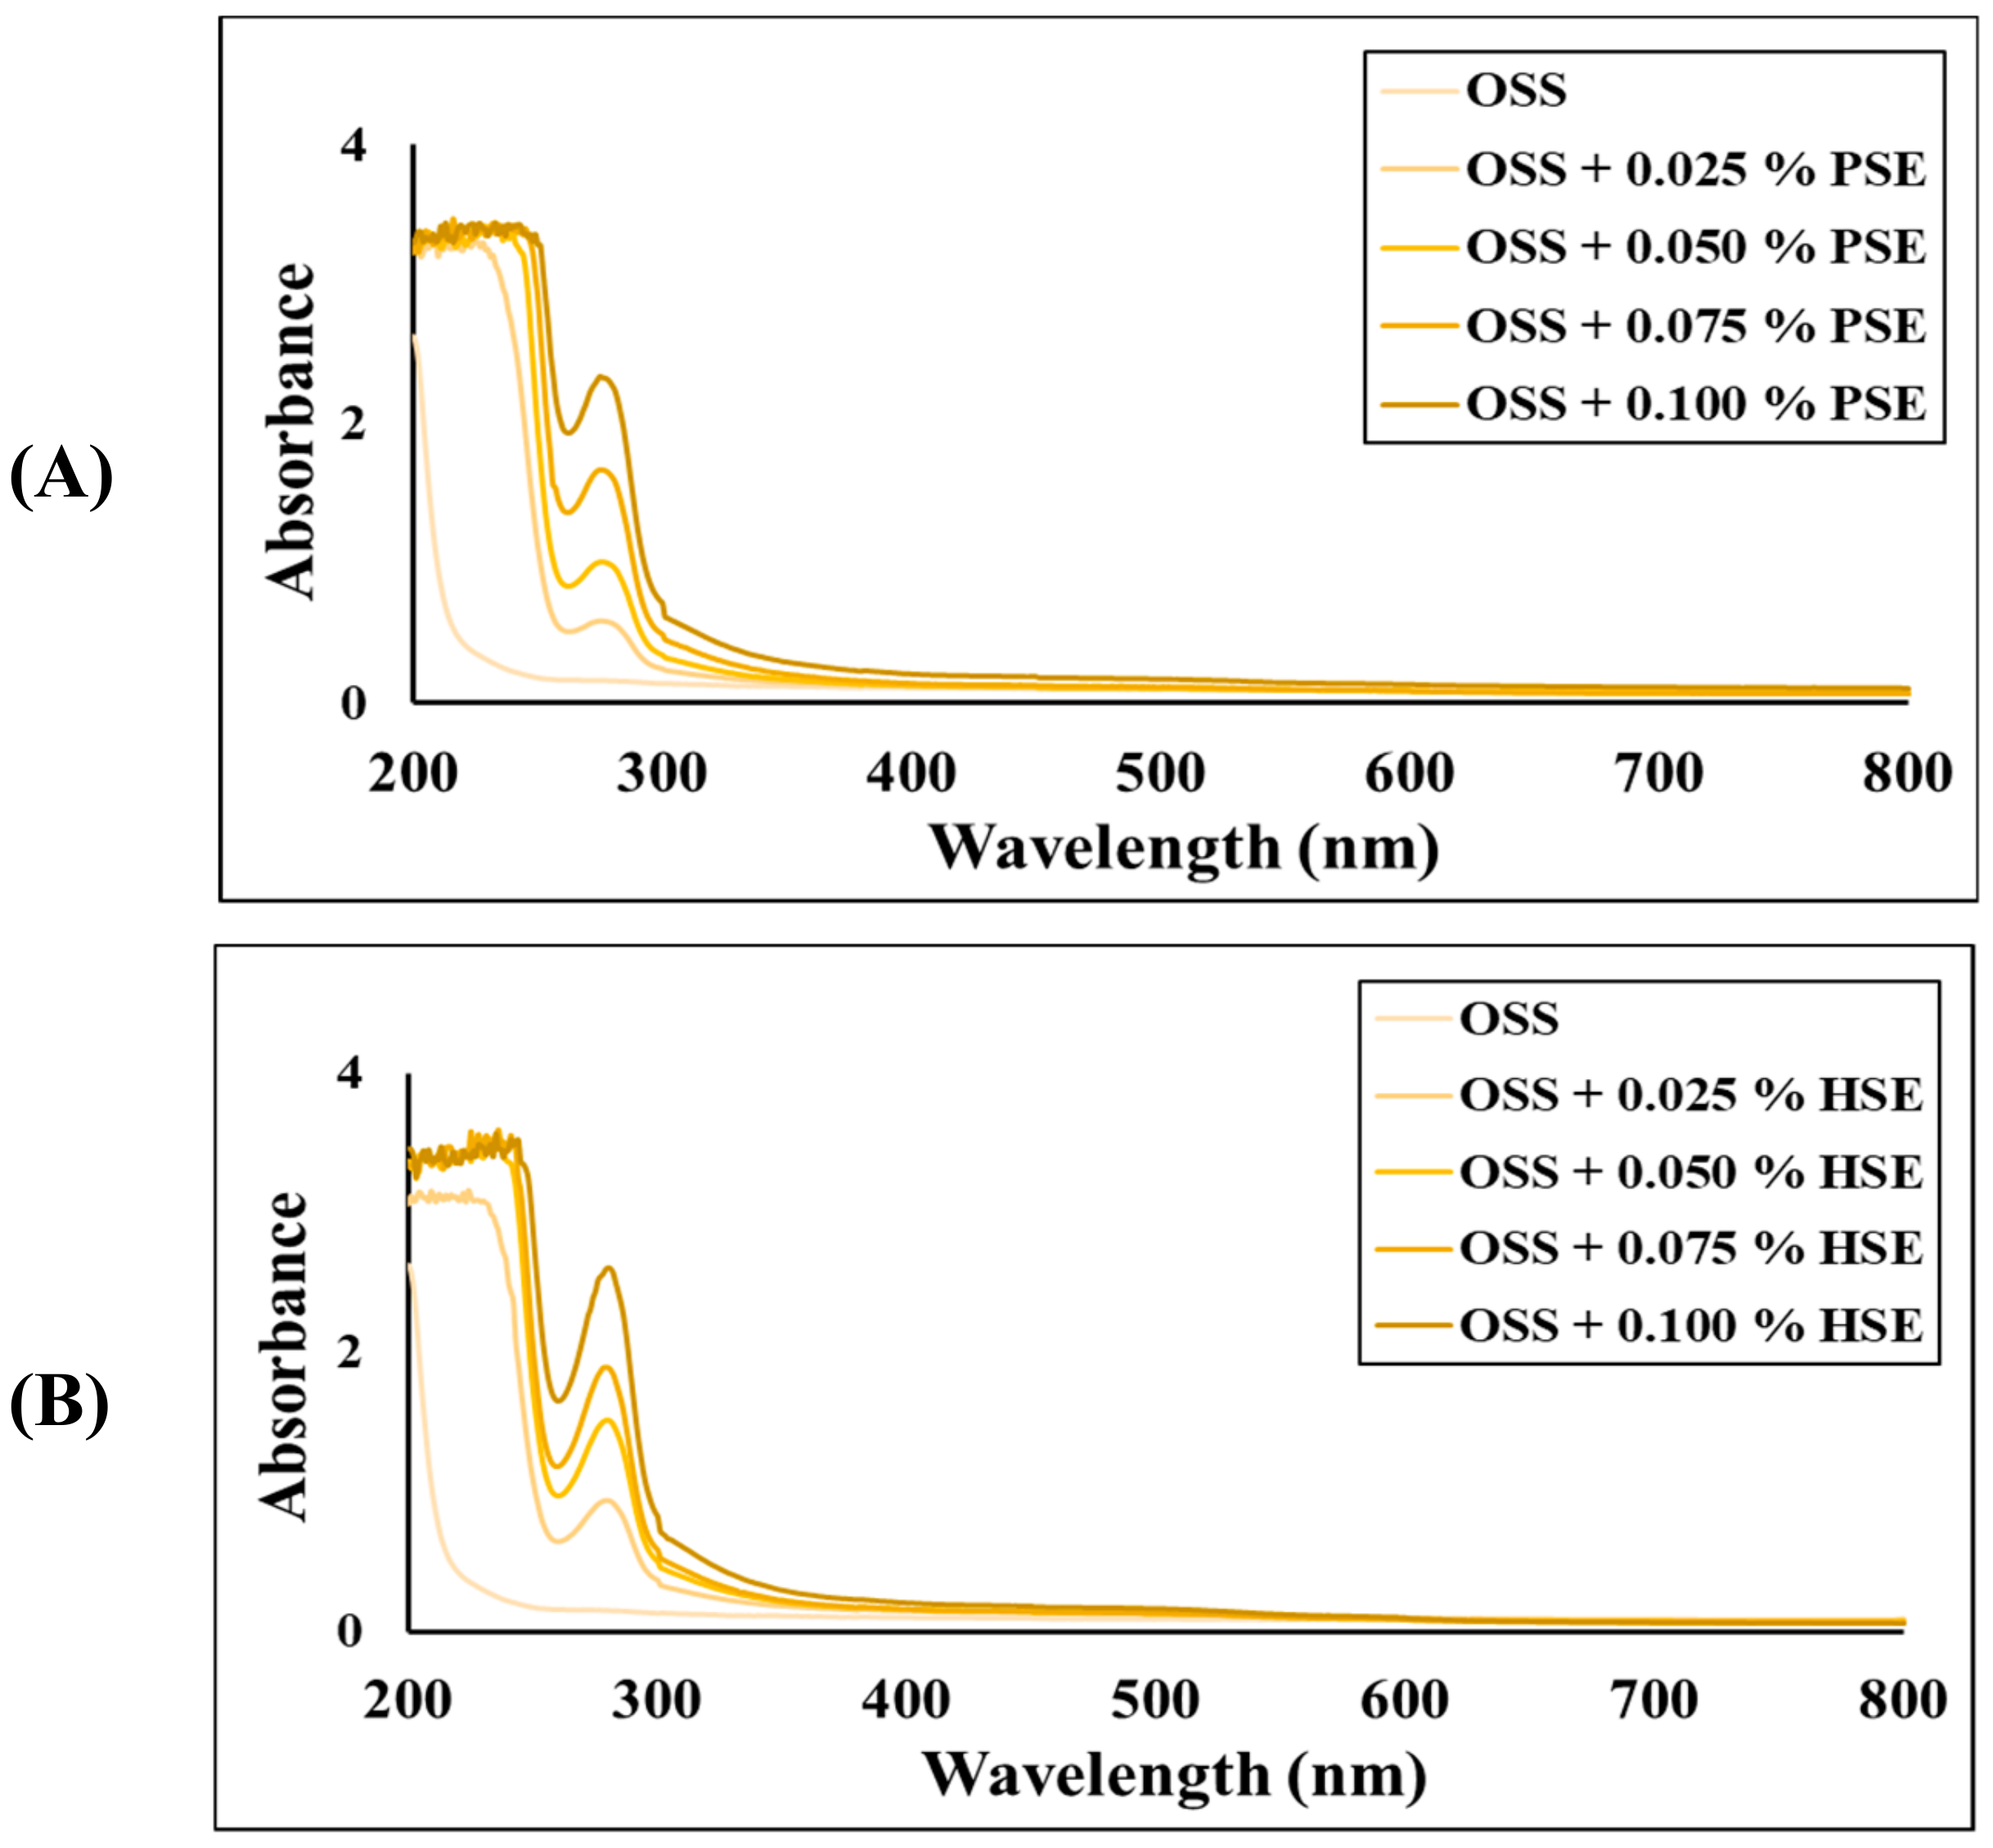
According to these results, the addition of HSE or PSE to the OSS films improved their UV light barrier property. This could be demonstrated by the absorption spectra depicted in
Figure 2. The control film did not present absorption in the wavelength range of 200–800 nm, indicating that light completely passed through the film. However, the OSS films with HSE and PSE showed absorption peaks between the range of 250–300 nm, and the intensity of the peaks increased with increased extract concentration. Some authors reported similar results and concluded that PC and pigments present in different extracts are responsible for the improvement of the UV-barrier properties of films [
13,
15,
29].
3.4. Mechanical Properties
The addition of PSE and HSE affected the mechanical properties of the films (
Table 6). Puncture and tear resistance significantly (
p ˃ 0.05) decreased with the addition of PSE. This indicated that PC from PSE acts as a plasticizing agent in the structure of the film, and decreases the film rigidity [
11,
47]. The rigidity of these films was lower than that reported in cassava starch films with propolis extract [
11].
On the other hand, tensile strength decreased with the addition of both extracts, but there were no significant differences (
p > 0.05). The same trend has been reported in cassava starch films with propolis extracts [
11], and corn starch films with red cabbage anthocyanins [
39]. In this study, tensile strength values were higher than what has been reported for other films [
9,
39,
43], indicating these films are more resistant to tearing. The elongation at break is a parameter that indicates the plastic behavior of the material. All films showed an elongation at break around 30% without significant differences (
p > 0.05). The OSS films without and with PSE or HSE had more plastic behavior than other films [
11,
45]. It was observed that, except in the case of OSS films with 0.025 and 0.050% of HSE, the addition of extracts significantly (
p < 0.05) decreased Young´s modulus. High values of Young´s modulus indicates the rigidity of the films. In this case, a decrease in Young´s modulus indicated that the plasticizing effect of HSE and PSE was due to the structural discontinuities in the polymer matrix, which is caused by interactions between PC and starch [
11].
3.5. Biodegradability
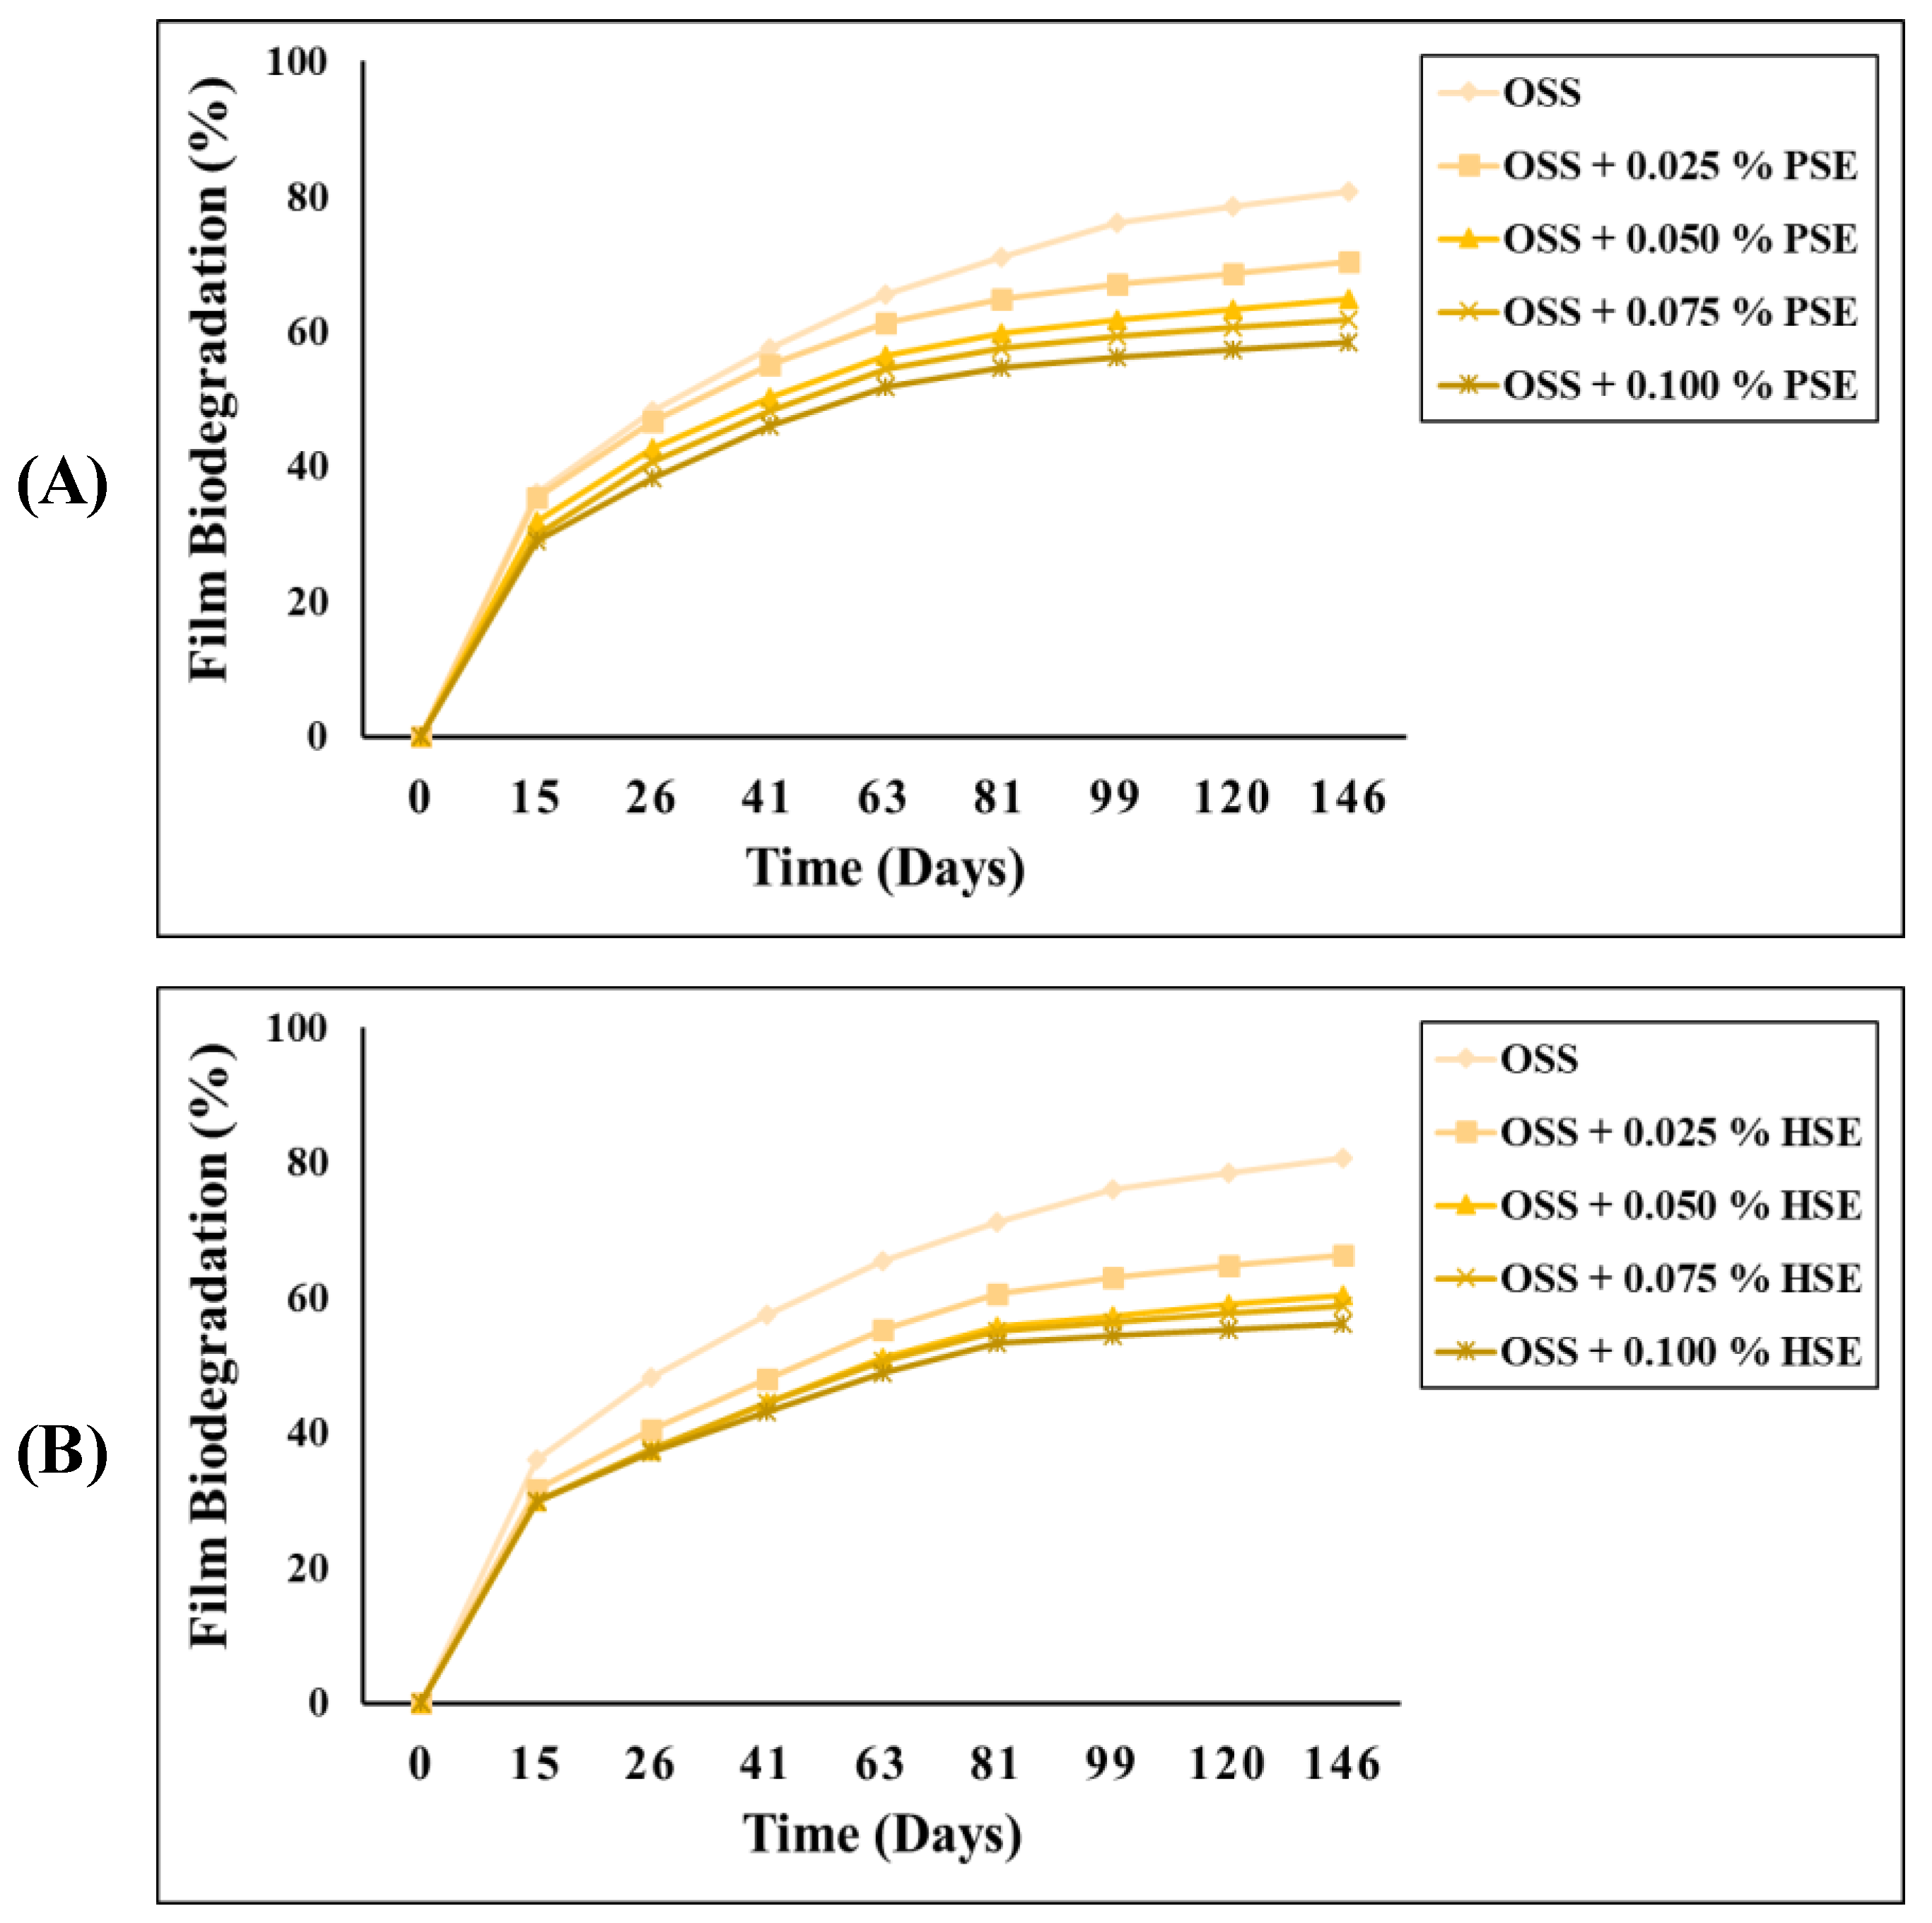
The biodegradability of the OSS films with PSE and HSE in the soil is depicted in
Figure 3. The OSS films showed a higher percentage of film biodegradability compared to the OSS films with PSE or HSE. After 146 days in soil, the biodegradation value of the OSS film was around 81%, while the values for the OSS films with PSE or HSE were decreasing with the increase of the extract concentration. The biodegradation values did not exceed 71%. These results were opposite to those reported by Medina Jaramillo, et al. [
48] and Kim, Baek, Go and Song [
45], in which the extracts accelerated the degradation of starch films. According to these authors, the moisture and soil microbiota activity and its composition play an important role during the degradation process of films. However, they associated such an increase in the biodegradability values to the low molecular weight of some PC, which makes them more susceptible to soil microbiota. Another parameter involved in the biodegradation of films is related to their solubility. The greater the solubility, the higher the degradation by the soil microbiota. According to this, the decrease in the biodegradability of OSS films with PSE or HSE could be due to their low solubility (
Table 3). On the other hand, the PC in both extracts could help to increase the integrity of the OSS films. The PC could do this by providing greater structural stability to the starch, but also increases the resistance of films to the degradation by soil microbiota [
13]. Although biodegradability values were slightly higher in OSS films with PSE or HSE, they represented an option to the replacement of petroleum-based plastics, as they are much more readily biodegradable than conventional plastics.
3.6. Morphology Analysis
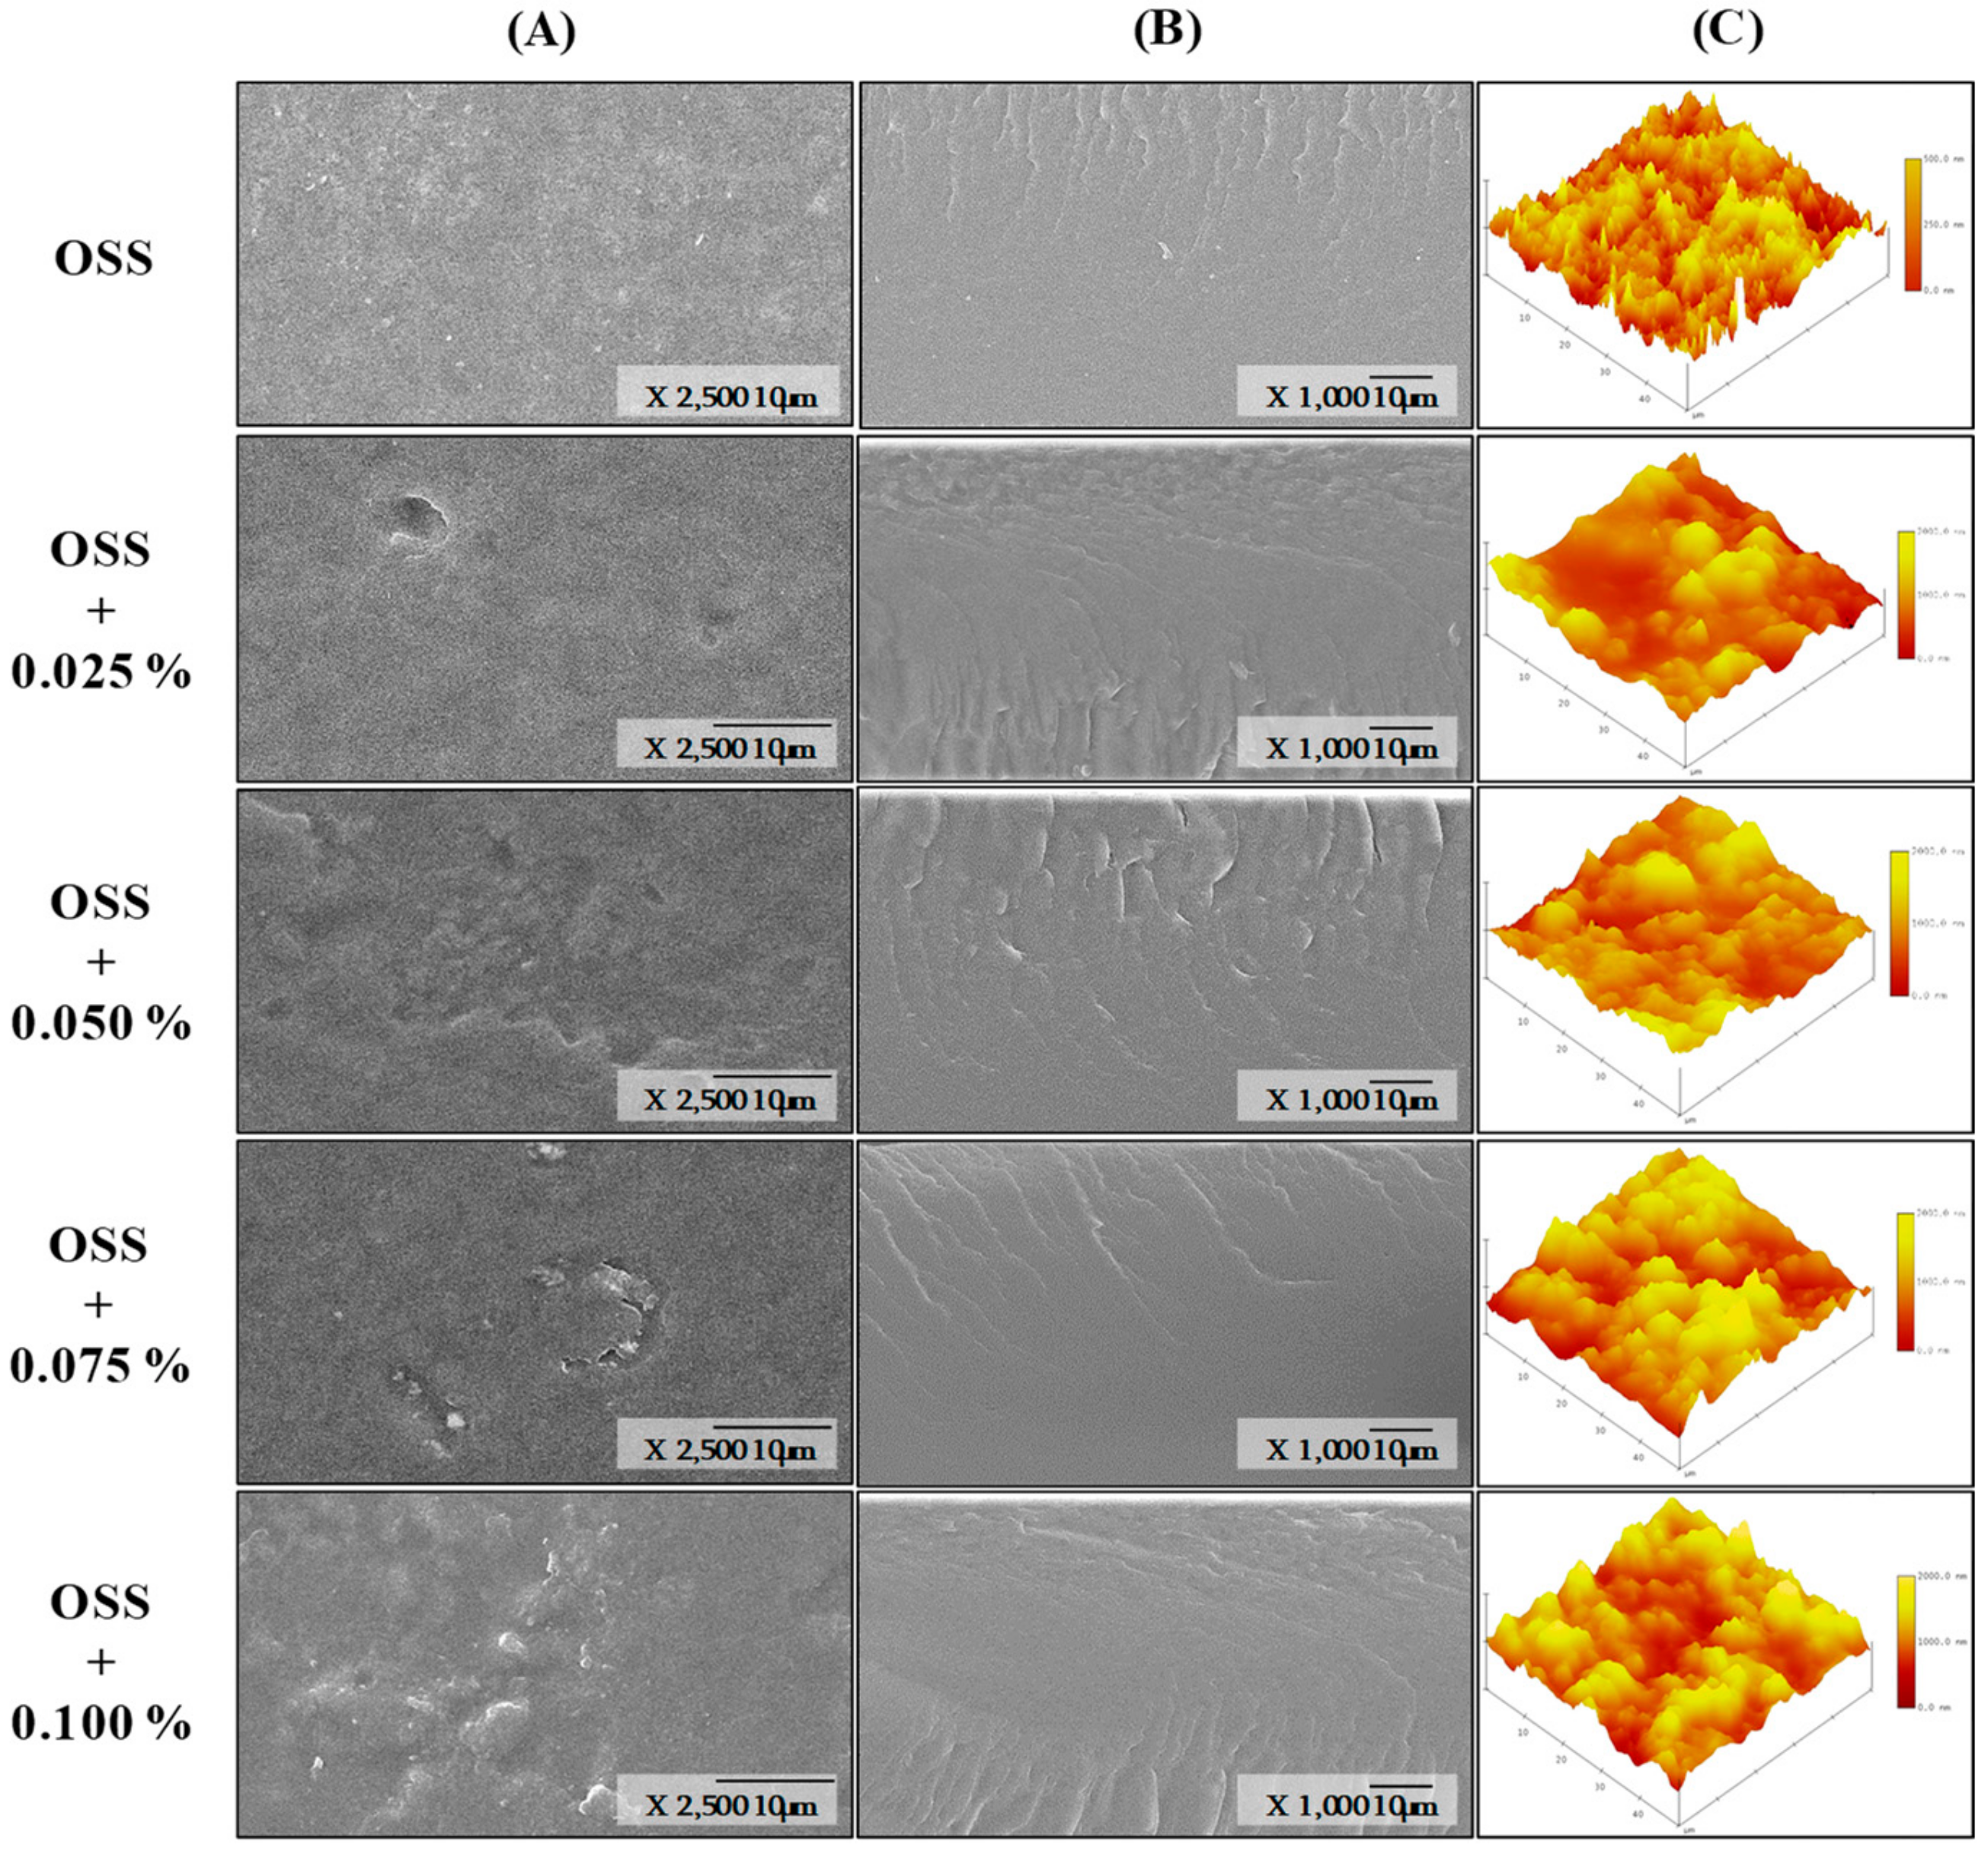
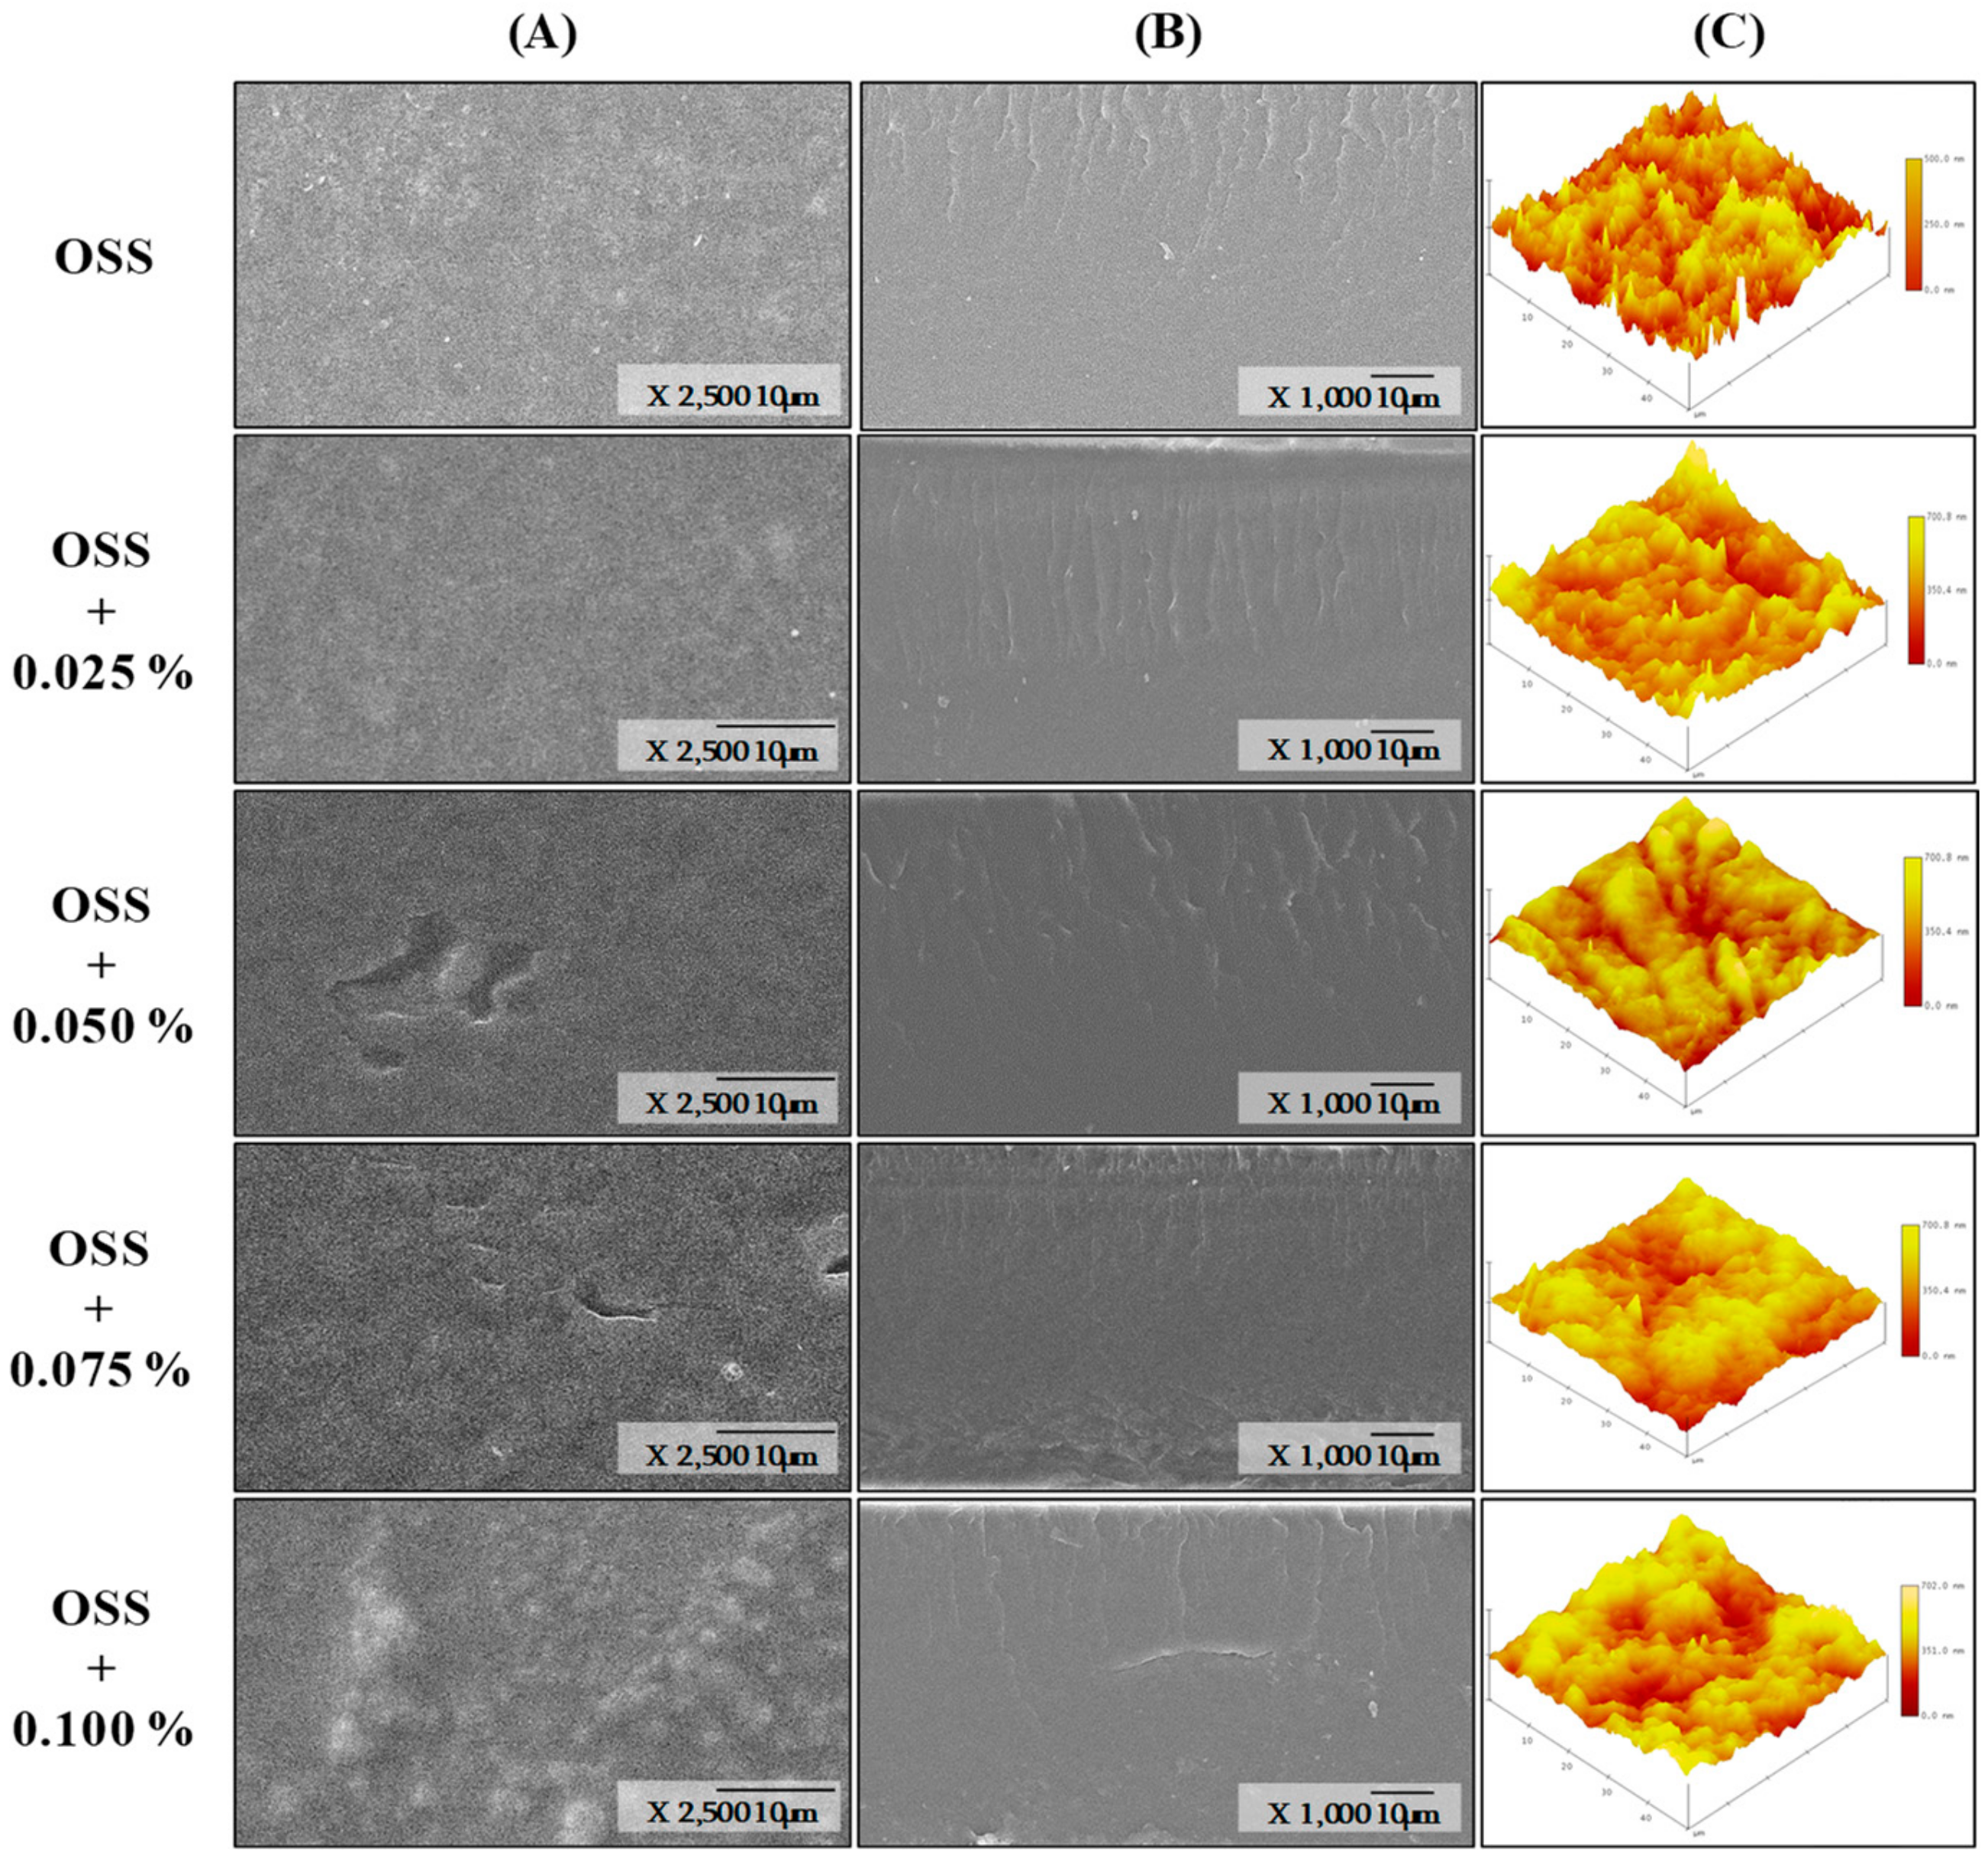
Surface and cross-section micrographs of OSS films by SEM are shown in
Figure 4 and
Figure 5. All films showed a similar surface, highlighting the absence of pores, holes, or cracks. This indicated that the extracts are dispersed throughout the structure of the starch and do not have any effect on the structural organization of the films [
14,
49]. However, some irregularities were observed with the presence of the extracts and the increase of concentration. This could indicate that maybe some solids or PCs were not completely dispersed in the starch network. The cross-section was similar in all films; however, irregularities were more evident in OSS films with PSE. These irregularities can influence the mechanical properties of films [
43]. In this study, such irregularities could explain why OSS films with PSE presented differences in their mechanical properties compared with those OSS films with HSE (
Table 6). In addition, the absence of layers in the cross-section images could indicate that extracts were dispersed homogeneously into the starch network. With respect to the surface topography, each of the films presented variable roughness (
Figure 4 and
Figure 5). The root mean square (RMS) in the OSS film was between the range of 72.03 to 166.10 nm. For OSS films with PSE, the range was from 72.03 to 484.44 nm, and for OSS films with HSE, the range was from 60.80 to 124.85 nm. The variation in the RMS indicated that some films have regions with greater roughness than others. This agreed with that observed in the surface micrographs (
Figure 6 and
Figure 7). The increase in RMS could also explain the increase in water resistance (hydrophobicity) of the films, specifically the contact angle and the water solubility (
Table 3). This is because roughness allows for a greater amount of air to maintain contact with the film surface, which, consequently, reduces its interaction with water molecules [
12,
43].
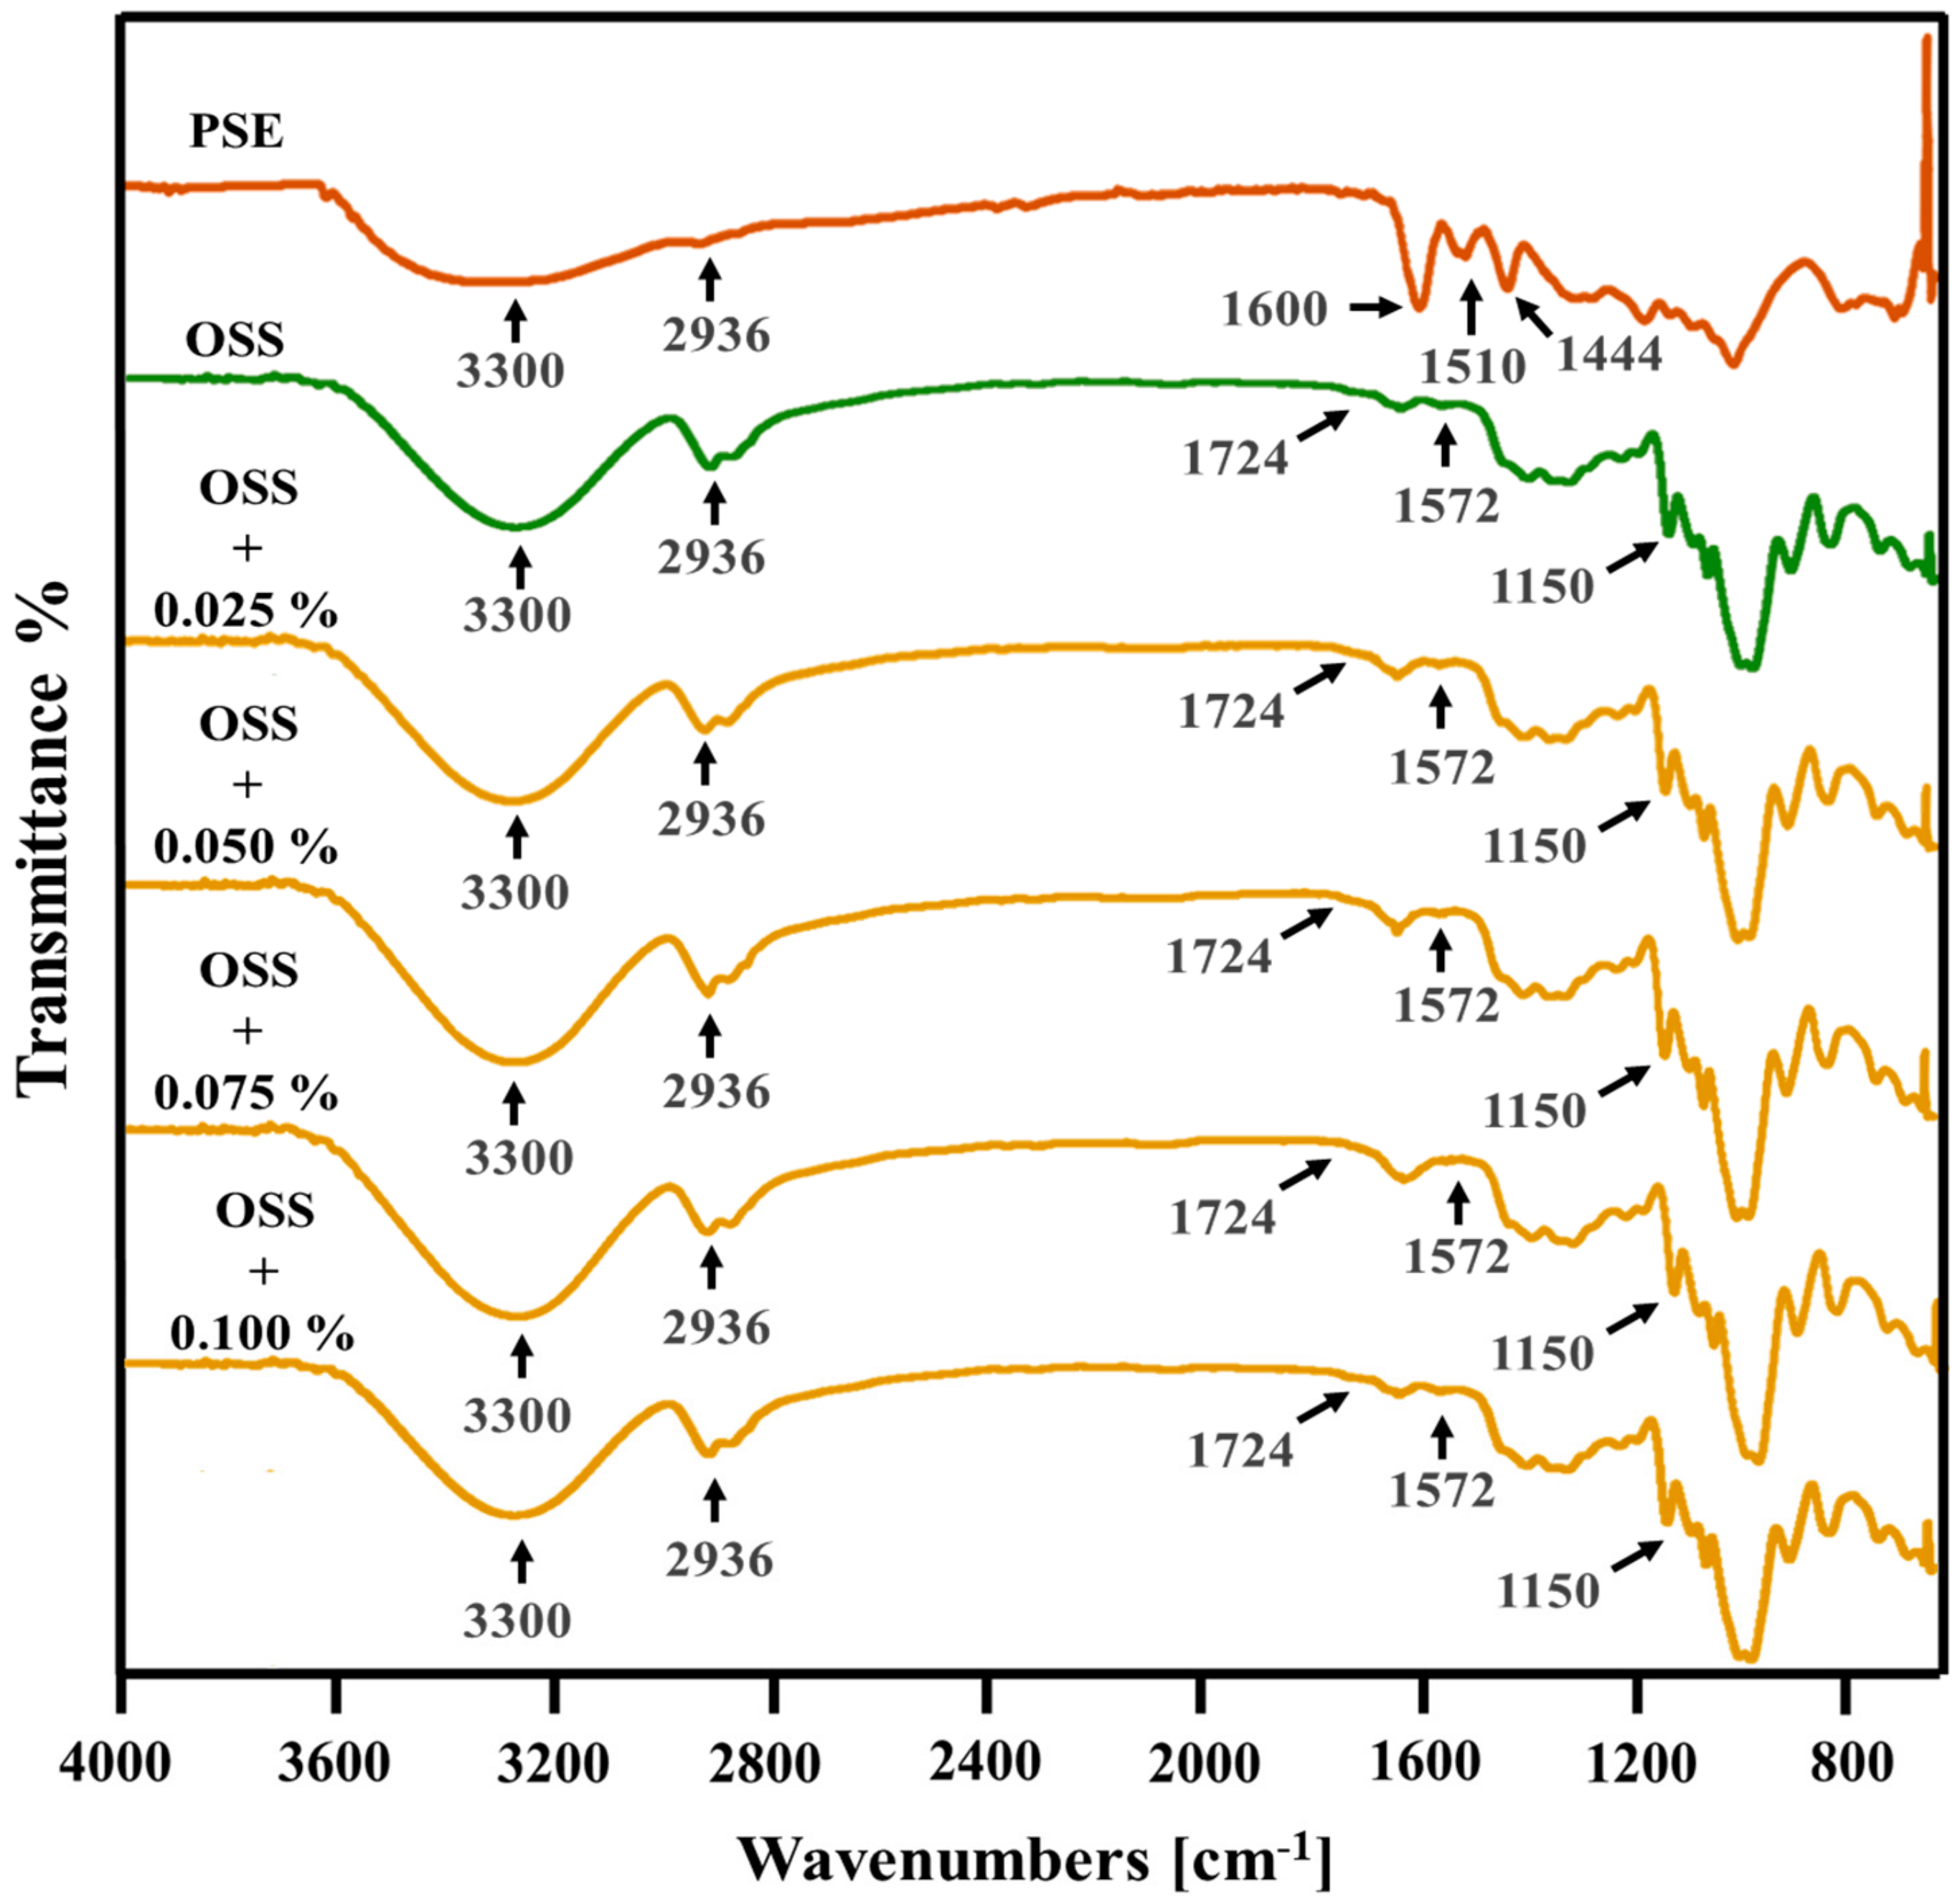
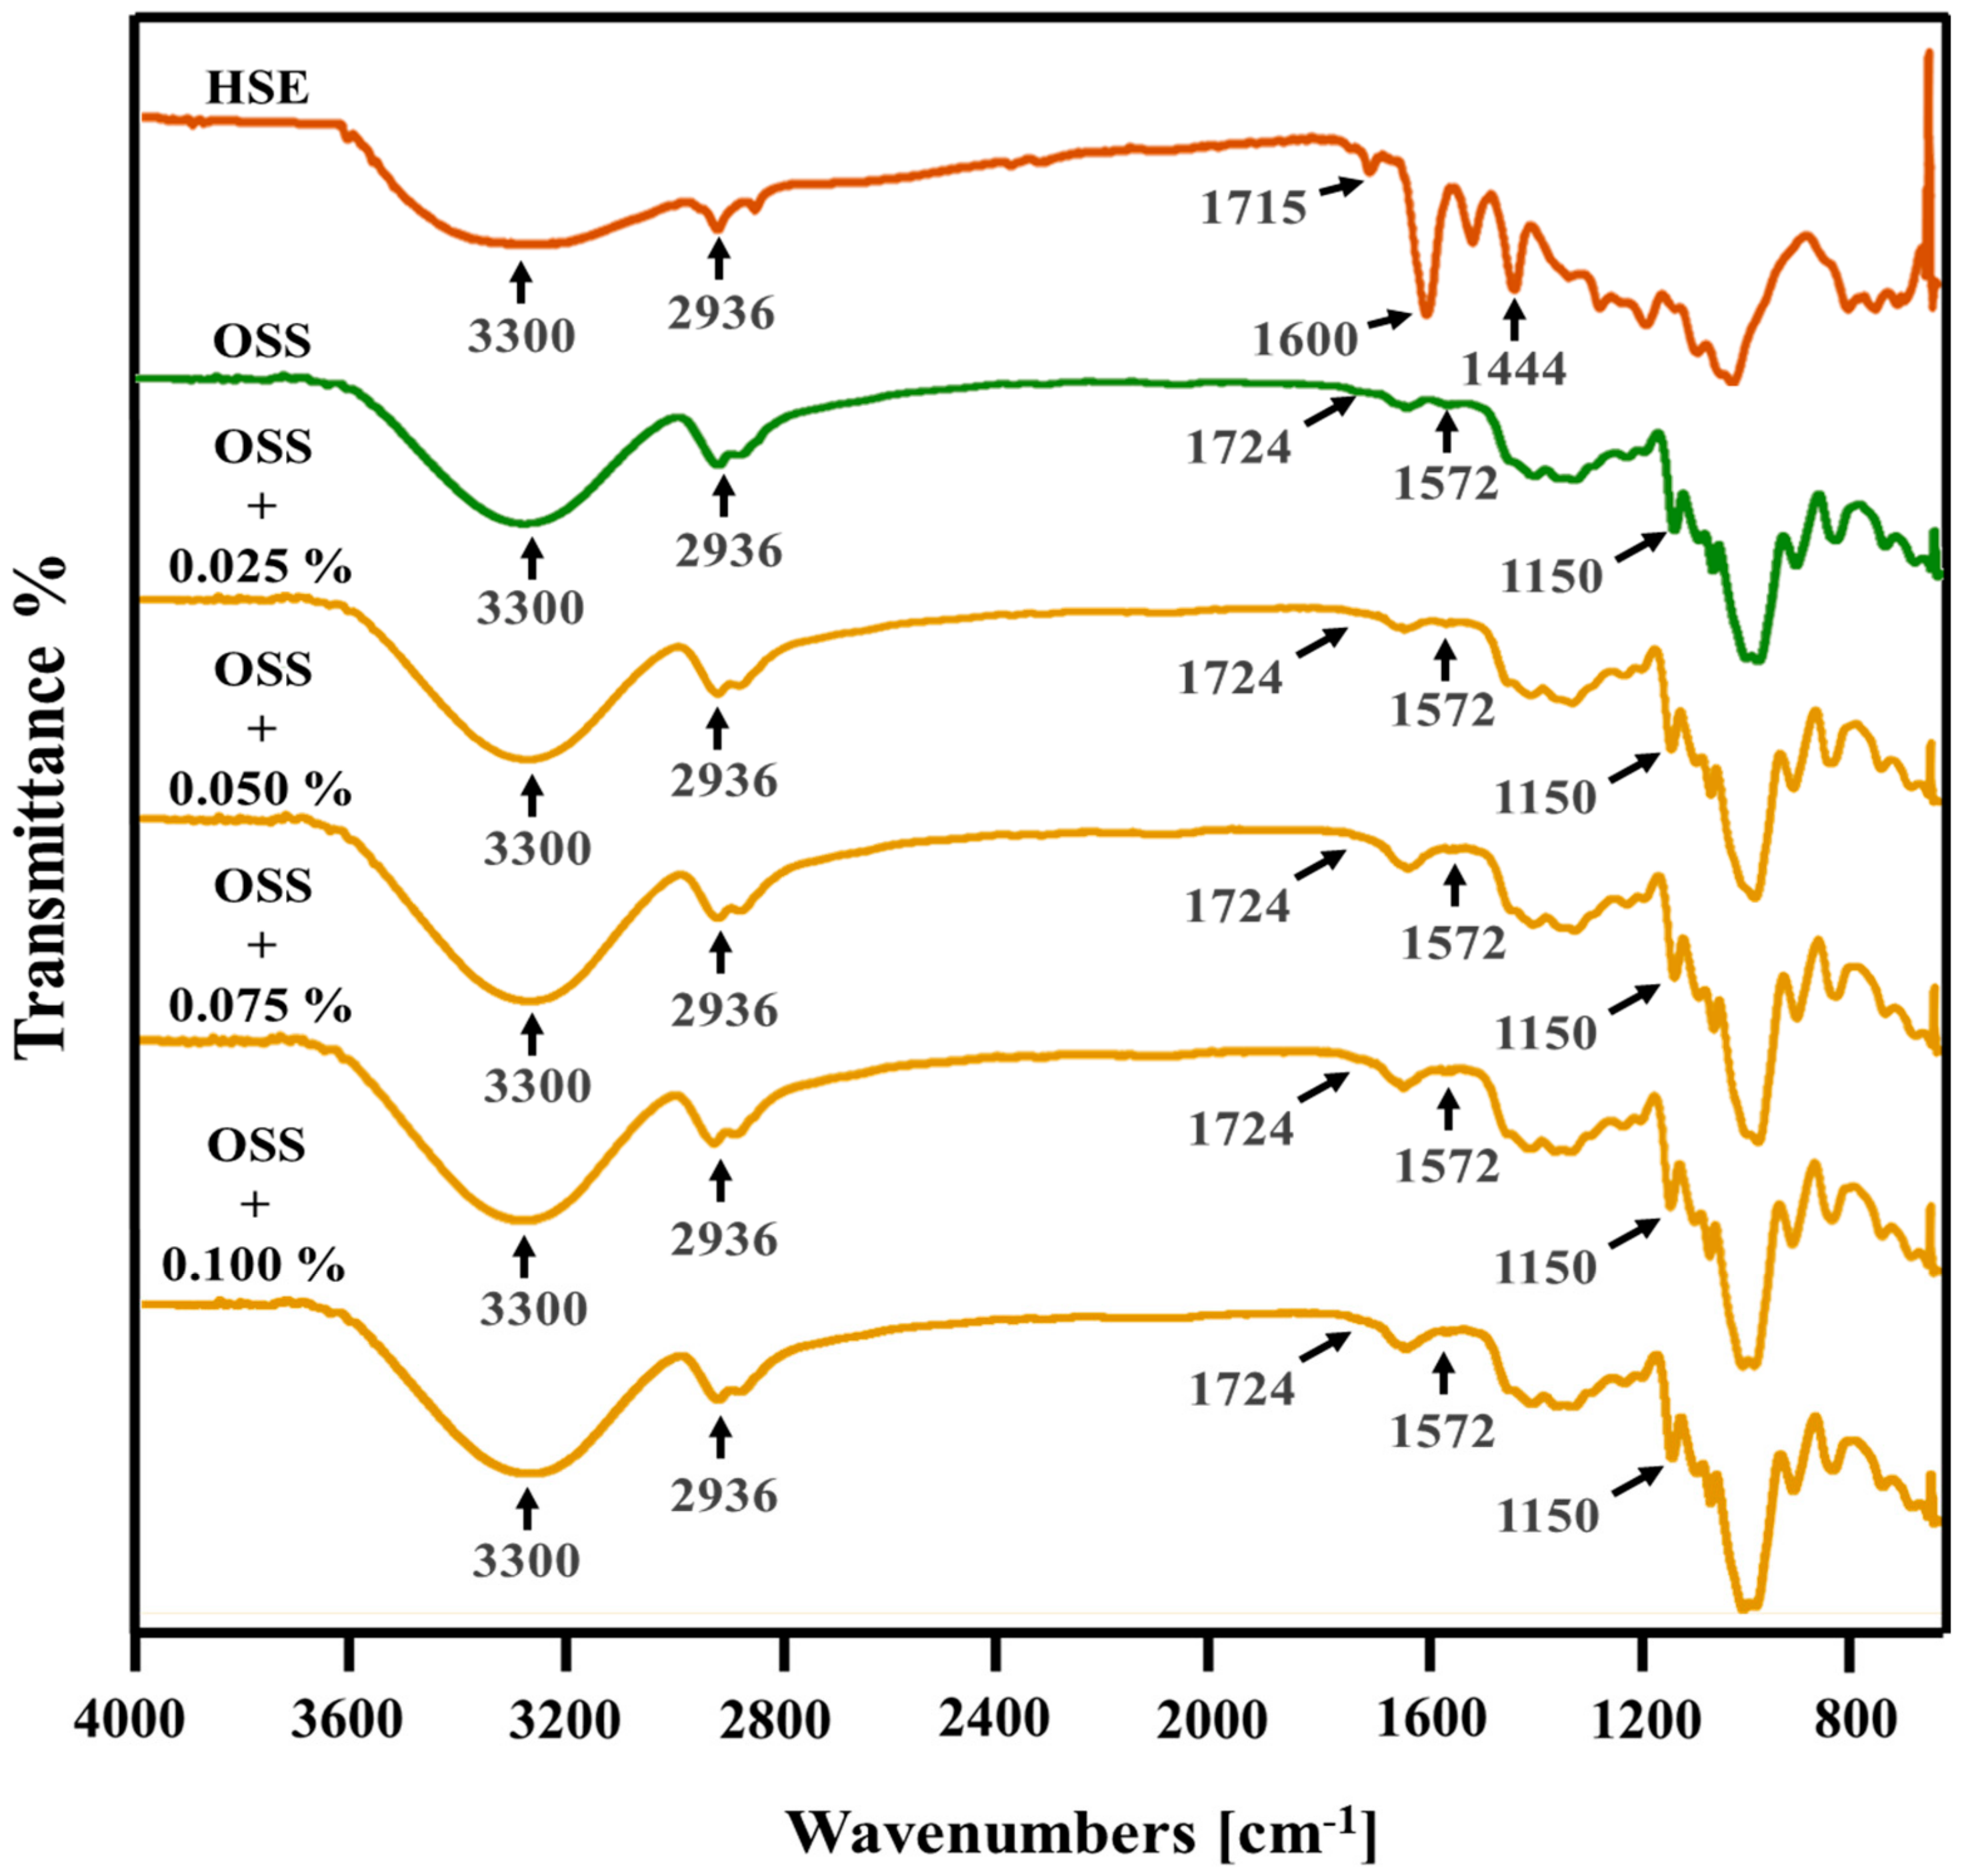
3.7. Structural Analysis
Interactions between PC and OSS were identified by comparing the infrared spectrum of the extracts (PSE and HSE), OSS films, OSS films with PSE, and OSS films with HSE (
Figure 6 and
Figure 7). The PSE and HSE presented typical bands associated with PC, such as O-H stretching (3300 cm
−1), C-H stretching for the aliphatic compounds or aldehyde groups, CH
2 asymmetric stretching (2800–3000 cm
−1 region), C=C stretching for aromatic rings (1600 cm
−1)
, CH
2 bending (1444 cm
−1), and C-O and C-C bonds stretching (1000–1400 cm
−1 region). These bands were similar to those reported by other authors [
50,
51]. In addition, both extracts showed bands close to 1510 cm
−1 (C=C from aromatic rings) [
14], and in the 900–700 cm
−1 region, which could correspond to hydrogen atoms from aromatic rings [
52]. The HSE presented more intense bands at the wavelength of 2800–3000 cm
−1. There was a small band seen at 1715 cm
−1, which could be related to the carbonyl [
52] or C=O groups [
45]. Also, there was a band close to 1271 cm
–1, corresponding to C-O stretching [
13].
This could be due to the differences in the PCs and their concentration in each extract.
The OSS films presented typical bands from the starch molecule at 3330 cm
−1 (OH groups), 2936 cm
−1 (C-H stretching from the ring methane hydrogen atoms), 920–1160 cm
−1 (C-O stretching) [
53], and 1150 cm
−1 corresponding to the glycosidic bond [
52]. The bands at 1724 cm
−1 and 1572 cm
−1 could correspond to the C=O of the ester carbonyl groups and asymmetric stretching for the carboxylate group (RCOO-), respectively, as a result of the OSA modification [
53]. The spectra of OSS films with PSE or HSE were similar, without presenting new peaks. This indicated that extracts were dispersed through the polymer matrix formed, as described by Eskandarinia, Rafienia, Navid and Agheb [
43] and Feng, Yu, Zhu, Zhou, Liu, Yang, Zhou, Gao, Bao and Chen [
14]. Despite this, some bands presented a slight increase in intensity in the presence of extracts. This could be a consequence of the intramolecular interaction between PC and starch through hydrogen bonds [
14,
45,
46]. Overall, some PC were dispersed along the polymer matrix, while others were interacting directly with the starch structure mainly by hydrogen bonds.


