Geographic Variability of Sugars and Organic Acids in Selected Wild Fruit Species

 ,
,
Abstract
:1. Introduction
2. Materials and Methods
2.1. Fruit Material
2.2. Standards and Chemicals
2.3. Sugar Extraction and Analysis
2.4. Organic Acids Extraction and Analysis
2.5. Statistical Analysis
3. Results and Discussion
3.1. Content of Total and Individual Sugars
3.2. Content of Total and Individual Organic Acids
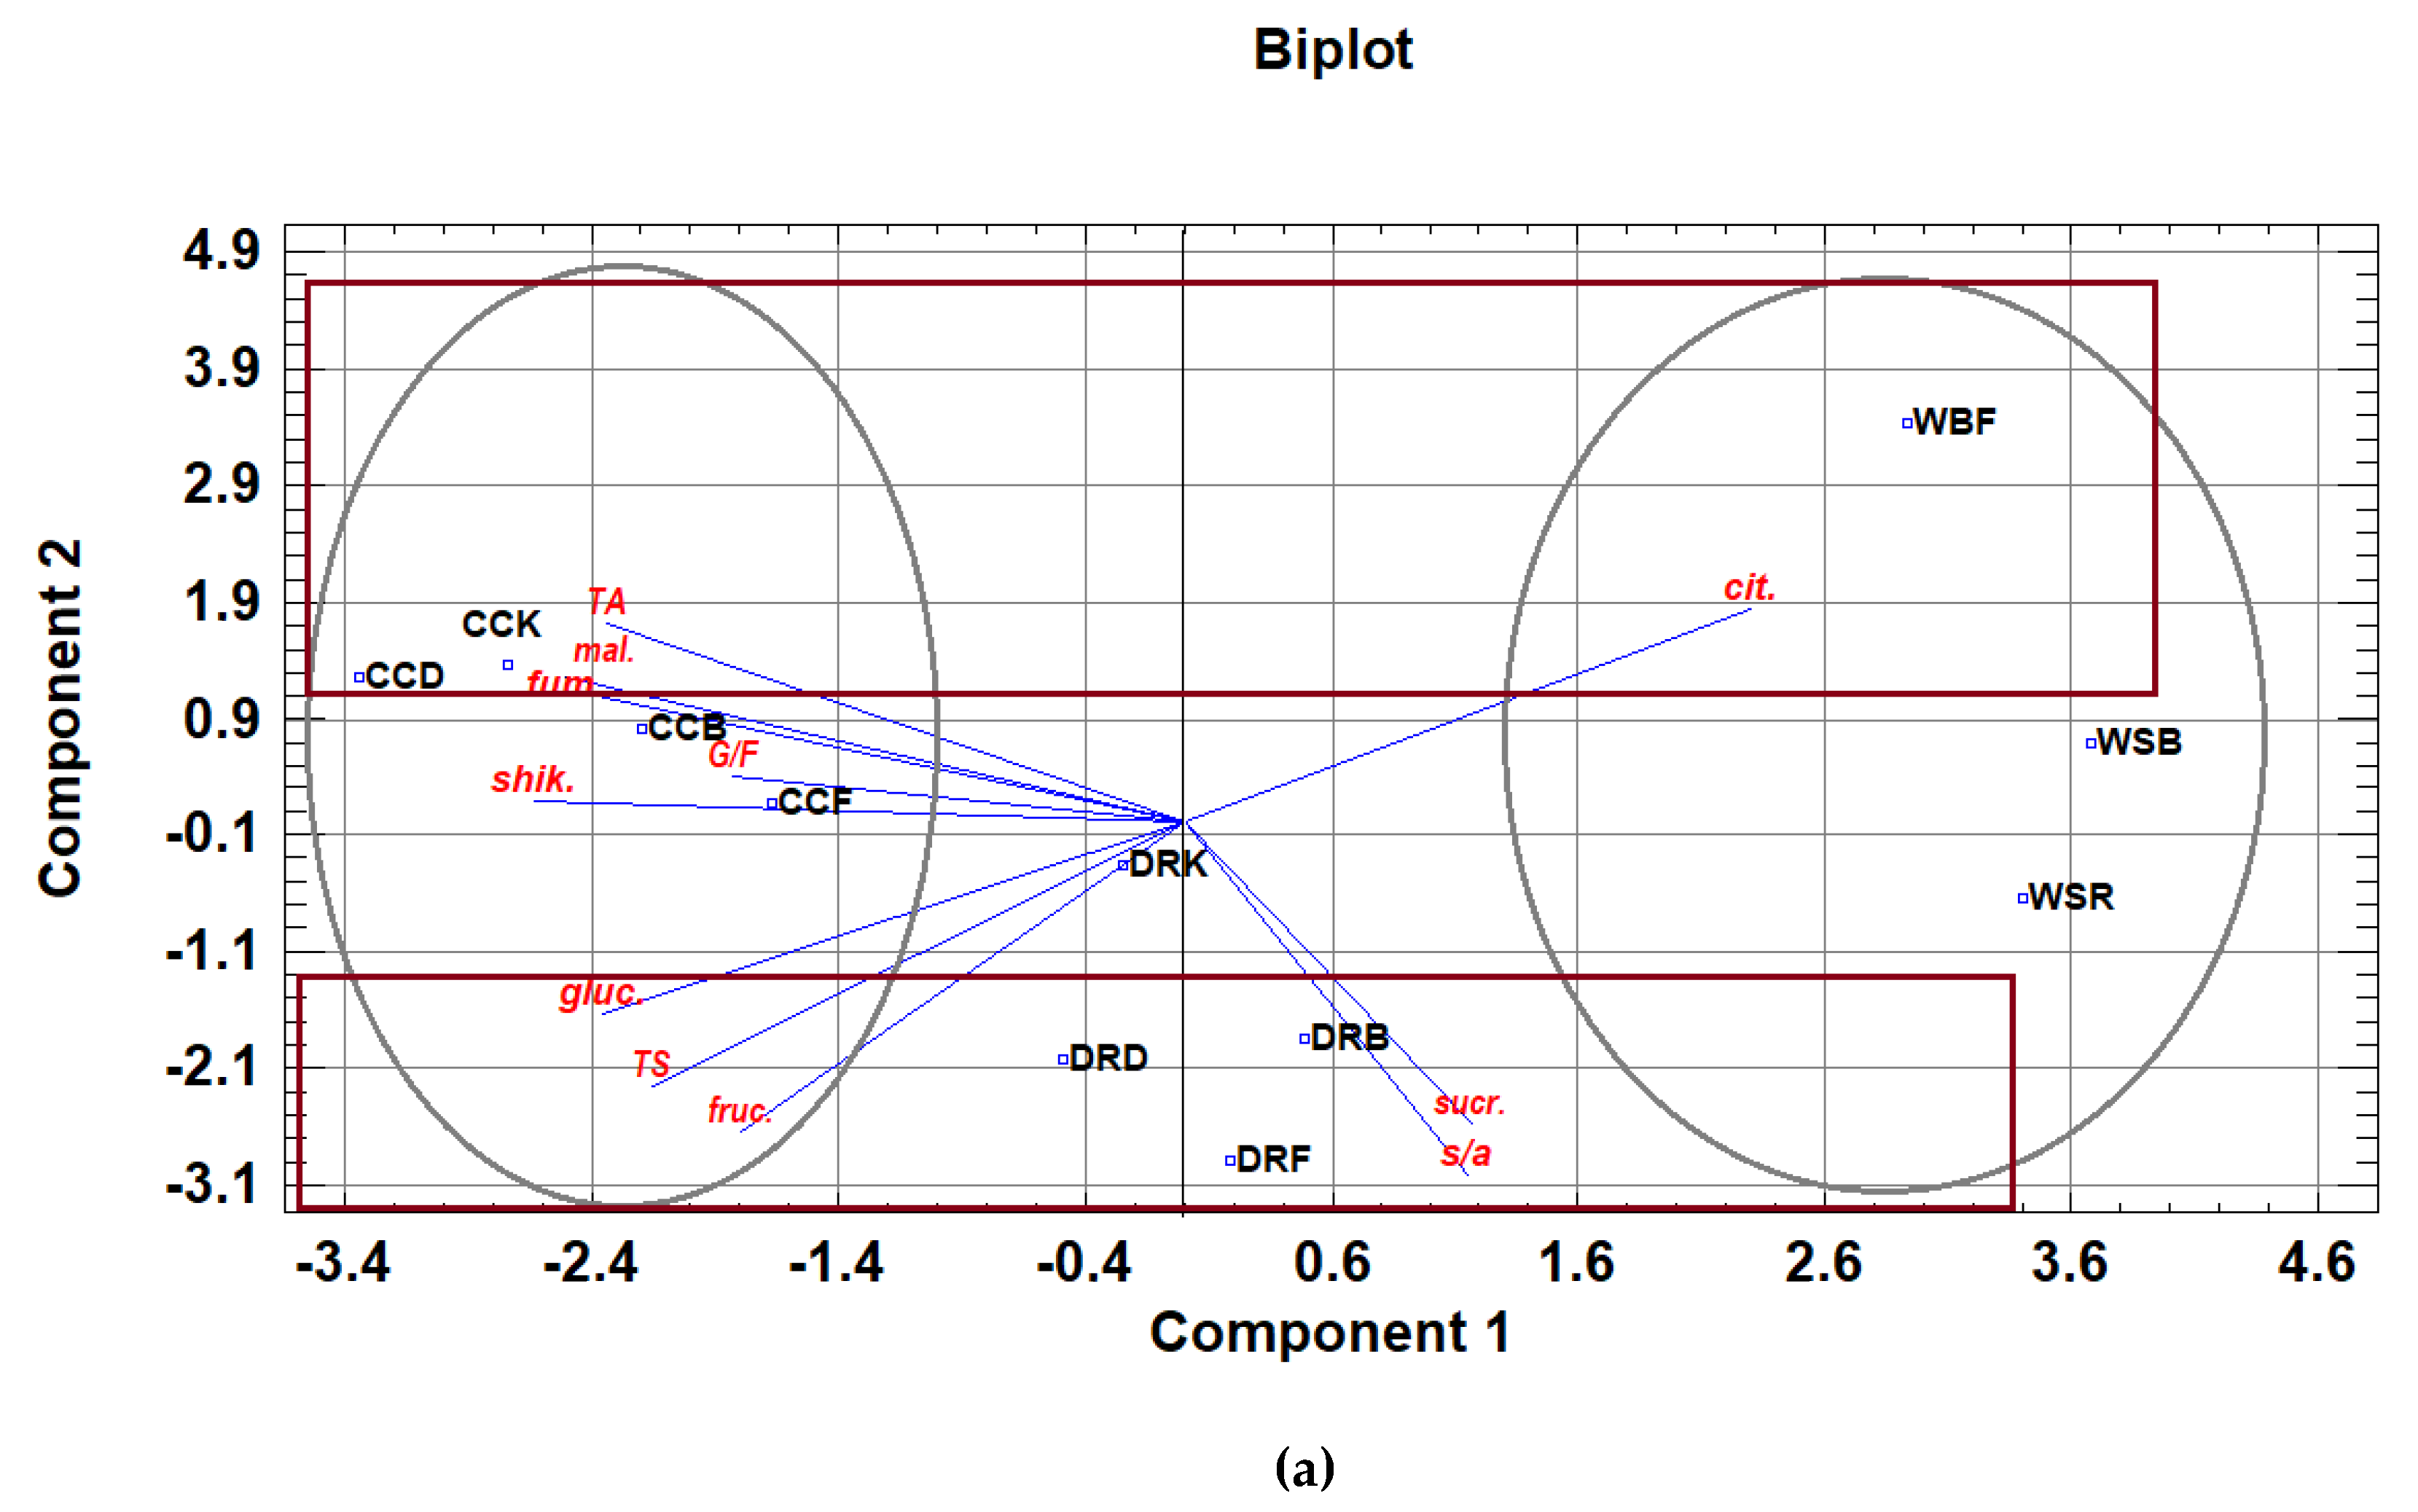
3.3. PCA
3.4. Correlation Coefficients
4. Conclusions
Author Contributions
Funding
Acknowledgments
Conflicts of Interest
References
- Hegazy, A.K.; Al-Rowaily, S.L.; Faisal, M.; Alatar, A.A.; El-Bana, M.I.; Assaeed, A.M. Nutritive value and antioxidant activity of some edible wild fruits in the Middle East. J. Med. Plant Res. 2013, 7, 938–946. [Google Scholar] [CrossRef]
- Chakravarty, S.; Bhutia, K.D.; Suresh, C.P.; Shukla, G.; Pala, N.A. A review on diversity, conservation and nutrition of wild edible fruits. J. Nat. Appl. Sci. 2016, 8, 2346–2353. [Google Scholar] [CrossRef]
- Redzic, S. Wild edible plants and their traditional use in the human nutrition in Bosnia-Herzegovina. Ecol. Food Nutr. 2006, 45, 189–232. [Google Scholar] [CrossRef]
- Najda, A.; Dyduch, M. Chemical diversity within wild strawberry (Fragaria vesca L.) species. Herba Pol. 2009, 55, 140–160. [Google Scholar]
- Ercisli, S.; Sagbas, H.I. Wild edible fruits: A rich source of biodiversity. Anadolu (J. AARI) 2017, 27, 116–122. [Google Scholar]
- Rimpapa, Z.; Toromanović, J.; Tahirović, I.; Šapčanin, A.; Sofić, E. Total content of phenols and anthocyanins in edible fruits from Bosnia. Bosnia J. Basic Med. Sci. 2007, 7, 119–122. [Google Scholar] [CrossRef] [Green Version]
- Giovanelli, G.; Buratti, S. Comparison of polyphenolic composition and antioxidant activity of wild Italian blueberries and some cultivated varieties. Food Chem. 2009, 112, 903–908. [Google Scholar] [CrossRef]
- Bunea, A.; Rugină, O.D.; Pintea, M.A.; Sconţa, Z.; Bunea, I.C.; Socaciu, C. Comparative polyphenolic content and antioxidant activities of some wild and cultivated blueberries from Romania. Not. Bot. Horti Agrobo. 2011, 39, 70–76. [Google Scholar] [CrossRef] [Green Version]
- Milivojević, J.; Maksimović, V.; Nikolić, M.; Bogdanović, J.; Maletić, R.; Milatović, D. Chemical and antioxidant properties of cultivated and wild Fragaria and Rubus berries. J. Food Qual. 2011, 34, 1–9. [Google Scholar] [CrossRef]
- Stajčić, M.S.; Tepić, N.A.; Djilas, M.S.; Šumić, M.Š.; Čanadanović-Brunet, M.J.; Ćetković, S.G.; Vulić, J.J.; Tumbas, T.V. Chemical composition and antioxidant activity of berry fruits. Acta Period. Technol. 2012, 43, 93–105. [Google Scholar] [CrossRef]
- Badjakov, I.; Nikolova, M.; Gevrenova, R.; Kondakova, V.; Todorovska, E.; Atanassov, A. Bioactive compounds in small fruits and their influence on human health. Biotechnol. Biotechnol. Equip. 2008, 22, 581–587. [Google Scholar] [CrossRef]
- Liu, R.H. Health-promoting components of fruits and vegetables in the diet. Adv. Nutr. 2013, 4, 384S–392S. [Google Scholar] [CrossRef] [PubMed]
- Taneva, I.; Petkova, N.; Dimov, I.; Ivanov, I.; Denev, P. Characterization of rose hip (Rosa canina L.) fruits extracts and evaluation of their in vitro antioxidant activity. J. Pharmacogn. Phytochem. 2016, 5, 35–38. [Google Scholar]
- Virgolin, L.B.; Seixas, F.R.F.; Janzantti, N.S. Composition, content of bioactive compounds, and antioxidant activity of fruit pulps from the Brazilian Amazon biome. Pesqui. Agropecu. Bras. 2017, 52, 933–941. [Google Scholar] [CrossRef] [Green Version]
- Patel, S. Rose hip as an underutilized functional food: Evidence-based review. Trends Food Sci. Technol. 2017, 63, 29–38. [Google Scholar] [CrossRef]
- Ercisli, S. Chemical composition of fruits in some rose (Rosa spp.) species. Food Chem. 2007, 104, 1379–1384. [Google Scholar] [CrossRef]
- Wang, S.Y.; Chen, C.-T.; Wang, C.Y. The influence of light and maturity on fruit quality and flavonoid content of red raspberries. Food Chem. 2009, 112, 676–684. [Google Scholar] [CrossRef]
- Pedisic, S.; Dragovic-Uzelac, V.; Levaj, B.; Skevin, D. Effect of maturity and geographical region on anthocyanin content of sour cherries (Prunus cerasus var. ‘Marasca’). Food Technol. Biotech. 2010, 48, 86–93. [Google Scholar]
- Begić-Akagić, A.; Drkenda, P.; Vranac, A.; Orazem, P.; Hudina, M. Influence of growing region and storage time on phenolic profile of cornelian cherry jam and fruit. Eur. J. Hortic. Sci. 2013, 78, 30–39. [Google Scholar]
- Kevers, C.; Pincemail, J.; Defraigne, J.O.; Dommes, J. Antioxidant capacity of small dark fruits: Influence of cultivars and harvest time. J. Berry Res. 2014, 4, 97–105. [Google Scholar] [CrossRef] [Green Version]
- Rodica, S.; Bonea, D.; Iancu, P.; Niculescu, M. Biochemical and technological properties of Rosa canina L. fruits from spontaneous flora of Oltenia, Romania. Bull. Univ. Agric. 2015, 72, 182–186. [Google Scholar]
- Dugalic, K.; Sudar, R.; Viljevac, M.; Josipović, M.; Cupic, T. Sorbitol and sugar composition in plum fruits influenced by climatic conditions. J. Agric. Sci. Tech. 2014, 16, 1145–1155. [Google Scholar]
- Güneş, M.; Dölek, Ü.; Elmastaş, M. Pomological changes in some rosehip species during ripening. JAFAG 2016, 33, 214–222. [Google Scholar] [CrossRef]
- Crețescu, I.; Ropciuc, S.; Leahu, A. Evaluation of rosehip fruit productivity and total acidity in response to climatic factors. Rom. Biotech. Lett. 2013, 18, 8403–8412. [Google Scholar]
- Correia, S.; Gonçalves, B.; Aires, A.; Silva, A.; Ferreira, L.; Carvalho, R.; Fernandes, H.; Freitas, C.; Carnide, V.; Silva, A.P. Effect of harvest year and altitude on nutritional and biometric characteristics of blueberry cultivars. J. Chem. 2016, 12. [Google Scholar] [CrossRef]
- Zoratti, L.; Jaakola, L.; Haggman, H.; Giongo, L. Anthocyanin profile in berries of wild and cultivated Vaccinium spp. along altitudinal gradients in Alps. J. Agric. Food Chem. 2015, 63, 8641–8650. [Google Scholar] [CrossRef] [Green Version]
- Mikulic Petkovsek, M.; Schmitzer, V.; Slatnar, A.; Stampar, F.; Veberic, R. A comparison of fruit quality parameters of wild bilberry (Vaccinium myrtillus L.) growing at different location. J. Sci. Food Agric. 2015, 95, 776–785. [Google Scholar] [CrossRef]
- Guerrero-Chavez, G.; Scampicchio, M.; Andreotti, C. Inflence of the site altitude on strawberry phenolic composition and quality. Sci. Hortic. (Amsterdam) 2015, 192, 21–28. [Google Scholar] [CrossRef]
- Kafkas, E.; Kosar, M.; Türemis, N.; Baser, K.H.C. Analysis of sugars, organic acids and vitamin C contents of blackberry genotypes from Turkey. Food Chem. 2006, 97, 732–736. [Google Scholar] [CrossRef]
- Tosun, M.; Ercisli, S.; Karlidag, H.; Sengul, M. Characterization of red raspberry (Rubus idaeus L.) genotypes for their physicochemical properties. J. Food Sci. 2009, 74, 575–579. [Google Scholar] [CrossRef]
- Sha, S.; Li, J.; Wu, J.; Zhang, S. Characteristics of organic acids in the fruit of different pear species. Afr. J. Agric. Res. 2011, 6, 2403–2410. [Google Scholar] [CrossRef]
- Akagić, A.; Vranac, A.; Gaši, F.; Drkenda, P.; Spaho, N.; Oručević Žuljević, S.; Kurtović, M.; Musić, O.; Murtić, S.; Hudina, M. Sugars, acids and polyphenols profile of commercial and traditional apple cultivars for processing. Acta Agric. Slov. 2019, 113/2, 239–251. [Google Scholar] [CrossRef] [Green Version]
- Vukoja, J.; Pichler, A.; Kopjar, M. Stability of Anthocyanins, Phenolics and Color of tart Cherry jams. Foods 2019, 8, 255. [Google Scholar] [CrossRef] [PubMed] [Green Version]
- Lozano, J.E. Fruit Manufacturing—Scientific Basis, Engineering Properties, and Deteriorative Reactions of Technological Importance; Springer: New York, NY, USA, 2006; pp. 136–141. [Google Scholar]
- Evans, R.H.; Van Soestbergen, A.W.; Ristow, K.A. Evaluation of apple juice authenticity of organic acid analysis. J. Assoc. Off. Anal. Chem. 1983, 66, 1517–1520. [Google Scholar] [CrossRef]
- Coppola, E.D.; Starr, M.S. Liquid chromatographic determination of major organic acids in apple juice and cranberry juice cocktail: Collaborative study. J. Assoc. Off. Anal. Chem. 1986, 69, 594–597. [Google Scholar] [CrossRef]
- AIJN Europen Fruit Juice Association, The AIJN Code of Practice. 2006. Available online: https://aijn.eu/en/the-aijn-code-of-practice (accessed on 10 June 2008).
- Pirie, A.; Mullins, M.G. Interrelationships of sugars, anthocyanins, total phenols and dry weight in the skin of grape berries during ripening. Am. J. Enol. Viticult. 1977, 28, 204–209. [Google Scholar]
- Abidi, W.; Jimėnez, S.; Moreno, M.Á.; Gogorcena, Y. Evaluation of antioxidant compounds and total sugar content in a nectarine [Prunus persica (L.) Batsch] progeny. Int. J. Mol. Sci. 2011, 12, 6919–6935. [Google Scholar]
- Milivojević, J.; Rakonjac, V.; Fotirić Akšić, M.; Bogdanović Pristov, J.; Maksimović, V. Classification and fingerprinting of different berries based on biochemical profiling and antioxidant capacity. Pesqui. Agropecu. Bras. 2013, 48, 1285–1294. [Google Scholar] [CrossRef] [Green Version]
- Redzic, S.; Dalmatin, M.; Hamidovic, M.; Kadic, J.; Radevic, M.; Sevo, L. Biodiversity, geo-diversity and protection of natural and cultural heritages. Natl. Environ. Action Plan Bosnia Herzeg. 2003, Sarajevo, 67–76. [Google Scholar]
- Marjanovic-Balaban, Z.; Grujic, S.; Jasic, M.; Vujadinovic, D. Testing of chemical composition of wild berries. Third Int. Sci. Symp. 2012, 154–161. [Google Scholar] [CrossRef]
- Tuzlak, A.; Begić-Akagić, A. Stability of Bioactive Components in Cornelian Cherry Jam During Production and Storage. Work. Fac. Agric. Food Sci. Univ. Sarajevo 2012, 62, 187–201. [Google Scholar]
- Islamovic, A.; Mlaco, M.; Berbic, N.; Begic-Akagic, A.; Orucevic, S.; Bulbulusic, A.; Ekeberg, D.; Drkenda, P. Seasonal variation of the physical and chemical parameters of wild genotypes cornelian cherry (Cornus mas L.). J. Int. Sci. Publ. Agric. Food 2014, 2, 466–471. [Google Scholar]
- Akagić, A.; Mlačo, M.; Islamović, A.; Oručević Žuljević, S.; Vranac, A.; Kallenborn, R. Influence of Fruit Properties of Rose Hips on Pekmez Quality. In Proceedings of the 3rd International Symposium on “Traditional Foods from Adriatic to Caucasus”, Sarajevo, Bosna i Hercegovina, 1–4 October 2015; Volume 370. [Google Scholar]
- Tahirović, A.; Bašić, A. Determination of phenolic content and antioxidant activity of Rosa canina L. fruits in different extraction systems. Work. Fac. For. Univ. Sarajevo 2017, 1, 47–59. [Google Scholar]
- Drkenda, P.; Spahic, A.; Begic-Akagic, A.; Gasi, F.; Vranac, A.; Blanke, M. Pomological characteristics of some autochthonous genotypes of cornelian cherry (Cornus mas L.) in Bosnia and Herzegovina. Erwerbs-Obstbau 2014, 56, 59–66. [Google Scholar] [CrossRef]
- Hudina, M.; Stampar, F. Influence of frost damage on the sugars and organic acids contents in apple and pear flowers. Eur. J. Hortic. Sci. 2006, 71, 161–164. [Google Scholar]
- Begić-Akagić, A.; Spaho, N.; Gaši, F.; Drkenda, P.; Vranac, A.; Meland, M.; Salkić, B. Sugar and organic acid profiles of traditional and international apple cultivars for processing. J. Hyg. Eng. Des. 2014, 190–196. [Google Scholar]
- Hecke, K.; Herbinger, K.; Veberic, R.; Trobec, M.; Toplak, H.; Stampar, F.; Keppel, H.; Grill, D. Sugar, acid, and phenol contents in apple cultivars from organic and integrated fruit cultivation. Eur. J. Clin. Nutr. 2006, 60, 1136–1140. [Google Scholar] [CrossRef] [Green Version]
- Montesano, D.; Cossignani, L.; Giua, I.; Urbani, E.; Simonetti, M.S.; Blasi, F. A Simple HPLC-ELSD method for sugar analysis in goji berry. J. Chem. 2016. [Google Scholar] [CrossRef] [Green Version]
- Rosu, C.M.; Manzu, C.; Olteanu, Z.; Oprica, L.; Oprea, A.; Todirascu-Ciornea, E.; Zamfirache, M.M. Several fruit characteristics of Rosa sp. genotypes from the Northeastern region of Romania. Not. Bot. Horti Agrobot. 2011, 39, 203–208. [Google Scholar] [CrossRef] [Green Version]
- Saeidi, K.A.; Beygi, O.R. Determination of phenolics, soluble carbohydrates, carotenoid contents and minerals of dog rose (Rosa canina L.) fruits grown in south-west of Iran. Iran. J. Med. Arom Plants 2009, 25, 203–215. [Google Scholar]
- Barros, L.; Carvalho, A.M.; Ferreira, I. Exotic fruits as a source of important phytochemicals: Improving the traditional use of Rosa canina fruits in Portugal. Food Res. Int. 2011, 44, 2233–2236. [Google Scholar] [CrossRef]
- Tural, S.; Koca, I. Physico-chemical and antioxidant properties of cornelian cherry fruits (Cornus mas L.) grown in Turkey. Sci. Hortic. (Amsterdam) 2008, 116, 362–366. [Google Scholar] [CrossRef]
- Bijelić, S.; Gološin, B.; Ninić-Todorović, J.; Cerović, S.; Popović, B. Physicochemical fruit characteristics of cornelian cherry (Cornus mas L.) genotypes from Serbia. Genet. Resour. Crop Evol. 2011, 58, 689–695. [Google Scholar] [CrossRef]
- Leeuwen, C.V.; Friant, P.; Choné, X.; Tregoat, O.; Koundouras, S.; Dubourdieu, D. Influence of climate, soil, and cultivar on Terroir. Am. J. Enol. Viticult. 2004, 55, 207–217. [Google Scholar]
- Viljakainen, S.; Visti, A.; Laakso, S. Concetrations of organic acids and solubile sugars in juices from Nordic berries. Acta Agric. Scand. Sect. B-Plant Soil Sci. 2002, 52, 101–109. [Google Scholar]
- Demir, F.; Özcan, M. Chemical and technological properties of rose (Rosa canina L.) fruits grown wild in Turkey. J. Food Eng. 2001, 47, 333–336. [Google Scholar] [CrossRef]
- Mikulic Petkovsek, M.; Schmitzer, V.; Slatnar, A.; Stampar, F.; Veberic, R. Composition of sugars, organic acids and total phenolics in 25 wild or cultivated berry Species. J. Food Sci. 2012, 1–7. [Google Scholar] [CrossRef]
- Ercisli, S.; Orhan, S. Chemical composition of white (Morus alba), red (Morus rubra) and black (Morus nigra) mulberry fruits. Food Chem. 2007, 103, 1380–1384. [Google Scholar] [CrossRef]
- Panico, A.M.; Garufi, F.; Nitto, S.; Mauro, R.; Longhitano, R.C.; Magri, G.; Catalfo, A.; Serrentino, M.E.; Guidi, G. Antioxidant activity and phenolic content of strawberry genotypes from Fragaria × ananassa. Pharm. Biol. 2009, 47, 203–208. [Google Scholar] [CrossRef] [Green Version]
- Mikulic Petkovsek, M.; Stampar, F.; Veberic, R. Parameters of inner quality of the apple scab resistant and susceptible apple cultivars (Malus domestica Borkh.). Sci. Hortic. (Amsterdam) 2007, 114, 37–44. [Google Scholar] [CrossRef]
- Begic-Akagic, A.; Alekic, A.; Orucevic, S.; Kallenborn, R.; Berbic, N.; Islamovic, A.; Drkenda, P.; Vranac, A. Influence of production method on phenol content of rose hip “pekmez”. In Proceedings of the 24th International Scinetific-Expert Conference of Agriculture and Food Industry, Sarajevo, Bosnia and Herzegovina, 25–28 September 2013; Blesić, M., Ed.; Faculty of Agriculture and Food Sciences, University of Sarajevo: Sarajevo, Bosnia and Herzegovina, 2013; pp. 229–234. [Google Scholar]
- Popović, Z.; Matić, R.; Bajić-Ljubičić, J.; Tešević, V.; Bojović, S. Geographic variability of selected phenolic compounds in fresh berries of two Cornus species. Trees 2018, 31, 2003–2014. [Google Scholar] [CrossRef]


| Month/Growing Season | Location/Meteorological Date | ||||||||||||||
|---|---|---|---|---|---|---|---|---|---|---|---|---|---|---|---|
| Bugojno * | Drvar * | Foča ** | Konjic * | Romanija ** | Bjelašnica * | Fojnica * | |||||||||
| Tm | Ppt | Tm | Ppt | Tm | Ppt | Tm | Ppt | Tm | Ppt | Tm | Ppt | Tm | Ppt | ||
| January | 2014 | 4.6 | 70.4 | 4.7 | 125.7 | 4.1 | 52.1 | 3.1 | 162.7 | 2.0 | 37.5 | −2.7 | 91.0 | 5.0 | 55.3 |
| 2015 | 0.1 | 90.1 | 1.6 | 121.9 | 0.6 | 161.5 | −1.0 | 222.9 | −2.5 | 89.9 | −5.7 | 173.4 | 0.9 | 112.6 | |
| February | 2014 | 7.2 | 41.1 | 5.8 | 195.1 | 6.9 | 20.5 | 4.7 | 74.9 | 4.4 | 10.8 | −2.7 | 78.7 | 7.8 | 19.9 |
| 2015 | 1.3 | 43.9 | 1.2 | 59.9 | 2.2 | 52.6 | −0.7 | 109.9 | −1.3 | 56.1 | −6.9 | 131.0 | 1.7 | 56.6 | |
| March | 2014 | 7.8 | 34.7 | 7.3 | 59.0 | 8.2 | 74.6 | 5.4 | 109.5 | 4.8 | 63.6 | −2.5 | 109.0 | 8.1 | 67.3 |
| 2015 | 5.3 | 55.1 | 5.3 | 46.4 | 5.4 | 91.2 | 2.3 | 126.7 | 2.1 | 74.7 | −5.5 | 143.8 | 5.3 | 80.4 | |
| April | 2014 | 10.5 | 153.6 | 10.8 | 178.9 | 11.4 | 156.3 | 7.6 | 184.9 | 7.6 | 153.9 | −0.1 | 210.7 | 10.2 | 148.5 |
| 2015 | 9.1 | 47.7 | 9.2 | 26.6 | 9.6 | 54.6 | 6.2 | 83.8 | 6.2 | 53.2 | −2.8 | 73.3 | 9.2 | 43.6 | |
| May | 2014 | 13.4 | 125.7 | 13.1 | 195.9 | 14.1 | 118.4 | 9.9 | 188.9 | 10.7 | 260.7 | 3.1 | 185.8 | 13.5 | 186.2 |
| 2015 | 15.6 | 60.0 | 15.3 | 111.1 | 16.5 | 51.9 | 12.9 | 41.2 | 13.4 | 75.4 | 5.6 | 38.2 | 16.1 | 52.9 | |
| June | 2014 | 17.6 | 96.0 | 17.9 | 116.3 | 18.4 | 123.9 | 14.5 | 168.8 | 15.2 | 170.0 | 7.6 | 170.1 | 17.5 | 125.1 |
| 2015 | 18.0 | 72.6 | 18.0 | 55.9 | 18.2 | 121.3 | 14.9 | 94.9 | 15.3 | 113.3 | 7.7 | 118.6 | 17.8 | 91.0 | |
| July | 2014 | 18.7 | 161.5 | 19.0 | 89.5 | 19.5 | 134.1 | 16.1 | 112.3 | 17.0 | 76.2 | 9.5 | 198.5 | 19.5 | 73.3 |
| 2015 | 22.7 | 67.6 | 22.7 | 25.2 | 22.7 | 23.2 | 19.7 | 21.2 | 19.8 | 25.2 | 13.9 | 25.7 | 23.2 | 9.4 | |
| August | 2014 | 19.2 | 67.5 | 19.4 | 81,2 | 19.8 | 93.8 | 16.5 | 94.9 | 16.8 | 112.6 | 10.5 | 70.9 | 19.7 | 78.2 |
| 2015 | 21.3 | 51.3 | 21.2 | 33.7 | 21.9 | 30.1 | 18.7 | 63.6 | 18.9 | 85.7 | 12.8 | 68.4 | 21.8 | 57.4 | |
| September | 2014 | 14.7 | 173.8 | 14.5 | 240.3 | 15.7 | 142.8 | 12.3 | 270.8 | 12.2 | 147.0 | 5.9 | 215.4 | 14.9 | 139.5 |
| 2015 | 16.1 | 91.2 | 16.0 | 107.2 | 17.7 | 50.7 | 14.4 | 102.2 | 14.5 | 84.3 | 7.8 | 77.8 | 17.6 | 60.2 | |
| October | 2014 | 11.8 | 49.7 | 11.4 | 69.8 | 11.5 | 58.5 | 9.4 | 71.5 | 9.1 | 42.9 | 4.0 | 92.1 | 12.0 | 59.0 |
| 2015 | 10.9 | 166.6 | 11.0 | 185.6 | 11.6 | 145.8 | 8.8 | 266.2 | 8.4 | 106.9 | 3.0 | 315.4 | 11.1 | 124.6 | |
| November | 2014 | 8.3 | 55.2 | 8.8 | 170.6 | 7.5 | 42.1 | 7.0 | 131.8 | 6.0 | 56.6 | 1.3 | 139.4 | 8.9 | 47.0 |
| 2015 | 4.5 | 62.5 | 5.0 | 45.2 | 5.2 | 83.0 | 5.4 | 118.0 | 3.4 | 71.2 | 2.5 | 178.4 | 6.0 | 75.1 | |
| December | 2014 | 2.2 | 85.2 | 2.7 | 133.9 | 2.6 | 116.0 | 0.8 | 137.2 | −0.5 | 88.0 | −4,4 | 211.1 | 2.7 | 83.4 |
| 2015 | −1.3 | 0.2 | 0.8 | 0.2 | 0.6 | 0.6 | 1.2 | 2.2 | −1.8 | 0.6 | −0.2 | 1.6 | −0.5 | 2.5 | |
| Average year Tm/ ∑Ppt | 2014 | 11.3 | 1114.4 | 11.3 | 1656.2 | 11.6 | 1133,1 | 9.0 | 1708.2 | 8.8 | 1219,80 | 2.5 | 1772.7 | 11.6 | 1082.7 |
| 2015 | 10.3 | 808.8 | 10.6 | 819.9 | 11.0 | 866,50 | 8.6 | 1252.8 | 8.0 | 836,50 | 2.7 | 1345.6 | 10.8 | 766.3 | |
| Genotype | Growing Region | Sample Code | Harvesting Time 2014/2015 | Color |
|---|---|---|---|---|
| Rosehip (Rosa canina L.) | Bugojno (altitude = 942 m a.s.l.*, 43°19′23.74′’N /18°8′16.33′’E carbonated brown soil) | DRB | 12.10./25.10. | bright red |
| Drvar (altitude = 700 m a.s.l., 44°22′26′’N /16°22′50.9′’E carbonated red soil) | DRD | 3.10./5.10. | ||
| Foča (altitude =511 m a.s.l., 43°35′3′’N /18°47′33′’E acidic brown soil) | DRF | 30.9./3.10. | ||
| Konjic (altitude = 975 m a.s.l., 43,83°N /17,85°E district brown soil) | DRK | 9.10./28.10. | ||
| Cornelian cherry (Cornus mas L.) | Bugojno (altitude = 942 m a.s.l., 43°19′23.74′’N /18°8′16.33′’E carbonated brown soil) | CCB | 25.9./28.9. | dark red |
| Drvar (altitude = 700 m a.s.l., 44°22′26′’N /16°22′50.9′’E carbonated red soil) | CCD | 23.9./27.9. | ||
| Foča (altitude = 511 m a.s.l., 43°35′3′’N /18°47′33′’E acidic brown soil) | CCF | 15.9./19.9. | ||
| Konjic (altitude = 750 m a.s.l., 43.5807°N /18.0166°E carbonated brown soil) | CCK | 20.9./26.9. | ||
| Wild strawberry (Fragaria vesca L.) | Romanija (altitude = 1024 m a.s.l., 43°52′33.2′’N /18°40′10.92′’E rendzina) | WSR | 20.6./29.6. | red |
| Bjelašnica (altitude = 1430 m a.s.l., 43,67°N /18,23°E rendzina) | WSB | 5.7./8.7. | ||
| Bilberry (Vaccinium myrtillus L.) | Fojnica (altitude = 1670 m a.s.l., 43°57′26′’N /17°45′17′’E brown acidic soil) | WBF | 16.8./24.7. | dark purple |
| Species/Growing Region | Growing Season | Glucose | Fructose | Sucrose | TS | G/F | |||||
|---|---|---|---|---|---|---|---|---|---|---|---|
| x̄ | SE | x̄ | SE | x̄ | SE | x̄ | SE | x̄ | SE | ||
| DRB | 2014 | 70.78 | 1.777x | 84.66 | 2.317x | 4.66 | 0.234x | 160.11 | 2.166x | 0.84 | 0.027 |
| 2015 | 65.51 | 0.658y | 78.53 | 0.396y | 3.98 | 0.019y | 148.02 | 0.970y | 0.83 | 0.007 | |
| Mean by region | 68.15 | 3.126b | 81.60 | 3.471b | 4.32 | 0.399b | 154.06 | 6.787b | 0.84 | 0.018c | |
| DRD | 2014 | 80.38 | 1.455 | 91.45 | 1.091x | 5.47 | 0.456x | 177.31 | 0.276x | 0.88 | 0.026 |
| 2015 | 74.01 | 0.735 | 86.96 | 1.123y | 4.63 | 0.027y | 165.60 | 0.236y | 0.85 | 0.002 | |
| Mean by region | 77.19 | 4.610a | 89.20 | 2.557a | 5.05 | 0.546a | 171.45 | 6.417a | 0.87 | 0.023b | |
| DRF | 2014 | 78.96 | 0.619 | 92.68 | 1.287x | 6.12 | 0.294 | 177.77 | 2.146x | 0.85 | 0.007 |
| 2015 | 73.28 | 0.773 | 86.62 | 0.360y | 4.30 | 0.012 | 164.20 | 0.910y | 0.85 | 0.002 | |
| Mean by region | 76.12 | 2.173a | 89.65 | 3.428a | 5.21 | 1.013a | 170.99 | 7.574a | 0.85 | 0.008bc | |
| DRK | 2014 | 70.89 | 0.959 | 78.84 | 0.793x | 4.18 | 0.151 | 153.92 | 1.213x | 0.90 | 0.017 |
| 2015 | 66.07 | 0.059 | 69.33 | 1.481y | 3.05 | 0.047 | 138.44 | 0.484y | 0.95 | 0.006 | |
| Mean by region | 68.48 | 2.712b | 74.09 | 5.244c | 3.61 | 0.629c | 146.18 | 8.516c | 0.93 | 0.032a | |
| CCB | 2014 | 74.61 | 1.437x | 81.44 | 0.800x | 4.03 | 0.181x | 160.08 | 0.726x | 0.92 | 0.026x |
| 2015 | 67.78 | 0.420y | 71.21 | 0.251y | 2.62 | 0.060y | 141.61 | 0.443y | 0.95 | 0.007y | |
| Mean by region | 71.19 | 3.856a | 76.33 | 5.629c | 3.33 | 0.786b | 150.85 | 10.134b | 0.93 | 0.026a | |
| CCD | 2014 | 75.90 | 0.784x | 82.11 | 0.411x | 3.79 | 0.256x | 161.79 | 0.354x | 0.92 | 0.013x |
| 2015 | 62.49 | 0.873y | 71.64 | 0.307y | 2.89 | 0.088y | 137.03 | 1.218y | 0.87 | 0.009y | |
| Mean by region | 69.19 | 7.380b | 76.87 | 5.74bc | 3.34 | 0.521b | 149.41 | 13.589b | 0.90 | 0.03b | |
| CCF | 2014 | 71.90 | 1.607x | 84.18 | 1.510x | 4.84 | 0.332x | 160.93. | 2.675x | 0.85 | 0.013x |
| 2015 | 66.04 | 0.141y | 78.80 | 0.319y | 3.17 | 0.007y | 148.01 | 0.432y | 0.84 | 0.003y | |
| Mean by region | 68.97 | 3.370b | 81.49 | 3.103a | 4.00 | 0.938a | 154.47 | 7.276a | 0.85 | 0.012c | |
| CCK | 2014 | 70.32 | 1.039x | 80.62 | 1.276x | 3.42 | 0.106x | 154.36 | 2.322x | 0.87 | 0.002x |
| 2015 | 60.04 | 0.053y | 74.86 | 0.084y | 2.72 | 0.105y | 137.61 | 0.186y | 0.80 | 0.001y | |
| Mean by region | 65.18 | 5.667c | 77.74 | 3.26b | 3.07 | 0.398b | 145.99 | 9.292c | 0.84 | 0.034c | |
| WSB | 2014 | 24.54 | 1.170x | 62.83 | 1.637x | 5.18 | 0.172x | 92.55 | 0.468x | 0.39 | 0.029x |
| 2015 | 18.50 | 0.383y | 52.71 | 1.089y | 4.70 | 0.007y | 75.92 | 1.363y | 0.35 | 0.006y | |
| Mean by region | 21.52 | 3.398b | 57.77 | 5.682b | 4.94 | 0.280b | 84.23 | 9.156b | 0.37 | 0.029b | |
| WSR | 2014 | 35.43 | 1.030x | 69.30 | 0.736x | 6.84 | 0.134x | 111.56 | 1.047x | 0.51 | 0.017x |
| 2015 | 22.60 | 0.300y | 58.34 | 0.458y | 5.94 | 0.186y | 86.87 | 0.276y | 0.39 | 0.008y | |
| Mean by region | 29.01 | 7.060a | 63.82 | 6.025a | 6.00 | 1.332a | 99.22 | 13.539a | 0.45 | 0.069a | |
| WBF | 2014 | 34.40 | 0.587x | 36.49 | 1.126x | 2.86 | 0.130x | 73.75 | 1.794x | 0.94 | 0.016 |
| 2015 | 27.98 | 0.856y | 28.22 | 1.048y | 1.35 | 0.120y | 57.55 | 1.787y | 0.99 | 0.031 | |
| Mean by year | 31.19 | 3.573 | 32.35 | 4.631 | 2.11 | 0.838 | 65.65 | 9.014 | 0.97 | 0.035 | |
| Species/Growing Region | Growing Season | Malic Acid | Citric Acid | Shikimic Acid | Fumaric Acid | TA | S/A | ||||||
|---|---|---|---|---|---|---|---|---|---|---|---|---|---|
| x̄ | SE | x̄ | SE | x̄ | SE | x̄ | SE | x̄ | SE | x̄ | SE | ||
| DRB | 2014 | 4.09 | 0.124x | 1.57 | 0.114x | 0.33 | 0.042x | 0.07 | 0.006x | 6.07 | 0.253x | 26.42 | 1.161x |
| 2015 | 5.87 | 0.057y | 1.96 | 0.910y | 0.43 | 0.043y | 0.09 | 0.007y | 8.35 | 0.015y | 17.73 | 0.084y | |
| Mean by region | 4.98 | 1.230c | 1.76 | 1.023c | 0.38 | 0.066d | 0.08 | 0.013c | 7.21 | 1.260c | 22.07 | 4.816b | |
| DRD | 2014 | 6.43 | 0.223x | 2.06 | 0.161x | 0.52 | 0.042x | 0.25 | 0.025x | 9.26 | 0.202x | 19.16 | 0.424x |
| 2015 | 7.27 | 0.183y | 2.27 | 0.987y | 0.78 | 0.009y | 0.34 | 0.008y | 10.66 | 0.453y | 15.55 | 0.662y | |
| Mean by region | 6.85 | 0.493b | 2.16 | 0.560b | 0.65 | 0.146b | 0.29 | 0.051a | 9.96 | 0.830b | 17.36 | 2.038c | |
| DRF | 2014 | 3.87 | 0.098x | 1.48 | 0.024x | 0.44 | 0.028x | 0.07 | 0.003x | 5.87 | 0.079x | 30.28 | 0.113x |
| 2015 | 5.11 | 0.075y | 1.80 | 0.005y | 0.53 | 0.004y | 0.08 | 0.001y | 7.51 | 0.080y | 21.86 | 0.177y | |
| Mean by region | 4.49 | 1.679d | 1.64 | 0.210c | 0.49 | 0.049c | 0.08 | 0.010c | 6.69 | 0.902d | 26.07 | 4.616a | |
| DRK | 2014 | 7.35 | 0.184x | 2.78 | 0.117x | 0.71 | 0.034x | 0.12 | 0.024x | 10.96 | 0.318x | 14.06 | 0.462x |
| 2015 | 8.55 | 1.567y | 3.18 | 0.155y | 0.84 | 0.031y | 0.18 | 0.069y | 12.74 | 0.369y | 10.87 | 0.346y | |
| Mean by region | 7.95 | 3.093a | 2.98 | 0.340a | 0.77 | 0.078a | 0.15 | 0.057b | 11.85 | 1.027a | 12.46 | 1.78d | |
| CCB | 2014 | 28.61 | 0.863x | 1.30 | 0.044x | 0.57 | 0.121x | 0.50 | 0.060x | 30.97 | 0.832y | 5.17 | 0.126x |
| 2015 | 31.43 | 0.582y | 1.49 | 0.098y | 0.83 | 0.013y | 0.59 | 0.02y | 34.34 | 0.532x | 4.12 | 0.075y | |
| Mean by region | 30.02 | 1.681b | 1.40 | 0.124a | 0.70 | 0.158b | 0.55 | 0.066b | 32.66 | 1.945b | 4.65 | 0.580b | |
| CCD | 2014 | 30.81 | 1.929x | 1.43 | 0.039x | 1.18 | 0.242x | 1.01 | 0.079x | 34.43 | 1.687y | 4.71 | 0.218x |
| 2015 | 34.06 | 1.102y | 1.54 | 0.067y | 1.45 | 0.386y | 1.12 | 0.036y | 38.17 | 0.804x | 3.59 | 0.066y | |
| Mean by region | 32.44 | 2.269a | 1.48 | 0.080a | 1.31 | 0.322a | 1.07 | 0.082a | 36.30 | 2.365a | 4.15 | 0.628c | |
| CCF | 2014 | 24.98 | 0.884x | 1.13 | 0.112x | 0.51 | 0.028x | 0.36 | 0.015x | 26.99 | 0.794y | 5.96 | 0.098x |
| 2015 | 28.31 | 0.457y | 1.30 | 0.145y | 0.73 | 0.009y | 0.42 | 0.007y | 30.76 | 0.400x | 4.81 | 0.051y | |
| Mean by region | 26.65 | 1.931c | 1.22 | 0.135b | 0.62 | 0.118b | 0.39 | 0.037b | 28.88 | 2.140c | 5.39 | 0.635a | |
| CCK | 2014 | 31.13 | 0.938x | 1.43 | 0.171x | 0.73 | 0.041x | 1.02 | 0.109x | 34.31 | 0.662y | 4.50 | 0.086x |
| 2015 | 33.39 | 0.564y | 1.63 | 0.088y | 0.96 | 0.013y | 1.19 | 0.302y | 37.17 | 0.935x | 3.70 | 0.092y | |
| Mean by region | 32.26 | 2.034a | 1.53 | 0.163a | 0.85 | 0.128b | 1.10 | 0.223a | 35.74 | 1.725a | 4.10 | 0.443c | |
| WSB | 2014 | 1.19 | 0.011y | 4.70 | 0.407y | 0.08 | 0.010y | 0.001 | 0.0001 | 5.97 | 0.396y | 15.55 | 1.124x |
| 2015 | 2.13 | 0.023x | 6.97 | 0.115x | 0.12 | 0.014x | 0.002 | 0.0001 | 9.22 | 0.094y | 8.23 | 0.172y | |
| Mean by region | 1.66 | 0.518b | 5.83 | 1.271a | 0.10 | 0.022 | 0.002 | 0.0002 | 7.60 | 1.799a | 11.89 | 4.07b | |
| WSR | 2014 | 1.23 | 0.103y | 3.21 | 0.102y | 0.09 | 0.008y | 0.002 | 0.0005 | 4.53 | 0.178y | 24.64 | 1.20x |
| 2015 | 2.68 | 0.042x | 6.07 | 0.042x | 0.11 | 0.002x | 0.002 | 0.0006 | 8.86 | 0.075x | 9.91 | 0.073y | |
| Mean by region | 1.95 | 1.123a | 4.64 | 1.57b | 0.10 | 0.011 | 0.002 | 0.0005 | 6.70 | 2.37b | 17.22 | 5.159a | |
| WBF | 2014 | 2.56 | 0.250y | 7.07 | 0.237y | 0.14 | 0.013y | 0.0010 | 0.0002y | 9.78 | 0.471y | 7.55 | 0.317x |
| 2015 | 4.35 | 0.145x | 10.63 | 0.262x | 0.18 | 0.007x | 0.0014 | 0.0000x | 15.16 | 0.254x | 3.80 | 0.183y | |
| Mean by year | 3.45 | 1.340 | 8.85 | 1.96 | 0.16 | 0.022 | 0.001 | 0.0003 | 12.47 | 2.968 | 5.67 | 2.068 | |
| Sucr | Gluc | Fruc | TS | G/F | Mal | Shik | Cit | Fum | TA | S/A | ||
|---|---|---|---|---|---|---|---|---|---|---|---|---|
| Tm | DR | 0.80 ** | 0.68 ** | 0.90 ** | 0.83 ** | −0.75 ** | −0.83 ** | −0.74 ** | −0.92 ** | −0.11 | −0.85 ** | 0.85 ** |
| CC | 0.62 | 0.60 | 0.42 | 0.56 | 0.42 | −0.64 | −0.14 | −0.73(*) | −0.66 | −0.62 | 0.65 | |
| Alt | DR | −0.65 ** | −0.74 ** | −0.78 ** | −0.78 ** | 0.38 | 0.47 * | 0.20 | 0.55 ** | −0.05 | 0.47 * | −0.56 ** |
| CC | −0.66 | −0.75 * | −0.78 * | −0.78 * | 0.40 | 0.47 | 0.20 | 0.57 | −0.05 | 0.47 | −0.56 | |
| Ppt | DR | 0.13 | 0.30 | −0.03 | 0.11 | −0.53 ** | 0.29 | 0.17 | 0.38 | 0.07 | 0.31 | −0.20 |
| CC | 0.14 | 0.30 | −0.03 | 0.11 | 0.56 | 0.29 | 0.17 | 0.39 | 0.07 | 0.31 | −0.20 |
© 2020 by the authors. Licensee MDPI, Basel, Switzerland. This article is an open access article distributed under the terms and conditions of the Creative Commons Attribution (CC BY) license (http://creativecommons.org/licenses/by/4.0/).
Share and Cite
Akagić, A.; Oras, A.V.; Oručević Žuljević, S.; Spaho, N.; Drkenda, P.; Bijedić, A.; Memić, S.; Hudina, M. Geographic Variability of Sugars and Organic Acids in Selected Wild Fruit Species. Foods 2020, 9, 462. https://doi.org/10.3390/foods9040462
Akagić A, Oras AV, Oručević Žuljević S, Spaho N, Drkenda P, Bijedić A, Memić S, Hudina M. Geographic Variability of Sugars and Organic Acids in Selected Wild Fruit Species. Foods. 2020; 9(4):462. https://doi.org/10.3390/foods9040462
Chicago/Turabian StyleAkagić, Asima, Amila Vranac Oras, Sanja Oručević Žuljević, Nermina Spaho, Pakeza Drkenda, Amna Bijedić, Senad Memić, and Metka Hudina. 2020. "Geographic Variability of Sugars and Organic Acids in Selected Wild Fruit Species" Foods 9, no. 4: 462. https://doi.org/10.3390/foods9040462