Consumer Attitudes towards Local and Organic Food with Upcycled Ingredients: An Italian Case Study for Olive Leaves


Abstract
:1. Introduction
2. Materials and Methods
- NNNT: There is no need for new food technologies because there are so many types of foods;
- NTOR: The benefits associated with innovative food technologies are often overestimated;
- NTLQ: New food technologies reduce the natural quality of foods.
3. Results
3.1. Sample Description
3.2. Model Results
3.3. Differences across Generations
4. Discussion
5. Conclusions
Author Contributions
Funding
Acknowledgments
Conflicts of Interest
Data Availability
References
- Pazzini, A. Storia, Tradizioni e Leggende Nella Medicina Popolare; Ricordati: Bergamo, Italy, 1940; pp. 1–142. [Google Scholar]
- Rossi, M. Tinture Madri in Fitoterapia; Studio Edizioni: Milano, Italy, 1992; pp. 1–225. [Google Scholar]
- Acar-Tek, N.; Ağagündüz, D. Olive Leaf (Olea europaea L. folium): Potential Effects on Glycemia and Lipidemia. Ann. Nutr. Metab. 2020, 76, 63–68. [Google Scholar] [CrossRef]
- Coderoni, S.; Perito, M.A.; Cardillo, C. Consumer behaviour in Italy. Who spends more to buy a Mediterranean Diet? New Medit. 2017, 162, 38–46. [Google Scholar]
- Perito, M.A.; Sacchetti, G.; Di Mattia, C.D.; Chiodo, E.; Pittia, P.; Saguy, I.S.; Cohen, E. Buy local! Familiarity and preferences for extra virgin olive oil of Italian consumers. J. Food Prod. Market. 2019, 25, 462–477. [Google Scholar] [CrossRef]
- Flamminii, F.; Di Mattia, C.D.; Difonzo, G.; Neri, L.; Faieta, M.; Caponio, F.; Pittia, P. From by-product to food ingredient: Evaluation of compositional and technological properties of olive-leaf phenolic extracts. J. Sci. Food Agric. 2019, 99, 6620–6627. [Google Scholar] [CrossRef] [PubMed]
- Flamminii, F.; Di Mattia, C.D.; Nardella, M.; Chiarini, M.; Valbonetti, L.; Neri, L.; Difonzo, G.; Pittia, P. Structuring alginate beads with different biopolymers for the development of functional ingredients loaded with olive leaves phenolic extract. Food Hydrocoll. 2020, in press. [Google Scholar] [CrossRef]
- Lähteenmäki, L. Claiming health in food products. Food Qual. Prefer. 2013, 27, 196–201. [Google Scholar] [CrossRef]
- Fernqvist, F.; Ekelund, L. Credence and the effect on consumer liking of food–A review. Food Qual. Prefer. 2014, 32, 340–353. [Google Scholar] [CrossRef] [Green Version]
- Menapace, L.; Colson, G.; Grebitus, C.; Facendola, M. Consumers’ preferences for geo-graphical origin labels: Evidence from the Canadian olive oil market. Eur. Rev. Agric. 2011, 38, 193–212. [Google Scholar] [CrossRef]
- Van der Lans, I.A.; Van Ittersum, K.; De Cicco, A.; Loseby, M. The role of the region of origin and EU certificates of origin in consumer evaluation of food products. Eur. Rev. Agric. 2001, 28, 451–477. [Google Scholar] [CrossRef]
- Hobbs, J.E.; Goddard, E. Consumers and trust. Food Policy 2015, 52, 71–74. [Google Scholar] [CrossRef]
- Russo, C.; Simeone, M. The growing influence of social and digital media. Br. Food J. 2017, 119, 1766–1780. [Google Scholar] [CrossRef]
- Peschel, A.O.; Aschemann-Witzel, J. Sell more for less or less for more? The role of transparency in consumer response to upcycled food products. J. Clean. Prod. 2020, 273, 122884. [Google Scholar] [CrossRef]
- Asioli, D.; Næs, T.; Granli, B.S.; Lengard Almli, V. Consumer preferences for iced coffee determined by conjoint analysis: An exploratory study with Norwegian consumers. Int. J. Food Sci. Technol. 2014, 49, 1565–1571. [Google Scholar] [CrossRef] [Green Version]
- Lusk, J.L.; Briggeman, B.C. Food values. Am. J. Agric. Econ. 2009, 91, 184–196. [Google Scholar] [CrossRef]
- Steenhuis, I.H.; Waterlander, W.E.; de Mul, A. Consumer food choices: The role of price and pricing strategies. Public Health Nutr. 2011, 14, 2220–2226. [Google Scholar] [CrossRef] [Green Version]
- Defrancesco, E.; Perito, M.A.; Bozzolan, I.; Cei, L.; Stefani, G. Testing consumers’ preferences for environmental attributes of pasta. Insights from an ABR approach. Sustainability 2017, 9, 1701. [Google Scholar] [CrossRef] [Green Version]
- Nait Mohand, N.; Hammoudi, A.; Radjef, M.S.; Hamza, O.; Perito, M.A. How do food safety regulations influence market price? A theoretical analysis. Br. Food J. 2017, 119, 1687–1704. [Google Scholar] [CrossRef]
- De Pelsmacker, P.; Driesen, L.; Rayp, G. Are fair trade labels good business? Ethics and coffee buying intentions. J. Consum. Aff. 2003, 39, 1–20. [Google Scholar]
- Boutouis, M.Z.; Hammoudi, A.; Benhassine, W.; Perito, M.A. Uncertainty of food contamination origin and liability rules: Implications for bargaining power. Agribusiness 2018, 34, 77–92. [Google Scholar] [CrossRef]
- Hempel, C.; Hamm, U. Local and/or organic: A study on consumer preferences for organic food and food from different origins. Int. J. Consum. 2016, 40, 732–741. [Google Scholar] [CrossRef]
- Canavari, M.; Coderoni, S. Consumer stated preferences for dairy products with carbon footprint labels in Italy. Agric. Food Econ. 2020, 8, 1–16. [Google Scholar] [CrossRef] [Green Version]
- Galanakis, C.M. Recovery of high added-value components from food wastes: Conventional, emerging technologies and commercialized applications. Trends Food Sci. Technol. 2012, 26, 68–87. [Google Scholar] [CrossRef]
- Coderoni, S.; Perito, M.A. Sustainable consumption in the circular economy. An analysis of consumers’ purchase intentions for waste-to-value food. J. Clean. Prod. 2020, 252, 119870. [Google Scholar] [CrossRef]
- Grasso, S.; Asioli, D. Consumer preferences for upcycled ingredients: A case study with biscuits. Food Qual. Prefer. 2020, 84, 103951. [Google Scholar] [CrossRef]
- Aschemann-Witzel, J.; Peschel, A.O. How circular will you eat? The sustainability challenge in food and consumer reaction to either waste-to-value or yet un derused novel ingredients in food. Food Qual. Prefer. 2019, 77, 15–20. [Google Scholar] [CrossRef]
- Pliner, P.; Hobden, K. Development of a scale to measure the trait of food neophobia in humans. Appetite 1992, 19, 105–120. [Google Scholar] [CrossRef]
- Cox, D.N.; Evans, G. Construction and validation of a psychometric scale to measure consumers’ fears of novel food technologies: The food technology neophobia scale. Food Qual. Prefer. 2008, 19, 704–710. [Google Scholar] [CrossRef]
- Verbeke, W. Profiling consumers who are ready to adopt insects as a meat substitute in a Western society. Food Qual. Prefer. 2015, 39, 147–155. [Google Scholar] [CrossRef]
- Palmieri, N.; Perito, M.A.; Macrì, M.C.; Lupi, C. Exploring consumers’ willingness to eat insects in Italy. Br. Food J. 2019, 121, 2937–2950. [Google Scholar] [CrossRef]
- Palmieri, N.; Perito, M.A.; Lupi, C. Consumer acceptance of cultured meat: Some hints from Italy. Br. Food J. 2020, in press. [Google Scholar] [CrossRef]
- Perito, M.A.; Di Fonzo, A.; Sansone, M.; Russo, C. Consumer acceptance of food obtained from olive by-products. Br. Food J. 2019, 122, 212–226. [Google Scholar] [CrossRef]
- Bhatt, S.; Lee, J.; Deutsch, J.; Ayaz, H.; Fulton, B.; Suri, R. From food waste to value-added surplus products (VASP): Consumer acceptance of a novel food product category. J. Consum. Behav. 2018, 17, 57–63. [Google Scholar] [CrossRef]
- Berghoef, N.; Dodds, R. Potential for sustainability eco-labeling in Ontario’s wine industry. Int. J. Wine Bus. Res. 2011, 23, 298–317. [Google Scholar] [CrossRef]
- Barber, N. “Green” wine packaging: Targeting environmental consumers. Int. J. Wine Bus. Res. 2010, 22, 423–444. [Google Scholar] [CrossRef]
- Sörqvist, P.; Haga, A.; Holmgren, M.; Hansla, A. An eco-label effect in the built environment: Performance and comfort effects of labeling a light source environmentally friendly. J. Environ. Psychol. 2015, 42, 123–127. [Google Scholar] [CrossRef] [Green Version]
- Ditlevsen, K.; Sandøe, P.; Lassen, J. Healthy food is nutritious, but organic food is healthy because it is pure: The negotiation of healthy food choices by Danish consumers of organic food. Food Qual. Prefer. 2019, 71, 46–53. [Google Scholar] [CrossRef] [Green Version]
- Ginon, E.; Ares, G.; dos Santos Laboissière, L.H.E.; Brouard, J.; Issanchou, S.; Deliza, R. Logos indicating environmental sustainability in wine production: An exploratory study on how do Burgundy wine consumers perceive them. Food Res. Int. 2014, 62, 837–845. [Google Scholar] [CrossRef] [Green Version]
- Grankvist, G.; Biel, A. The importance of beliefs and purchase criteria in the choice of eco-labeled food products. J. Environ. Psychol. 2001, 21, 405–410. [Google Scholar] [CrossRef]
- Magnusson, M.K.; Arvola, A.; Hursti, U.K.K.; Åberg, L.; Sjödén, P.O. Choice of organic foods is related to perceived consequences for human health and to environmentally friendly behaviour. Appetite 2003, 40, 109–117. [Google Scholar] [CrossRef]
- Hughner, R.S.; McDonagh, P.; Prothero, A.; Shultz, C.J.; Stanton, J. Who are organic food consumers? A compilation and review of why people purchase organic food. J. Consum. Behav. Int. Res. Rev. 2007, 6, 94–110. [Google Scholar] [CrossRef]
- Aschemann-Witzel, J.; Zielke, S. Can’t buy me green? A review of consumer perceptions of and behavior toward the price of organic food. J. Cons. Affairs 2015, 51, 211–251. [Google Scholar] [CrossRef]
- Loureiro, M.L.; Umberger, W.J. Estimating consumer willingness to pay for country-of- origin labelling. J. Agric. Resour. Econ. 2003, 28, 287–301. [Google Scholar]
- Zander, K.; Stolz, H.; Hamm, U. Promising ethical arguments for product differentiation in the organic food sector. A mixed methods research approach. Appetite 2013, 62, 133–142. [Google Scholar] [CrossRef] [PubMed]
- Feldmann, C.; Hamm, U. Consumers’ perceptions and preferences for local food: A review. Food Qual. Prefer. 2015, 40, 152–164. [Google Scholar] [CrossRef]
- Grebitus, C.; Lusk, J.L.; Nayga, R.M., Jr. Effect of distance of transportation on willingness to pay for food. Ecol. Econ. 2013, 88, 67–75. [Google Scholar] [CrossRef]
- Stephenson, G.; Lev, L. Common support for local agriculture in two contrasting Oregon communities. Renew. Agric. Food Syst. 2004, 19, 210–217. [Google Scholar] [CrossRef]
- Vanhonacker, F.; Lengard, V.; Hersleth, M.; Verbeke, W. Profiling European traditional food consumers. Br. Food J. 2010, 112, 871–886. [Google Scholar] [CrossRef]
- Fibri, D.L.N.; Frøst, M.B. Indonesian millennial consumers’ perception of tempe and how it is affected by product information and consumer psychographic traits. Food Qual. Prefer. 2020, 80, 103798. [Google Scholar] [CrossRef]
- Wooldridge, J.M. Econometric Analysis of Cross Section and Panel Data, 2nd ed.; MIT Press: Cambridge, MA, USA, 2010. [Google Scholar]
- Kayam, O.; Hirsch, T. Using social media networks to conduct questionnaire based research in social studies case study: Family language policy. J. Sociol. Res. 2012, 3, 57–67. [Google Scholar] [CrossRef]
- Osservatorio Sana. 2018: “Tutti i Numeri del Bio Italiano: I Driver del Consumatore e le Novità del Canale Specializzato”. Available online: http://www.sana.it/media-room/archivio-news/osservatorio-sana-2018-tutti-i-dati-sulle-abitudini-dacquisto-di-prodotti-bio-e-sulle-strategie-del-canale-specializzato/8843.html (accessed on 6 September 2020).
- Evans, G.; Kermarrec, C.; Sable, T.; Cox, D.N. Reliability and predictive validity of the Food Technology Neophobia Scale. Appetite 2010, 54, 390–393. [Google Scholar] [CrossRef]
- Verneau, F.; Caracciolo, F.; Coppola, A.; Lombardi, P. Consumer fears and familiarity of processed food. The value of information provided by the FTNS. Appetite 2014, 73, 140–146. [Google Scholar] [CrossRef] [PubMed]
- Dekhili, S.; Sirieix, L.; Cohen, E. How consumers choose olive oil: The importance of origin cues. Food Qual. Prefer. 2011, 22, 757–762. [Google Scholar] [CrossRef]
- Newman, C.L.; Turri, A.M.; Howlett, E.; Stokes, A. Twenty years of country of origin food labeling research: A review of the literature and implications for food marketing systems. J. Macromark. 2014, 34, 505–519. [Google Scholar] [CrossRef]
- Thøgersen, J.; Pedersen, S.; Paternoga, M.; Schwendel, E.; Aschemann-Witzel, J. How important is country-of-origin for organic food consumers? A review of the literature and suggestions for future research. Br. Food J. 2017, 119, 542–557. [Google Scholar] [CrossRef]
- Kwak, H.S.; Jung, H.Y.; Kim, M.J.; Kim, S.S. Differences in consumer perception of Korean traditional soybean paste (Doenjang) between younger and older consumers by blind and informed tests. J. Sens. Stud. 2017, 32, 1–10. [Google Scholar] [CrossRef]
- Van Loo, E.J.; Hoefkens, C.; Verbeke, W. Healthy, sustainable and plant-based eating: Perceived (mis)match and involvement-based consumer segments as targets for future policy. Food Policy 2017, 69, 46–57. [Google Scholar] [CrossRef]
- Arancon, R.A.D.; Lin, C.S.K.; Chan, K.M.; Kwan, T.H.; Luque, R. Advances on waste valorization: New horizons for a more sustainable society. Energy Sci. Eng. 2013, 1, 53–71. [Google Scholar] [CrossRef]
- Romero-García, J.M.; Niño, L.; Martínez-Patiño, C.; Álvarez, C.; Castro, E.; Negro, M.J. Biorefinery based on olive biomass. State of the art and future trends. Bioresour. Technol. 2014, 159, 421–432. [Google Scholar] [CrossRef]
- Aertsens, J.; Mondelaers, K.; Verbeke, W.; Buysse, J.; Van Huylenbroeck, G. The influence of subjective and objective knowledge on attitude, motivations and consumption of organic food. Br. Food J. 2011, 113, 1353–1378. [Google Scholar] [CrossRef]
- Harper, G.C.; Makatouni, A. Consumer perception of organic food production and farm animal welfare. Br. Food J. 2002, 104, 287–299. [Google Scholar] [CrossRef]
- Padel, S.; Foster, C. Exploring the gap between attitudes and behaviour: Understanding why consumers buy or do not buy organic food. Br. Food J. 2005, 107, 606–625. [Google Scholar] [CrossRef] [Green Version]
- Willer, H.; Lernoud, J. The World of Organic Agriculture. Statistics and Emerging Trends 2017; Research Institute of Organic Agriculture (FiBL), Frick, and IFOAM—Organics International: Bonn, Germany, 2017. [Google Scholar]
- Thøgersen, J.; Pedersen, S.; Aschemann-Witzel, J. The impact of organic certification and country of origin on consumer food choice in developed and emerging economies. Food Qual. Prefer. 2019, 72, 10–30. [Google Scholar] [CrossRef]
- Vega-Zamora, M.; Naspetti, S.; Zanoli, R. Principales motivaciones del consumidor de alimentos ecológicos en italia. El caso del aceite de oliva. Agrociencia 2020, 54, 327–336. [Google Scholar]
- Palmieri, N.; Perito, M.A. Consumers’ willingness to consume sustainable and local wine in Italy. Ital. J. Food Sci. 2020, 32, 222–233. [Google Scholar] [CrossRef]
- Nitzko, S.; Spiller, A. Comparing “Leaf-to-Root”, “Nose-to-Tail” and Other Efficient Food Utilization Options from a Consumer Perspective. Sustainability 2019, 11, 4779. [Google Scholar] [CrossRef] [Green Version]


| Questionnaire | Label Variable | Scale | Mean | ||||
|---|---|---|---|---|---|---|---|
| Gender | GEN | Male | Female | ||||
| 35.33 | 64.67 | ||||||
| Age | AGE | 37.56 | |||||
| Education | EDU | Elemen. | Middle | High S. | College | ||
| 0.35 | 2.35 | 37.09 | 60.21 | ||||
| Employment | EMPL | Worker | Unempl. | Student | Homem. | Retired | |
| 59.04 | 5.87 | 28.29 | 2.70 | 4.11 | |||
| Frequency of the purchase of organic food | ORGANIC | 5-point scale | Never | Seldom | Somet. | Often | Always |
| 46.48 | 23.59 | 5.99 | 14.44 | 9.51 | |||
| Is food Origin (e.g., local/typical product) important when shopping for food? | ORIGIN | 5-point scale | Abs. Not | Not | Indiff. | Yes | Abs. Yes |
| 2.46 | 3.76 | 7.28 | 38.97 | 47.53 | |||
| There is no need for new food technologies because there are so many types of foods. | NNNT | 5-point scale | Abs. Disag. | Disagr. | Indiff. | Agree | Abs. Agree |
| 39.20 | 35.68 | 10.09 | 10.68 | 4.34 | |||
| The benefits associated with innovative food technologies are often overestimated | NTOR | 5-point scale | Abs. Disag. | Disagr. | Indiff. | Agree | Abs. Agree |
| 18.31 | 35.56 | 18.19 | 20.07 | 7.86 | |||
| New food technologies reduce the natural quality of foods | NTLQ | 5-point scale | Abs. Disag. | Disagr. | Indiff. | Agree | Abs. Agree |
| 23.83 | 36.97 | 15.96 | 15.61 | 7.63 | |||
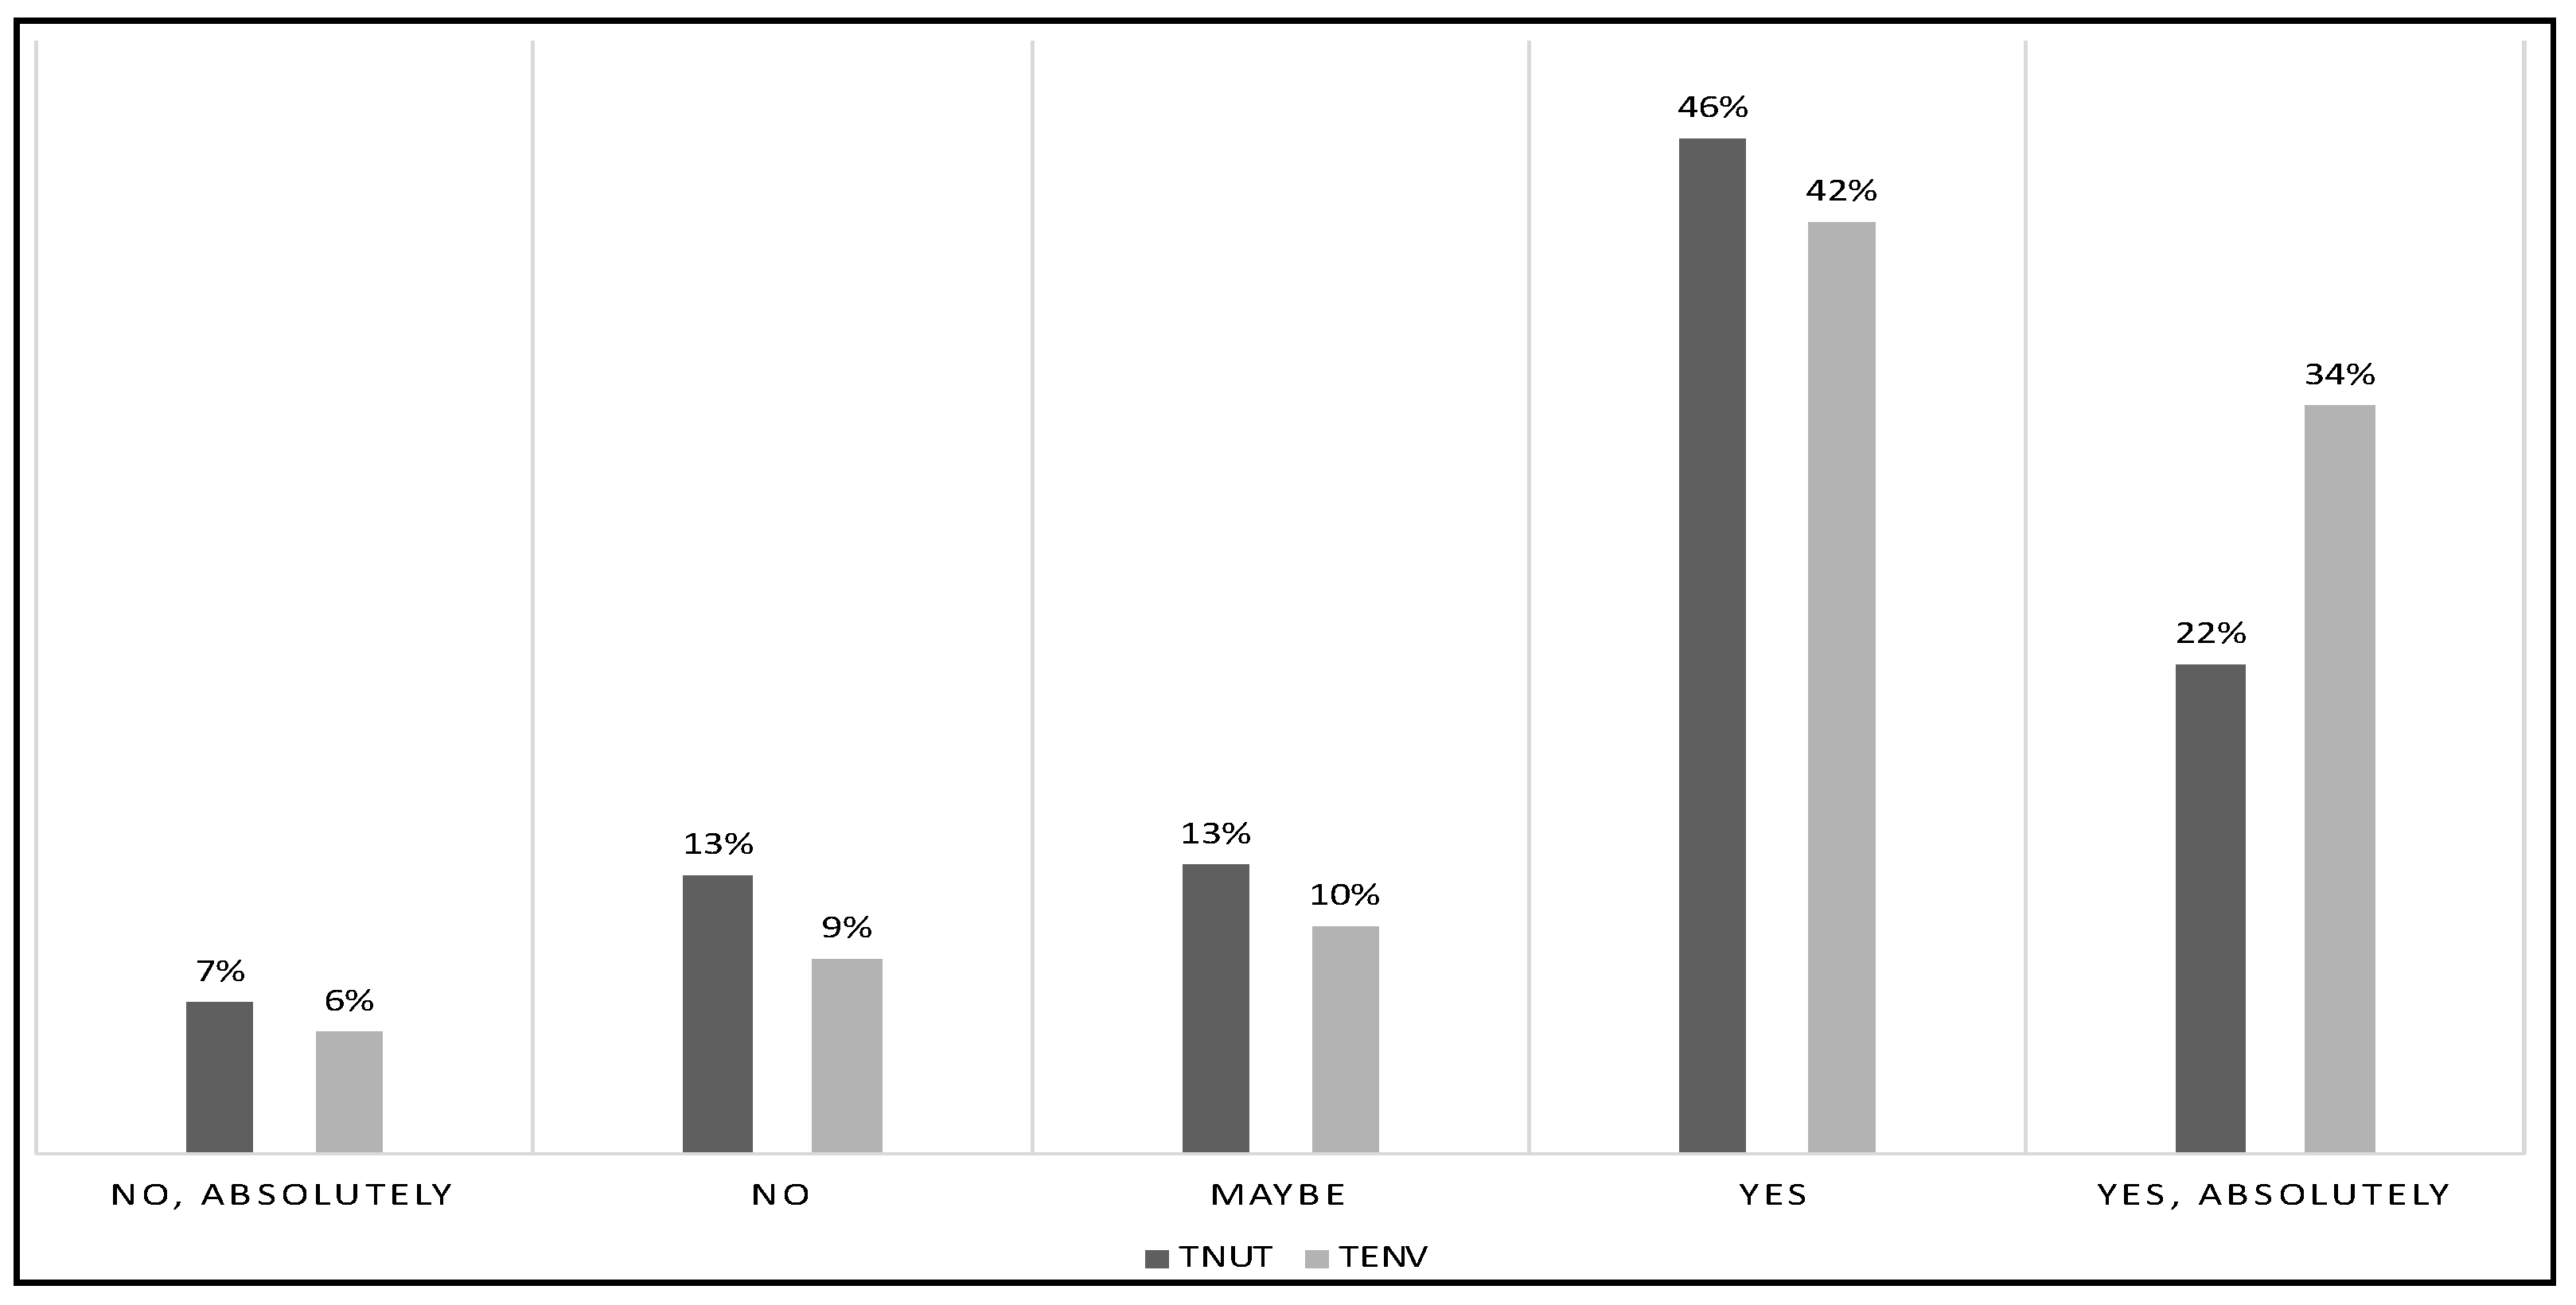
| I am willing to try food with upcycled ingredients of olive leaves if: | |||||||
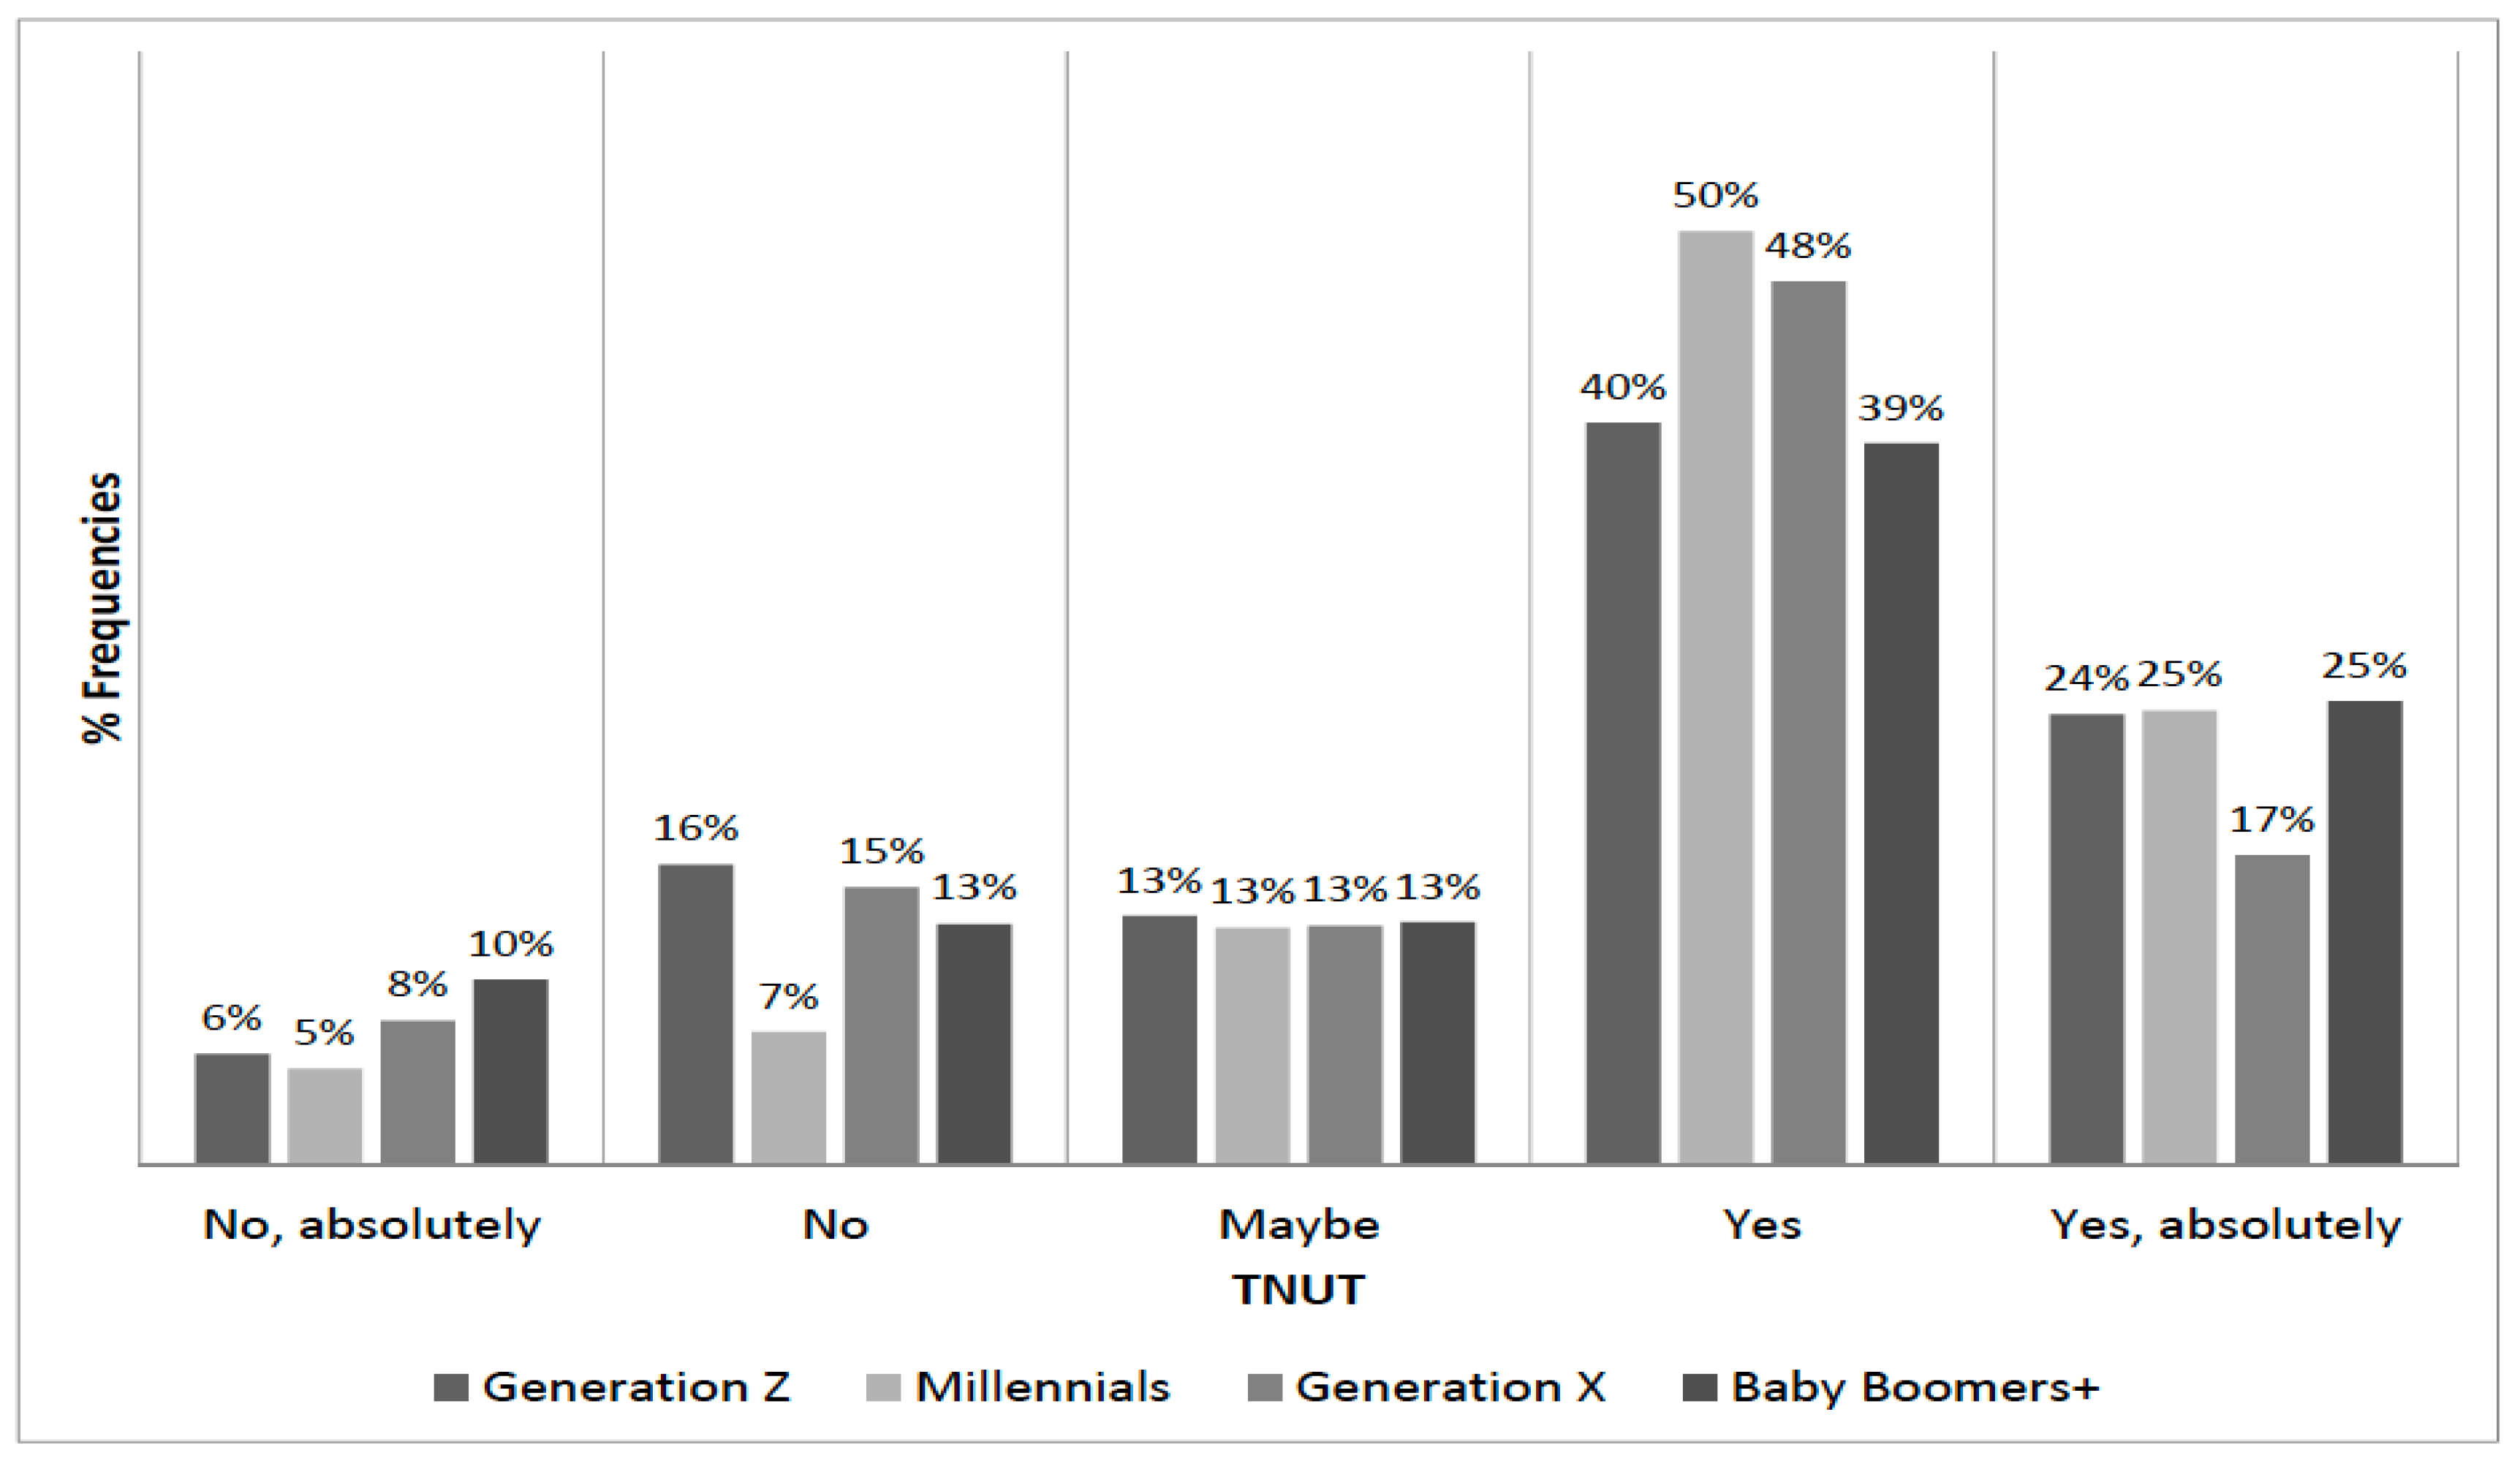
| it has superior nutritional properties | TNUT | 5-point scale | Abs. Not | Not | Indiff. | Yes | Abs. Yes |
| 6.81 | 12.56 | 13.03 | 45.66 | 21.95 | |||
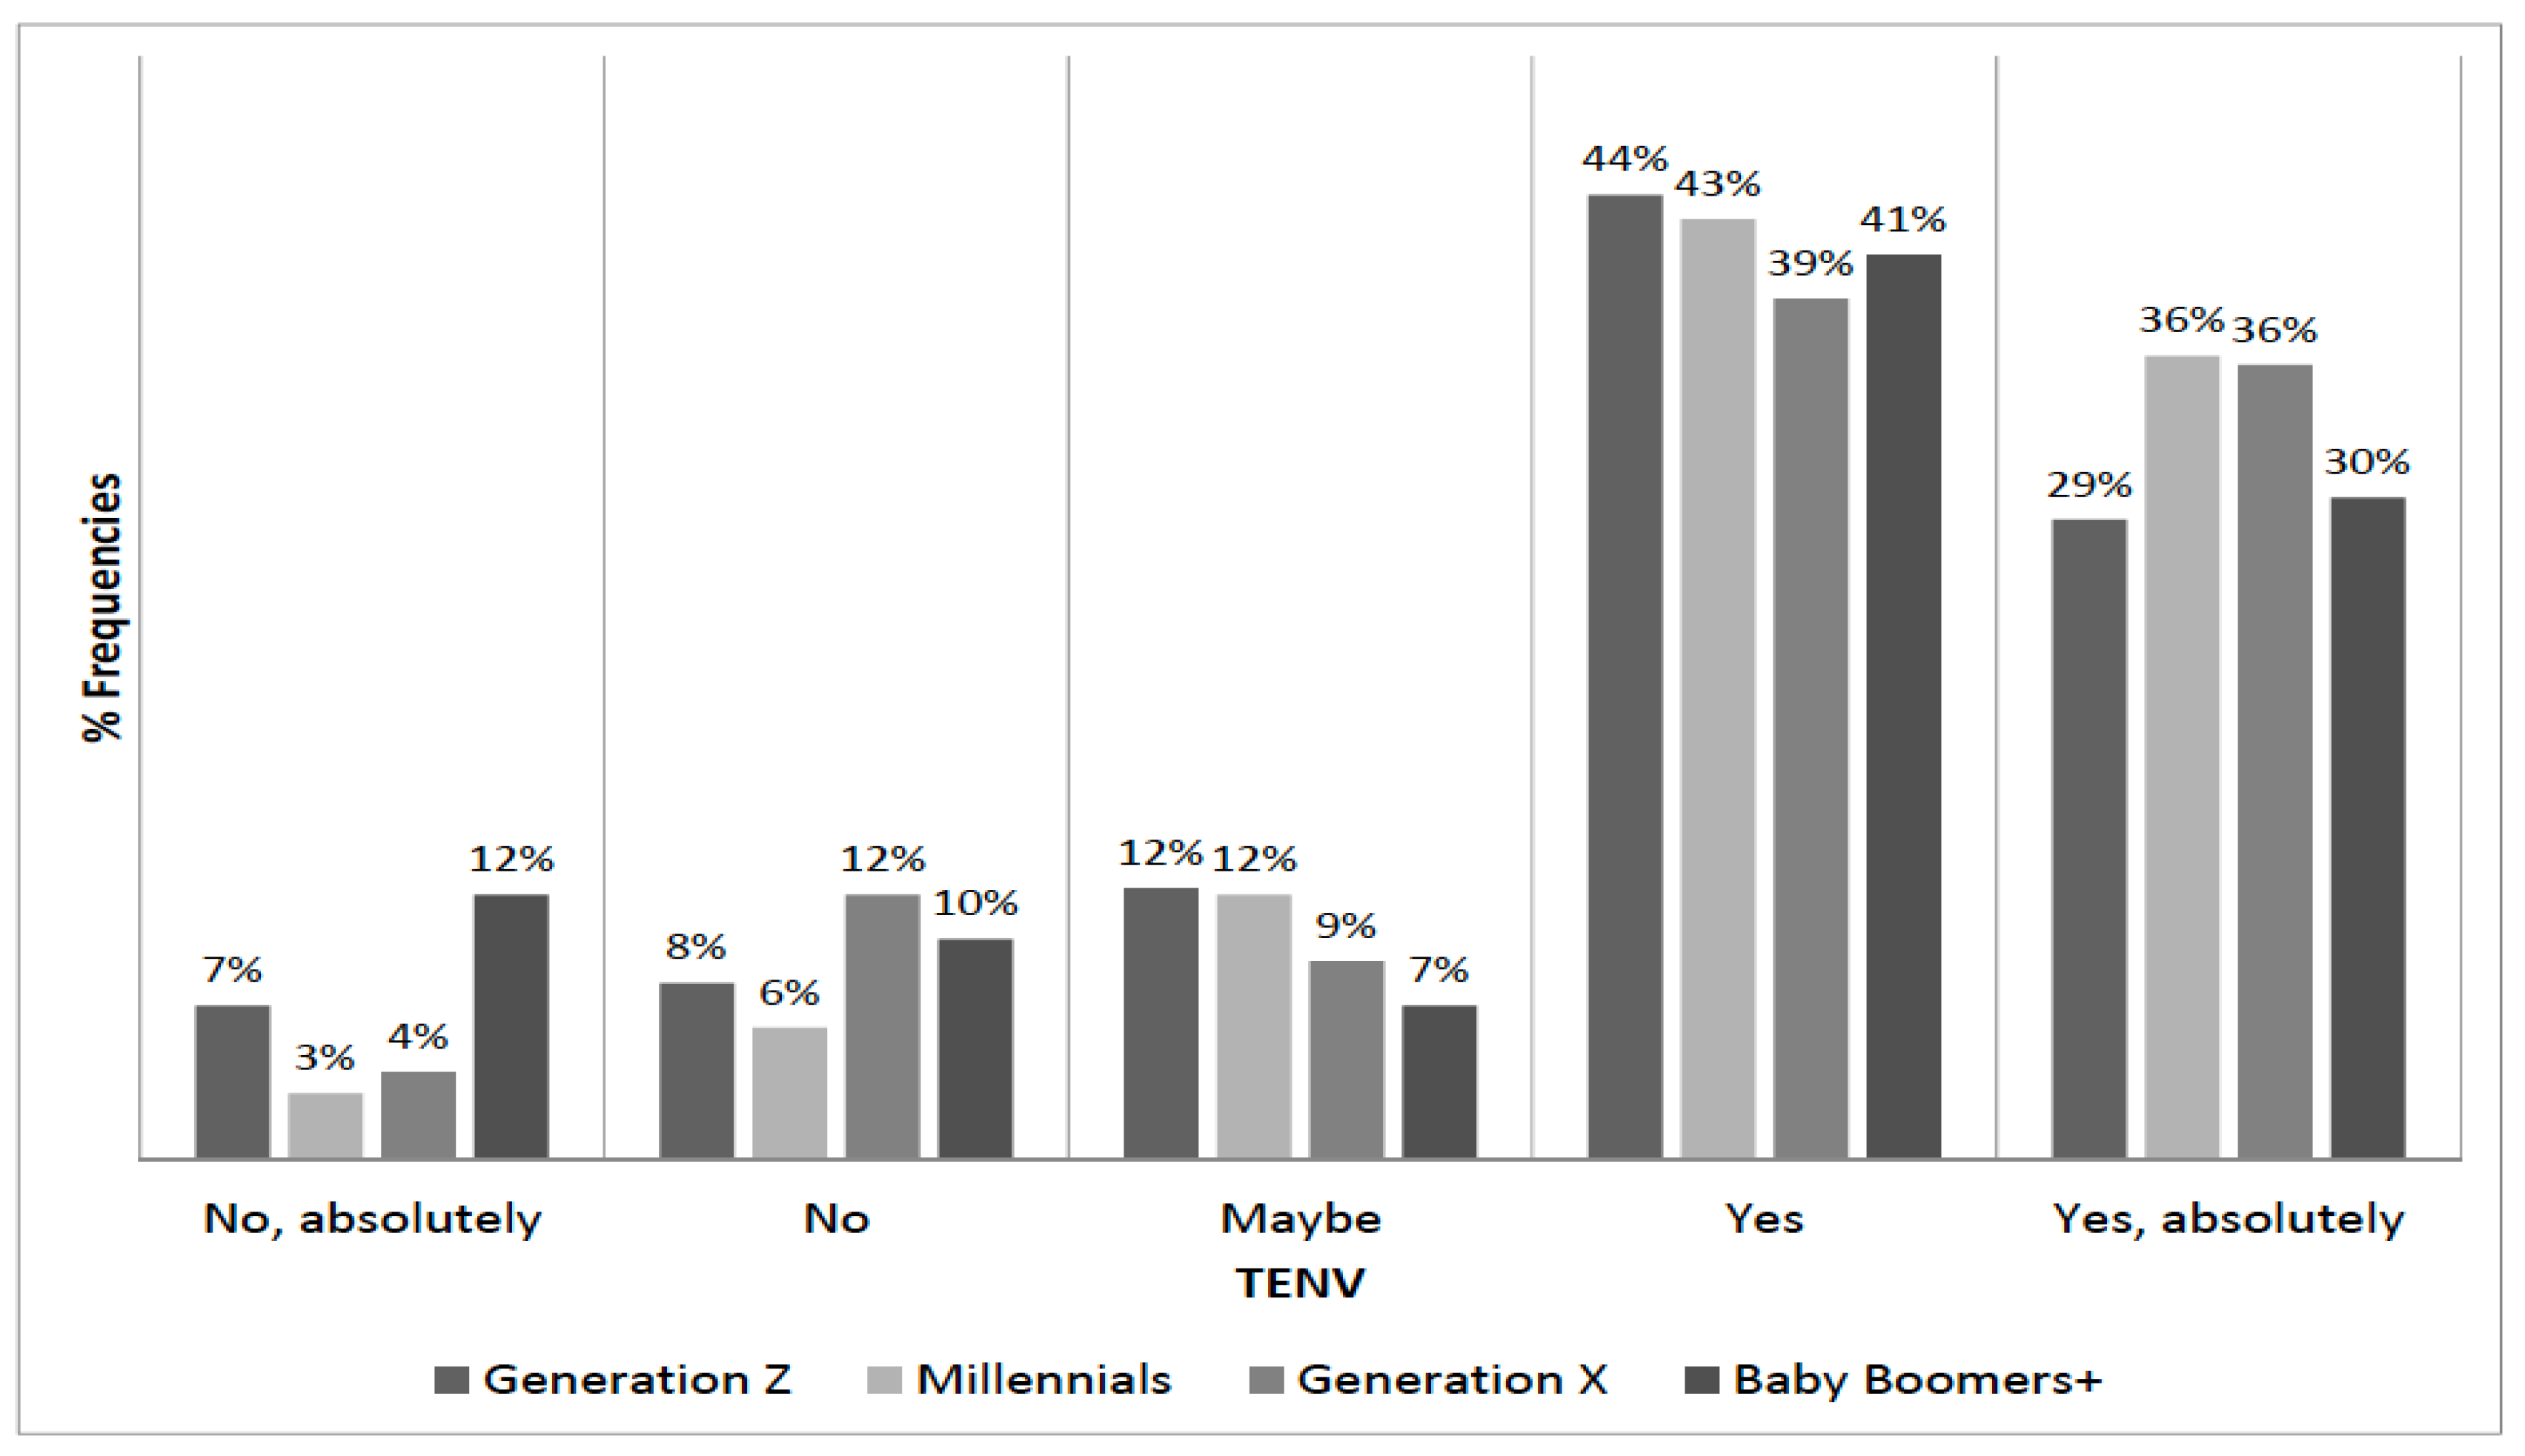
| it reduces the environmental impact of food production and consumption | TENV | 5-point scale | Abs. Not | Not | Indiff. | Yes | Abs. Yes |
| 5.52 | 8.80 | 10.21 | 33.57 | 41.90 | |||
| Education | % Freq. | Employment Status | % Freq. | Gender | % Freq. | Age | % Freq. |
|---|---|---|---|---|---|---|---|
| Elementary school | 0.35 | Worker | 59.04 | Male | 35.33 | Generat. Z (18–24) | 25.23 |
| Middle School | 2.35 | Unemployed | 5.87 | Female | 64.67 | Millennials (25–39) | 31.34 |
| High School | 37.09 | Student | 28.29 | Generat. X (40–54) | 30.99 | ||
| College | 60.21 | Homemaker | 2.70 | Elder Gen. (55+) | 12.44 | ||
| Retired | 4.11 | ||||||
| Total | 100.00 | Total | 100.00 | Total | 100.00 | Total | 100.00 |
| BUYBIO | ORIGIN | NNNT | NTOR | NTQL | ||||||||
|---|---|---|---|---|---|---|---|---|---|---|---|---|
| Scale | N | % | Scale | N | % | Scale | N | % | N | % | N | % |
| Never | 396 | 46.5 | Absol. not important | 21 | 2.5 | Strongly disagree | 334 | 39.2 | 156 | 18.3 | 203 | 23.8 |
| Seldom | 201 | 23.6 | Not important | 32 | 3.8 | Disagree | 304 | 35.7 | 303 | 35.6 | 315 | 37.0 |
| Sometimes | 51 | 6.0 | Indifferent | 62 | 7.3 | Not agree nor disagree | 86 | 10.1 | 155 | 18.2 | 136 | 16.0 |
| Often | 123 | 14.4 | Important | 332 | 39.0 | Agree | 91 | 10.7 | 171 | 20.1 | 133 | 15.6 |
| Always | 81 | 9.5 | Very important | 405 | 47.5 | Strongly agree | 37 | 4.3 | 67 | 7.9 | 65 | 7.6 |
| Total | 852 | 100.0 | Total | 852 | 100.0 | Total | 852 | 100.0 | 852 | 100.0 | 852 | 100.0 |
| TENV | |||||
|---|---|---|---|---|---|
| TNUT | No, absol. | No | Maybe | Yes | Yes, absol. |
| No, absolutely | 17.8 | 0.8 | −2.0 | −3.1 | −3.1 |
| No | 0.5 | 12.9 | −0.3 | −3.0 | −3.3 |
| Maybe | −1.3 | −0.6 | 6.1 | −0.5 | −2.0 |
| Yes | −4.4 | −4.1 | −0.7 | 6.1 | −2.5 |
| Yes, absolutely | −2.9 | −3.8 | −2.3 | −4.4 | 9.4 |
| TNUT | TENV | ||||||
|---|---|---|---|---|---|---|---|
| Coeff | Std. Error | p-Value | Coeff | Std. Error | p-Value | ||
| Demography | 0.971 | 0.437 | |||||
| Female respondent | Genb | −0.012 | 0.076 | 0.872 | −0.035 | 0.080 | 0.658 |
| Age of respondent | Age | 0.009 | 0.029 | 0.750 | 0.041 | 0.027 | 0.130 |
| Age squared | age2 | 0.000 | 0.000 | 0.796 | 0.000 | 0.000 | 0.164 |
| Education | 0.098 | 0.857 | |||||
| Elementary school | |||||||
| Middle school | ed2 | −0.816 | 0.612 | 0.183 | 0.106 | 0.396 | 0.789 |
| High school | ed3 | −1.081 | 0.590 | 0.067 | 0.188 | 0.370 | 0.611 |
| College | ed4 | −0.915 | 0.588 | 0.120 | 0.231 | 0.365 | 0.526 |
| Working status | 0.167 | 0.358 | |||||
| Worker | |||||||
| Unemployed | w2 | 0.135 | 0.174 | 0.439 | 0.031 | 0.182 | 0.867 |
| Student | w3 | 0.224 | 0.167 | 0.180 | 0.216 | 0.177 | 0.221 |
| Homemaker | w4 | 0.582 | 0.275 | 0.034 | 0.436 | 0.262 | 0.096 |
| Retired | w5 | −0.006 | 0.298 | 0.983 | −0.031 | 0.264 | 0.906 |
| Organic | 0.145 | 0.000 | |||||
| Never | |||||||
| Seldom | bb2 | −0.209 | 0.098 | 0.033 | −0.218 | 0.099 | 0.028 |
| Sometimes | bb3 | 0.132 | 0.169 | 0.436 | 0.583 | 0.147 | 0.000 |
| Often | bb4 | −0.105 | 0.104 | 0.314 | 0.504 | 0.120 | 0.000 |
| Always | bb5 | 0.024 | 0.140 | 0.866 | 0.817 | 0.160 | 0.000 |
| Origin | 0.006 | 0.000 | |||||
| Absol. not important | |||||||
| Not important | bo2 | 0.177 | 0.368 | 0.631 | 0.116 | 0.365 | 0.751 |
| Indifferent | bo3 | 0.559 | 0.323 | 0.084 | 0.460 | 0.328 | 0.161 |
| Important | bo4 | 0.725 | 0.310 | 0.019 | 0.812 | 0.315 | 0.010 |
| Very important | bo5 | 0.769 | 0.310 | 0.013 | 0.897 | 0.317 | 0.005 |
| Technophobia | TFI | −0.368 | 0.046 | 0.000 | −0.301 | 0.045 | 0.000 |
| Observations | 852 | 852 | |||||
| Pseudo R2 | 0.052 | 0.076 | |||||
| Wald chi2 | 115.38 | 0.000 | 152.01 | 0.000 | |||
| TNUT | TENV | ||||||||||
|---|---|---|---|---|---|---|---|---|---|---|---|
| Variables | TNUT = 1 | TNUT = 2 | TNUT = 3 | TNUT = 4 | TNUT = 5 | TENV = 1 | TENV = 2 | TENV = 3 | TENV = 4 | TENV = 5 | |
| Female respondent | 0.001 | 0.002 | 0.001 | −0.001 | −0.003 | 0.003 | 0.004 | 0.004 | 0.002 | −0.013 | |
| Demography | Age of respondent | −0.001 | −0.001 | −0.001 | 0.001 | 0.003 | −0.003 | −0.005 | −0.004 | −0.002 | 0.015 |
| Age squared | 0.000 | 0.000 | 0.000 | 0.000 | 0.000 | 0.000 | 0.000 | 0.000 | 0.000 | 0.000 | |
| Elementary school | |||||||||||
| Middle school * | 0.153 | 0.122 | 0.041 | −0.160 | −0.155 | −0.007 | −0.012 | −0.011 | −0.008 | 0.039 | |
| Educational | High school * | 0.150 | 0.158 | 0.082 | −0.123 | −0.266 | −0.014 | −0.022 | −0.020 | −0.013 | 0.067 |
| College * | 0.088 | 0.126 | 0.087 | −0.029 | −0.272 | −0.018 | −0.027 | −0.024 | −0.011 | 0.081 | |
| Worker | |||||||||||
| Unemployed * | −0.013 | −0.020 | −0.014 | 0.007 | 0.040 | −0.002 | −0.004 | −0.003 | −0.002 | 0.011 | |
| Employment | Student * | −0.022 | −0.033 | −0.022 | 0.012 | 0.065 | −0.015 | −0.024 | −0.023 | −0.016 | 0.078 |
| Homemaker * | −0.039 | −0.072 | −0.061 | −0.024 | 0.196 | −0.023 | −0.042 | −0.044 | −0.058 | 0.166 | |
| Retired * | 0.001 | 0.001 | 0.001 | 0.000 | −0.002 | 0.002 | 0.004 | 0.003 | 0.002 | −0.011 | |
| Never | |||||||||||
| Seldom * | 0.024 | 0.032 | 0.019 | −0.020 | −0.056 | 0.018 | 0.027 | 0.022 | 0.008 | −0.075 | |
| Organic | Sometimes * | −0.013 | −0.019 | −0.013 | 0.007 | 0.039 | −0.028 | −0.053 | −0.057 | −0.086 | 0.224 |
| Often * | 0.012 | 0.016 | 0.010 | −0.009 | −0.028 | −0.028 | −0.050 | −0.051 | −0.062 | 0.190 | |
| Always * | −0.002 | −0.004 | −0.002 | 0.002 | 0.007 | −0.035 | −0.068 | −0.076 | −0.135 | 0.314 | |
| Absol. not important | |||||||||||
| Origin | Not important * | −0.016 | −0.026 | −0.018 | 0.007 | 0.053 | −0.008 | −0.013 | −0.012 | −0.009 | 0.042 |
| Indifferent * | −0.040 | −0.072 | −0.058 | −0.015 | 0.185 | −0.025 | −0.045 | −0.046 | −0.060 | 0.175 | |
| Important * | −0.070 | −0.102 | −0.070 | 0.028 | 0.215 | −0.056 | −0.087 | −0.080 | −0.070 | 0.293 | |
| Very important * | −0.082 | −0.111 | −0.072 | 0.048 | 0.217 | −0.070 | −0.101 | −0.088 | −0.055 | 0.314 | |
| TFI | 0.039 | 0.055 | 0.036 | −0.027 | −0.103 | 0.023 | 0.035 | 0.031 | 0.017 | −0.107 |
| Generation Z (n= 215) | Millennials (n= 267) | Generation X (n= 264) | Baby Boomers+ (n= 106) | ||||||
|---|---|---|---|---|---|---|---|---|---|
| Coeff | p-Val | Coeff | p-Val | Coeff | p-Val | Coeff | p-Val | ||
| Demography | 0.015 | 0.661 | 0.651 | 0.316 | |||||
| Female respondent | Genb | −0.185 | 0.221 | 0.162 | 0.262 | 0.140 | 0.319 | −0.085 | 0.724 |
| Age of respondent | Age | −2.182 | 0.109 | 0.089 | 0.753 | −0.341 | 0.359 | 0.507 | 0.075 |
| Age squared | age2 | 0.053 | 0.088 | −0.001 | 0.732 | 0.004 | 0.362 | −0.004 | 0.071 |
| Education | 0.679 | 0.591 | 0.186 | 0.183 | |||||
| Elementary school | |||||||||
| Middle school | ed2 | −0.056 | 0.960 | 0.786 | 0.229 | −1.507 | 0.033 | ||
| High school | ed3 | −0.171 | 0.383 | −0.017 | 0.955 | −0.775 | 0.071 | −1.462 | 0.046 |
| College | ed4 | −0.030 | 0.918 | −0.682 | 0.123 | −1.496 | 0.034 | ||
| Working status | 0.015 | 0.560 | 0.000 | 0.626 | |||||
| Worker | |||||||||
| Unemployed | w2 | −0.151 | 0.820 | 0.191 | 0.414 | 0.186 | 0.633 | −0.737 | 0.429 |
| Student | w3 | 0.571 | 0.351 | 0.318 | 0.253 | 8.978 | 0.000 | ||
| Homemaker | w4 | −0.309 | 0.599 | 0.817 | 0.014 | 0.511 | 0.531 | ||
| Retired | w5 | −0.278 | 0.424 | ||||||
| Organic | 0.300 | 0.148 | 0.064 | 0.493 | |||||
| Never | |||||||||
| Seldom | bb2 | −0.130 | 0.497 | −0.370 | 0.024 | −0.446 | 0.022 | 0.288 | 0.295 |
| Sometimes | bb3 | 0.444 | 0.101 | −0.147 | 0.676 | 0.127 | 0.639 | 0.111 | 0.881 |
| Often | bb4 | 0.163 | 0.468 | −0.128 | 0.539 | −0.301 | 0.106 | 0.077 | 0.824 |
| Always | bb5 | 0.209 | 0.437 | −0.537 | 0.093 | 0.062 | 0.791 | 0.512 | 0.115 |
| Origin | 0.874 | 0.441 | 0.000 | 0.115 | |||||
| Absol. not important | |||||||||
| Not important | bo2 | 0.024 | 0.979 | 0.876 | 0.231 | −0.601 | 0.207 | 0.129 | 0.932 |
| Indifferent | bo3 | −0.230 | 0.760 | 1.225 | 0.081 | 0.501 | 0.214 | 0.717 | 0.616 |
| Important | bo4 | −0.117 | 0.875 | 1.170 | 0.087 | 0.592 | 0.123 | 1.265 | 0.375 |
| Very important | bo5 | −0.288 | 0.698 | 1.110 | 0.109 | 0.870 | 0.027 | 1.327 | 0.337 |
| Technophobia | TFI | −0.457 | 0.000 | −0.525 | 0.000 | −0.255 | 0.002 | −0.337 | 0.002 |
| R2 | 0.072 | 0.100 | 0.075 | 0.094 | |||||
| Generation Z | Millennials | Generation X | Baby Boomers+ | ||||||
|---|---|---|---|---|---|---|---|---|---|
| Coeff | p-Val | Coeff | p-Val | Coeff | p-Val | Coeff | p-Val | ||
| Demography | 0.852 | 0.624 | 0.570 | 0.425 | |||||
| Female respondent | Genb | 0.013 | 0.938 | 0.005 | 0.976 | −0.041 | 0.802 | −0.082 | 0.738 |
| Age of respondent | Age | −0.760 | 0.585 | −0.360 | 0.194 | −0.162 | 0.694 | 0.032 | 0.912 |
| Age squared | age2 | 0.019 | 0.564 | 0.005 | 0.199 | 0.002 | 0.657 | −0.001 | 0.795 |
| Education | 0.084 | 0.001 | 0.658 | 0.167 | |||||
| Elementary school | (omitted) | ||||||||
| Middle school | ed2 | −0.844 | 0.038 | 1.266 | 0.192 | −0.277 | 0.598 | ||
| High school | ed3 | −0.403 | 0.068 | 0.988 | 0.001 | −0.251 | 0.608 | 0.135 | 0.809 |
| College | ed4 | 1.151 | 0.000 | −0.369 | 0.461 | −0.473 | 0.353 | ||
| Working status | 0.007 | 0.436 | 0.000 | 0.500 | |||||
| Worker | |||||||||
| Unemployed | w2 | 0.948 | 0.177 | −0.178 | 0.406 | 0.379 | 0.376 | −0.931 | 0.330 |
| Student | w3 | 1.265 | 0.002 | 0.218 | 0.442 | 8.193 | 0.000 | ||
| Homemaker | w4 | −0.529 | 0.239 | 0.827 | 0.012 | 1.177 | 0.297 | ||
| Retired | w5 | 0.081 | 0.816 | ||||||
| Organic | 0.004 | 0.013 | 0.000 | 0.023 | |||||
| Never | |||||||||
| Seldom | bb2 | −0.133 | 0.479 | −0.320 | 0.082 | −0.617 | 0.001 | 0.097 | 0.725 |
| Sometimes | bb3 | 0.635 | 0.046 | 0.798 | 0.018 | 0.342 | 0.086 | 0.907 | 0.101 |
| Often | bb4 | 0.602 | 0.007 | 0.261 | 0.240 | 0.564 | 0.025 | 1.560 | 0.001 |
| Always | bb5 | 0.596 | 0.070 | 0.217 | 0.412 | 1.831 | 0.000 | 0.466 | 0.330 |
| Origin | 0.057 | 0.450 | 0.000 | 0.000 | |||||
| Absol. not important | |||||||||
| Not important | bo2 | 1.241 | 0.029 | 1.206 | 0.203 | −1.585 | 0.004 | 0.706 | 0.486 |
| Indifferent | bo3 | 0.855 | 0.024 | 1.381 | 0.140 | −0.754 | 0.101 | 1.337 | 0.188 |
| Important | bo4 | 1.064 | 0.004 | 1.512 | 0.096 | −0.174 | 0.685 | 2.282 | 0.030 |
| Very important | bo5 | 1.016 | 0.006 | 1.536 | 0.093 | 0.059 | 0.891 | 2.321 | 0.020 |
| Technophobia | TFI | −0.366 | 0.000 | −0.313 | 0.000 | −0.274 | 0.001 | −0.461 | 0.000 |
| R2 | 0.082 | 0.077 | 0.161 | 0.179 | |||||
| > | Full Sample | Generation Z | Millennials | Generation X | Baby Boomers+ | |||||
|---|---|---|---|---|---|---|---|---|---|---|
| Var. Group | TNUT | TENV | TNUT | TENV | TNUT | TENV | TNUT | TENV | TNUT | TENV |
| Demography | ✗ | ✗ | ✓✓ | ✗ | ✗ | ✗ | ✗ | ✗ | ✗ | ✗ |
| Education | ✗ | ✗ | ✗ | ✓ | ✗ | ✓✓ | ✗ | ✗ | ✗ | ✗ |
| Emp. Status | ✗ | ✗ | ✓✓ | ✓✓ | ✗ | ✗ | ✓✓ | ✓✓ | ✗ | ✗ |
| Organic | ✗ | ✓✓ | ✗ | ✓✓ | ✗ | ✓✓ | ✓ | ✓✓ | ✗ | ✓✓ |
| Origin | ✓✓ | ✓✓ | ✗ | ✓ | ✗ | ✗ | ✓✓ | ✓✓ | ✗ | ✓✓ |
| Technophobia | ✓✓ | ✓✓ | ✓✓ | ✓✓ | ✓✓ | ✓✓ | ✓✓ | ✓✓ | ✓✓ | ✓✓ |
© 2020 by the authors. Licensee MDPI, Basel, Switzerland. This article is an open access article distributed under the terms and conditions of the Creative Commons Attribution (CC BY) license (http://creativecommons.org/licenses/by/4.0/).
Share and Cite
Perito, M.A.; Coderoni, S.; Russo, C. Consumer Attitudes towards Local and Organic Food with Upcycled Ingredients: An Italian Case Study for Olive Leaves. Foods 2020, 9, 1325. https://doi.org/10.3390/foods9091325
Perito MA, Coderoni S, Russo C. Consumer Attitudes towards Local and Organic Food with Upcycled Ingredients: An Italian Case Study for Olive Leaves. Foods. 2020; 9(9):1325. https://doi.org/10.3390/foods9091325
Chicago/Turabian StylePerito, Maria Angela, Silvia Coderoni, and Carlo Russo. 2020. "Consumer Attitudes towards Local and Organic Food with Upcycled Ingredients: An Italian Case Study for Olive Leaves" Foods 9, no. 9: 1325. https://doi.org/10.3390/foods9091325