


Impacts of Brazilian Green Coffee Production and Its Logistical Corridors on the International Coffee Market


 ,
,
Abstract
1. Introduction
2. Background
3. Materials and Methods
3.1. Data Collection and Treatments
3.2. Data Analysis
4. Results and Discussion
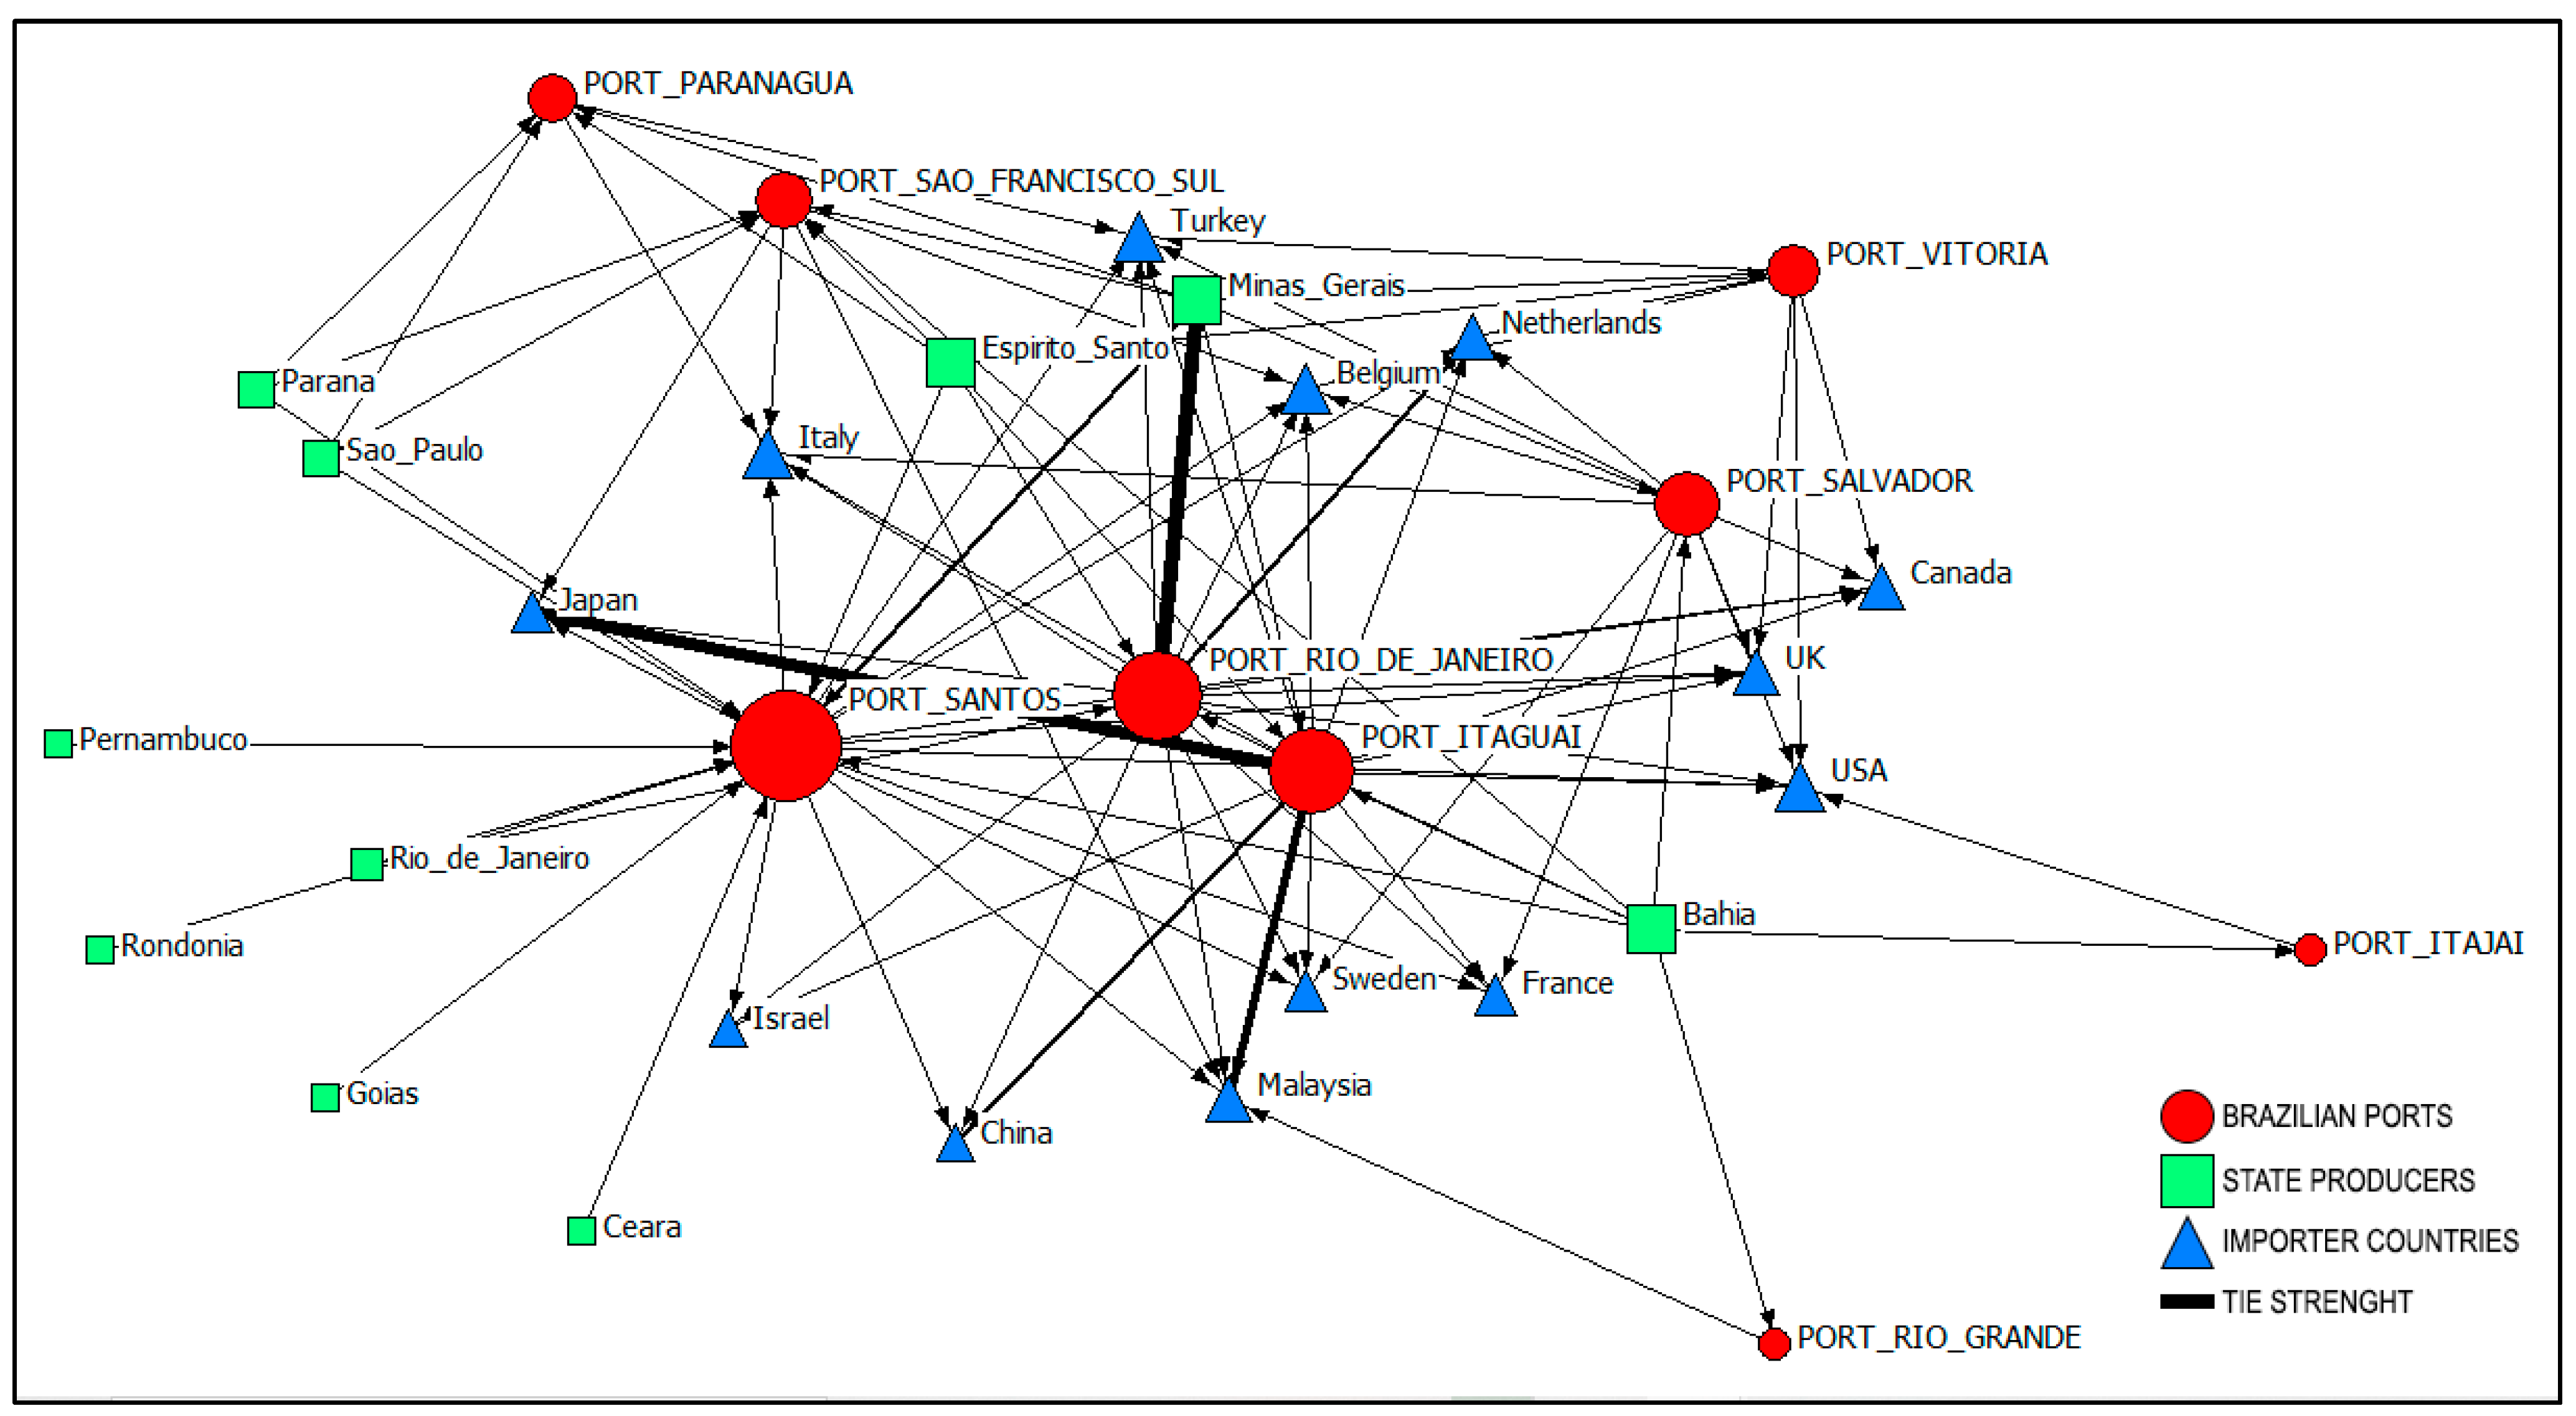
4.1. Main Analysis
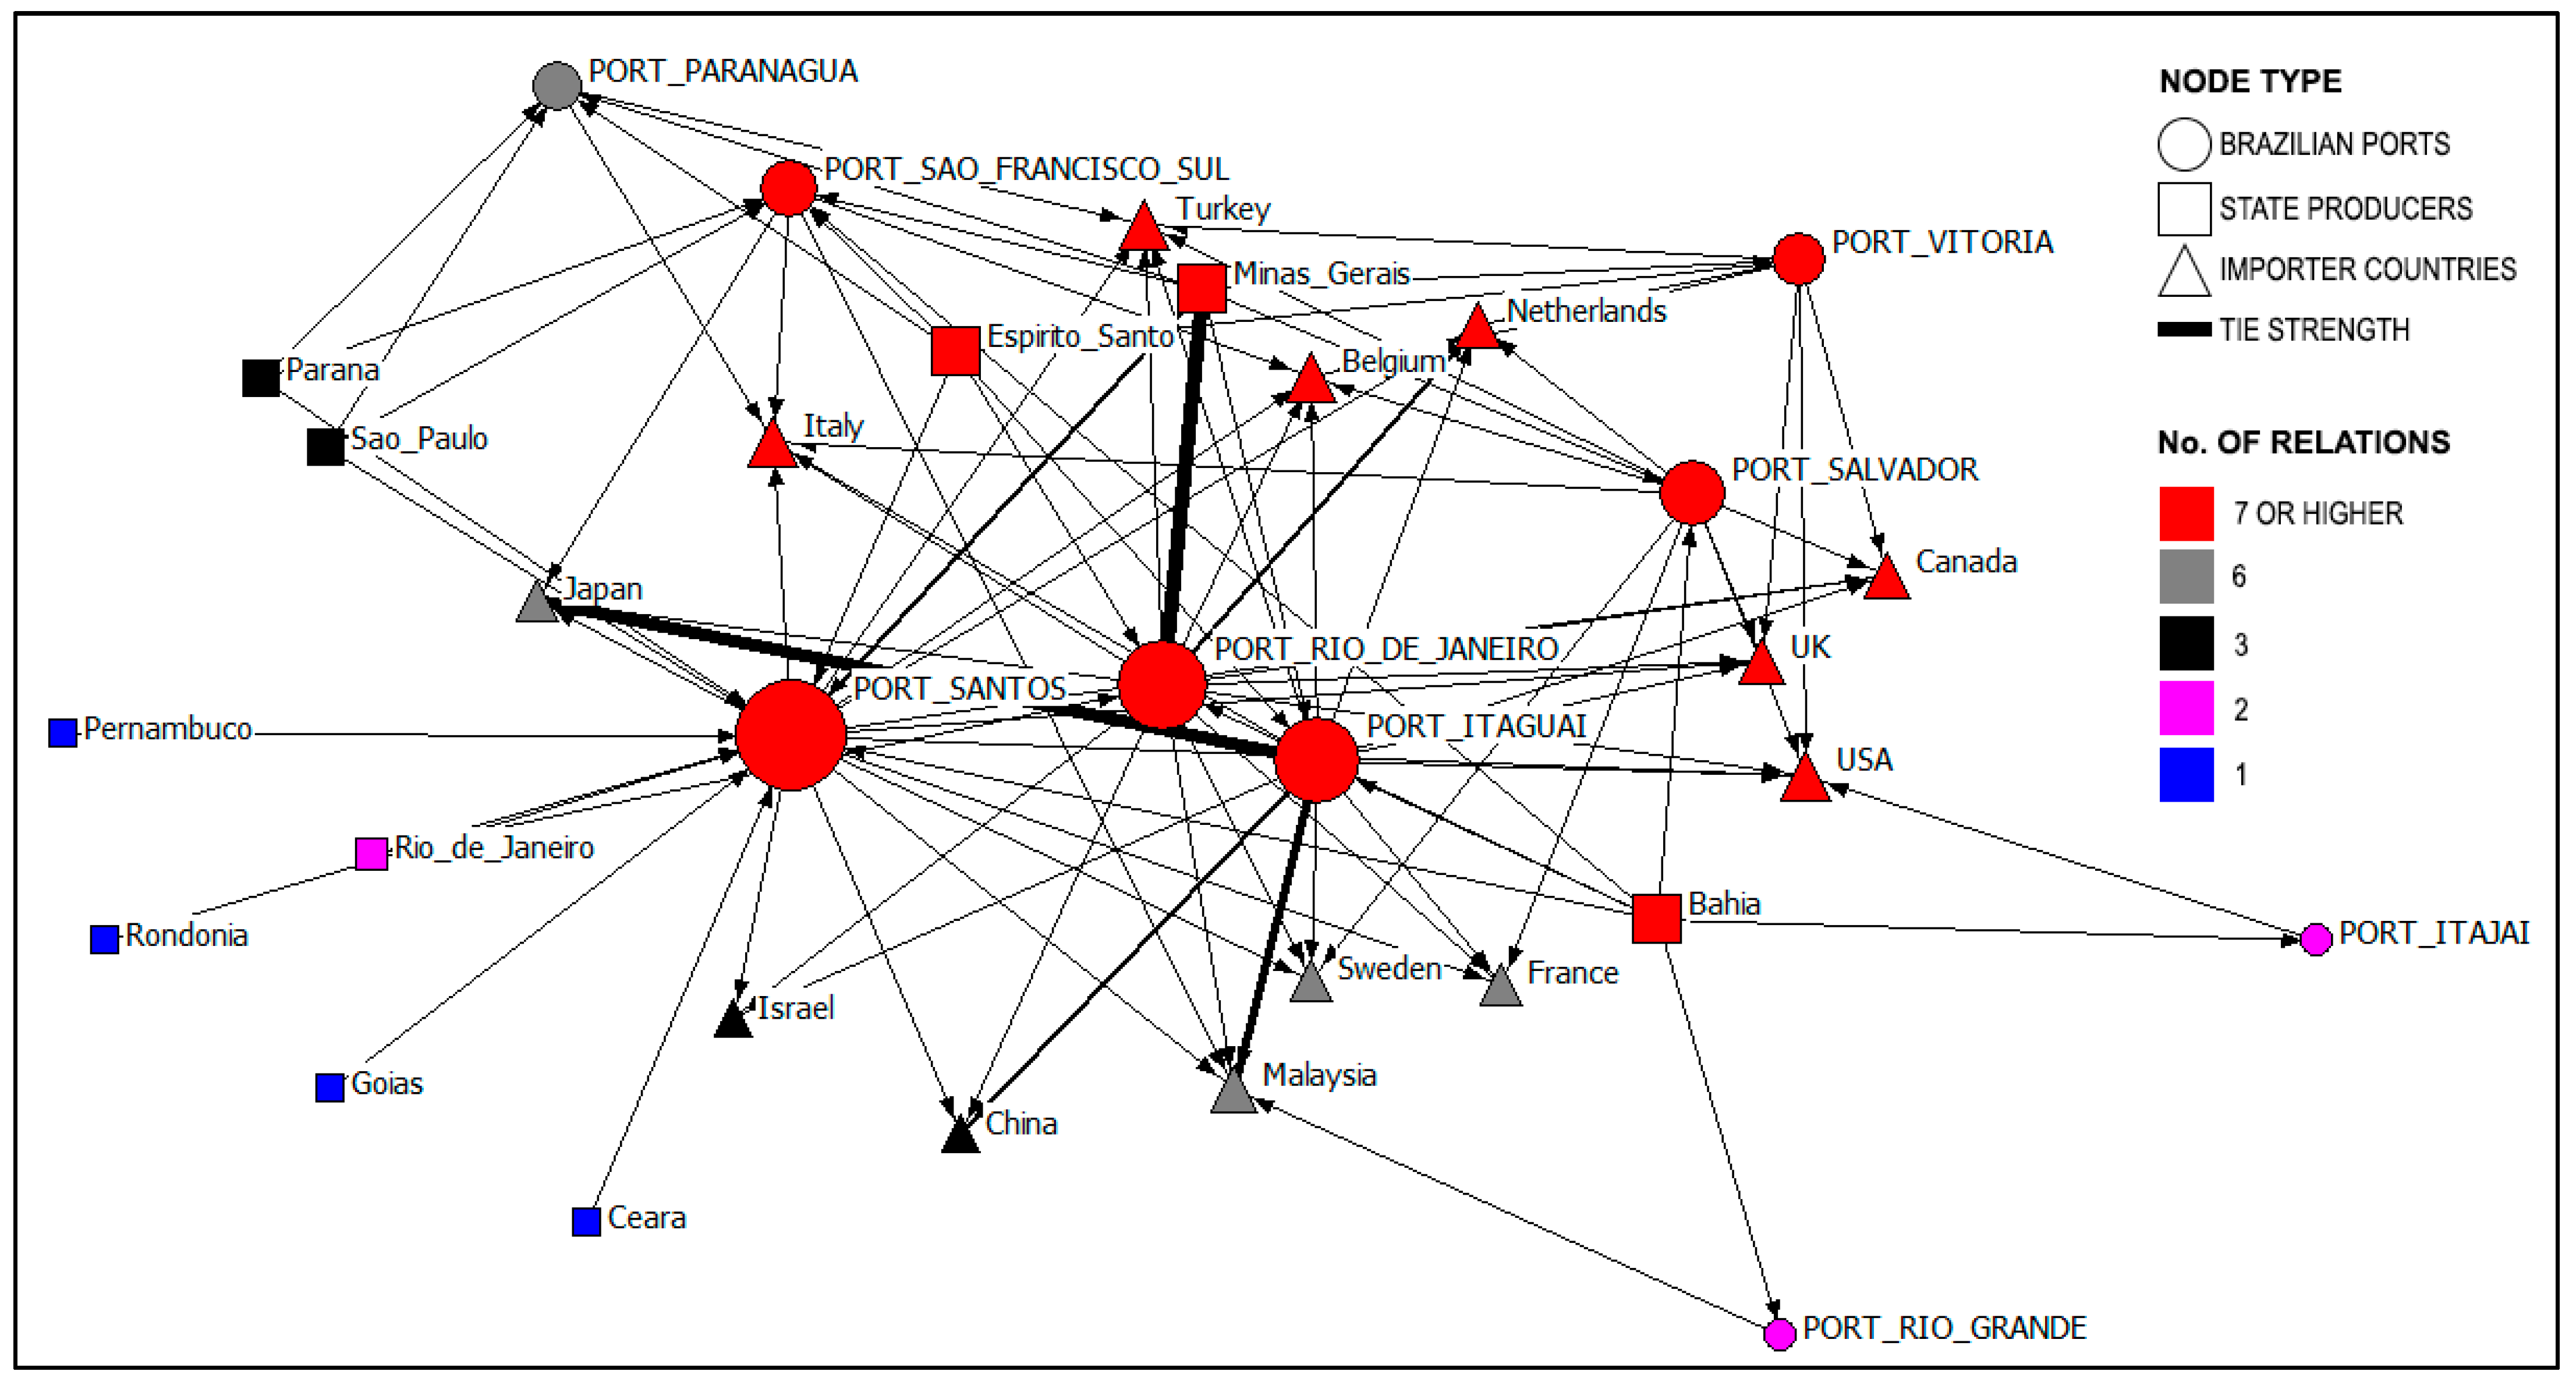
4.2. K-Core
4.3. Betweenness
5. Conclusions
Author Contributions
Funding
Data Availability Statement
Conflicts of Interest
References
- Gosalvitr, P.; Cuéllar-Franca, R.M.; Smith, R.; Azapagic, A. An environmental and economic sustainability assessment of coffee production in the UK. Chem. Eng. J. 2023, 465, 142793. [Google Scholar] [CrossRef]
- ICO. World Coffee Consumption; ICO: Wilmslow, UK, 2023. [Google Scholar]
- Angeloni, G.; Guerrini, L.; Masella, P.; Bellumori, M.; Daluiso, S.; Parenti, A.; Innocenti, M. What kind of coffee do you drink? An investigation on effects of eight different extraction methods. Food Res. Int. 2019, 116, 1327–1335. [Google Scholar] [CrossRef]
- FAO. Faostat, Brazil. Available online: https://www.fao.org/faostat/en/country/21 (accessed on 28 June 2023).
- Escola Superior de Agricultura Luiz de Queiroz/Universidade de São Paulo. PIB do Agronegócio Brasileiro; Imagenet Tecnologia: Piracicaba, Brazil, 2023. [Google Scholar]
- MAPA. Café No Brasil. Available online: http://www.agricultura.gov.br (accessed on 7 March 2019).
- CECAFÉ. Fatia do Brasil nas Exportações Globais de Café deve Aumentar. Available online: https://www.cecafe.com.br (accessed on 8 March 2019).
- ICO. International Coffee Organization-Monthly Coffee Market Report (2022/23). Available online: http://www.ico.org (accessed on 28 June 2023).
- IBGE. A Geografia do Café: Dinâmica Territorial da Produção Agropecuária; IBGE: Rio de Janeiro, Brazil, 2016. [Google Scholar]
- Costa, B.D.R. Chapter 3-Brazilian specialty coffee scenario. In Coffee Consumption and Industry Strategies in Brazil; de Almeida, L.F., Spers, E.E., Eds.; Woodhead Publishing Series in Consumer Sci & Strat Market; Woodhead Publishing: Sawston, UK, 2020; pp. 51–64. [Google Scholar] [CrossRef]
- Barros, F., Jr.; Ferreira, A.L.; Marcondes, R.L.; Prioste, R.R.W. Coffee exports and industrialization in Brazil. Appl. Econ. Lett. 2019, 26, 712–716. [Google Scholar] [CrossRef]
- Barbosa, L.O.S.; Aguilar, C.; Maciel, L. A participação de Minas Gerais e do Brasil na cadeia produtiva global do café. Econ. Região 2021, 9, 147. [Google Scholar] [CrossRef]
- Zaw, T.N.; Lim, S. The military’s role in disaster management and response during the 2015 Myanmar floods: A social network approach. Int. J. Disaster Risk Reduct. 2017, 25, 1–21. [Google Scholar] [CrossRef]
- Xavier, D.L.D.J.; Reis, J.G.M.D.; Ivale, A.H.; Duarte, A.C.; Rodrigues, G.S.; Souza, J.S.D.; Correia, P.F.D.C. Agricultural International Trade by Brazilian Ports: A Study Using Social Network Analysis. Agriculture 2023, 13, 864. [Google Scholar] [CrossRef]
- Banks, M.; McFadden, C.; Atkinson, C. The World Encyclopedia of Coffee: The Definitive Guide to Coffee, from Simple Bean to Irresistible Beverage; Lorenz: London, UK, 2005. [Google Scholar]
- Ferrão, J.E.M. A Aventura das Plantas e os Descobrimentos Portugueses; Instituto de Investigação Científica Tropical; Chaves Ferreira Publicações; Fundação Berardo: Lisboa/Funchal, Portugal, 2005. [Google Scholar]
- Impacto, A.S.S. Revista Cafeicultura: Origem da Palavra Café. Available online: https://revistacafeicultura.com.br/ (accessed on 20 October 2023).
- Smith, R.F. A history of coffee. In Coffee Botany, Biochemistry and Production of Beans and Beverage; Clifford, M., Willson, K., Eds.; Springer: New Britain, CT, USA, 1985; pp. 1–12. [Google Scholar]
- Bicho, N.d.C.C.; Oliveira, J.F.S.; Lidon, F.J.C.; Ramalho, J.C.; Leitão, A.E. O Café: Origens, Produção, Processamento e Definição de Qualidade; Escolar Editora: Lisboa, Portugal, 2011. [Google Scholar]
- Dutra, D. História do Café. Available online: https://www.cecafe.com.br/sobre-o-cafe/historia-do-cafe/ (accessed on 23 April 2020).
- Martins, A.L. História do Café; Editora Contexto: São Paulo, Brazil, 2020. [Google Scholar]
- Rufino, J.L.d.S. EMBRAPA-Programa Nacional de Pesquisa e Desenvolvimento do Café Antecedentes, Criação e Evolução, Embrapa Café: Brasília, Brazil, 2006.
- Romeiro, S.; Delgado, M. A Saúde numa Chávena de Café. Rev. Nutrícias 2012, 15, 20–23. [Google Scholar]
- Ferrão, J.E.M. Na linha dos descobrimentos dos séculos XV e XVI Intercâmbio de plantas entre a África Ocidental e a América. Rev. De Ciências Agrárias De Port. 2013, 36, 250–269. [Google Scholar]
- Ferrão, J.E.M. O Café: A Bebida Negra dos Sonhos Claros; Chaves Ferreira: Instituto de Investigacão Científica Tropical: Lisboa, Portugal, 2009. [Google Scholar]
- ICO. International Coffee Organization-Dados Históricos; ICO: Wilmslow, UK, 2020. [Google Scholar]
- Boaventura, P.S.M.; Abdalla, C.C.; Araújo, C.L.; Arakelian, J.S. Value Co-Creation un the Specialty Coffee Value Chain: The Third-wave Coffee Movement. Rev. De Adm. De Empresas 2018, 58, 254–266. [Google Scholar] [CrossRef]
- Siqueira, T.V.d. A Cultura do Café: 1961–2005; BNDES: Brasilia, Brazil, 2006. [Google Scholar]
- Volsi, B.; Telles, T.S.; Caldarelli, C.E.; Camara, M.R.G.D. The dynamics of coffee production in Brazil. PLoS ONE 2019, 14, e0219742. [Google Scholar] [CrossRef]
- ICO. International Coffee Organization—A História do Café. Available online: http://www.ico.org/pt/coffee_storyp.asp (accessed on 23 April 2020).
- Schultes, R.E. Coffee: Botany, biochemistry and production of beans and beverage. Econ. Bot. 1986, 40, 305–374. [Google Scholar] [CrossRef]
- Souza, F.d.F.; Santos, J.C.F.; Costa, J.N.M.C.; Santos, M.M.d.S. Características das Principais Variedades de Café Cultivadas em Rondônia; EMBRAPA: Porto Velho, Brazil, 2004. [Google Scholar]
- Brazilian Trade Foreign Portall. Comexstat. Available online: http://comexstat.mdic.gov.br/pt/home (accessed on 21 March 2023).
- Butts, C.T. Social network analysis: A methodological introduction. Asian J. Soc. Psychol. 2008, 11, 13–41. [Google Scholar] [CrossRef]
- Borgatti, S.; Everett, M.G.; Johnson, J.C. Analyzing Social Networks; SAGE Publications Ltd.: Los Angeles, CA, USA, 2013. [Google Scholar]
- Vignery, K.; Laurier, W. A methodology and theoretical taxonomy for centrality measures: What are the best centrality indicators for student networks? PLoS ONE 2020, 15, e0244377. [Google Scholar] [CrossRef] [PubMed]
- Tabassum, S.; Pereira, F.S.F.; Fernandes, S.; Gama, J. Social network analysis: An overview. WIREs Data Min. Knowl. Discov. 2018, 8, e1256. [Google Scholar] [CrossRef]
- Dey, P.; Chaterjee, A.; Roy, S. Influence maximization in online social network using different centrality measures as seed node of information propagation. Sādhanā 2019, 44, 205. [Google Scholar] [CrossRef]
- Vega-Oliveros, D.A.; Gomes, P.S.; Milios, E.E.; Berton, L. A multi-centrality index for graph-based keyword extraction. Inf. Process. Manag. 2019, 56, 102063. [Google Scholar] [CrossRef]
- Kong, Y.X.; Shi, G.Y.; Wu, R.J.; Zhang, Y.C. k-core: Theories and applications. Phys. Rep. 2019, 832, 1–32. [Google Scholar] [CrossRef]
- Farine, D.R.; Whitehead, H. Constructing, conducting and interpreting animal social network analysis. J. Anim. Ecol. 2015, 84, 1144–1163. [Google Scholar] [CrossRef]
- Saqr, M.; Fors, U.; Nouri, J. Using social network analysis to understand online Problem-Based Learning and predict performance. PLoS ONE 2018, 13, e0203590. [Google Scholar] [CrossRef]
- Celik, S.; Corbacioglu, S. From linearity to complexity: Emergent characteristics of the 2006 Avian Influenza Response System in Turkey. Saf. Sci. 2016, 90, 5–13. [Google Scholar] [CrossRef]
- Freeman, L.C. Centrality in social networks conceptual clarification. Soc. Netw. 1978, 1, 215–239. [Google Scholar] [CrossRef]
- Samoggia, A.; Riedel, B. Coffee consumption and purchasing behavior review: Insights for further research. Appetite 2018, 129, 70–81. [Google Scholar] [CrossRef] [PubMed]
- CECAFÉ. Relatório Mensal Cecafé. Available online: http://www.cecafe.com.br (accessed on 26 June 2023).
- Grinshpun, H. Deconstructing a global commodity: Coffee, culture, and consumption in Japan. J. Consum. Cult. 2014, 14, 343–364. [Google Scholar] [CrossRef]
- White, M.I. Coffee Life in Japan; Number 36 in California Studies in Food and Culture; University of California Press: Berkeley, CA, USA, 2012. [Google Scholar]
- Loftfield, E.; Freedman, N.D.; Dodd, K.W.; Vogtmann, E.; Xiao, Q.; Sinha, R.; Graubard, B.I. Coffee Drinking Is Widespread in the United States, but Usual Intake Varies by Key Demographic and Lifestyle Factors123. J. Nutr. 2016, 146, 1762–1768. [Google Scholar] [CrossRef] [PubMed]
- Anders, S.; Fedoseeva, S.; Anders, S.; Fedoseeva, S. Quality, Sourcing, and Asymmetric Exchange-Rate Pass-Through into U.S. Coffee Imports. J. Agric. Resour. Econ. 2017, 42, 372–385. [Google Scholar]
- CNA. Panorama Agro. Available online: https://www.cnabrasil.org.br/cna/panorama-do-agro (accessed on 27 June 2023).
- Gao, P.; Huang, J.; Xu, Y. A k-core decomposition-based opinion leaders identifying method and clustering-based consensus model for large-scale group decision making. Comput. Ind. Eng. 2020, 150, 106842. [Google Scholar] [CrossRef]
- Golbeck, J. Analyzing the Social Web, 1st ed.; Morgan Kaufmann: Waltham, MA, USA, 2013. [Google Scholar]


| Variable | Observations | Mean | Std Deviation | Minimum | Maximum |
|---|---|---|---|---|---|
| Volume | 1863 | 742,850 | 13,705,098 | 100 | 482,948,396 |
| Actor | OutdegV (MT) | OutdegN (Qty Relations) |
|---|---|---|
| PORT_SANTOS | 754,477,440 | 13 |
| PORT_ITAGUAI | 332,680,160 | 13 |
| PORT_RIO_DE_JANEIRO | 233,739,616 | 13 |
| PORT_VITORIA | 121,795 | 6 |
| PORT_SALVADOR | 116,090 | 9 |
| PORT_PARANAGUA | 44,544 | 2 |
| PORT_SAO_FRANCISCO_SUL | 3775 | 4 |
| PORT_ITAJAI | 535 | 1 |
| PORT_RIO_GRANDE | 115 | 1 |
| Actor | OutdegV (MT) | OutdegN (Qty Relations) |
|---|---|---|
| Minas_Gerais | 1,314,826,240 | 8 |
| Sao_Paulo | 4,281,023 | 3 |
| Espirito_Santo | 1,472,964 | 6 |
| Bahia | 187,293 | 6 |
| Ceara | 96,000 | 1 |
| Goias | 55,197 | 1 |
| Parana | 52,502 | 3 |
| Rio_de_Janeiro | 26,900 | 2 |
| Pernambuco | 194 | 1 |
| Rondonia | 114 | 1 |
| Actor | IndegV (MT) | IndegN (Qty Relations) |
|---|---|---|
| PORT_SANTOS | 754,477,440 | 10 |
| PORT_ITAGUAI | 332,494,848 | 3 |
| PORT_RIO_DE_JANEIRO | 233,739,424 | 4 |
| PORT_VITORIA | 121,795 | 2 |
| PORT_SALVADOR | 116,090 | 2 |
| PORT_PARANAGUA | 44,544 | 4 |
| PORT_SAO_FRANCISCO_SUL | 3775 | 5 |
| PORT_ITAJAI | 535 | 1 |
| PORT_RIO_GRANDE | 115 | 1 |
| Actor | IndegV (MT) | IndegN (Qty Relations) |
|---|---|---|
| Japan | 671,941,952 | 4 |
| USA | 242,331,216 | 6 |
| UK | 154,446,992 | 5 |
| Malaysia | 96,868,600 | 5 |
| China | 49,165,648 | 3 |
| The Netherlands | 21,915,872 | 5 |
| France | 20,451,906 | 4 |
| Israel | 20,068,654 | 3 |
| Belgium | 15,383,606 | 6 |
| Canada | 9,789,481 | 5 |
| Italy | 9,364,191 | 6 |
| Sweden | 5,626,249 | 4 |
| Turkey | 3,829,673 | 6 |
| Actor | Betweenness | nBetweenness |
|---|---|---|
| PORT_SANTOS | 88.800 | 9.548 |
| PORT_RIO_DE_JANEIRO | 16.133 | 1.735 |
| PORT_ITAGUAI | 9.633 | 1.036 |
| PORT_SAO_FRANCISCO_SUL | 6.250 | 0.672 |
| PORT_SALVADOR | 3.917 | 0.421 |
| PORT_VITORIA | 2.500 | 0.269 |
| PORT_PARANAGUA | 2.400 | 0.258 |
| PORT_RIO_GRANDE | 0.200 | 0.022 |
| PORT_ITAJAI | 0.166 | 0.018 |
Disclaimer/Publisher’s Note: The statements, opinions and data contained in all publications are solely those of the individual author(s) and contributor(s) and not of MDPI and/or the editor(s). MDPI and/or the editor(s) disclaim responsibility for any injury to people or property resulting from any ideas, methods, instructions or products referred to in the content. |
© 2024 by the authors. Licensee MDPI, Basel, Switzerland. This article is an open access article distributed under the terms and conditions of the Creative Commons Attribution (CC BY) license (https://creativecommons.org/licenses/by/4.0/).
Share and Cite
da Cruz Correia, P.F.; Mendes dos Reis, J.G.; Amorim, P.S.; Costa, J.S.d.; da Silva, M.T. Impacts of Brazilian Green Coffee Production and Its Logistical Corridors on the International Coffee Market. Logistics 2024, 8, 39. https://doi.org/10.3390/logistics8020039
da Cruz Correia PF, Mendes dos Reis JG, Amorim PS, Costa JSd, da Silva MT. Impacts of Brazilian Green Coffee Production and Its Logistical Corridors on the International Coffee Market. Logistics. 2024; 8(2):39. https://doi.org/10.3390/logistics8020039
Chicago/Turabian Styleda Cruz Correia, Paula Ferreira, João Gilberto Mendes dos Reis, Pedro Sanches Amorim, Jaqueline Severino da Costa, and Márcia Terra da Silva. 2024. "Impacts of Brazilian Green Coffee Production and Its Logistical Corridors on the International Coffee Market" Logistics 8, no. 2: 39. https://doi.org/10.3390/logistics8020039
APA Styleda Cruz Correia, P. F., Mendes dos Reis, J. G., Amorim, P. S., Costa, J. S. d., & da Silva, M. T. (2024). Impacts of Brazilian Green Coffee Production and Its Logistical Corridors on the International Coffee Market. Logistics, 8(2), 39. https://doi.org/10.3390/logistics8020039