1. Introduction
The continuously increasing growth of international maritime trade over the past three decades has resulted in a significant upsurge in the volume of cargo being transported. Cargo terminals, serving as exchange hubs for freight from one leg of the multimodal chain to another, are under growing strain as the yearly cargo throughput across ports has exceeded 10 billion, according to a recent review by [
1]. Nevertheless, the maritime freight industry encounters significant challenges, some of which are distinct from those in other modes of transport. These challenges include port terminal congestion, labor strikes, adverse weather conditions, shortages of shipping containers, and delays in customs procedures [
2,
3]. From an operational standpoint, port congestion in maritime terminals is a significant issue primarily driven by the unpredictability and increased flow of truck arrivals, potentially resulting in substantial delays and environmental harm if not effectively managed. This congestion not only leads to operational inefficiencies, strained community relations, and sustainability concerns but also erodes the port’s competitive edge. This problem has also been exacerbated by the adoption of multimodality. Multimodality has contributed to expanding the global reach and reliability of freight transport, but it has also resulted in an increase in drayage operations in ports, i.e., the transport of cargo over short distances via ground. An example of such operations is the transport of cargo from the port terminal to a close depot, in order to facilitate modal change, in the overall multimodal cargo delivery process. Coordinating between different modes of transport is essential to alleviate congestion in marine terminals as it enables seamless transfer of cargo, reduces dwell times, and optimizes the use of available infrastructure and resources, ultimately improving the efficiency and sustainability of the entire supply chain.
A common measure to mitigate congestion used by ports is the implementation of a Truck Appointment System (TAS). A TAS has the primary goal of reducing gate congestion at port terminals by flattening the gate activity to an efficient and harmonious level [
4]. Under more common TAS implementations, port operators indicate available time windows with a fixed amount of appointments for trucks accessing terminals; hence, a port operator practically regulates the arrival rates of incoming trucks. This provides substantial benefits to all stakeholders, with port operators having a more robust and efficient environment to coordinate, logistics companies being able to better schedule itineraries, and truckers experiencing milder delays in terminal gate queues.
TASs have been the subject of active research since the beginning of the century, with most implementations aimed at modifying external truck arrival patterns to align them with available resources and terminal-imposed quotas [
5,
6]. Although TASs offer significant benefits, they also present some limitations. One of the most significant issues is the lack of transparency in their design, leading to a gap in trust between the involved partners, particularly from Licensed Motor Carriers (LMCs) operating the trucks toward Marine Terminal Operators (MTOs). This trust gap mainly arises from concerns about how appointment quotas are established, whether special quotas exist for specific customers, and the determination of fees [
7]. Limited flexibility within the design of TASs is another major issue. All actors involved in the system desire flexibility, with MTOs seeking more flexibility from carriers in terms of service availability within the day. On the other hand, LMCs are seeking more flexibility in appointment rescheduling and the ability for multilayered planning, such as piggybacking appointments to schedule double moves. In the context of truck scheduling, a double move is a delivery to a warehouse followed by a pickup from the same warehouse, in order to reduce the number of empty truck trips and trucks used. The reduction in empty truck trips, particularly in truck scheduling, has not been extensively studied in the development of TASs [
8].
To that end, the primary goal of this study is the development of a TAS that addresses these two gaps in current implementations. In order to increase transparency and flexibility, inspiration is taken from polycentric systems of governance as a way to manage common pool resources for competing actors in a decentralized manner. A polycentric system is defined as a system of “many autonomous units formally independent of one another, choosing to act in ways that take account of others, through processes of collaboration, competition, and conflict resolution” [
9]. A polycentric system has harmonized rules based on local conditions and affirmation that those affected by the rules can participate in modifying them [
10]. Mapping relationships between all involved actors is necessary under a polycentric system in order to create arbitration mechanisms for conflict resolution and collaboration and enable the system to self-organize. Collaboration has been identified in the literature as one of the key drivers to improve supply chain operations [
11,
12], but its actual implementation is constantly facing setbacks due to acceptance issues by stakeholders at the same level of the supply chain. However, a port environment is increasingly suitable for such a collaborative form of management, as it is already partly polycentric [
13].
In the context of a TAS, the use of an auction is proposed to act as a capacity balancing mechanism that adheres to polycentric principles for the determination and scheduling of truck activities. The common resource at stake in the proposed auction is the right of trucks to access the terminal during a specific time of day. The proposed auction acts as a demand-varying toll during peak periods to alleviate congestion. This approach ensures that the appointment process is determined equitably but also incentivizes logistics companies (and by extension LMCs) to be more flexible, since their inflexibility could result in additional costs. Moreover, to promote flexibility by MTOs, the optimization of carrier-specific criteria in the TAS design is incorporated, namely the maximization of double moves. The proposed optimization strategy satisfies the polycentric system’s requirement that those impacted by the rules (carriers, shippers, truck drivers, etc.) have a say in modifying them, leading to more equitable coordination and synchronization of arrivals. The TAS is designed with a focus on the truck hauling process, which is crucial for logistics companies and LMCs. This emphasis can help boost acceptance of the developed system among these stakeholders, while also providing opportunities for both parties to show flexibility.
The contribution of this study is twofold. To the best of the authors’ knowledge, for the first time, an auction mechanism for collaborative truck arrival management at a marine terminal is presented. A negotiation protocol that governs participants’ interaction (LMCs and MTOs) is defined, as well as a Winner Determination Problem (WDP) formulated as a Mixed-Integer Linear Programming (MILP) model and a pricing rule that enforces sincere bidding. Secondly, by means of an experimental framework, an exploratory analysis is performed aiming at finding common ground solutions between MTO and LMC interactions as a way to highlight opportunities for collaboration.
The rest of this paper is organized as follows.
Section 2 provides an overview of the state of the art regarding TAS models and algorithms.
Section 3 and
Section 4 define the main problem and methodology used to design the TAS and auction mechanism.
Section 5 first presents numerical results to assess the added value of the proposed approach, followed by a sensitivity analysis to assess the effect of some input parameters on the solution quality. Finally,
Section 6 provides conclusions and future research avenues.
3. Problem Definition
This study focuses on tackling the issue of truck scheduling at a marine terminal through the creation of a TAS, with a particular emphasis on planning and managing the truck hauling process. Transporting goods and cargo through trucks involves moving them across various sites, such as distribution centers, customer sites, and port terminals, making the truck hauling process a crucial component of logistics and transport operations. Ensuring the smooth execution of this process is vital for companies in these industries. To achieve this, companies need to coordinate various tasks, such as scheduling, cargo loading and unloading, drayage, and packing. By doing so, these companies can enhance their operational efficiency and improve customer satisfaction. For the purposes of this study, customers are defined as either shippers, who are responsible for organizing and transporting goods from one location to another, or consignees, who are the intended recipients of the goods.
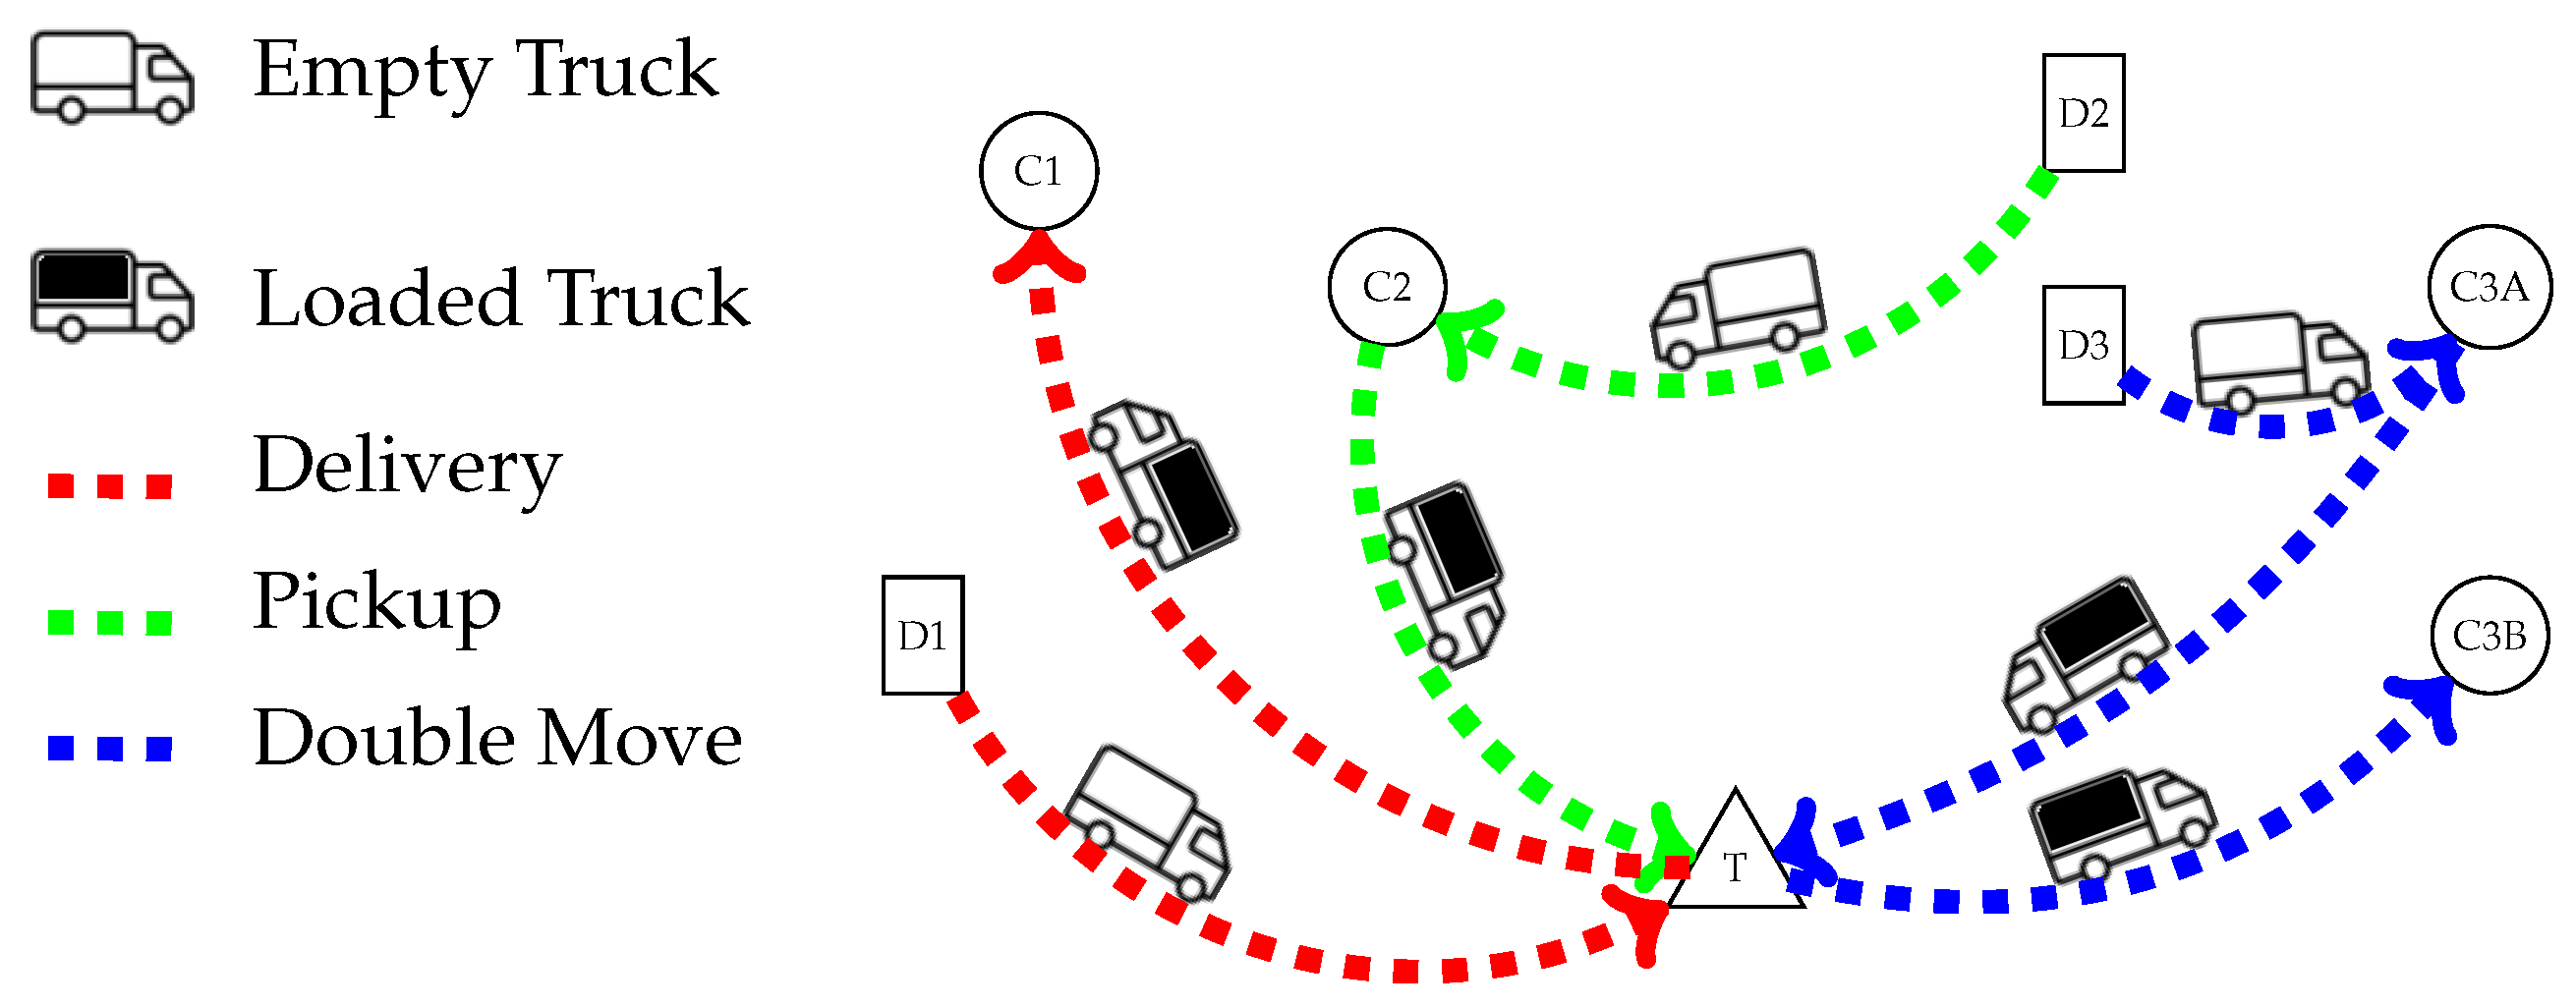
In this method, all incoming truck arrivals are associated with two distinct types of jobs: imports and exports. Export jobs are referred to as “pickup jobs”, since they require the pickup of goods from the shipper prior to travel to the terminal (to be exported). Conversely, import jobs are referred to as “delivery jobs”, since they involve the delivery of goods to the consignee after accessing the terminal. The available job types considered in the TAS are visually depicted in
Figure 1. A delivery job comprises traveling to the terminal, gate clearance, loading, transport to the consignee, and unpacking, whereas a pickup job involves traveling to the shipper, packing, transport to the terminal, gate clearance, and unloading. The time cost of returning to the original depot is not factored in for either job type. It is evident from the figure that empty trucks are used for at least a portion of the transport process for both job types, resulting in a potentially higher number of trucks being required for a given set of jobs. To address this issue, a double move can be performed if a pickup and delivery job can be performed sequentially. Only cases where a delivery job follows a pickup job are considered, but not the other way around. This allows a single truck to be used for two jobs, without the need for additional transport costs.
The design goal is to create a TAS that optimizes the order of truck arrivals at the terminal gate based on requested job activities. The aim is to maximize the satisfaction of logistics companies and improve terminal conditions for all stakeholders. To achieve this, a transparent auction mechanism determined through system-wide utility optimization is proposed. Additionally, the impact of flexibility is measured and a collaboration framework among companies to explore solutions that are agreeable to all parties involved is initiated. The final TAS is realized through a specific methodological framework, which is detailed in
Section 4.
4. Model Description
This section presents the methodological framework used to define the auction-based TAS. First, all the necessary concepts and processes to operate the TAS are explained, starting with the various components of the auction mechanism, including the main sets, parameters, and assumptions of the model (described in
Section 4.1), the WDP formulated as a MILP (explained in
Section 4.2), and the incentive-compatible price rule (elaborated in
Section 4.3). To ease understanding,
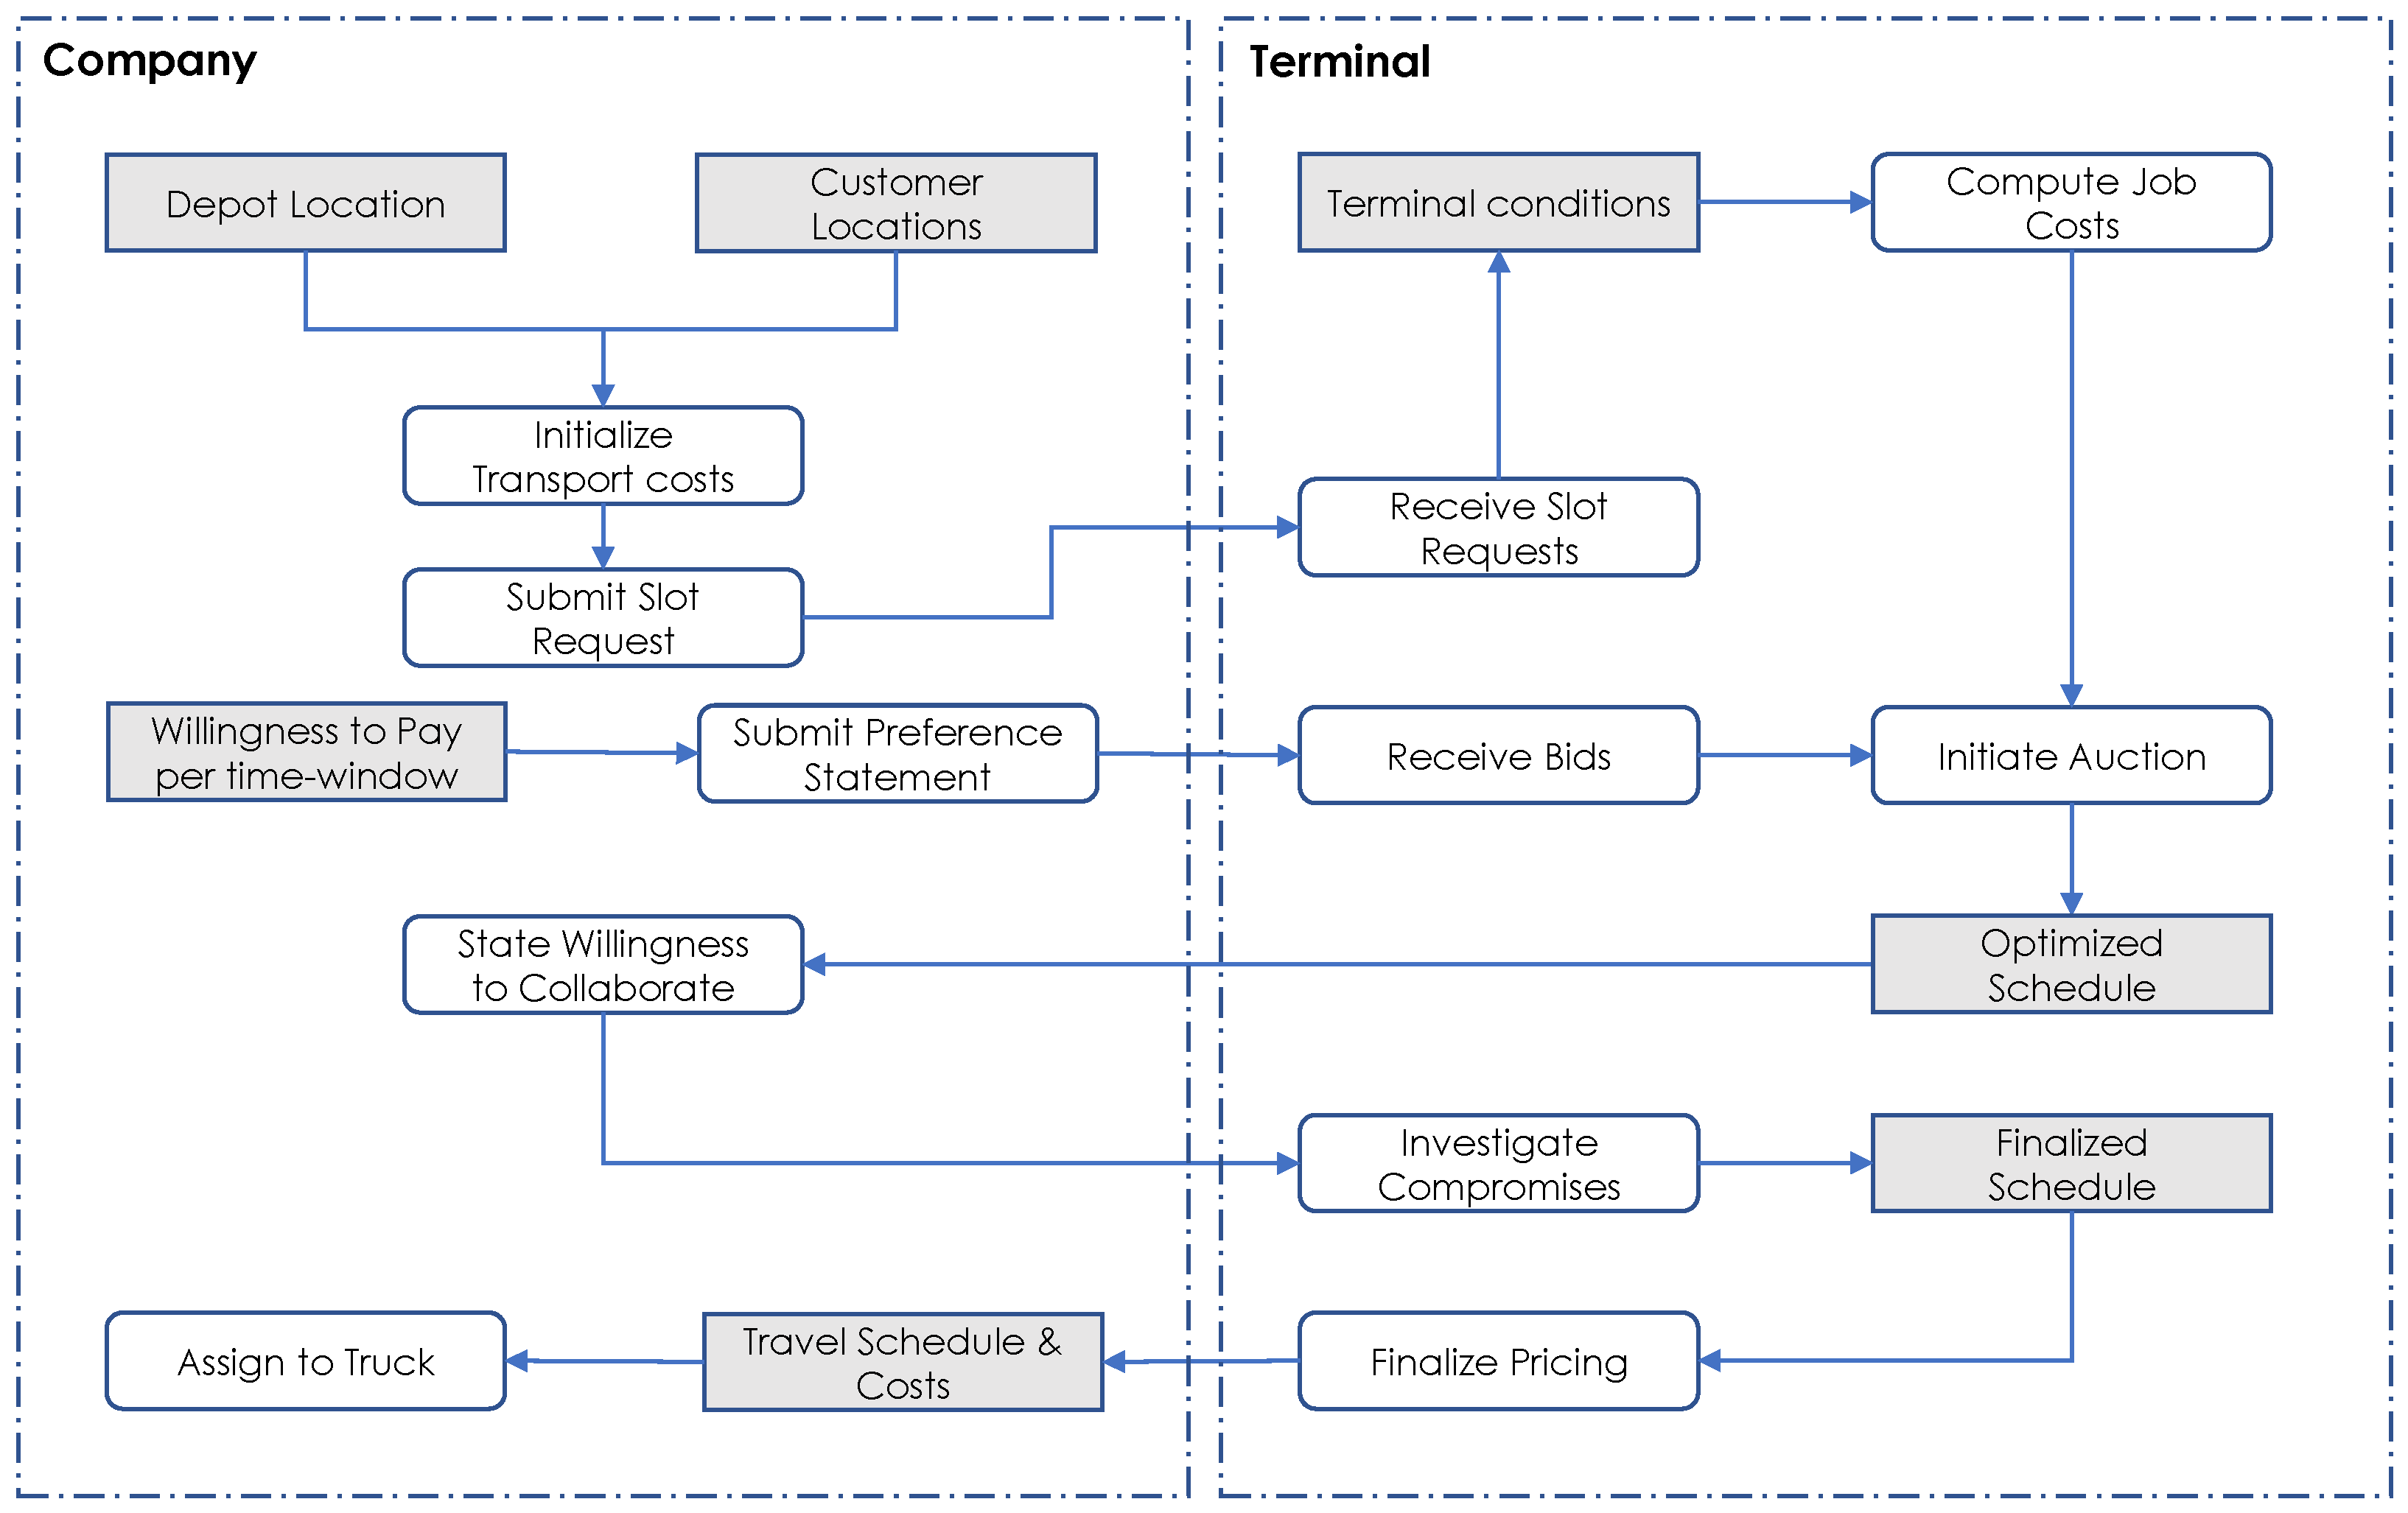
Figure 2 presents an overview of the processes that are part of the appointment system.
The process begins with companies initializing their job costs by utilizing inputs such as their depot and customer locations, along with associated deadlines for each job. This step is essential in determining lower and upper time limits for each job and overall drayage costs, as well as the flexibility of each job. Once these inputs are established, the company can proceed by submitting slot requests for each job they intend to perform during the day. A slot is the right of access for a truck within a specific time period for a given time window, ranging from the time of arrival at the terminal to the time of gate clearance. The slot request is similar to an appointment process used by current TAS implementation and requires the company to provide designated information, such as the truck’s plate number, trucker ID, booking number, and, in this particular case, the lower and upper time bounds for job execution, along with the computed transport costs from the previous step. The transport costs primarily pertain to the duration it takes for trucks to arrive at the terminal, without requiring reference to any internal trucking details. The stated lower and upper time limits offer the chance for companies to be rewarded by showing flexibility in planning their jobs. Tighter bounds increase the chances of a company being serviced within a specific time window but also increase time costs or may result in determining no feasible assignment for that job. Looser bounds, on the other hand, can result in lower time costs and increased chances of a successful job assignment. In parallel with this, companies must also submit a preference statement, indicating their willingness to pay for acquiring a slot at a different time window for any truck. In contrast to the slot request, the preference statement is submitted once for all company jobs and is essentially equivalent to the bids that a company may submit for each slot. The willingness to pay may vary from high values during periods of increased desirability for a company, to zero, which indicates that the company would only use the service at no charge during this time window. Reasonably, a negative willingness to pay is not considered. The statement of preference essentially shapes the market dynamics that will determine the outcome of the auction. Due to its aggregated structure, crafting the preference statement will require careful consideration by each company.
At an appropriate time before the considered time horizon, e.g., a day in advance, the terminal receives slot requests for all potential jobs and associated bids for that day per company. Initially, the terminal operator must finalize the job time costs by accounting for terminal-related operations based on local conditions, such as loading and mounting, which may result in some jobs being dismissed from consideration within the TAS, based on stated job limits. After that, the MTO can initiate the auction and provide an optimized schedule, which is then sent back to the companies. After receiving the schedule, each company needs to indicate their level of willingness to collaborate by specifying the percentage by which they are willing to accept a suboptimal solution as the final schedule, provided it contains characteristics that are desirable for both the MTOs and LMCs. This willingness to collaborate is essential as it provides a way for both parties to show flexibility and enables the synchronization of truck transport under multiple layers of planning. In this study, the increased time interval between any two different jobs is considered a characteristic that the MTOs aim to incorporate into the schedule, while the increased occurrence of double moves in the schedule is desirable for the LMCs. Once the terminal receives collaboration-related input, it can use a precommunicated strategy, such as taking the average or geometric mean across companies’ percentages to investigate compromises and finalize the schedule for that day. Then, the final pricing for each slot assigned to a company is determined, taking into consideration the effect of collaboration in the pricing, and communicated to the company. while each company can assign a truck to a job, or multiple jobs in case of a double move.
Overall, the proposed TAS operates under the assumption that the terminal holds the authority to determine final truck schedules. Nevertheless, it takes a proactive approach by establishing a collaborative environment and clear communication protocols for trucking companies to contribute to the decision-making process. However, scheduling should consider external factors affecting trucking companies and existing relationships with terminals. Terminals can address this by temporarily using a TAS in a limited manner and reserving dedicated slots for specific clients, though this may reduce overall capacity for other companies. It is worth noting that this study does not delve into these special relationships, as their impact on the model’s development could be deemed insignificant.
4.1. Sets, Parameters, and Assumptions
The main sets and parameters involved in model development are presented here. All inputs involved are listed in
Table 1. In the rest of this paper, we use calligraphic, uppercase, and lowercase letters for sets and subsets, parameters, and decision variables, respectively.
First, a set of logistics companies are defined that carry out drayage operations on a marine cargo terminal during a given time horizon defined by a start-time and an end-time so that . is divided into time windows of arbitrary but fixed length , determined by the terminal operator, and represented as . For the sake of clarity, the first time window ranges from to and the last one from to . The terminal has predefined requirements that depend on the time window length, such as a quota , which sets the maximum number of slots that can be auctioned per time window. Each company has a specific demand for slots during the designated time period and certain preferences for particular time windows. Unlike prior implementations of TAS that necessitated the binary declarations of preferred arrival time windows, the right of access is purely determined by each company’s willingness to pay for the procurement of a single slot for a time window . To simplify the analysis, the following assumption is used, based on the information obtained from the preference statement:
Assumption 1. The willingness to pay is represented by the bid made by company c for the acquisition of a single slot in time window w.
Assumption 1 is not trivial, and it is important to enforce it through the use of incentive-compatible price rules (
Section 4.3) like VCG [
30] to ensure the sincerity of the bidders. In the context of the TAS, bids also indicate user satisfaction from the procurement of a slot for a specific job, again under the assumption of truthful bidding.
Given that company
c’s bid for a slot in a single time window
w is represented by its willingness to pay, it can be assumed that the bid of a company for any of its jobs is equal to its bid for a slot in a single time window, which can be expressed as follows:
Jobs must be assigned to a truck operated by the associated company. The available fleet of trucks for job execution is represented as , and each company in the system has its own fleet of available trucks .
Assumption 2. The number of trucks in fleet for company c can always cover the number of jobs that the company operates.
Assumption 2 can be relaxed by allowing a reduced fleet of trucks in some companies for a given set of jobs and thus making mandatory the assignment of double moves at these companies. However, refraining from that in the analysis, a system-wide approach is utilized when exploring the reduction in the number of trucks in the terminal, essentially enforcing the amount of double moves to a minimum feasible value. To formulate enforcement of double moves, the subset
, which contains the candidate delivery jobs to follow pickup job
j, is defined. It follows that
, as a delivery job, cannot be the first job of a double move, as described in
Section 3.
Assumption 3. Subset for contains jobs belonging to company , as double moves are only possible between jobs operated by the same company.
Assumption 3 is operationally justifiable, as a job can only be completed by the company that owns it. Relaxing this assumption could further increase the number of double moves within the marine terminal. However, it requires horizontal collaboration across different companies in the form of job exchange. This further entails sharing potentially sensitive information with competitors such as slot requests, which may be unrealistic. As already defined, within a slot request all the crucial information that ensures the successful execution of a job is provided by the company such as the lower bound and upper bound , signaling the earliest possible time for job launch and the latest possible time for job completion. Slot requests also contain information that defines the phase l of a job j and job-related time needed .
Assumption 4. We define for each job a set of three phases related to pregate routing (), gate clearance (), and after-gate routing (), and we define the associated job- and phase-specific time cost .
Assumption 4 aggregates customer-specific time costs (e.g., transport time to the terminal) with terminal-related time costs (e.g., unloading time of a container) to a specific position within the time horizon of a job, as described in the
Compute Job Costs process in
Figure 2. For this case study, these time costs are considered deterministic and known a priori to TAS assignment.
4.2. Winner Determination Problem
Upon receiving all slot requests and preference statements from the different companies, the terminal can determine all job-related times based on expected terminal conditions and initiate the auction. A single-round sealed bid auction is used, with a WDP that maximizes users’ satisfaction based on stated willingness to pay while establishing a feasible schedule based on slot request. To represent decisions made by the TAS, necessary decision variables are defined in
Table 2.
Using the described decision variables and the inputs described in
Section 4.1, the WDP of the single-round auction is formulated as follows:
subject to:
The objective formulated in Equation (2) maximizes the collective value placed on slots by individuals involved in the auction. This objective could alternatively be understood as optimizing user satisfaction or the effectiveness of the system’s allocation. Constraints (3)–(6) enforce the assignment of each job to a specific time window while guaranteeing that such an assignment is made only when the lower Equation (3) and upper Equation (6) time bounds are not violated. Additionally, in constraint (7), a total limit of assignments per time window based on the quota set by the terminal is imposed. Constraints (8)–(10) ensure that the phases of a job are executed sequentially. However, since a job may be performed as part of a double move with a different starting phase than the planned one, an indicator variable is introduced to signal such an occurrence. If the indicator variable is set to 1, the starting phase of the job becomes equal to phase 2 Equation (9). With constraint (11), the assignment of a job to a specific time window is linked to an assignment within a truck and possibly a double move. With constraints (12)–(13), the decision variables and are forced to be unitary if decision variable is unitary, and it is also enforced that at least one of them is zero otherwise. For constraint (12), is denoted as a small value close to zero so that and cannot be both unitary if is zero. Constraints (14) ensure that each job j is assigned to a truck owned by the company in charge of j. Constraints (15)–(16) force that two jobs should be assigned to a truck if is unitary. Constraints (17) ensure that if is scheduled to be serviced at the gate before . Constraints (18) ensure that either precedes or vice versa. Using indicator , the absolute temporal difference in these two jobs concerning gate access can be computed via constraints (19)–(21). Constraints (22)–(24) assert that when a truck is performing a double move, the delivery job can start immediately after the end of the pickup job and that only appropriate jobs are considered. Finally, Constraints (25)–(31) define the nature of the decision variables. In particular, with , the set of non-negative real numbers is defined.
The WDP establishes the optimized schedule from the perspective of revenue maximization and by extension social optimum, since we operate under the assumption that bidders state their true valuations for gaining access to the port. Concerning terminal-imposed requirements, the only existing parameter is that of time window quota, representing the maximum productivity rate of a terminal during a time window. As previously described, the optimized schedule is shared with logistics companies, and their willingness to collaborate is requested to identify opportunities for compromise. The proposed methodology involves optimizing the schedule through the inclusion of two additional conditions that complement the primary outcome and introduce collaboration in the system. These conditions could be included as part of the objective function to maximize, as they represent criteria that are desirable in the resulting schedule. However, the use of a single-objective metric is preferred for the WDP when dealing with an auction mechanism. Hence, the use of the well-known
-constraint method for multiobjective optimization problems is exploited. This method involves reformulating the additional conditions as constraints to create a single objective function with multiple objective criteria [
38], where the right-hand side of the additional constraint is changed to provide a range of solutions. Because more stringent requirements on the additional constraint negatively affect the solution quality, the set of solutions can then be mapped in a Pareto-front fashion. This is paramount when dealing with external actors characterized by contrasting needs. The specific constraints for the developed WDP are defined as follows.
Definition 1. ϵ-constraint #1—Temporal Difference; Assignment of jobs is restricted to a minimum time difference between any two nonidentical jobs. Definition 2. ϵ-constraint #2—Double Moves; At least a minimum number of double moves should occur within a day. The
-constraint #1 is primarily beneficial for the terminal, but it can also be argued that enforcing this constraint is advantageous for LMCs because the increased time gap between jobs can function as a slack to absorb minor delays. Similarly, while
-constraint #2 is focused on LMCs, enforcing this requirement can increase the desirability of the terminal. To apply the
-constraints, the maximum values for
and
(explained in
Section 5) that allow feasible solutions must be established and iterate over user-defined feasible values. However, the final schedule is based on the average willingness to collaborate, representing the maximum allowed drop in revenue after applying the
-constraints. For example, if the average willingness to collaborate is 10%, the search for solutions with increased
and
will not include any objective values that are not at least 90% of the original solution. Overall, the application of
-constraints #1 and #2 will result in revenue that is less than or equal to the optimized solution generated by the WDP. Nonetheless, by implementing effective pricing rules, this trade-off can be leveraged.
4.3. Pricing Policy
After computing a job assignment strategy via the WDP, it is essential to implement a rule for determining the payment for each job per time window. This pricing rule must be unambiguous to all auction participants before the start of the auction. Ideally, the pricing rule should satisfy two criteria: individual rationality, meaning that the price paid should be equal to or less than the maximum amount each participant is willing to pay for a truck to acquire a slot within a specific time window, and incentive compatibility, meaning that participants will have an incentive to place truthful bids during the auction. As stated in
Section 4.1, each company has a private value
for acquiring a single slot at a specific time window, representing their willingness to pay. To ensure an efficient combinatorial auction design, it is crucial to establish prices for the allocated resources that encourage bidders to set their bid prices (
) equal to the values they have assigned to the resources (
), as stated in Assumption 1. The first-price policy, where bidders pay the initial bid amount, does not prevent speculative behavior and is not incentive-compatible. As an alternative, the VCG policy (also called the second-price policy) is commonly used because it has been extensively shown to be effective in the literature. The VCG policy is incentive-compatible and has been proven to be effective for many variant WDPs [
29].
Let us define
as the maximized revenue determined from the WDP without any
-constraints.
is further distinguished as the partial maximized revenue acquired in time window
w by auctioning
M slots across
N companies. Then, the general equation for a VCG payment
of company
per time window
w is expressed in Equation (
34):
represents the system’s optimal outcome for the WDP if the bid
for that time window is assumed to be zero. On the other hand,
refers to the optimal outcome of the WDP excluding the revenue from bid
. Essentially, a VCG payment is equal to the opportunity cost or marginal harm caused to other participants. When the sum of bids of the second-best combination is equal to the current best without the selected company, the price they will pay will be the same as their original bid. In all other cases, the price paid by the selected participant will be lower, thus also proving individual rationality. In the end, the utility
gained by each company
c for a slot at time window
w is equal to
The computation of VCG prices requires solving the WDP times, which can be computationally challenging in practice. A simpler alternative is to use the second-price rule, where each company pays the bid equal to the second-highest bid after their own. In the context of the TAS, a different rule to reduce complexity is adopted. Since revenue maximization is not the main goal of MTO, but rather congestion mitigation, an arbitrary congestion limit for each time window is established. If the limit is exceeded in the assignment obtained from the WDP, that time window is considered congested, and the fees are determined via the VCG process as described above. However, if the limit is not exceeded, all fees related to that time window are considered to be zero, and no computation of VCG prices is required. This significantly reduces the amount of prices to be computed.
To make the implementation of the
-constraints more desirable, the pricing mechanism needs to be modified to account for the cost of collaboration. The pricing mechanism should consider the decrease in user satisfaction represented by revenue
, resulting from the introduction of these constraints. When
-constraints are introduced (as described in
Section 4.2), the difference in utility
per company and time window compared with the original assignment is computed among different combinations of
-constraints, and discounted/added to the updated prices to reflect the incurred inconvenience and benefit. The pricing policy is described in Algorithm 1. The pricing policy used in the TAS implementation is not budget-balancing across iterations, which implies that the total payments may not match the solution obtained by the original WDP. Nonetheless, this characteristic can also prove desirable for trucking companies as it can relate to a direct way of remuneration in case of incurred inconvenience.
| Algorithm 1: Pricing Policy |
| Data: Initial Schedule ; Final Schedule and Revenue ; Bids |
| Result: Prices and utilities per company for each time window |
| 1 for do |
| 2 for do |
| 3 |
| 4 if then |
| 5 Calculate by setting and resolving WDP for final , |
| 6 |
| 7 |
| 8 |
| 9 |
| 10 end |
| 11 end |
| 12 end |
5. Experiments
In this analysis, the practicality and applicability of the developed model and solution methodology are validated. Specifically, both the scalability of the approach under increased problem sizes and also its ability to accurately serve users in a way that the social optimum is maximized is tested. To this end, the TAS is benchmarked under randomly generated instances that incorporate real-life characteristics. These instances were created for a hypothetical terminal, which was required to coordinate truck scheduling operations with 10 logistics companies in the surrounding area. The specific demand per company varied across the examined instances, but it was generally assumed that each company would send between 5–15 trucks per day. This demand level was consistent with that of a medium-sized freight terminal, as indicated by insights gathered from expert interviews. The terminal was assumed to operate for 10 h each day (e.g., 7:00 AM–5:00 PM), which translates into a planning horizon of 600 min such that . The planning horizon T is then divided into a total of 10 time windows with = 60 min. Appointment quotas for each time window were considered to be flat and set to a maximum of 15 trucks. Jobs were randomly generated to be either related to pick-up or deliveries.
Under the assumption that the depots of origin of the logistics companies were located in close proximity to the port, the travel time in minutes from depot to terminal is distributed using the following uniform distribution
. However, transport time costs from the terminal/depot to consignees/shippers were expected to be more time-consuming, so sampling from
was utilized. To determine the time costs associated with terminal operations, examples from the literature are referenced. Mounting and unmounting times were assumed to last 5 min [
39], while packing/unpacking times at the customer end were uniformly distributed as
[
40]. Thus, the time costs related to accessing the terminal were calculated based on depot-to-terminal transport costs for deliveries and depot-to-consignee transport costs, packing, and consignee-to-terminal costs for pickups. Likewise, time costs related to accessing the terminal after gate clearance were determined based on mounting, depot-to-shipper transport, and unpacking costs for deliveries, while pickup costs were calculated based on unmounting time costs. The gate clearance time costs were set to a minimum of 2 min [
41].
For each job, an assumed range of flexibility from 60 to 240 min, measured in half-hour intervals, per company is used. To establish the lower and upper time bounds, the total job costs are combined with each company’s flexibility to determine the feasible makespan for job execution. This makespan was then aligned with the time window where the company’s willingness to pay was the highest to establish a clear timeline for job execution. The assumed willingness to pay of each company was set to vary between €0 and €20, which was determined based on the possibility that a company may not want to bid for a slot at all or may be willing to bid slightly higher than examples of currently applied surcharges (€15) for booking slots during congested time windows using a First-Come-First-Serve policy [
42]. As slot requests fluctuate throughout the day and willingness to pay for a slot is the main determinant of this fluctuation in this approach, it is hypothesized that the willingness to pay for a slot is either uniformly distributed (
) across the day or higher on average during midday (
), which indicates greater demand (peak hour) during that time. This will help in benchmarking the TAS under different demand scenarios.
Focusing on algorithmic specifications, Gurobi 11.0.0 [
43] was used to solve all MILP models. Unless differently specified, the numerical results were obtained using an Intel Xeon Gold 6226R CPU. All necessary transformations of input for the pricing mechanism and VCG policy were conducted in Python. In all instances, we imposed a time limit of one hour to also validate the applicability and scalability of the approach.
In
Table 3 and
Table 4, the results for instances of
and
slot preferences are presented without any application of
-constraints. The initial column displays the instance label, while the second column presents the number of jobs, which indicates the problem size. In the third and fourth columns, the objective function and computational time are reported, while the fifth and sixth columns indicate the elapsed time to reach the best solution and the deviation from the theoretical optimal. The last two columns present the final outcomes from the application of the auction. Specifically, they show the number of trucks that were assigned a slot within an examined instance and the total number of auctioned slots within congested time windows. The increase in problem size leads to an increase in computation time and the percentage of unserved trucks. This trend is observed in both distribution patterns of slot preferences, but it is more pronounced in pattern
, where preferences tend to be concentrated in the middle of the day. In the worst-case scenario (Instance
), only 79% of trucks were served via the appointment system. In terms of computational time, all but one instance with
preferences proved optimality in less than 30 min and reached the optimal solution in less than 2 min. However, this was not the case for
, where optimality was not always proven in instances with more than 70 jobs, although the best solution was generally reached in under ten minutes. This highlights potential issues in days with demand concentration at specific time windows. Nevertheless, solutions within 5% of the theoretically optimal solution were achieved in all but two instances during the one-hour runtime. Given that the time to reach the best solution was relatively short, a heuristic was not considered necessary. Finally, it was observed that the objective values between patterns varied significantly, indicating that revenue maximization in the WDP is linked to the concentration of arrivals within a given day.
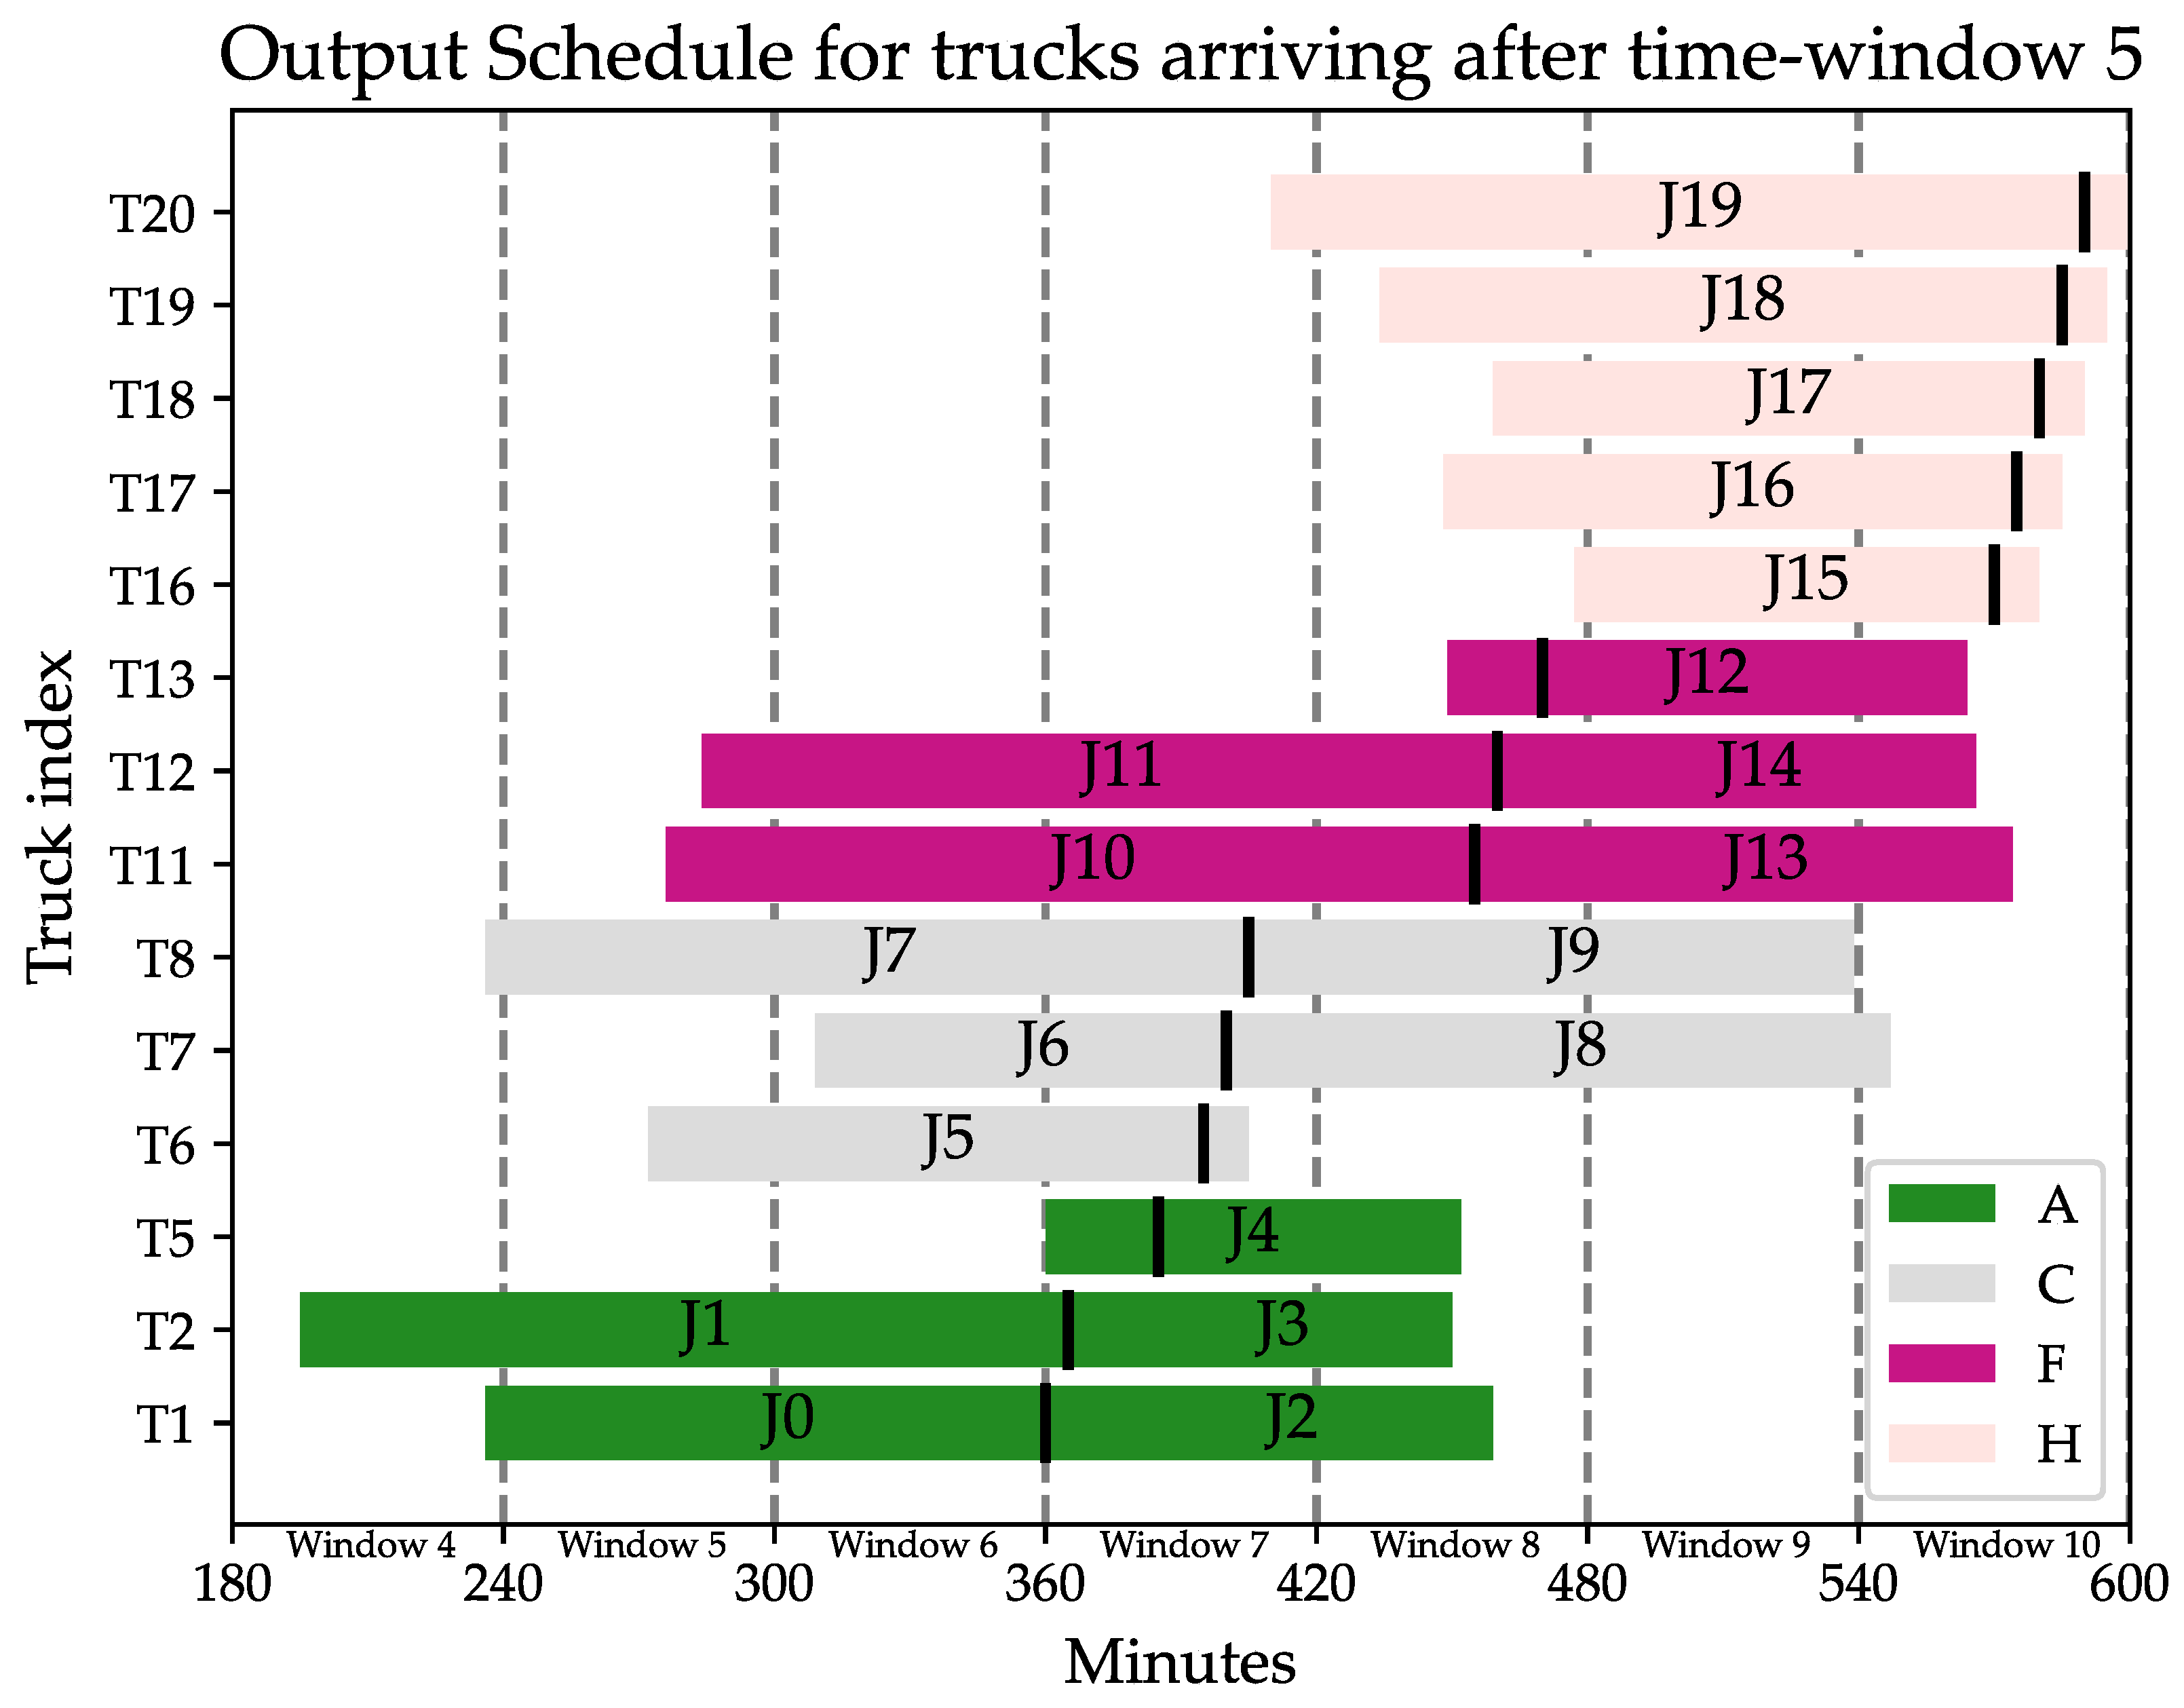
Figure 3 presents a Gantt chart illustrating the scheduling of 20 jobs under
slot preferences for the latter half of the observed day utilizing the TAS system. The visualized Gantt chart corresponds to results related to Instance
, as reported in
Table 3. Across all case studies, there are 10 companies denoted by letters A to J, yet only four have jobs within the time windows 5 to 10 in this particular case. Each row in the Gantt chart depicts the schedule of a truck, which can either be a single job (e.g., truck T20 only performs job J19) or two jobs (e.g., truck T1 performs job J0 and J2 as a double move). It serves as a visual representation of the job schedule throughout the day, with the black vertical line indicating the gate access time. This scenario corresponds to a WDP achieving the maximum possible revenue, as evidenced in
Table 3 and
Table 4, without incorporating
-constraints by default. Upon visual inspection, it becomes evident that some trucks tend to cluster together in close proximity, resulting in scenarios where users may have limited time flexibility, while certain time periods remain notably vacant (e.g., Window 6). For example, company H has jobs clustered very close to each other. This might not pose operational issues in low-demand periods but may be very detrimental to port performance in high-demand periods. Interestingly, the use of double moves may be determined as an optimal solution even without applying the
-constraints for collaboration. To identify solutions with even more favorable attributes, an exploratory analysis is employed involving the utilization of
-constraints, as discussed in
Section 4.2.
To determine the generation of candidate -constraint solutions, which can be computationally expensive, the limits for double moves () and temporal difference () are initially established in the tables. A maximum of 10 double moves is determined by solving the original instances with a modified objective function that prioritizes double move maximization. For the temporal difference, an arbitrary 5 min limit is considered to be reasonable. This approach allowed for quick identification of solutions that can be used as a starting point for all other instances. Next, alternative assignments with set -constraints are computed, beginning from the highest possible double move and temporal difference of 5 min and decreasing iteratively, until pinpointing a solution that matches the optimal solution in the base scenario.
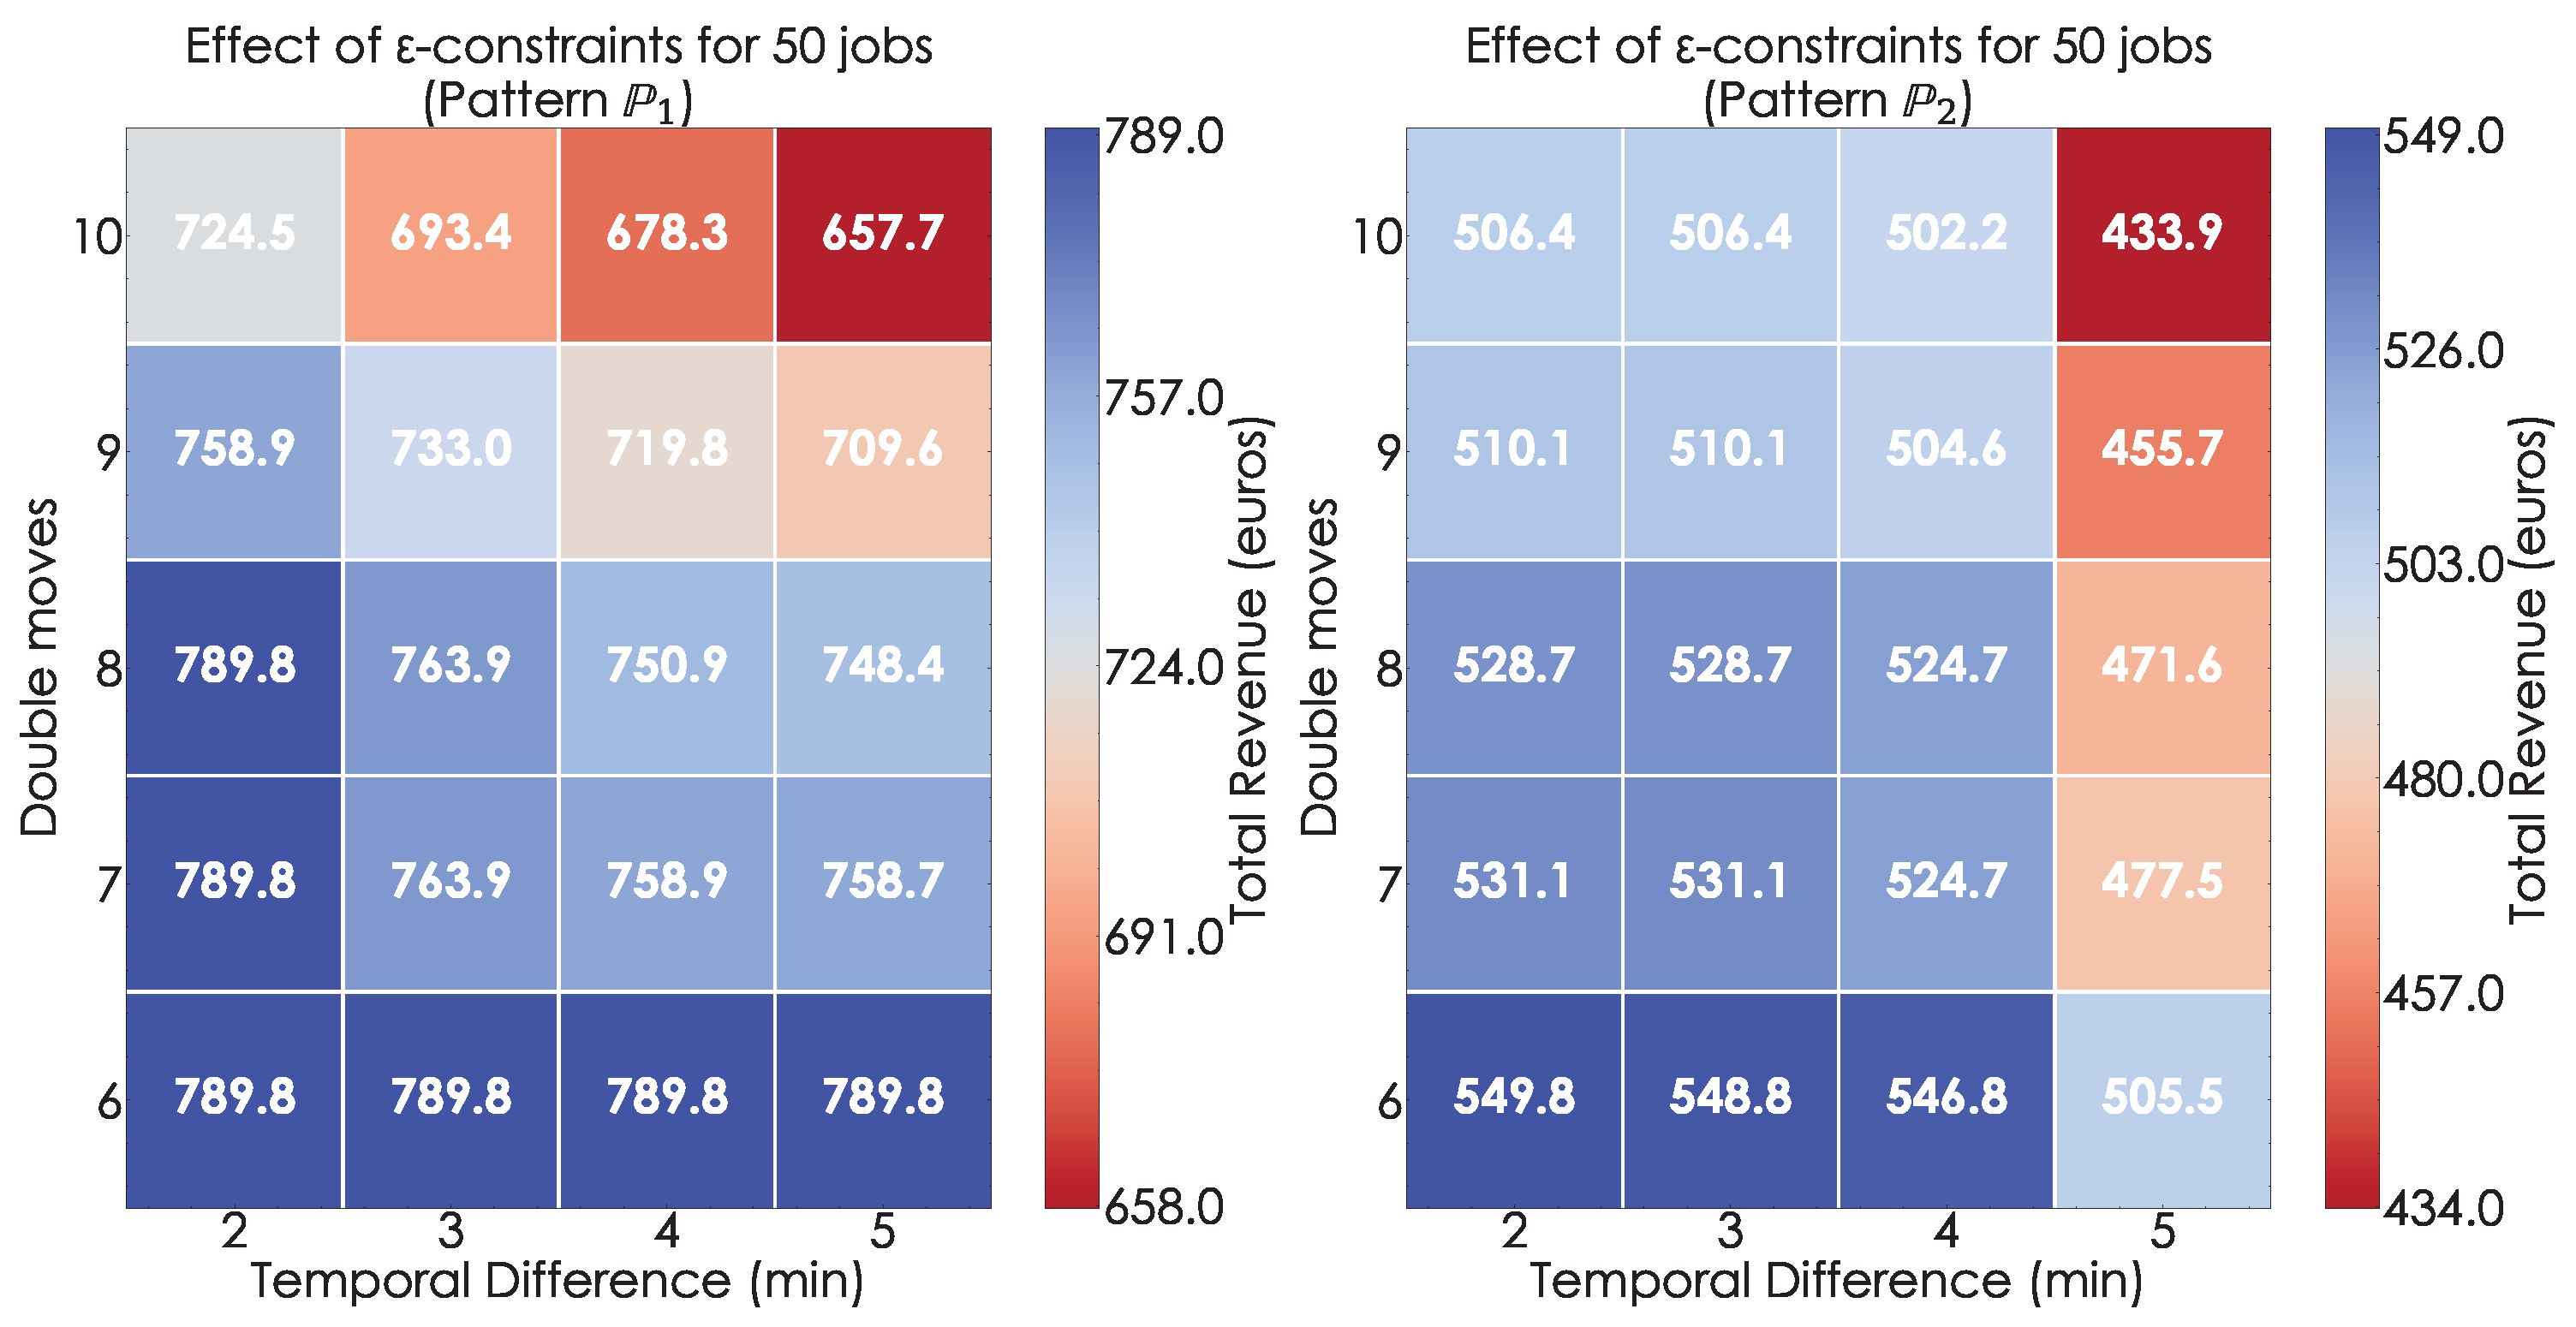
Figure 4 shows that the application of
-constraints does not necessarily have a negative impact on the optimal solution, but it is consistently equal to or less than the optimal solution. For example, in Instance
, imposing constraints of a minimum temporal difference of 5 min and at least six double moves results in a TAS with the same level of user satisfaction as the base scenario. However, for Instance
, applying the same constraints leads to a drop of nearly 10% compared with the base scenario, resulting in a revenue loss of approximately EUR 49 (from EUR 549.8 to EUR 505.5). To balance the competing objectives of decreasing user satisfaction and increasing
-constraint parameters, the concept of willingness to collaborate is introduced in
Section 4. This metric denotes the maximum acceptable reduction in performance during the
-constraint analysis, and is arbitrarily set at 10%. Thus, only solutions that are at least 90% in value of the original solution were considered in this analysis. Based on this criterion, four solutions were excluded in both cases because they prioritized maximizing the number of double moves or temporal difference over user satisfaction.
Lastly, the impact of pricing on the participating companies for Instance
is demonstrated in a case with concentrated arrivals where the
-constraints method is already utilized, in
Table 5. Notably, all companies were assigned their desired slots during the observed day. In the base scenario, the total revenue collected from the auctioning of 37 slots was EUR 315, resulting in an average of EUR 8.5 per slot auctioned. Based on the WDP results, the average slot valuation was EUR 10 per slot, which again highlights the individual rationality in the auction. Under imposing of
-constraints, the solution provided by
and
is selected, as it is the one closest to the cut-off rate of 90% from the optimal solution (specifically at 91%). In this case, the second prices derived from the auction resulted in revenue almost similar to the first case (EUR 311), but after adjusting for the lost utility of the affected companies, the price dropped to EUR 267 for 36 slots, resulting in EUR 7.4 per slot on average. The ratio of utility to final price for both cases is 1.75 in the base scenario and 1.88 in the solution that includes
-constraints. This indicates that, on average, spending a euro in the second case results in a higher gain in utility.
6. Discussion
This paper presented a new formulation for a TAS inspired by principles of polycentric management to enhance transparency and flexibility during scheduling. Transparency is achieved by designing a clear auction mechanism that prioritizes user satisfaction and focuses specifically on the crucial operation of truck hauling. To satisfy the aim of enhancing flexibility for both MTOs and LMCs, a procedure to investigate solutions that meet the desired criteria of both parties without disrupting their operations significantly is developed. To accommodate terminals, the exploration of solutions with bigger gaps between jobs is performed so that they can distribute their operations more evenly. Meanwhile, LMCs gain more flexibility by providing them with schedules that allow for double moves, leading to reduced resource utilization.
The developed model allowed for the evaluation of the effect of the TAS on drayage operations with and without collaborative parameters in the process. Experimental results indicate that (1) as the problem size grows, the time required to find a solution increases considerably, but high-quality solutions are obtained quickly nonetheless; (2) the objective function can vary significantly based on the pattern of arrival preferences examined, indicating that application of the mechanism may be more appropriate under a day-by-day manner; (3) assuming revenue maximization, the TAS can service an average of 96% of trucks across various instances within their defined limits and terminal imposed parameters in the base scenario; (4) exploration of collaborative parameters can be accelerated when using the base solution as a warm-start; and (5) under the inclusion of collaboration, the applied pricing policy that incorporates a price reduction due to collaboration-related inconvenience results in greater utility for trucking companies on average.
Nevertheless, the partially decentralized nature of this approach comes with several inherent limitations. Firstly, the auction-based method could potentially lead to uneven resource distribution, based on the financial strength of the involved parties. This might result in certain participants obtaining more favorable time slots or resources, leaving others to grapple with congestion or delays, but this effect can be remedied through the inclusion of market power constraints [
29]. Moreover, this decentralized setup presents fewer chances for direct optimization due to reduced control by the MTOs. It is also worth acknowledging that implementing this approach in a real-world scenario might encounter substantial resistance to change, particularly from participants who are accustomed to conventional methods. Overall, this marks the first attempt to develop a transparent and flexible TAS. Therefore, in order to facilitate a more practical implementation of the proposed method, it may be necessary to conduct additional refinement of the assumptions used in the model. For example, modifying Assumption 2 to better reflect fleet size limitations might require model enhancements to preemptively incentivize more double moves for better fleet utilization. Additionally, a more detailed mapping of internal port operations (such as rehandling) would further enhance the practical relevance of the TAS and overall benefit to the involved stakeholders.
In subsequent studies, attention will be directed towards modeling and enabling collaboration between stakeholders in the port area. As TAS remains the clearest form of communication between port terminals and companies, it can act as a foundation for developing a multiagent system with all involved parties that can fully support collaboration. Additionally, in this study, utilities of agents from acquiring a slot were generated randomly and merely treated as input for the auction. A dedicated study that clearly maps the derived utility of a company could pave the way to a better understanding of the decision making behind logistics companies and lead to the adoption of further measures of demand management for port terminals. Simultaneously, while the proposed TAS is adept at managing demand for medium-sized terminals, such as the one it was initially designed for, scaling its application to larger terminals can be facilitated by the development of a specialized heuristic. Finally, introducing uncertainty within the developed models will greatly improve the quality of the solutions. The utilization of stochastic recourse programming and scenario generation could improve the robustness of the derived schedules under uncertainty. Overall, it is clear that auction-based scheduling algorithms hold significant potential for resolving conflicts for TAS. It will be interesting to observe how this approach continues to develop in the future.


