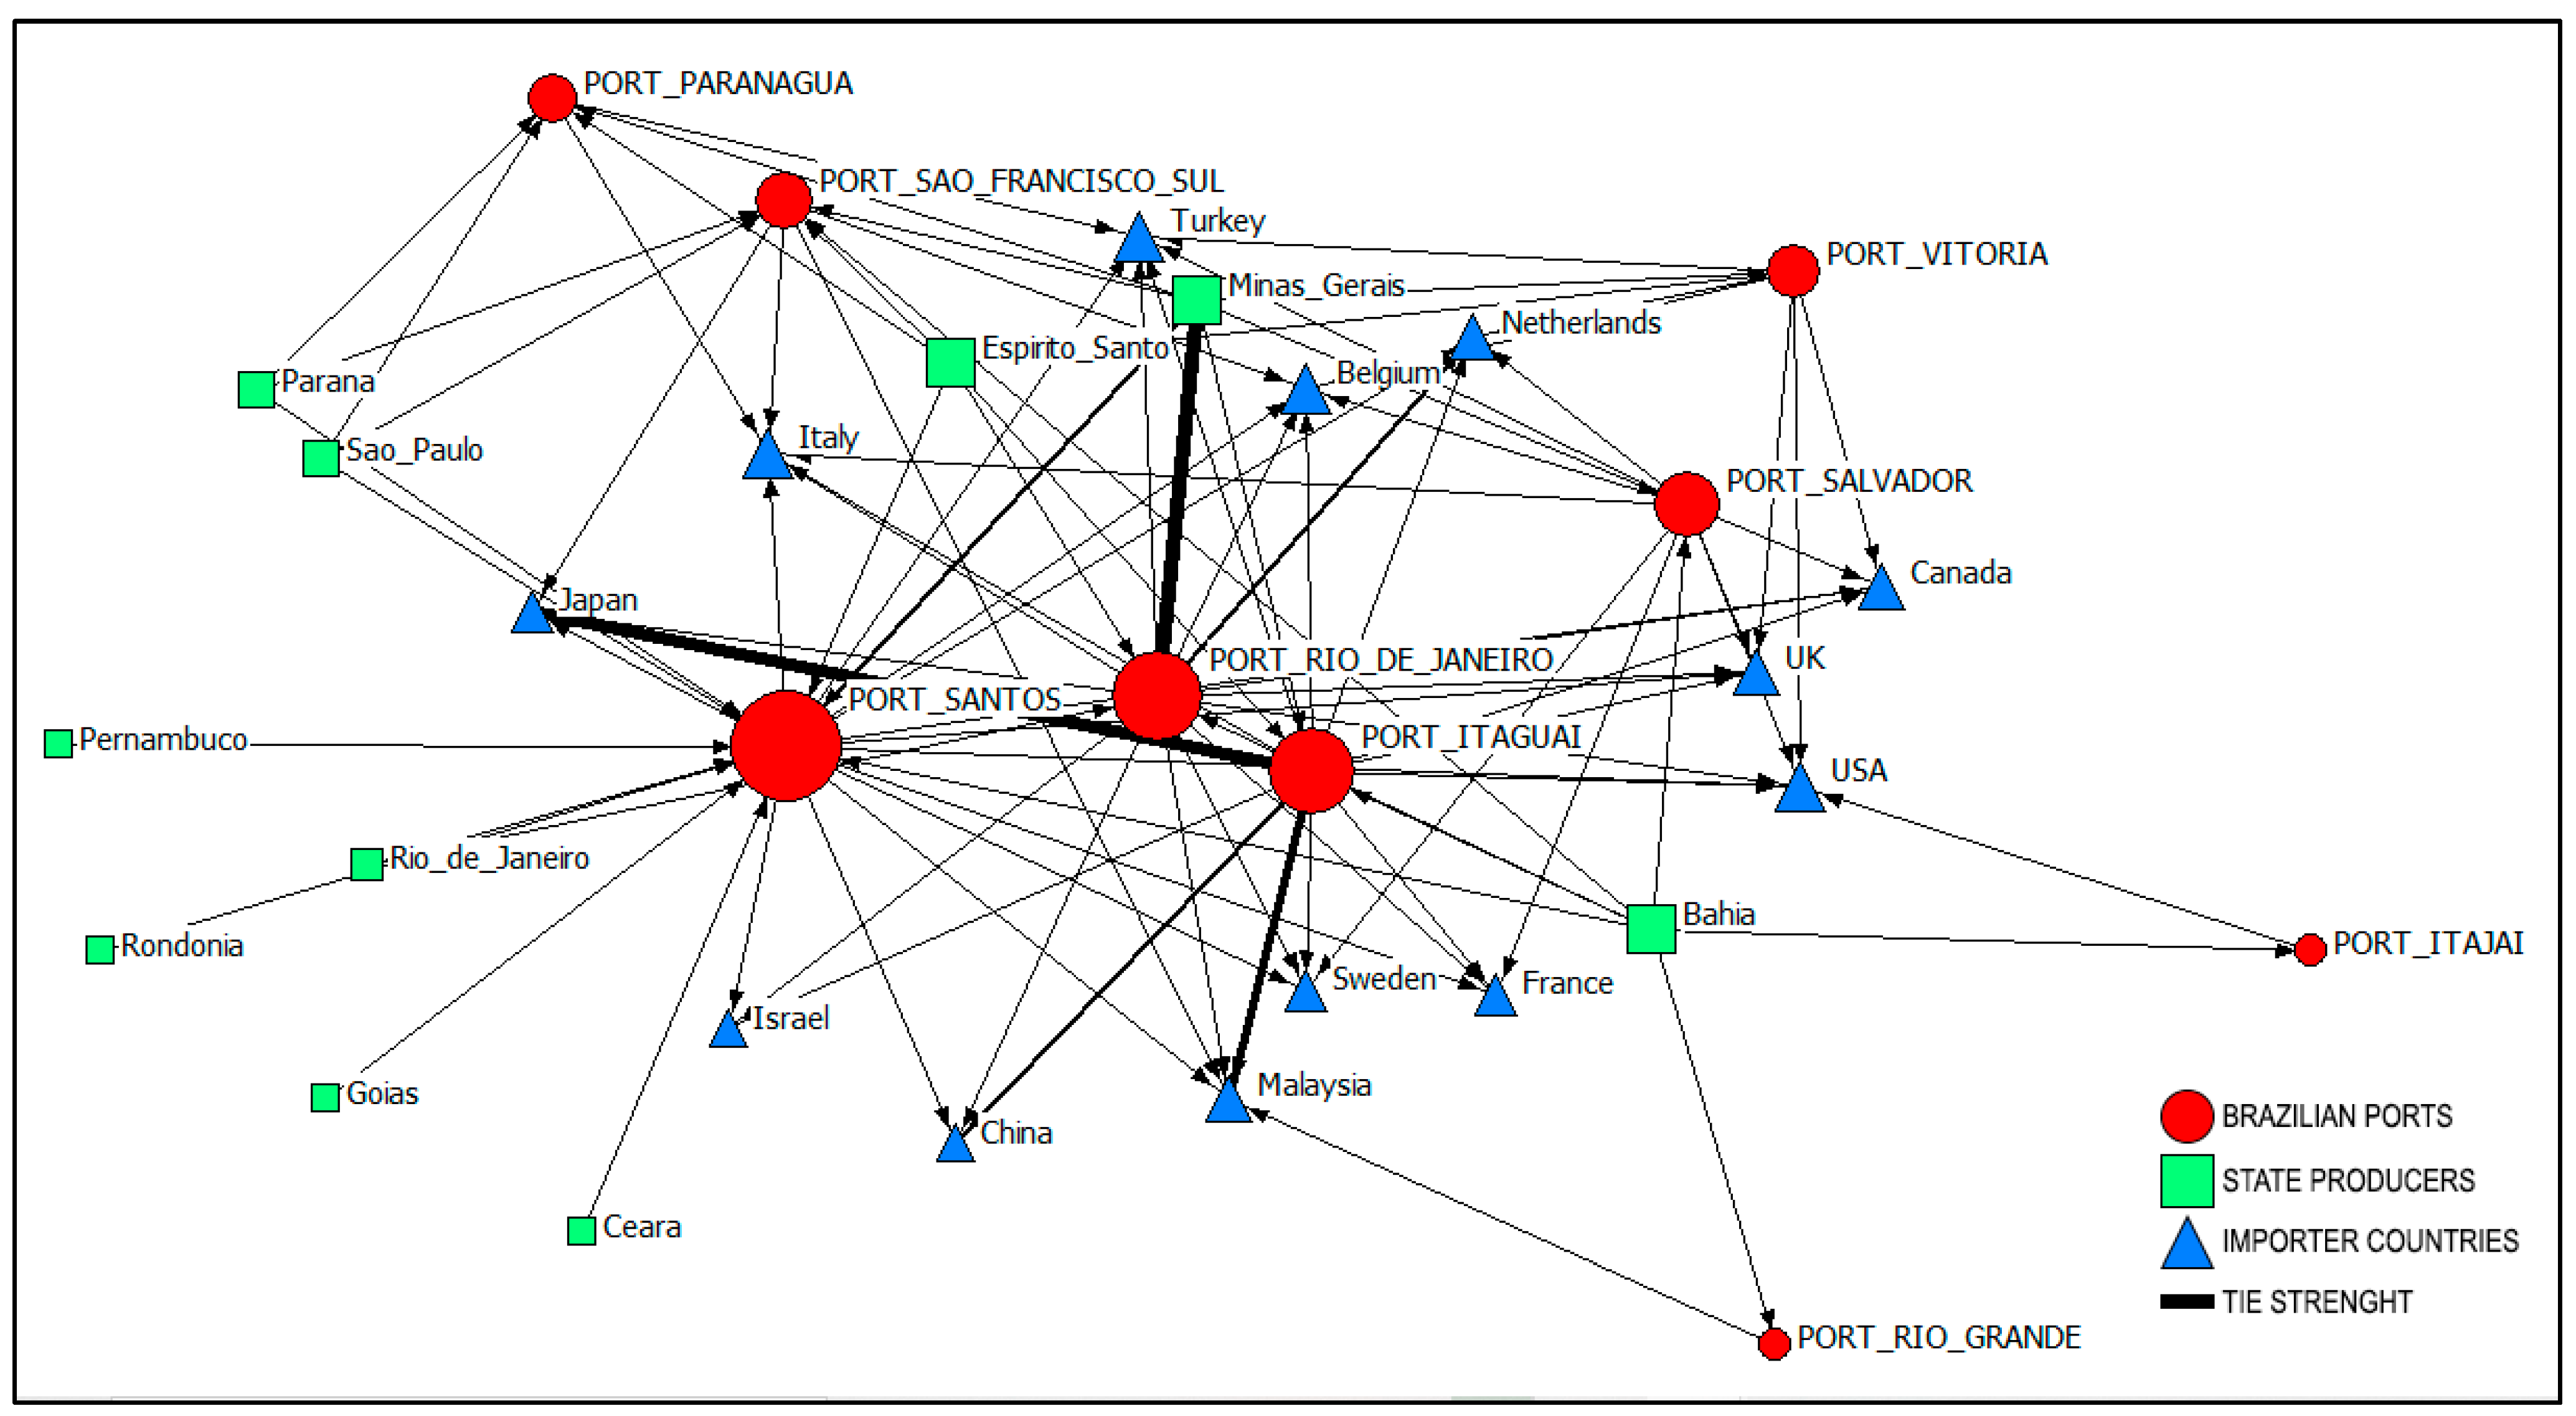
4.1. Main Analysis
Degree centrality in SNA analysis refers to the number of connections that one node has. It represents the actors/nodes at the center of interactions in the network [
43]. Freeman [
44] points out that a node located at the center of the network is assumed to be structurally more central than any other node and does appear to be in some special position related to the overall structure.
The degree centrality of our data can be seen in a graphical form in
Figure 1 and specified as the number and volume of interactions in
Table 2,
Table 3,
Table 4 and
Table 5—indegree (entering in the node) and outdegree relations (outing of the node).
The main ports established a cluster composed of the Port of Santos, Port of Rio de Janeiro, and Port of Itaguai. They have the highest number of connections incoming and outgoing, as well as volume received and exported. They appear as the main gateway of the network. However, our results show a trend, with Port of Santos being the main corridor of coffee exports. Ports of Itaguai and Rio de Janeiro together move around the equivalent of three-quarters of the total coffee exported by Port of Santos, which is the main corridor of exportation.
These three ports are located in the southeast region of Brazil. Together, they move 99% of the green coffee exported. Moreover, they connect all 13 importer countries but only Port of Santos receives shipments from 10 producer states. Considering the degree centrality theory, Santos is the main logistical corridor in volume and connects all the nodes buying or selling green coffee beans from Brazil.
Considering the volume of cargo for a unique country, the Port of Itajai is the most representative, connecting Japan, Malaysia, and the US. Regarding the countries, Asia imported 63%, North America 19%, and Europe 17%. Belgium, Sweden, and the US are the most representative in the network, considering the connections (6 states). However, the biggest in volume are Japan (51%), the US (18%) and the UK (12%).
Coffee has been one of the most popular beverages worldwide since the mid-sixteenth century; the US is the largest country consumer (25 million bags), followed by Brazil (20 million bags) [
45]. Considering country groups, the European Union has the highest consumption (42 million bags), while the strongest growth rates are found in Asia and Oceania [
45].
Our data analysis indicated that Japan, the US, and the UK were the main destinations of Brazilian green coffee between 2018 and 2022, accounting for 80.9%. According to Conselho dos Exportadores de Cafe do Brasil—CECAFE, considering crop years between July 2018 and May 2023, the Brazilian green coffee exports were 169,273,732 bags of 60 kg [
46].
Considering the consumption per capita in the UK and Japan, with a long tradition of tea consumption, it was 3.6 kg, while in the US, where coffee is deeply rooted in consumer culture, the consumption per capita was 4.5 kg [
45].
In Japan, coffee occupies a massive niche in everyday life and consumption, and the country is the number three importer of coffee beans worldwide after the United States and Germany [
47]. They prefer imported coffee as a grain and roast internally because Japanese coffee equipment is considered to be among the best in the world [
48]. Interesting to note is that Japan was targeted in the late 19th century as the country that would start the coffee industry of Brazil [
48].
In the United States, the estimated proportion of coffee consumers is 74.7%, representing 154.4 million US adults. In addition, the prevalence of coffee drinking did not differ by sex or general health condition, or by education or household income [
49]. Moreover, Erikka et al. [
49] conclude in their study that coffee drinking is widespread but varies across categories of age, race/ethnicity, smoking, and alcohol intake, with younger adults, non-Hispanic blacks, never smokers, and nondrinkers of alcohol being less likely to drink coffee than their counterparts.
Raw coffee (green coffee beans) is the single most-traded non-oil commodity in the world because it depends on the geo-location of coffee plantations, soil conditions, management, and specific climatic factors that determine both the quantity and the quality of the beans harvested [
50]. Due to that, there is a dependency on the US to import the commodities; the Japanese suffer from the same pressure to maintain the coffee habit. On the other hand, export countries have significant dependence on coffee production and exports, considering the GDP of Honduras (20%), Guatemala (13%), and Colombia (6%) [
50]. In Brazil’s case, the coffee share of the country worldwide was 33% and represented BRL 34.5 billion [
51].
The UK is the fifth largest coffee consumer in Europe, where approximately 95 million cups are consumed daily. Around 181,000 tons of green coffee beans are imported every year to the UK to be processed and consumed, with 66% of the total coming from Brazil, Vietnam, Colombia, and Honduras [
1].
Therefore, we can conclude that these countries are the main importers due to the huge internal consumption and efficient local industry that requires raw material (green coffee) for producer countries once coffee production is sensitive to climate conditions. The results aligned with the literature investigation, allowing us to identify an interesting fact; namely, that coffee beverages are also finding ground in cultures with a long history of tea consumption.
From the state producers’ perspective, Minas Gerais accounted for 99.5% of the coffee exported using 8 ports, and used the corridor of Santos in Sao Paulo state and Itaguai and Rio de Janeiro in Rio de Janeiro state. The reason why is that the South of Minas Gerais has a high altitude, averaging 950 m, and a mild annual temperature of around 22 °C, with small farms ranging from 10 to 100 ha [
10]. However, production is also present in Cerrado Mineiro, where farms range from medium-sized (2–300 ha) to large at an altitude of 800–1300 m, and Chapada de Minas where 80% of the producing farms are smaller than 20 ha [
10].
In Minas Gerais, the rural area of the regional capitals of Pouso Alegre and Varginha, in which the Municipality of Guaxupe is included, constitutes the central point of the coffee bean storage network in the Brazilian territory; this function is associated with its strategic position in relation not only to agricultural production areas but also to its access to national and international markets [
9].
Located in the city of Guaxupe, the Cooperativa Regional de Cafeicultores em Guaxupe Ltd. a—COOXUPE and the Exportadora de Cafe Guaxupe stand out in the commercialization of coffee at the national and international levels. A focal point in the geography of the production chain and the coffee logistics system in the city of Guaxupe is the presence of the Special Precinct for Export Customs Clearance—REDEX, administered by COOXUPE, which serves to streamline the time necessary for the export of this commodity; it also contributes to the reinforcement of the safety of this process and avoiding the waste of grains by moving full-load container cargo [
9].
Occupying a strategic position along Brazilian roadways, the BR-146 and BR-491, the Municipality of Guaxupe has connections with the Minas Gerais regions of Alto Paranaiba, Triangulo Mineiro, and Southern Minas Gerais, in addition to access to the territory of Sao Paulo and, in particular, its coastline and the port of Santos [
9].
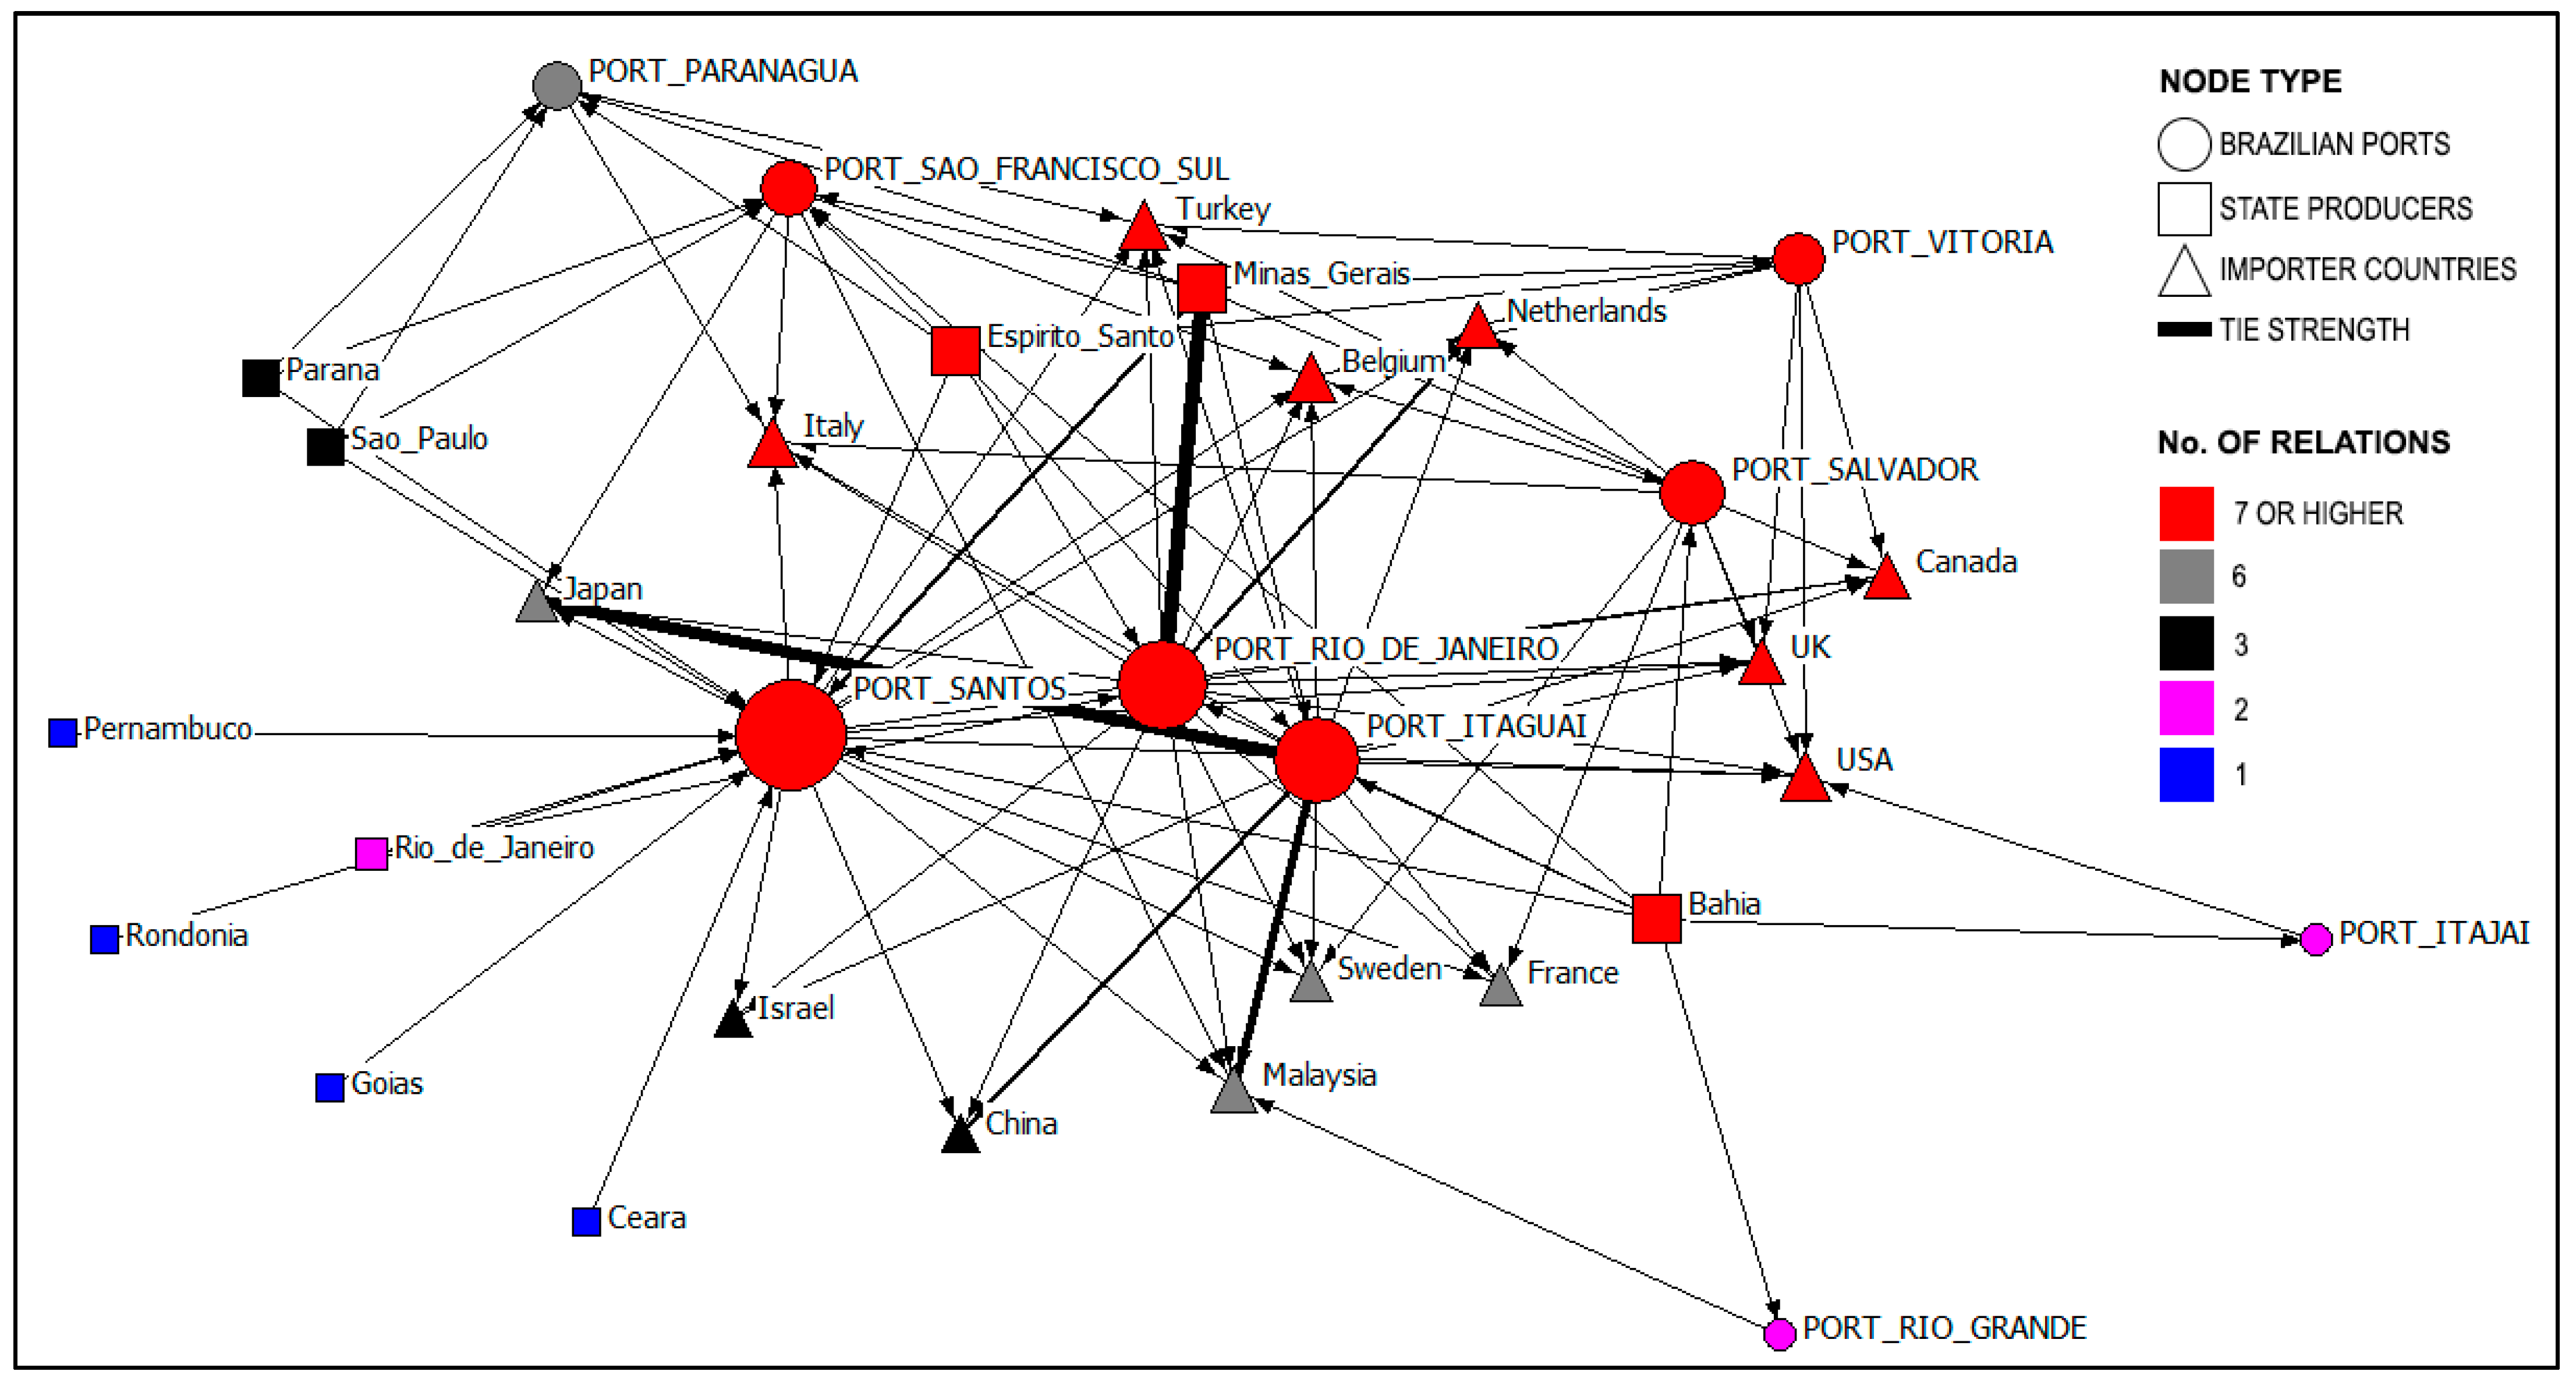
4.2. K-Core
The k-core is used to describe network characteristics which the degree distribution is unable to reveal, including the structural and hierarchical properties of the network system [
52]. Thus, the Brazilian green coffee exports network can be divided according to its importance,
Figure 2.
The main network is composed of six ports: Santos, Rio de Janeiro, Itaguai, Salvador, São Francisco do Sul and Vitória; seven countries: Italy, Turkey, Belgium, Netherlands, Canada, UK, and the US; and three state producers: Minas Gerais, Espirito Santo, and Bahia. To be part of this main network, a node needed at least five connections in the network. Even Japan, buying 51% of green coffee, only had four connections (grey nodes). Black nodes presented a k-core of three, pink nodes two, and blue nodes one. The size of the nodes is not connected to the k-core analysis; we maintained the structure presented in degree centrality, allowing us to compare both cases together.
Note that five countries are located in Europe and two in North America. As observed previously, the two regions bought 36.5% of Brazilian green coffee. Despite the volume, Japan is not included in the main network in the context of SNA analysis due to its logistics operations being connected to four ports; however, the k-core of four or more allows for the identification of almost all the volume exported and the logistics corridors—94% of the volume.
These results show the importance of analyzing k-core results in connection to the transaction volume. However, interesting results can be seen, including the predominance of rich countries as the main destination of Brazilian green coffee.
From state producers’ perspective, Minas Gerais confirms its role as the main source of coffee production in Brazil. Regarding ports, Santos, Rio de Janeiro, and Itaguai confirm their role as transportation hubs for coffee exports.


 ,
, 

