Abstract
Background: The corn supply chain is vital for food security and economic stability regionally and globally. This study integrates sustainable supply chain management with location optimization to address trade-offs from climate change, economic viability, and environmental impact while assuming the constant social obligation inherent in the supply chain structure. Methods: This study employs a mixed-integer programming (MIP) framework to optimize facility locations in North Dakota, including corn production zones as suppliers and ethanol plants as consumers. Primary objectives include cost minimization and greenhouse gas reduction, enabling the prioritization of economic or environmental goals as per organizational strategies and regulations. This approach ultimately maximizes resource utilization by ensuring efficient production and distribution practices. Results: The case study results highlight the optimal selection of 20 out of 30 corn production zones to meet statewide ethanol plant demand efficiently. Using compressed natural gas (CNG) instead of diesel could potentially save USD 2 million annually and cut carbon emissions by up to 1148 thousand tons per year, demonstrating meaningful progress toward economic and environmental sustainability within the supply network. Conclusions: The presented work offers a systematic methodology for designing sustainable supply chains for various agricultural products, aligning with the broader goal of promoting sustainability and resilience for efficient agricultural production and distribution systems.
1. Introduction
In recent decades, the strategic objectives surrounding complex supply chain management have undergone a significant transformation, with the recent increasing emphasis placed on sustainability and resilience []. Rajesh (2018) delineated this evolution, tracing the trajectory from traditional lean approaches to the integration of green and sustainable practices and from agile methodologies to the emergence of hybrid models such as leagile (lean and agile) and resilient supply chains []. They highlighted the difficulties existing supply chains face in adopting sustainable–resilient strategies, emphasizing the gradual integration of principles supporting resilient and sustainable supply networks. Atieh Ali et al. (2024) explored the complex relationship between supply chain resilience, digitization, and sustainability []. Their study shows a positive connection between supply chain resilience and long-term sustainability, with digitization playing a key role in speeding up this connection.
Unlike traditional supply chains, green supply chain optimization problem often seeks to balance multiple objectives, including reducing carbon emissions, minimizing transportation costs, and maximizing resource efficiency, all while meeting customer demand and regulatory requirements. Labiba et al. (2022) have highlighted various optimization approaches for addressing multiple conflicting objectives in sustainable and green supply chain management. These approaches, including classical methods, evolutionary algorithms, and iterative models, provide a comprehensive toolkit for optimizing green supply chains while navigating trade-offs between environmental, economic, and social objectives []. A recent trend is to incorporate big data and artificial intelligence (AI)-based approaches to improve sustainable performance through green supply chain collaboration, as summarized by Rashid (2024) []. Integrating optimization techniques, big data analytics, and AI-based solutions holds immense potential for enhancing the resilience and sustainability of green supply chains.
Climate change affects agriculture in many ways, like changing temperatures, rainfall patterns, and extreme weather. These changes can harm crops, reducing their yield and quality [,,]. Floods, droughts, and other weather extremes can damage crops and make them more vulnerable to pests and diseases []. Also, climate shifts may make some regions unsuitable for certain crops, so farmers need to adjust their practices []. These changes in agricultural production make it hard to optimize green supply chains. Fluctuations in crop yields and availability disrupt the flow of materials along the supply chain, affecting production schedules and inventory management []. This uncertainty also makes it tricky to decide where to place facilities, which routes to use for transportation, and where to store inventory.
This paper advocates for a holistic approach to addressing these challenges, integrating environmental sustainability into the fundamental decision-making processes of supply chains. Employing a mixed-integer programming (MIP) framework, this study constructs a model to determine optimal facility locations within the supply chain, including corn production zones as suppliers and ethanol plants as consumers. The primary objectives encompass minimizing transportation costs, mitigating greenhouse gas emissions, and optimizing resource utilization while fulfilling demand requirements. This approach ultimately maximizes resource utilization by ensuring efficient production and distribution practices within the supply chain network. The model incorporates geospatial corn crop data, considering various production and distribution factors such as tillage systems, fertilizers, seeding methods, agricultural machinery, and fuel choices as a basic comparative analysis.
The rest of this manuscript is organized as follows: Section 2 describes the materials and methods employed in this study, including the corn supply chain descriptions, emissions analysis, and mathematical formulations for the location optimization task. Section 3 details the case study results of the optimized location and the trade-offs in total costs and carbon emissions in various ground transportation options. Section 4 discusses the implications of this study, its limitations, and potential future refinement. Finally, Section 5 concludes this manuscript.
2. Materials and Methods
2.1. Literature Review
The intersection of sustainability and supply chain resilience has become particularly pertinent in the context of climate change, as organizations are increasingly confronted with the impacts of climate variability on supply chain operations. Green supply chain management has emerged as a critical strategy to cope with the environmental aspect. It enables organizations to reduce their environmental impact while simultaneously enhancing operational efficiency. The main objectives of green supply chain management lie in optimizing location decisions, a complex process that involves selecting the most environmentally friendly locations for various supply chain activities such as manufacturing plants, distribution centers, and transportation routes. For example, Gholipour et al. (2020) created a bi-objective mixed-integer linear programming (MILP) model to solve inventory-location-routing problems in green supply chains for automotive parts, aiming to minimize costs and shortages []. Sherif et al. (2021) suggested a combined method to solve two problems: transportation and inventory management at one level and routing for green vehicles at another level. They used a software called GAMS 23.5 and a simulated annealing algorithm []. Yu and Khan (2022) developed a multi-objective uncertain equilibrium model for a three-level supply chain to minimize costs and carbon emissions in a random and fuzzy environment []. Tirkolaee et al. (2023) addressed disruption, environmental pollution, and energy-efficient vehicle concerns as a two-echelon multi-product location allocation routing problem (LARP) []. Masruroh et al. (2024) suggested using two priority-based algorithms, a priority-based non-dominating sorting genetic algorithm II (pb-NSGA-II) and priority-based multi-objective particle swarm optimization (pb-MOPSO), to address demand variability, disruptions, and sustainability supply chain issues [].
Despite its potential benefits, green supply chain location optimization poses several challenges in the realm of fluctuating supplies of crops. Firstly, there is often a lack of comprehensive data on environmental factors, such as emissions levels, renewable energy availability, and waste management infrastructure, which are crucial for making informed location decisions. Additionally, the dynamic nature of environmental regulations and market conditions adds another layer of complexity, requiring organizations to adapt their strategies to remain competitive and compliant. Moreover, incorporating sustainability considerations into traditional location optimization models can lead to trade-offs between environmental goals and cost efficiency, requiring innovative approaches to find optimal solutions. The fluctuating supplies caused by climate change pose significant challenges to the resilient and sustainable operations of green supply chains. Thus, innovative strategies and frameworks are necessary to mitigate risks and improve resilience within supply chain applications, particularly in the context of food supply chains.
This study contributes scientifically to the existing literature by introducing a systematic methodology for designing sustainable supply chains in agriculture, integrating location optimization techniques with sustainable supply chain management principles under multiple constraints. Instead of modeling a bi-level objective where one objective is prioritized over another or where the economic and environmental goals are merged into a single minimization function, this study maintains them as separate objectives. This allows for detailed analysis under the same constraints, offering decision-makers the flexibility to understand and prioritize either economic efficiency or environmental sustainability based on organizational needs and strategies. The mathematical formulations incorporate historical data, which can be updated dynamically to reflect evolving conditions and enhance the accuracy and applicability of the model over time. This adaptive approach contributes to the robustness of the proposed approach in addressing real-world complexities and supports ongoing optimization efforts in agricultural supply chain management. For example, it allows a unique aspect of integrating alternative fuel sources, such as CNG, to highlight potential pathways for reducing carbon emissions and operational costs. Overall, this study provides valuable insights and practical solutions for improving sustainability and efficiency in agricultural supply chains, particularly in the context of the corn supply chain.
2.2. Green Supply Overview
In contrast to traditional supply chains prioritizing cost efficiency and operational performance, green supply chains emphasize sustainability factors across every stage, from sourcing raw materials to delivering products to consumers, as illustrated in Figure 1. While ensuring labor wellbeing remains a constant consideration, the primary focus of debate within green supply chains revolves around overall operating costs and carbon emissions, particularly in production and distribution processes. The pursuit of emission reduction frequently entails the introduction of new technologies, which may initially raise capital investment or overall expenses. This balancing act between environmental responsibility and economic viability presents a key challenge for industries or businesses committed to green practices as they seek strategies that minimize environmental impact without increasing financial burdens. To illustrate the complexities and considerations involved in green supply chain management, this paper will present a case study of a corn supply chain.
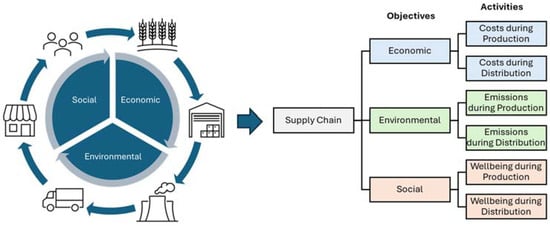
Figure 1.
Green supply chain with three sustainability objectives.
2.3. Corn Supply Chain
Corn, a staple crop with diverse uses ranging from food and feed production to biofuel, presents a prime example of a commodity with significant environmental implications throughout its supply chain. This paper employed the corn supply chain in the state of North Dakota (ND) to ensure the case study remains manageable in scope and can be easily replicated. According to the North Dakota Corn Council (NDCC), corn is the third most important crop in terms of area planted and the second most important crop for the state in terms of gross value []. Figure 2 summarizes ND’s corn production for the past five years.
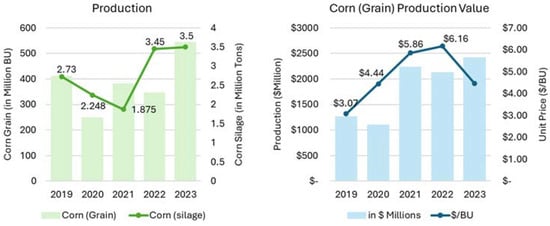
Figure 2.
North Dakota corn production and its value from 2019–2023.
Based on the statistics from the United States Department of Agriculture (USDA) National Agricultural Statistics Service (NASS), ND achieved a significant yield in corn production, with 143 bushels (BU) per acre of corn grain and 17.5 tons per acre of corn silage in 2023 []. These impressive yields amounted to approximately 543.4 million bushels of corn grain and 3.5 million tons of corn silage. A unit price of USD 4.45 per bushel for corn grain translated to an estimated production value of about USD 2.4 billion. Corn grain refers to the harvested seeds of the corn plant. These seeds are typically dried and stored for various purposes, including human consumption, livestock feed, and industrial uses. Corn silage is made from the entire corn plant, including the stalks, leaves, and ears, which are harvested and chopped into small pieces.
North Dakota is among the top 10 fuel ethanol-producing states in the US, and its six ethanol plants manufacture about 547 million gallons a year []. According to the North Dakota Ethanol Council (NDEC), the ethanol plants annually purchase 40% to 60% of the ND state’s total corn production, using about 160–180 million bushels of corn annually []. Thus, a general supply chain structure was considered between corn production zones and ethanol plants in North Dakota for the case study scope, as shown in Figure 3.
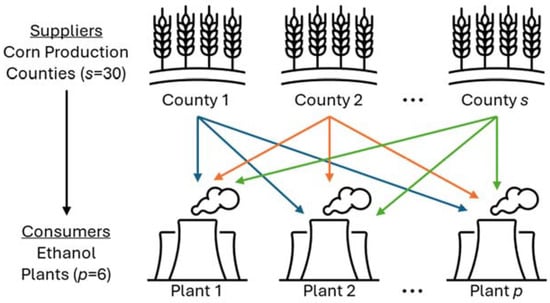
Figure 3.
A general representative of the ND corn supply chain network has 30 suppliers and six consumers.
Among the 46 corn production counties in ND, 30 counties with the highest corn production rates were considered in this case study as the suppliers’ corn production zones. The six ethanol plants in the state were regarded as the consumers. An assumption was made that these corn production zones could supply 100% of the produced corn to the ethanol plants. Table 1 presents the overall capacity of the top 30 corn production counties in 2021 [].

Table 1.
The overall capacity of the top 30 corn production counties.
Table 2 demonstrates the annual corn demand for ethanol plants and the plant capacity []. To maintain confidentiality, the specific names of the plants are not disclosed in this paper. Additionally, the demand and capacity numbers provided are approximated to safeguard proprietary information while still providing relevant insights. Although these numbers are approximate estimations and may not reflect the most current operational status of the plant, the amount of corn required does not typically change every year and is restricted by the plant’s capacity. One bushel of corn can produce roughly 2.8 gallons of ethanol and 18 pounds of leftover corn products for livestock feed []. Considering the general supply chain structure in Figure 3, the objective was to optimize logistics routes according to total costs and carbon emissions during production and distribution activities.
Table 2.
The annual corn demand from ethanol plants.
2.4. Sustainability Consideration
The total cost and carbon emissions in corn logistics are contingent upon the practices associated with corn agriculture production and distribution. For instance, variations in how seedbeds are prepared during corn harvesting can significantly impact overall harvesting expenses and carbon footprints. Similarly, the type of fuel utilized during transportation activities can also influence overall transportation costs and carbon emissions.
2.4.1. Production Costs and Emissions
From an agricultural perspective, during corn production, conventional and no-tillage systems are typically utilized []. Due to a lack of available data specific to each corn production zone, the conventional tillage system was assumed to be uniformly utilized to assess the overall cost and carbon emissions during corn production activities. The overall cost and carbon emissions for 1 ton of corn production using a conventional tillage system were assumed to be USD 227.73 and 184.8 kg, respectively []. Based on the 2021 data, for the selected 30 corn production counties, approximately 8964 thousand tons of corn are produced on 3,486,600 acres. So, the average labor price per ton of corn production was USD 12.85. The average labor cost per acre was around USD 5 []. Table 3 provides a breakdown of the activities associated with production consumption and the unit cost of utilizing the conventional tillage system for various production activities.
Table 3.
Data for various activities involved in conventional tillage to produce 1 ton of corn grains.
Carbon emissions during agricultural production primarily arise from various farming processes, such as tillage operations and fertilizer usage. Tillage, such as plowing and cultivation, can release carbon dioxide (CO2) stored in the soil into the atmosphere [,]. Additionally, the application of synthetic fertilizers contributes to carbon emissions. Nitrogen fertilizers, in particular, can lead to the release of nitrous oxide (N2O) [], a potent greenhouse gas, through processes like nitrification and denitrification [,]. Apart from these direct carbon emissions associated with corn production activities, it is essential to consider the carbon emissions from machinery operation, spare parts, and other inputs utilized throughout the production process. Agricultural machinery, including tractors, combines, and irrigation systems, often run on fossil fuels, emitting CO2 during operation []. While farms rely on various energy sources, diesel remains the primary fuel for powering most farming equipment [].
2.4.2. Distribution Costs and Emissions
In addition to assessing agricultural activities, this study also considers the costs and carbon emissions associated with distribution activities, such as transportation and logistics. Truck transportation is still considered the predominant logistics mode within the state for distribution efforts. This study compared the total costs and carbon emissions associated with two truck options for ground transportation: one equipped with a diesel engine and the other with a natural gas engine running on compressed natural gas (CNG). Traditionally, diesel fuel has been the preferred transportation option. However, with diesel prices constantly increasing, this study also contributes to exploring alternative fuel sources, such as CNG, to alleviate logistic costs while minimizing carbon emissions.
Diesel fuel, a staple in agricultural operations and transportation applications, is derived from crude oil or biomass materials []. In contrast, CNG primarily consists of methane gas, typically ranging from 70 to 90% [], with the exact percentage varying depending on factors such as the source of the natural gas and the compression process used. CNG engines are known for their potential to reduce greenhouse gas (GHG) emissions by up to 20% compared to diesel engines [,]. However, despite this environmental advantage, widespread availability remains a challenge for CNG fuel, unlike diesel, which is more readily accessible.
For this case study, a 25-ton heavy-duty CNG truck was assumed to have an average fuel economy of 5.28 miles/gal, and fuel cost was USD 2.57/gallon (gal) []. Carbon emission for the CNG truck was assumed to be similar to the LNG (liquefied natural gas) truck, which was around 0.044 kg/ton-km []. Table 4 summarizes the data related to fuel cost and carbon emissions.
Table 4.
Data on fuel costs and carbon emissions for trucks with diesel and CNG options [,].
2.5. Mathematical Formulation
Model Assumptions. The model assumptions for this case study follow a general network optimization model for simplicity. These assumptions can be customized or detailed in future research, and the assumptions in this case study are as follows:
- The demand of customers is known and must be satisfied.
- The maximum capacities of the corn production zones are known.
- Conventional tillage is employed across the corn production zone.
- No inventory is allowed in corn production zones.
- Ground transportation via truck is the sole mode considered.
2.5.1. Variables and Parameters
Table 5 lists the sets and decision variables, and Table 6 lists the parameters employed in the model formulations.
Table 5.
Sets and decision variables used in the model formulations.
Table 6.
Parameters used in the model formulations.
2.5.2. Objective Functions
Equation (1) denote the two objective functions of the case study, which represent the minimization of the total cost and the minimization of the carbon emission, respectively, for both production and distribution activities in the corn supply chain network. The first objective function considers the cost of seeds and fertilizer, machinery and spare parts, and fuel costs. The second objective function considers the carbon emission during harvesting and transporting from the corn production zone to the ethanol plant.
Economic efficiency and environmental sustainability are formulated as distinct minimization objectives in this study for two key reasons:
- Cost Minimization: Minimizing costs is a common goal in business and logistics management because it improves efficiency and profitability. By reducing costs and remaining competitive in the market, the supply chain can achieve higher profitability margins.
- Carbon Emission Minimization: Minimizing carbon emissions is essential for environmental sustainability and reducing the supply chain’s carbon footprint. By minimizing carbon emissions, the supply chain can mitigate its environmental impact, comply with regulations, and contribute to efforts to combat climate change.
In this research, the weighted sum approach is applied to solve the multi-objective optimization problem. The mathematical formulation of the weighted sum approach is given in Equation (2). In this approach, multiple objectives are converted into a single combined objective (FT) by assigning a weight (w) between 0 and 1 to each individual objective (Fi), with the sum of the weights for all objectives equal to 1 []. The importance of objective functions can be tailored by adjusting the weights according to the preferences of the decision-maker.
However, it is important to recognize that reducing carbon emissions often entails additional investment costs, which can increase the overall expense []. While analyzing the sustainability aspects, both objective functions are kept separate and solved with the same constraints to analyze the model’s performance in decision-making activities. Although these objectives are treated distinctly within the optimization model (not merged into a single function), the decision-making process involves balancing and optimizing common decision variables presented in both objectives. This setup also allows decision-makers the flexibility to consider two extreme scenarios: one prioritizing economic concerns in distribution activities and another emphasizing environmental concerns.
2.5.3. Constraints
Equations (3)–(7) signify the constraints employed in the case study. Equations (3) and (4) represent the capacity and demand constraints of the corn production zones and ethanol plants, respectively. Equation (5) highlights that no quantity will be shipped to the ethanol plant if the corn production zone is not selected. Equations (6) and (7) represent the binary and non-negativity constraints of the problem.
Subject to
2.6. Solver
The corn supply chain case study was modeled as a mixed-integer programming (MIP) problem. Given the well-established nature of MIP, the step-by-step methods are not elaborated further. Utilizing the MIP approach, the mathematical formulation in Section 2.5 was meticulously crafted to capture various decision variables and constraints, effectively describing the complex relationships and dependencies in the presented corn supply chain network. To solve this optimization problem, advanced optimization software was employed using IBM’s CPLEX 20.1.0. This is a state-of-the-art optimization solver renowned for its efficiency and robustness in handling large-scale optimization problems. CPLEX utilizes cutting-edge algorithms and computational techniques to explore the solution space and identify the optimal solution that minimizes the objective function while satisfying all constraints. With the computational power of CPLEX, the optimization process was streamlined, allowing for the exploration of numerous scenarios and strategies to optimize the location of corn production zones and minimize the overall cost.
3. Results
3.1. Case Study Results
Based on equal importance of both cost and carbon emission objectives, the optimum quantity required to be transferred from each corn production zone to satisfy the demands of the ethanol production plants across the state is highlighted in Table 7. It should be noted that the results obtained are based on historical data, the model’s formulation, and some assumptions made to reduce the complexity of the case study. While these results may not fully represent the entirety of the corn supply chain scenario across ND, they offer valuable insights into the complexities and considerations of green supply chain management within the context of corn production and distribution in the state.
Table 7.
Optimum quantity of corn transported from corn production zones to ethanol plants.
The optimization results identify the optimum location for the corn production zones and the ethanol plants, as pictured in Figure 4. The selected suppliers, shaded in green and positioned relative to consumer locations, represent the optimal choices identified by the study. Out of the 30 corn production zones considered, only 20 selected suppliers are deemed sufficient to fulfill the demand of the ethanol plants, indicating a strategic allocation of resources for maximum efficiency. In this study, efficiency is determined by the minimization of total costs and the minimization of carbon emissions.
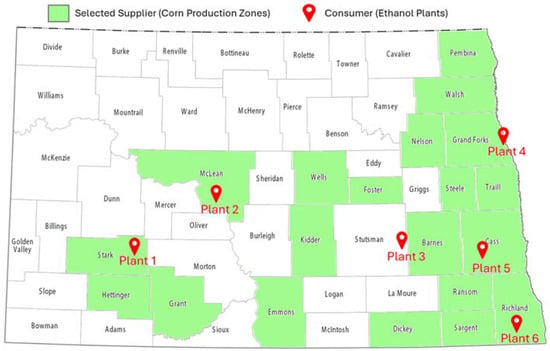
Figure 4.
Results of the selected corn supply zones and ethanol plants.
The case study results indicate that the ideal locations for the chosen corn production zones should be close to their corresponding ethanol plants. However, while this proximity offers logistical and environmental advantages, practical, economic, and historical factors such as business agreements often influence the current practice, which may not always prioritize proximity. Even so, opting for these optimized locations aims to minimize travel distances, reducing transportation costs and carbon emissions across the state despite their deviation from standard practices. Additionally, from the location optimization perspective, the case study simulation also involved testing different weights to capture the trade-offs or sensitivity between objectives: minimizing total cost and reducing emissions. Each objective function, either total cost or emissions, was weighted on a scale from 0 to 1, ensuring that the combined weights for both objectives sum to 1. However, the additional analysis did not alter the selection of locations in Table 7 because of the inherent interaction between these objectives. Specifically, locations chosen to minimize cost often also naturally minimize emissions, or vice versa.
3.2. Sustainability Consideration Results
For sustainability considerations, additional analysis was undertaken to examine the viability of two different types of fuel: diesel and CNG. The same mathematical model was utilized, and adjustments were made to the fuel properties when diesel fuel was changed to CNG fuel. This investigation demonstrates the commitment to exploring environmentally friendly alternatives for ground transportation. Figure 5 shows the comparison between the total cost on the right axis and total carbon emission on the left axis using two different fuels. The results indicate that the optimal quantity consumed remained the same for both cases. However, a precise observation from the results is that utilizing CNG fuel can effectively reduce the overall cost and carbon emissions.
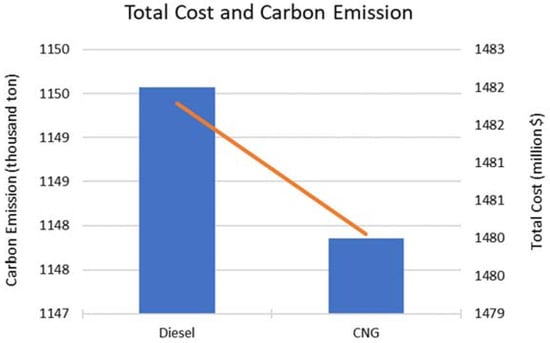
Figure 5.
Total cost and carbon emission comparisons for diesel and CNG ground transportation options.
Compared to traditional diesel fuel, using CNG can reduce approximately 0.14% of total expenses and 0.13% of carbon emissions. The overall cost of diesel fuel is around USD 1482 million, whereas the cost of utilizing CNG fuel is around USD 1480 million. So, changing ground transportation energy could result in an annual cost savings of nearly USD 2 million in total. Similarly, overall carbon emissions can be reduced by up to 1148 thousand tons per year, according to the result of the case study. While the percentage reductions in costs and emissions may be modest, the absolute savings of more than USD 2 million in costs and the reduction of over 1.49 thousand tons in carbon emissions can still represent meaningful progress toward economic and environmental sustainability goals. Although the improvement may seem insignificant in the grand scheme of things, the result indicates that using alternate fuel sources like CNG can still be beneficial when applied at a larger scale or over a long period to minimize the overall cost and carbon emissions.
3.3. Sensitivity Analysis
To offer more robust managerial insight, a sensitivity analysis was conducted to understand how transportation costs and carbon emissions influence decision-making and stakeholder preferences. Keeping production costs and carbon emissions from production activities constant, annual transportation costs are projected at USD 6.37 million using diesel trucks and USD 4.52 million with fully implemented CNG trucks. Regarding environmental impact, transportation from corn production zones to ethanol plants is estimated to generate approximately 17.97 thousand tons of carbon emissions annually with diesel trucks, compared to 16.48 thousand tons with CNG trucks.
Switching from diesel trucks to CNG trucks as the primary means of transportation necessitates additional investments to modify the existing infrastructure. This includes setting up CNG filling stations and acquiring or retrofitting CNG trucks, which may involve modifying current diesel trucks. According to the findings in Table 7, approximately 60–75 trucks are needed to transport the required quantities over the round-trip distance between corn production zones and the ethanol plants. This calculation was based on a 10 h driving limit per shift, two shifts per day, and 260 working days per year. Moreover, additional investments are necessary to retrofit the ethanol plant or establish nearby sites with CNG filling stations. Overall, these adjustments are estimated to require a total investment ranging from USD 5 million to USD 10 million.
Based on these scenarios, a sensitivity analysis was performed by varying environmental and economic objectives from 0% to 100%, where the sum of both objectives always equals 100%. A 0% environmental objective implies a 100% prioritization of the economic objective by stakeholders and vice versa. Both objectives are modeled as minimization functions, where lower expected values signify optimal decision outcomes in this sensitivity analysis. Figure 6 illustrates the results of varying levels of prioritization between environmental and economic objectives.
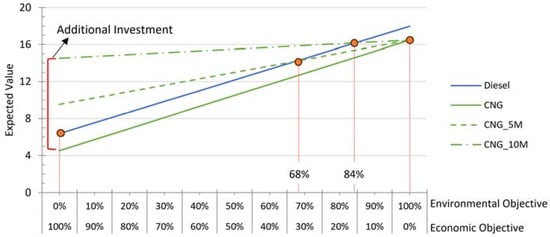
Figure 6.
Sensitivity analysis results with varying environmental and economic objective levels.
In extreme scenarios where economic concerns are prioritized exclusively in distribution activities, the current diesel infrastructure as a transportation option remains preferable. Conversely, options involving CNG trucks and retrofitting the existing infrastructure are favored in another extreme scenario where environmental considerations entirely outweigh economic concerns. However, to justify the additional investments required, stakeholders should prioritize environmental objectives by 68% and 84%, respectively, for investments of USD 5 million and USD 10 million to achieve economic balance with existing diesel transportation options. When fully implemented, as indicated by the solid green line in Figure 6, CNG can be the preferred transportation option regardless of economic or environmental objectives. It is important to note that these results are based on estimated values, and actual outcomes during implementation may vary due to factors such as regulations, market conditions, and technological advancements.
Conducting sensitivity analysis is instrumental in identifying opportunities and conveying decisions effectively to upper-management. By demonstrating how various parameters can affect economic and environmental objectives, this analysis may assist in well-informed decisions that balance economic considerations and environmental goals. Understanding these dynamics is crucial for developing sustainable transportation strategies to reduce costs and carbon footprints, promoting environmental responsibility and economic efficiency.
4. Discussion
The optimization strategies employed in modern supply chain management play a pivotal role in promoting sustainability and efficiency across various industries. In this context, the corn supply chain represents a critical area where innovative approaches are needed to address economic, environmental, and logistical challenges. This discussion presents a comprehensive analysis of location optimization strategies to foster a sustainable green supply chain for corn distribution. By examining data collection methods, mathematical formulations, and the integration of alternative fuel sources such as compressed natural gas (CNG), this study sheds light on the complexities and considerations involved in achieving sustainable outcomes within the corn supply chain. However, like all studies, our present study has certain limitations, which highlight the need for future work to address them
4.1. Theoretical and Practical Implications
The practical implications of this study provide valuable insights for policymakers and supply chain managers aiming to optimize location decisions to enhance sustainability and efficiency in the corn supply chain. By integrating alternative fuel sources such as CNG, the study highlights potential pathways for reducing carbon emissions and operational costs, which can inform strategic decisions in the agricultural sector. Theoretically, the study contributes to the existing green supply chain management literature by presenting a robust framework for location optimization under multiple constraints. It underscores the importance of considering economic and environmental objectives and sets the stage for future research to explore advanced and dynamic multi-objective optimization techniques that offer flexibility to adapt to evolving organizational strategies and regulatory requirements. This dual focus enhances our understanding of balancing competing goals in supply chain design, paving the way for more comprehensive and sustainable approaches in supply chain management.
4.2. Limitations
One limitation of the presented study is the reliance on historical data, which may not fully capture the current state of the corn supply chain. Additionally, the simplifying assumptions made in the mathematical formulations and optimization models may overlook specific nuances and complexities inherent in real-world scenarios. For instance, social factors that may impact overall sustainability are assumed to remain constant. The regional scope in the case study presented may not encompass all relevant factors influencing the sustainability of the corn supply chain globally. For example, producing and transporting spare parts, fertilizers, pesticides, and other inputs that may be sourced globally also contribute to carbon emissions, which is considered in assessing the overall carbon footprint of corn production. Furthermore, while alternative fuel sources like CNG presents promising opportunities for reducing carbon emissions, it is essential to recognize the challenges associated with the scalability and feasibility of implementing such solutions on a larger scale. For instance, opting for CNG energy for ground transportation entails significant additional investments and the consideration of carbon emissions resulting from CNG truck manufacturing. Operational challenges, such as the longer refueling times of CNG compared to diesel, can significantly affect the overall operating efficiency of the supply chain. These considerations highlight the need for further research and development. Addressing these challenges will be pivotal in advancing practical and sustainable solutions within the alternative ground transportation sector.
4.3. Future Work
For a more comprehensive understanding of the corn supply chain scenario across North Dakota, future research should focus on updating and refining the model with real-time data where available. Incorporating multi-year and near real-time data will enhance the accuracy and relevance of the logistic scenarios from the production zones to the ethanol plants, thereby improving decision-making and strategic planning. Moreover, future research efforts could greatly benefit from conducting a more thorough examination of socioeconomic, political, and cultural factors that may influence the adoption and success of sustainable corn production and distribution practices. Understanding these broader contextual factors is crucial for developing effective and holistic strategies to promote sustainability within the corn supply chain. The feasibility and practicality of alternative fuel strategies, such as CNG or other energy alternatives, should be evaluated by considering infrastructure requirements, regulatory considerations, and technological advancements. A more detailed sensitivity analysis and comparative studies will be incorporated into future models. More advanced multi-objective optimization techniques will be formulated to analyze trade-offs and provide more balanced and potentially dynamic solutions that align with the progressing social, economic, and environmental goals.
5. Conclusions
This work presents innovative location optimization strategies to foster a sustainable green supply chain for corn distribution. This study provides comprehensive details on data collection methods and mathematical formulations utilized for corn production and distribution in North Dakota. A significant contribution of this research lies in the consideration of two minimization objective functions, focusing on economic and environmental factors. Additionally, the study explores the optimization of the corn supply chain by investigating alternative fuel sources such as compressed natural gas (CNG). While our analysis revealed modest percentage reductions in total costs and carbon emissions, the absolute savings and emission reductions underscore the potential advantages of transitioning to greener fuel options.
The presented study has demonstrated the importance of considering economic, environmental, and logistical factors in decision-making processes for sustainable supply chain management in corn production and distribution. By leveraging historical data and optimization models, we provided valuable insights into the complexities and considerations involved in green supply chain management within this context. Future work could focus on refining optimization models and incorporating real-time data to enhance accuracy and relevance. Further research into the scalability and feasibility of implementing alternative fuel solutions on a larger scale would be beneficial. The findings reaffirm the value of proactive and holistic approaches to achieve sustainable outcomes in agricultural supply chains.
Author Contributions
Conceptualization, L.N.A. and N.Y.; methodology, L.N.A. and L.G.A.; validation, A.D. and N.Y.; formal analysis, L.N.A.; investigation, L.N.A. and L.G.A.; resources, N.Y.; writing—original draft preparation, L.N.A. and N.Y.; writing—review and editing, L.G.A. and A.D.; visualization, L.N.A., A.D. and N.Y.; supervision, A.D., L.G.A. and N.Y.; project administration, N.Y.; funding acquisition, N.Y. All authors have read and agreed to the published version of the manuscript.
Funding
This project is partially supported by the North Dakota Corn Council (NDCC), North Dakota Soybean Council (NCSC), and the North Dakota State University Established Program to Stimulate Competitive Research (NDSU-EPSCoR) Program.
Institutional Review Board Statement
Not applicable.
Informed Consent Statement
Not applicable.
Data Availability Statement
Data are available upon request.
Conflicts of Interest
The authors declare no conflicts of interest.
References
- Yodo, N.; Wang, P. Resilience analysis for complex supply chain systems using bayesian networks. In Proceedings of the 54th AIAA Aerospace Sciences Meeting, San Diego, CA, USA, 4–8 January 2016; p. 0474. [Google Scholar]
- Rajesh, R. On sustainability, resilience, and the sustainable–resilient supply networks. Sustain. Prod. Consum. 2018, 15, 74–88. [Google Scholar] [CrossRef]
- Atieh Ali, A.A.; Sharabati, A.-A.A.; Allahham, M.; Nasereddin, A.Y. The Relationship between Supply Chain Resilience and Digital Supply Chain and the Impact on Sustainability: Supply Chain Dynamism as a Moderator. Sustainability 2024, 16, 3082. [Google Scholar] [CrossRef]
- Asha, L.N.; Dey, A.; Yodo, N.; Aragon, L.G. Optimization approaches for multiple conflicting objectives in sustainable green supply chain management. Sustainability 2022, 14, 12790. [Google Scholar] [CrossRef]
- Rashid, A.; Baloch, N.; Rasheed, R.; Ngah, A.H. Big data analytics-artificial intelligence and sustainable performance through green supply chain practices in manufacturing firms of a developing country. J. Sci. Technol. Policy Manag. 2024; ahead-of-print. [Google Scholar]
- Rahman, M.M.; Chowdhury, M.M.I.; Al Amran, M.I.U.; Malik, K.; Abubakar, I.R.; Aina, Y.A.; Hasan, M.A.; Rahman, M.S.; Rahman, S.M. Climate change impacts on the food system security and sustainability in Bangladesh. J. Water Clim. Chang. 2024. [Google Scholar] [CrossRef]
- Shankar, S. Impacts of climate change on agriculture and food security. In Biotechnology for Sustainable Agriculture; Elsevier: Amsterdam, The Netherlands, 2018; pp. 207–234. [Google Scholar]
- Newton, A.C.; Johnson, S.N.; Gregory, P.J. Implications of climate change for diseases, crop yields and food security. Euphytica 2011, 179, 3–18. [Google Scholar] [CrossRef]
- Thomas, D.S.; Twyman, C.; Osbahr, H.; Hewitson, B. Adaptation to climate change and variability: Farmer responses to intra-seasonal precipitation trends in South Africa. Clim. Change 2007, 83, 301–322. [Google Scholar] [CrossRef]
- Halecki, W.; Bedla, D. Global wheat production and threats to supply chains in a volatile climate change and energy crisis. Resources 2022, 11, 118. [Google Scholar] [CrossRef]
- Gholipour, S.; Ashoftehfard, A.; Mina, H. Green supply chain network design considering inventory-location-routing problem: A fuzzy solution approach. Int. J. Logist. Syst. Manag. 2020, 35, 436–452. [Google Scholar] [CrossRef]
- Sherif, S.U.; Asokan, P.; Sasikumar, P.; Mathiyazhagan, K.; Jerald, J. Integrated optimization of transportation, inventory and vehicle routing with simultaneous pickup and delivery in two-echelon green supply chain network. J. Clean. Prod. 2021, 287, 125434. [Google Scholar] [CrossRef]
- Yu, Z.; Khan, S.A.R. Green supply chain network optimization under random and fuzzy environment. Int. J. Fuzzy Syst. 2022, 24, 1170–1181. [Google Scholar] [CrossRef]
- Tirkolaee, E.B.; Goli, A.; Mardani, A. A novel two-echelon hierarchical location-allocation-routing optimization for green energy-efficient logistics systems. Ann. Oper. Res. 2023, 324, 795–823. [Google Scholar] [CrossRef]
- Masruroh, N.A.; Rifai, A.P.; Mulyani, Y.P.; Ananta, V.S.; Luthfiansyah, M.F.; Winati, F.D. Priority-based multi-objective algorithms for green supply chain network design with disruption consideration. Prod. Eng. 2024, 18, 117–140. [Google Scholar] [CrossRef]
- Access Quick Stats (Searchable Database). 2022. Available online: https://quickstats.nass.usda.gov/results/D7EC1EAE-ECB5-3F02-A1A9-A491B41F9B36 (accessed on 15 April 2024).
- North Dakota State Profile and Energy Estimates. Available online: https://www.eia.gov/state/?sid=ND#:~:text=Quick%20Facts,of%20the%20nation%27s%20ethanol%20output. (accessed on 15 April 2024).
- North Dakota Ethanol Plants. Available online: https://www.ndethanol.org/nd-plants (accessed on 15 April 2024).
- Baker, M.L.; Babcock, B.A. Value Maximization from Corn Fractionation: Feed, Greenhouse Gas Reductions, and Cointegration of Ethanol and Livestock. 2008. Available online: https://ageconsearch.umn.edu/record/48714/files/Value%20Maximization%20from%20Corn%20Fractionation.pdf (accessed on 15 April 2024).
- Ransom, J.; Torrez, V.C.; Daigh, A.; Franzen, D.; Andrew, F.; Kenneth, H.; Joseph, I.; Janet, K. Basics of Corn Production in North Dakota. Available online: https://library.ndsu.edu/ir/bitstream/handle/10365/9363/A834_2004.pdf?sequence=1&isAllowed=y (accessed on 15 April 2024).
- Holka, M.; Bieńkowski, J. Carbon Footprint and Life-Cycle Costs of Maize Production in Conventional and Non-Inversion Tillage Systems. Agronomy 2020, 10, 1877. [Google Scholar] [CrossRef]
- Reicosky, D. Tillage-induced CO2 emission from soil. Nutr. Cycl. Agroecosystems 1997, 49, 273–285. [Google Scholar] [CrossRef]
- Wang, H.; Wang, S.; Yu, Q.; Zhang, Y.; Wang, R.; Li, J.; Wang, X. No tillage increases soil organic carbon storage and decreases carbon dioxide emission in the crop residue-returned farming system. J. Environ. Manag. 2020, 261, 110261. [Google Scholar] [CrossRef] [PubMed]
- Smith, K.; McTaggart, I.P.; Tsuruta, H. Emissions of N2O and NO associated with nitrogen fertilization in intensive agriculture, and the potential for mitigation. Soil Use Manag. 1997, 13, 296–304. [Google Scholar] [CrossRef]
- Ruser, R.; Schulz, R. The effect of nitrification inhibitors on the nitrous oxide (N2O) release from agricultural soils—A review. J. Plant Nutr. Soil Sci. 2015, 178, 171–188. [Google Scholar] [CrossRef]
- Wrage, N.; Velthof, G.L.; Van Beusichem, M.L.; Oenema, O. Role of nitrifier denitrification in the production of nitrous oxide. Soil Biol. Biochem. 2001, 33, 1723–1732. [Google Scholar] [CrossRef]
- Mantoam, E.J.; Angnes, G.; Mekonnen, M.M.; Romanelli, T.L. Energy, carbon and water footprints on agricultural machinery. Biosyst. Eng. 2020, 198, 304–322. [Google Scholar] [CrossRef]
- Frankelius, P.; Lindahl, M. Energy Solutions for Agricultural Machinery: From the Oil Era Towards a Sustainable Bioeconomy. In Bio# Futures: Foreseeing and Exploring the Bioeconomy; Springer: Berlin/Heidelberg, Germany, 2021; pp. 319–348. [Google Scholar]
- Mahmood, Y.; Chen, J.; Yodo, N.; Huang, Y. Optimizing natural gas pipeline risk assessment using hybrid fuzzy bayesian networks and expert elicitation for effective decision-making strategies. Gas Sci. Eng. 2024, 125, 205283. [Google Scholar] [CrossRef]
- Semin, R.A.B. A technical review of compressed natural gas as an alternative fuel for internal combustion engines. Am. J. Eng. Appl. Sci. 2008, 1, 302–311. [Google Scholar]
- Quiros, D.C.; Smith, J.; Thiruvengadam, A.; Huai, T.; Hu, S. Greenhouse gas emissions from heavy-duty natural gas, hybrid, and conventional diesel on-road trucks during freight transport. Atmos. Environ. 2017, 168, 36–45. [Google Scholar] [CrossRef]
- Rose, L.; Hussain, M.; Ahmed, S.; Malek, K.; Costanzo, R.; Kjeang, E. A comparative life cycle assessment of diesel and compressed natural gas powered refuse collection vehicles in a Canadian city. Energy Policy 2013, 52, 453–461. [Google Scholar] [CrossRef]
- Steve, J.; Larry, K.; Obi, O.; Chad, S.; Kush, T.; Grant, Z. The Per-Mile Costs of Operating Compressed Natural Gas Trucks. Available online: https://static1.squarespace.com/static/54df8befe4b0419b74c936c2/t/55f706f8e4b0c1c31ccc861d/1442252536965/ampCNG+White+Paper+on+12L+Operating+Costs+per+Mile.pdf (accessed on 15 April 2024).
- Gnap, J.; Dočkalik, M. Impact of the operation of LNG trucks on the environment. Open Eng. 2021, 11, 937–947. [Google Scholar] [CrossRef]
- Dey, A.; Zaman, K. A robust optimization approach for solving two-person games under interval uncertainty. Comput. Oper. Res. 2020, 119, 104937. [Google Scholar] [CrossRef]
- Ji, L.; Huang, G.; Niu, D.; Cai, Y.; Yin, J. A Stochastic Optimization Model for Carbon-Emission Reduction Investment and Sustainable Energy Planning under Cost-Risk Control. J. Environ. Inform. 2020, 36, 107. [Google Scholar] [CrossRef]
Disclaimer/Publisher’s Note: The statements, opinions and data contained in all publications are solely those of the individual author(s) and contributor(s) and not of MDPI and/or the editor(s). MDPI and/or the editor(s) disclaim responsibility for any injury to people or property resulting from any ideas, methods, instructions or products referred to in the content. |
© 2024 by the authors. Licensee MDPI, Basel, Switzerland. This article is an open access article distributed under the terms and conditions of the Creative Commons Attribution (CC BY) license (https://creativecommons.org/licenses/by/4.0/).