Abstract
Background: This work is part of the regional research project PIPER—Intelligent Platform for the Optimization of Recycling Operations, which aims to develop a network design model for waste collection in the metropolitan city of Rome, Italy. The goal is to enhance the strategic planning of treatment and disposal facilities by incorporating transshipment locations to improve the efficiency of waste collection. The motivation for this study stems from the stringent targets set by the European Green Deal to achieve near-zero emissions and the critical role of waste management in realizing circular economy practices. Methods: The problem is formulated as a mixed integer linear program (MILP) that includes constraints on vehicle allocation to shifts and driver requirements. An additional feature of the model is its ability to account for vehicle maintenance issues when deployed on consecutive shifts. Results: The model was tested against a real-world case study in Rome and demonstrated significant potential savings, with a reduction in total traveled distance exceeding 10%. The mathematical model was also used for evaluating strategic scenarios in a “what-if” analysis, allowing the municipal collection company to assess location options for depots, waste treatment facilities, and transshipment points, as well as to optimize the fleet composition and driver allocation during work shifts. Conclusions: This study presents a robust tool for strategic planning in waste collection operations, highlighting the benefits of using transshipment locations to improve efficiency. The findings indicate substantial potential for cost savings and operational improvements, making the model a valuable asset for municipal waste management planning.
1. Introduction and Literature Review
Strict targets set by the European Green Deal imposed to reach near-zero emissions in a medium-time horizon [1,2]. In particular, European Countries should reach carbon neutrality by 2050 with an intermediate objective of reducing emissions by 55% by 2030 compared to 1990 levels, as recorded by the European Commission. In this regard, circular economy practices and Optimization in Waste Management (WM) are key points to reach sustainable development goals. Several studies confirm how circular economy practices improve both resource efficiency and operations revenue indicators [3]. The optimization of circular economy and supply chain processes is also crucial in the consideration of the general policies aimed at mitigating emissions, as addressed by Eslamipoor and Sepehriyar [4]. These policies are also often key for development strategies for urban management.
Waste management (WM) optimization is one of the key tasks to realize a circular economy and achieve sustainability in large metropolitan areas. Location models are among the most important quantitative tools for the spatial planning of service networks. Combined with other methods such as data analytics and simulation, they can effectively support network reengineering processes. Considering an actual WM setting, these models can support decision-making in real cases when they also consider the underlying network changes such as demand evolution, cost pattern modifications, transport and facility technology progress.
Cerqueira-Streit et al. [5] detailed in their survey how WM is a critical factor in turning the circular economy into a profitable business. To address the complexity of WM processes, Cardoso et al. [6] proposed a method based on literature review and applied evidence-based decision-making for conflict resolution in e-waste management. However, profitability can be reached only if the underlying WM processes are optimized. Several studies, including those by Asefi et al. [7] and Pinto and Stecca [8], have explored the use of Operations Research (OR) for cost minimization in WM. These works primarily address industrial waste, as seen in Gentile et al. [9], where collection and sorting operations are closely linked and require synchronization. Other researches focused on clustering regional areas’ wastes, with independent transport operators handling the collection process and regional authorities aiming to minimize the overall impact of the process [10,11]. In the work of Badran and El-Haggar [12], a mixed integer linear problem for waste collection network design was presented and applied to the Egyptian city of Port-Said. Their study aimed to identify optimal locations for collection stations for hospital and construction/demolition waste. These stations serve as intermediary points between collection dumpsters and composting plants. Specific trucks are designated to transport waste from the collection dumpsters to the collection stations. Minoglou and Komilis [13] examined the optimal allocation of various waste types to treatment plants, considering the costs and emissions associated with different treatment technologies within a nonlinear model. The model was applied as a case study on a region in Greece. An innovative, large-scale, underground waste collection system was proposed by Liu et al. [14], who investigated using a MILP model for the optimal location of facilities and allocation of flows on the designed waste management network, showing the potential of integrating new technology and mathematical optimization. An application was proposed to the center of Nanjing, China. Shaban et al. [15] considered the solid waste management system in the Fayoum governorate, Egypt, and used MILP to compute both the optimal number and location of the different facilities, and the optimal flow of waste minimizing the daily cost, considering an aggregated system of six districts. Algethami and Alhothali [16] combined MILP and heuristics to solve a waste management network design problem in the city of Makkah, Saudi Arabia.
Multiobjective optimization is used to define the best economic and environmental solutions in designing the waste collection network in the city of Tehran, Iran, by using the Non-Dominated Genetic Algorithm-II (NSGA) [17]. Multiobjective optimization was also used by Niu et al. [18] and solved with a decision trees classifier-based heuristic. The optimal allocation of waste produced in districts to processing sites was studied by Mirdar Harijani et al. [19], who proposed a multiobjective mixed integer linear program (MILP) applied to the municipality of Tehran, Iran. Liang and Liu [20] presented an MILP for Nanjing Jiangbei, China, aiming to minimize the annual operational cost by specifically considering the location of waste transfer stations. Yousefloo and Babazadeh [21] also used an MILP to design a waste collection network in a province of Iran, incorporating multiple objectives and solving the model using the -constraint method.
The integrated use of technologies such as Geographic Information Systems (GIS) with mathematical programming has been proven to be very effective, as shown in the study applied to Peshawar by Khan et al. [22]. Temireyeva et al. [23] focused on the analysis of the disposal phase of waste management. In this context, they proposed four different scenarios for municipal solid waste treatment and three scenarios for sewage sludge treatment. In the defined scenarios, they applied a greenhouse gases (GHG) calculator with the aim to individuate the best disposal option considering GHG emissions, with data from the municipal solid and sewage sludge waste management of Astana city, Kazakhstan.
Multicriteria analysis was conducted by Apaydin and Akçay Han [24], where different waste separation methods were compared by means of an Analytical Hierarchy Process (AHP) method with an application in Türkiye. Multicriteria analysis was also used by Fernandes et al. [25] and applied to the field of Waste from Electrical and Electronic Equipment (WEEE). Case study analyses were performed by Guarnieri et al. [26] in Brazil and by Ayantoyinbo and Adepoju [27] with an application to Lagos, Nigeria.
Kroeger et al. [28] used data farming in order to generate a comprehensive database that can be mined for data-based decision support and integrated it with network design methods. A data-based approach was also used by Yaspal et al. [29] for medical waste management. Monte Carlo simulation was used by other authors such as Bhardwaj et al. [30], where a case study in the field of bread supply chain with waste reduction objectives was carried out.
For a comprehensive review of the literature on strategic and tactical issues in solid waste management, readers are referred to the surveys [31,32,33].
In this paper, we focus on WM optimization as an enabling process for the circular economy, specifically addressing municipal waste collection and the optimization of related logistics operations. We developed a network design model for a large metropolitan area as part of a regional research project named PIPER—Intelligent Platform for the Optimization of Recycling Operations. This project aims to leverage advanced applied research in optimization and artificial intelligence to address sustainability issues in recycling processes, considering environmental, social, and economic targets. The model incorporates specific features, such as the deployment of trailers as transshipment points to reduce the distance traveled by collection trucks. Building on the existing research literature, we propose a mathematical model for the optimal assignment of waste collection services, operated by heterogeneous vehicles, to transshipment points and disposal plants, with the goal of planning daily operations. In our case study, we explicitly model different routing options for vehicles and consider daily shifts. The assignment of shifts not only affects operators but also impacts vehicle maintenance. This is incorporated into the model by penalizing solutions that require the same vehicle to work multiple consecutive shifts.
The model has been applied to optimize the weekly allocation of about 3000 waste collection services. Environmental indicators and data used are monitored by the regional agency for environmental protection ARPA, the Italian agency ISPRA, and AMA S.p.A.—the main logistics player in the region and one of the largest waste management companies in Europe. This approach can potentially reduce travel time by more than 400 h and decrease the weekly traveled distance by over 20,000 km across the entire metropolitan area of Rome. The mathematical model can also be utilized as a “what-if” analysis tool by running experiments with different scenarios and considering various potential locations for facilities.
2. The Collection of Waste in a Metropolitan City
The objective of this study is to address specific challenges related to waste collection in large metropolitan areas. A significant issue is that disposal and recycling facilities are often located outside the city, which reduces the time available for vehicles to perform active operations. In the case under study, vehicles travel approximately 3 km for waste collection but cover over 60 km traveling to and from depots and disposal facilities. Additionally, these facilities and depots have been established incrementally and for historical reasons. Therefore, it is crucial for the company to have a tool that optimizes current planning and strategically evaluates new locations and transshipment points in terms of economic impact and operational efficiency. Moreover, operational efficiency cannot always be directly measured by the reduction in direct operational costs. Several other factors must be considered, such as maintenance issues, which are a critical limiting factor for the full deployment of collection vehicles.
The reengineering of the waste management network allows for optimizing specific objectives such as network traversal times, costs, and waiting times, while satisfying various constraints related to recycling performance and financial balance. The cost evaluation in the presented case study considers both the construction and maintenance costs of facilities and the transportation costs within the network. In the reengineered network, the so-called “transshipment locations” play a key role in reducing the time collection vehicles spend traveling instead of collecting waste. The model accounts for the regional allocation of waste storage, treatment, and selection plants, as well as the distribution and concentration of urban agglomerations and industrial districts. Regarding facility types, we distinguish between waste-sorting plants, waste-to-energy plants, composting plants, incineration plants, and landfills. These models can suggest the optimal location for a new facility based on demand, variability, and the type of urban and industrial waste produced in the area.
AMA S.p.A.’s processes [34] can be categorized into three main activities: collection, transport, and treatment/disposal. The collection and transport activities are directly managed by AMA S.p.A. and are organized weekly with four defined shifts daily: morning, afternoon, semi-nightly, and nightly. Each shift is staffed accordingly.
Collection can be classified into two types: road collection, where trucks withdraw waste from road dumpsters, and door-to-door bin collection. The first type is utilized for two-thirds of the population in the metropolitan city of Rome, while the second type serves the remaining one-third. Vehicle travel for collection can be analyzed at both micro- and macro-scales. In micro-routing, the sequencing of collected dumpsters is studied, focusing on the specific order in which dumpsters are serviced. In macro-routing, or long-distance routing, collection dumpsters are aggregated into collection services, and the analysis focuses on travel to and from the depot, transshipment, and disposal facilities.
In this study, we focus on macro-routing, which has been prioritized following a preliminary study conducted by the company. This study identified a series of improvements and efficiency measures, which were then ranked according to their expected returns and impact on decision-making phases (strategic, tactical, or operational).
In the following, we define a “service” as a group of dumpsters collected by a vehicle during a single work trip. For simplicity, we will represent the geographic location of this group by its centroid. Each service is performed once or more than once per week and is associated with a single type of waste. The waste types are as follows:
- General waste;
- Paper;
- Multimaterial;
- Organic waste.
The collection vehicles are versatile and can be adapted to handle various types of waste. They are stationed at different depots and are operational during three shifts: morning, evening, and night. Since they are prone to maintenance issues that increase with the number of consecutive shifts they operate, it is crucial to alternate their usage whenever possible. Vehicles are classified based on the number of axles and loading technology, ensuring compatibility with different types of services. Specifically, the company operates rear-loading vehicles with two axles (COMP 2A), three axles (COMP 3A), or four axles (COMP 4A). Side loader vehicles come in configurations of two axles (CSL 2A) or three axles (CSL 3A). Transshipment involves the use of special vehicles (CM) stationed at designated locations where waste collected by other vehicles is consolidated. These act as mobile disposal facilities. Each vehicle type has specific capacities in weight and volume, a defined waste compression rate, and requires a designated number of operators.
Each service can be associated with a subset of vehicle types due to infrastructure and road constraints. Additionally, each transshipment location is dedicated to a specific waste type.
Disposal facilities include treatment/recovery and proper disposal facilities, complying with regional regulations (Waste Management Plan of the Lazio region, BURL 14 March 2012 S.O.15). These facilities may include biomechanical treatment (TMB) plants, composting plants, incineration facilities, or landfill sites, each compatible with specific types of waste. Disposal facilities are compliant with regional regulations (Waste management plan of the Lazio region (BURL 14.03.2012 S.O.15)) and include treatment/recovery processes and/or final disposal methods. They can be biomechanical treatment plants, composting plants, incineration facilities, or landfill sites. Each facility is compatible with a subset of waste types.
The Network and the Waste Flows
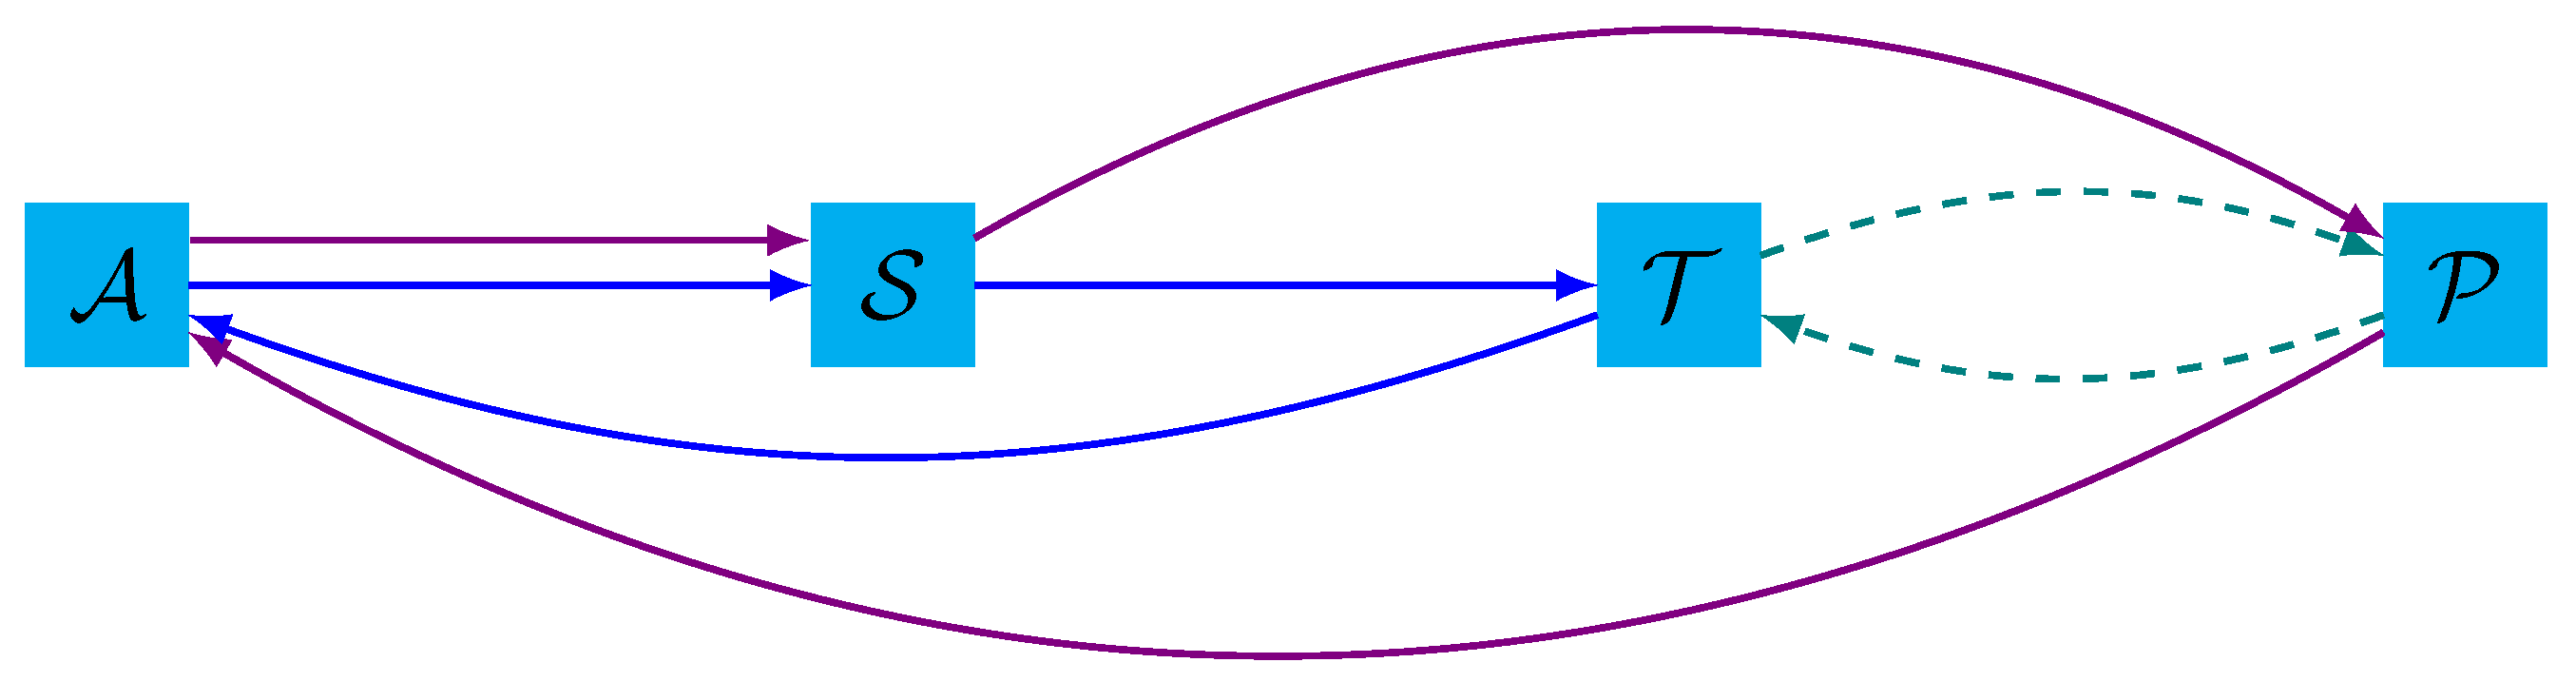
The network is structured into four layers: Depots (), Services (), Transshipment locations (), and Plants (). In the following, we refer to the union of plant and transshipment locations as disposal facilities.
Figure 1 depicts the possible flow of waste materials in the network.

Figure 1.
Network and waste flow defined in the AMA S.p.A. collection company. The network presents four connected layers: Depots (), Services (), transshipment locations (), and Plants ().
The network arcs in the figure depict two distinct paths vehicles can follow. Each path originates from a depot and moves towards a service; after completing it, the vehicle returns to the same depot. A service is considered complete once it has been delivered to a transshipment location or a plant.
Below, we summarize the two potential paths the vehicle can follow during one shift:
- (i)
- Path without transshipment.The vehicle operates the service, transports the waste towards a plant, and returns to the starting depot (purple arcs).
- (ii)
- Path with transshipment.The vehicle operates the service, transports the waste towards a transshipment location, and returns to the starting depot (blue arcs). Subsequently, the waste from the transshipment location is transported to a plant by the end of the day (green dashed arcs).
3. Mathematical Formulation
In this section, we present a pure binary programming model for the network design problem. The primary objective of this decision support model is to optimize waste collection activities by minimizing the travel distance and time for the entire fleet of vehicles dedicated to this service. To formulate a model that accurately reflects the real use-case scenario, the following assumptions have been set:
- Assumption 1. Only street dumpster collection activities are considered (excluding door-to-door bin collection).
- Assumption 2. Each service is a cluster of dumpsters; these are indeed assumed to be assigned to each service (no micro-routing optimization is performed).
While Table 1 provides a comprehensive list of sets and parameters used in the model, we introduce the following sets of binary variables:

Table 1.
List of indices, sets, and parameters of the model.
- Service Allocation:The variable represents the operational decisions of assigning a service s to a vehicle v. This vehicle departs from a depot a, performs the service, and transports the collected waste to a facility f, which can be either a treatment plant or a transshipment location.
- Facility Activation:The variable is linked to deciding which facility to activate, a strategic decision useful for scenario and “what-if” analyses.
- Transshipment Vehicle Allocation:The set of variables represents the movement of transshipment vehicles from transshipment locations to compatible plants, which are designated to handle the specific type of waste carried by the vehicle and back.
- Vehicle UsageThe variable addresses vehicle-related issues. As specified in Section 2, vehicles face increased maintenance risks when used for multiple consecutive shifts. The variable is activated if, during a day, a vehicle v is assigned more consecutive shifts than a predefined standard number. This activation is factored into the objective function with an estimated maintenance cost, giving the variable a planning significance.
The objective function to be minimized is linear and presents three terms representing the facility investment costs (1), expected maintenance costs (2), and traveling operating costs of transportation (3):
The constraints are the following:
Constraints (4) ensure that each service is operated. Constraints (5) limit each vehicle to at most one service and one facility per shift. Constraints (6) enforce the disposal capacity limits of each facility and activate the variables accordingly. Constraints (7) ensure that if a transshipment location is active, meaning at least one service reaches transshipment location t, it must be assigned to a plant by the end of the day. Constraints (8) limit the number of working operators at each depot during each shift to the total number available. Constraints (9) address vehicle overuse: if vehicle v performs a service on each shift, i.e., performs services, then the variable is set to 1. Finally, Constraints (10) ensure that the maximum service time for each vehicle is respected.
4. Numerical Experiments
The numerical experiments conducted for this study are pivotal in validating the proposed optimization model for waste management in a metropolitan setting. The primary focus of these experiments is to assess the model’s effectiveness in optimizing the allocation of collection vehicles to various waste collection services while minimizing the total distance traveled and transit times. By leveraging real operational data, the experiments aimed to demonstrate substantial improvements in operational efficiency and provide strategic insights into potential network configurations. This section presents the results of the optimization model applied to a case study in Rome, detailing both operational planning outcomes and scenario analysis simulations.
4.1. Experimental Settings
In our experiment, we used a real-world dataset provided by AMA S.p.A., a waste management company operating in the Italian metropolitan city of Rome. We computed massive operations to standardize reference codes and data values and created a dataset including all parameters used in the model formulation. The data span two months of operational service records and include the following key information:
- Fleet composition at each depot.
- Service loads (kg) time-series.
- Locations of services, transshipment, and plants.
- Detailed operational data, specifying which vehicle performed each service during each shift and the destinations of waste transport.
The dataset reflects the company’s weekly operations and is used as the baseline scenario against which our results are compared. In the following sections, the optimal solution proposed by the model is referred to as “PIPER” while the baseline solution is referred to as “AS IS”.
Table 2 summarizes the main stats of the instance under study.
Table 2.
Stats of the dataset provided by AMA S.p.A.
Our analysis focuses on optimizing daily waste collection vehicle allocation to ensure efficiency in distance traveled and compliance with service demands, capacity, fleet, and other constraints detailed in Section 3.
We tested the algorithm on seven instances, each corresponding to a different day of the week. We used the time-series data of service loads to calculate the mean values for each service load on each weekday of collection. Three daily shifts were considered: Morning, Afternoon, and Semi-night and Night. Distance and time matrices were computed using the Open Source Routing Machine (OSRM) (for more information, see https://github.com/Project-OSRM/osrm-backend and https://www.openstreetmap.org/copyright, accessed on 11 April 2024).
The experiments are conducted on an Ubuntu server equipped with an Intel(R) Xeon(R) Gold 6252N CPU and 96 GB RAM, utilizing the Python language and GUROBI v10 as the MIP optimizer.
4.2. Numerical Results
The instance features an average of 500,000 variables and 90,000 constraints, with Sunday representing the smallest instance due to the limited number of services performed on that day. Despite the instance’s significant size, the computational times are remarkably short for all instances. Solving the instance takes less than 5 min. Given these reduced computation times and the positive feedback from the waste management company, we did not explore alternative solution methods.
As outlined in the model definition, the primary metric for evaluating the solution is the total distance traveled by the AMA fleet to complete all services over a week, with three shifts per day.
Table 3 summarizes the key metrics of both the AS IS solution and the PIPER solution, highlighting the total distance traveled in kilometers and transit time in hours. The table also shows the percentage improvement achieved through the mathematical approach.
Table 3.
Summary of optimization results.
By comparing the AS IS solution with the model solution, we observe a substantial reduction in the total distance traveled and transit time. Specifically, the PIPER solution decreases the total distance traveled by 21,057 km, which translates to a 13.83% improvement. On average, the PIPER solution allows for daily savings of 3008 km, as illustrated in Figure 2. The savings are relatively consistent during weekdays, reflecting the robustness of the optimization approach under typical operational conditions. However, the impact of optimization is less pronounced for Sunday services. This is due to the reduced number of services performed on Sundays, which results in stricter margins for optimization.
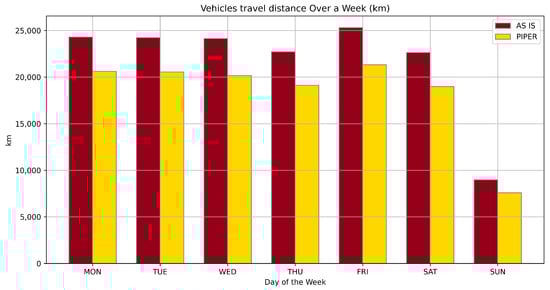
Figure 2.
Comparison of the total distance traveled (km) over a week for the AS IS and PIPER solutions.
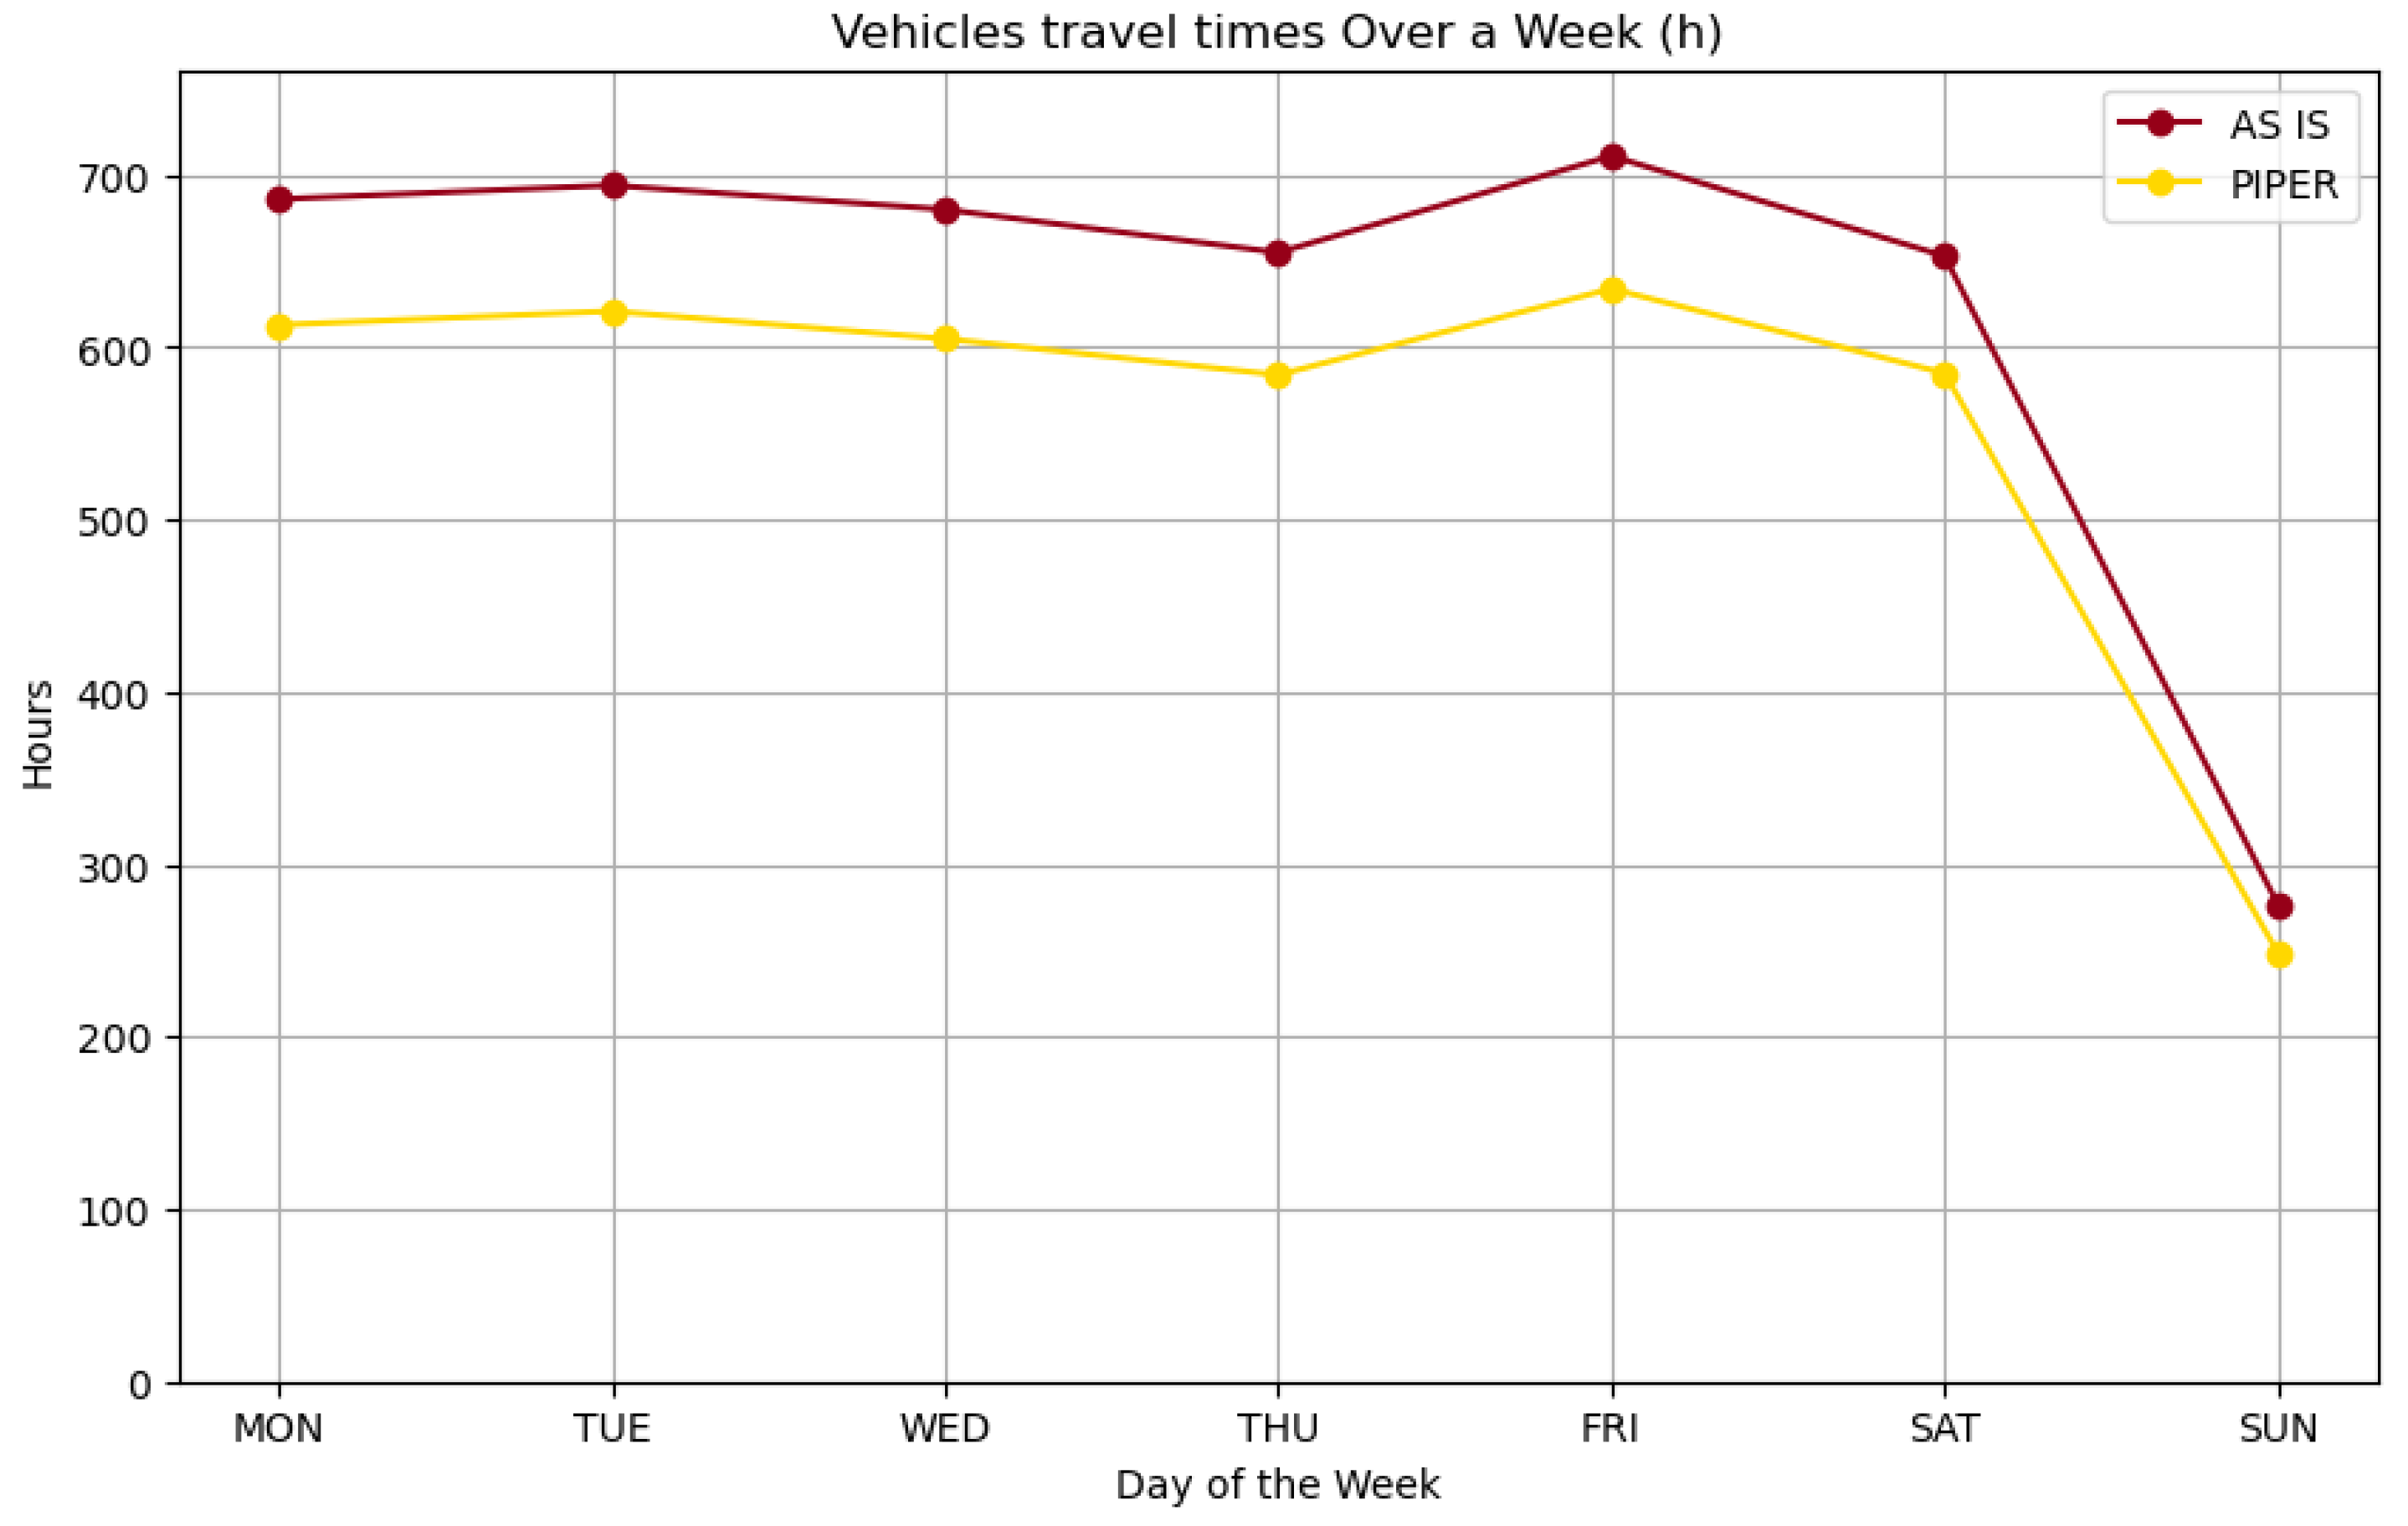
Transit time is also reduced by 415 h, reflecting a 9.53% enhancement, as depicted daily in Figure 3.
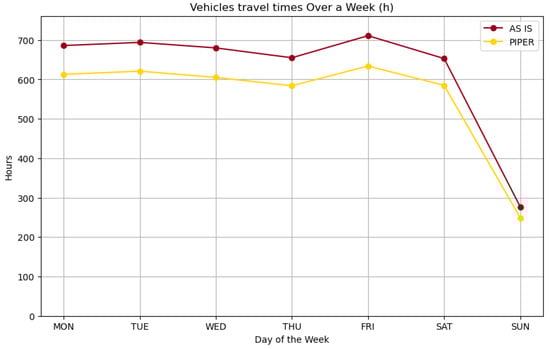
Figure 3.
Comparison of the total time traveled (h) over a week for the AS IS and PIPER solutions.
The improvements not only demonstrate the efficiency gains achieved through optimization but also suggest significant potential cost savings and reduced environmental impact due to lower fuel consumption. To quantify this impact, we refer to Mulholland et al. [35], who report that the average CO2 emissions for long-haul, heavy-duty vehicles are approximately 773.5 g CO2 per kilometer traveled. Given the reduction of 21,056 km achieved by the PIPER solution, the corresponding reduction in CO2 emissions can be calculated as follows:
This translates to a reduction of 16,282 kg (or approximately 16.29 metric tons) of CO2 emissions per week. This quantification underscores the substantial environmental benefits of the optimized solution.
The stacked bar plot in Figure 4 illustrates the distribution of services allocated per vehicle across different days of the week in the PIPER solutions. Each bar represents the number of vehicles assigned to one, two, and three services per day. Note that, on weekdays, despite the model penalizing such decisions in the objective function, some vehicles are utilized across all three shifts. This allocation is influenced by the specific vehicle requirements for a subset of services and the constraints imposed by the total available fleet of vehicles.
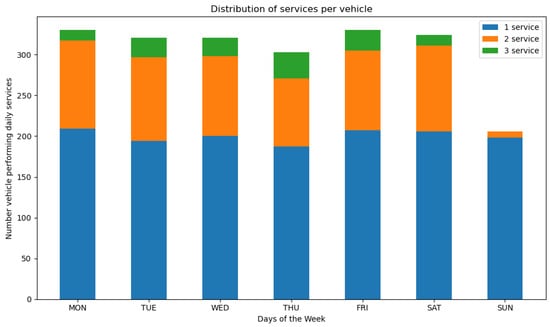
Figure 4.
Stacked bar plot of number of services allocated per vehicle.
4.3. Scenario Analysis and Simulations
The optimization model developed in this study offers immediate operational benefits and serves as a strategic decision-making tool. It allows management to simulate various scenarios and evaluate changes in the waste management network.
For instance, evaluating the impact of opening a new disposal facility revealed a significant reduction in the total distance traveled by vehicles, demonstrating potential operational efficiencies and cost savings.
The model’s scenario analysis capabilities extend to exploring other potential changes, such as modifying fleet composition, reallocating operators, or adjusting facility capacities. These simulations enable “what-if” analyses, providing valuable insights for long-term strategic planning and decision-making.
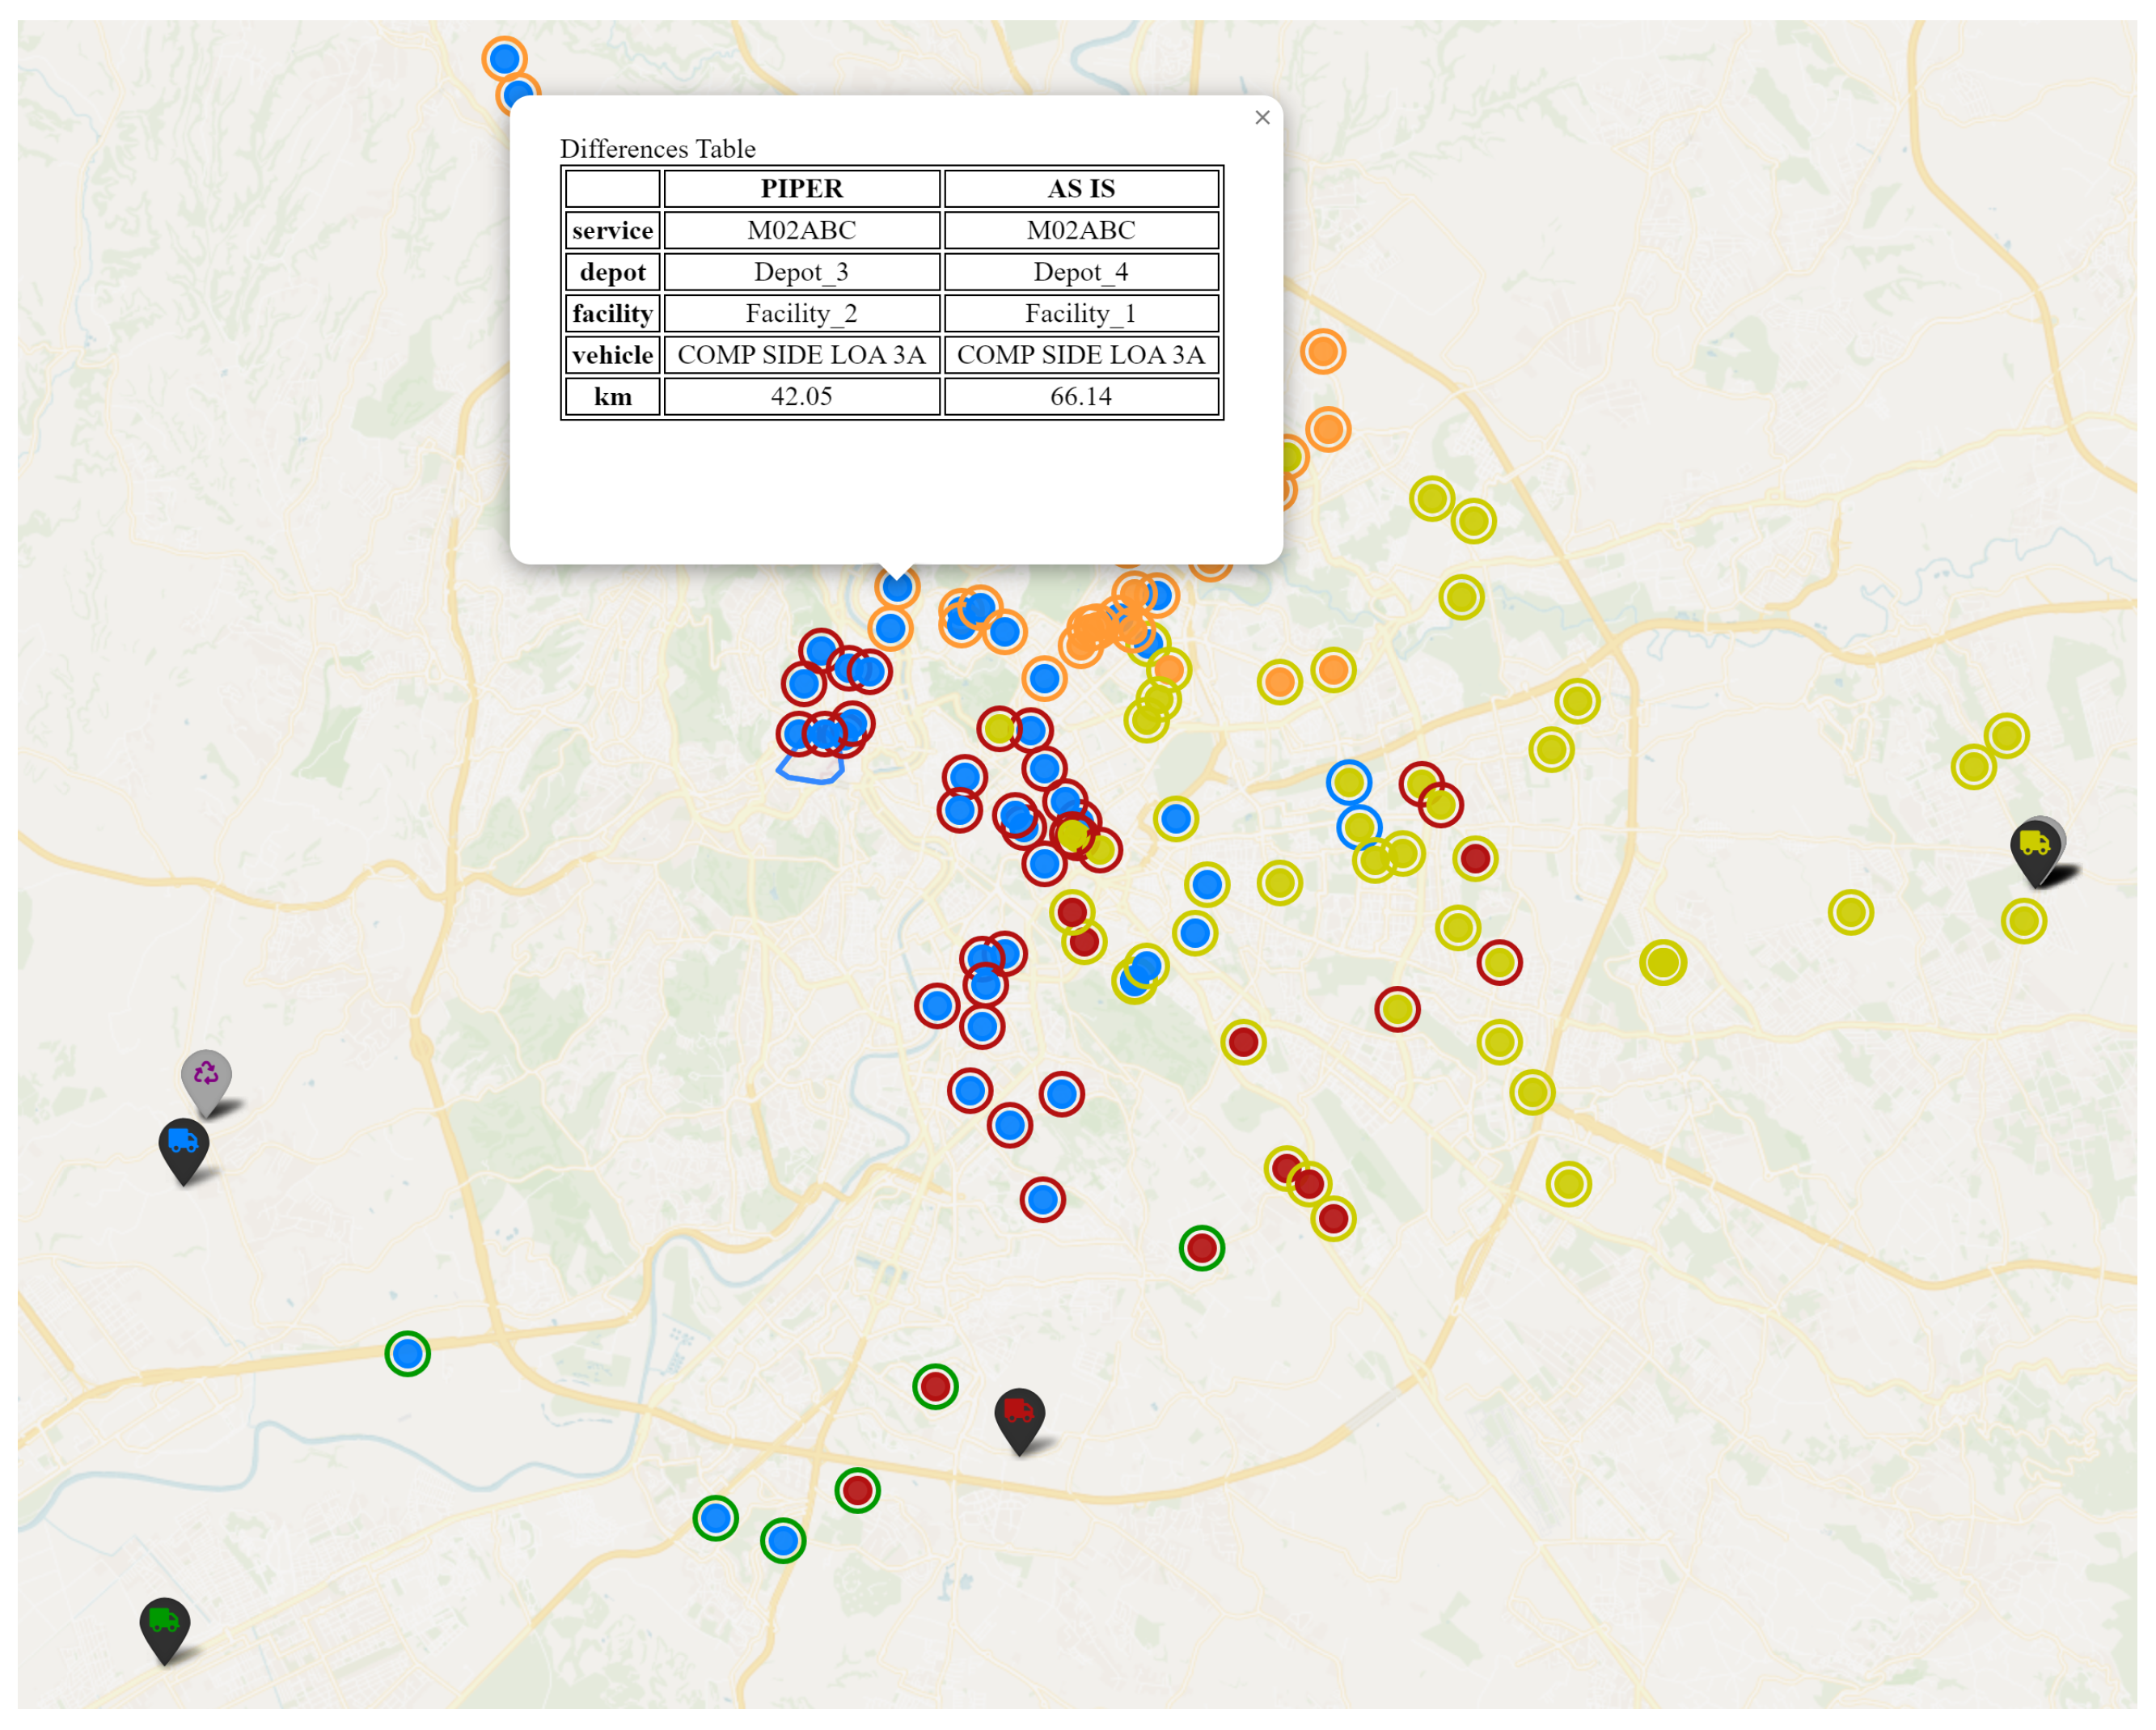
Beyond executing the model on the given instances, we developed an offline prototype to inspect the solution visually. This tool allows the project team to compare the proposed solution with the daily AS IS solution for validation and to gain insights into the process through simulated scenarios. Figure 5 shows a screenshot of the visual tool, illustrating its functionality for inspecting and comparing PIPER and AS IS solutions when considering a single service. The inspection can also be conducted on transshipment locations and plants through performance indicators.
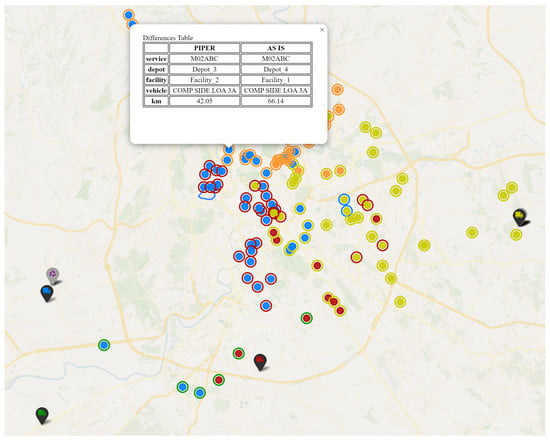
Figure 5.
Visualization tool used for solution inspection of a specific service. The tooltip includes a table that facilitates comparison between AS IS and custom solutions.
4.4. Limitations and Future Works
While the optimization model developed in this study provides significant improvements in operational efficiency, it does have certain limitations that should be addressed in future research. One primary limitation is the use of static travel times. In the current model, travel times between different locations are considered constant, which may not reflect real-world conditions where traffic and other dynamic factors can impact travel durations. Incorporating dynamic travel times based on real-time data could enhance the accuracy and applicability of the model.
Another simplifying assumption is that each vehicle must return to the same depot from which it started. This assumption aligns with current operational procedures but may not be optimal. Allowing vehicles to return to different depots based on operational needs and depot capacities could further reduce travel distances and improve efficiency.
Additionally, the model currently assumes fixed depot capacities. In reality, the capacity of depots in terms of the number of vehicles they can accommodate might vary. Introducing flexibility in depot capacities, such as resizing or reallocating vehicles among depots, could provide more cost-effective solutions.
An important consideration is the company’s policy of planning operations using only 75% of the available vehicles to ensure stability and feasibility. This conservative approach helps maintain operational continuity, but exploring ways to optimize vehicle usage without compromising stability could lead to further efficiency gains.
5. Conclusions
In this study, we presented a mathematical model for designing the waste collection network in the metropolitan city of Rome. Unlike previous studies, our model incorporates several specific features, including multiple allocation options for services, vehicles, transshipment, and disposal facilities as well as the consideration of shifts and maintenance issues. The implementation of the optimization model has demonstrated substantial improvements in the operational efficiency of waste collection services. This work shows the effective collaboration between territorial research bodies and leading companies in waste management, resulting in advancements in the application of operations research and management science methods. These advancements have effectively improved the performance of waste management (WM) and promoted the circular economy in metropolitan areas. The key findings of this study include the following:
- Significant Reduction in Distance Traveled: The optimized model reduced the total distance traveled by collection vehicles by 13.83%, resulting in notable cost savings and lower environmental impact. The solution takes into account operational costs, facility costs, and maintenance issues.
- Decreased Transit Time: The model also achieved a 9.52% reduction in transit time, enhancing the efficiency of waste collection operations and allowing for better allocation of resources.
- Enhanced Strategic Planning: Beyond operational improvements, the model serves as a robust tool for strategic planning. It allows management to simulate various scenarios, such as adding new facilities or modifying fleet composition, providing valuable insights for long-term decision-making.
The results validate the effectiveness of the optimization model in achieving desired operational objectives and underscore its potential as a powerful tool for both operational planning and strategic management in municipal waste management.
Implementing such a system in practice involves several challenges and considerations. The company’s existing framework is compatible with the internal management systems, which means the required training for the technical planning staff is minimal. The major effort will involve integrating the optimization model with the company’s existing GIS systems. Future developments could include additional integrations at the process level for robustness analysis and handling uncertain parameters, such as accounting for seasonal variations. These considerations will be critical to ensure the model’s practical relevance and successful implementation in a real-world setting.
Author Contributions
Conceptualization, M.B., A.L.C., C.G., L.P., D.M.P., G.S. and P.V.; methodology, M.B., A.L.C., C.G., L.P., D.M.P., G.S. and P.V.; software, M.B., A.L.C. and D.M.P.; validation, M.B., A.L.C., C.G., L.P., D.M.P., G.S. and P.V.; formal analysis, G.S. and P.V.; data curation, M.B., A.L.C. and D.M.P.; writing—original draft preparation, M.B., A.L.C., C.G., L.P., D.M.P., G.S. and P.V.; visualization, M.B., A.L.C. and D.M.P.; supervision, C.G., L.P., G.S. and P.V.; project administration, L.P. and G.S.; funding acquisition, D.M.P. and G.S. All authors have read and agreed to the published version of the manuscript.
Funding
This research was partially funded by EU POR FESR program of LAZIO Region on “Research Groups 2020” through the project PIPER—Piattaforma intelligente per l’ottimizzazione di operazioni di riciclo, Grant No. A0375-2020-36611.
Data Availability Statement
Anonymized data available upon request to the authors.
Acknowledgments
We acknowledge the support of the AMA S.p.A. team participating in the collaboration agreement with CNR-IASI and DIAG Sapienza University of Rome: Massimiliano Diano, Mauro Bellicoso, Stefano Forliti, Dario Catena, Andrea Viglietta, Gaetano Caliste, and Giuliano Blasi. The team supervised the work, providing analysis of the problem, example instance data, and model validation. They also provided hints on objective function development and scenario design.
Conflicts of Interest
The authors declare no conflict of interest.
References
- European Commission. The European Green Deal; Technical Report 640; European Commission: Brussels, Belgium, 2019.
- European Commission. Forging a Climate-Resilient Europe—The New EU Strategy on Adaptation to Climate Change; Technical Report 81; European Commission: Brussels, Belgium, 2021.
- Barros, M.V.; Salvador, R.; do Prado, G.F.; de Francisco, A.C.; Piekarski, C.M. Circular economy as a driver to sustainable businesses. Clean. Environ. Syst. 2021, 2, 100006. [Google Scholar] [CrossRef]
- Eslamipoor, R.; Sepehriyar, A. Promoting green supply chain under carbon tax, carbon cap and carbon trading policies. Bus. Strategy Environ. 2024, 33, 4901–4912. [Google Scholar] [CrossRef]
- Cerqueira-Streit, J.A.; Guarnieri, P.; de Oliveira, L.H.; Demajorovic, J. From Trash to Profit: How Packaging Waste Management Has Driven the Circular Economy—An Integrative Literature Review. Logistics 2023, 7, 66. [Google Scholar] [CrossRef]
- Cardoso, L.N.P.; Miranda, K.D.d.O.; da Silva, E.F.V.; Guarnieri, P.; Leão e Silva Filho, J.; e Silva, L.C. E-Waste Management: An Analysis under the Perspective of Conflicts and Shared Responsibility. Logistics 2023, 7, 74. [Google Scholar] [CrossRef]
- Asefi, H.; Lim, S.; Maghrebi, M.; Shahparvari, S. Mathematical modelling and heuristic approaches to the location-routing problem of a cost-effective integrated solid waste management. Ann. Oper. Res. 2019, 273, 75–110. [Google Scholar] [CrossRef]
- Pinto, D.M.; Stecca, G. Optimal planning of waste sorting operations through mixed integer linear programming. In Graphs and Combinatorial Optimization: From Theory to Applications: CTW2020 Proceedings; Springer: Cham, Svitzerland, 2021; pp. 307–320. [Google Scholar]
- Gentile, C.; Pinto, D.M.; Stecca, G. Price of robustness optimization through demand forecasting with an application to waste management. Soft Comput. 2023, 27, 13013–13024. [Google Scholar] [CrossRef]
- Caramia, M.; Pinto, D.M.; Pizzari, E.; Stecca, G. Clustering and routing in waste management: A two-stage optimisation approach. EURO J. Transp. Logist. 2023, 12, 100114. [Google Scholar] [CrossRef]
- Croella, A.L.; Fraccascia, L. A Location-Sizing and Routing Model for a Biomethane Production Chain Fed by Municipal Waste. 2024. Available online: https://ssrn.com/abstract=4836639 (accessed on 6 August 2024). [CrossRef]
- Badran, M.; El-Haggar, S. Optimization of municipal solid waste management in Port Said–Egypt. Waste Manag. 2006, 26, 534–545. [Google Scholar] [CrossRef] [PubMed]
- Minoglou, M.; Komilis, D. Optimizing the treatment and disposal of municipal solid wastes using mathematical programming—A case study in a Greek region. Resour. Conserv. Recycl. 2013, 80, 46–57. [Google Scholar] [CrossRef]
- Liu, Q.; Chen, Y.; Hu, W.; Dong, J.; Sun, B.; Cheng, H. Underground Logistics Network Design for Large-Scale Municipal Solid Waste Collection: A Case Study of Nanjing, China. Sustainability 2023, 15, 16392. [Google Scholar] [CrossRef]
- Shaban, A.; Zaki, F.E.; Afefy, I.H.; Di Gravio, G.; Falegnami, A.; Patriarca, R. An optimization model for the design of a sustainable municipal solid waste management system. Sustainability 2022, 14, 6345. [Google Scholar] [CrossRef]
- Algethami, H.; Alhothali, G.T. Waste collection optimisation: A path to a green and sustainable city of makkah. Logistics 2023, 7, 54. [Google Scholar] [CrossRef]
- Ahani, M.; Arjmandi, R.; Hoveidi, H.; Ghodousi, J.; Miri Lavasani, M. A Multi-objective optimization model for municipal waste management system in Tehran city, Iran. Int. J. Environ. Sci. Technol. 2019, 16, 5447–5462. [Google Scholar]
- Niu, Y.; Xu, C.; Liao, S.; Zhang, S.; Xiao, J. Multi-objective location-routing optimization based on machine learning for green municipal waste management. Waste Manag. 2024, 181, 157–167. [Google Scholar] [CrossRef] [PubMed]
- Mirdar Harijani, A.; Mansour, S.; Karimi, B. A multi-objective model for sustainable recycling of municipal solid waste. Waste Manag. Res. 2017, 35, 387–399. [Google Scholar] [CrossRef]
- Liang, J.; Liu, M. Network design for municipal solid waste collection: A case study of the Nanjing Jiangbei new area. Int. J. Environ. Res. Public Health 2018, 15, 2812. [Google Scholar] [CrossRef]
- Yousefloo, A.; Babazadeh, R. Designing an integrated municipal solid waste management network: A case study. J. Clean. Prod. 2020, 244, 118824. [Google Scholar] [CrossRef]
- Khan, M.A.; Khan, R.; Al-Zghoul, T.M.; Khan, A.; Hussain, A.; Baarimah, A.O.; Arshad, M.A. Optimizing municipal solid waste management in urban Peshawar: A linear mathematical modeling and GIS approach for efficiency and sustainability. Case Stud. Chem. Environ. Eng. 2024, 9, 100704. [Google Scholar] [CrossRef]
- Temireyeva, A.; Zhunussova, K.; Aidabulov, M.; Venetis, C.; Sarbassov, Y.; Shah, D. Greenhouse Gas Emissions-Based Development and Characterization of Optimal Scenarios for Municipal Solid and Sewage Sludge Waste Management in Astana City. Sustainability 2022, 14, 15850. [Google Scholar] [CrossRef]
- Apaydin, Ö.; Akçay Han, G.S. Analysis of Municipal Solid Waste Collection Methods Focusing on Zero-Waste Management Using an Analytical Hierarchy Process. Sustainability 2023, 15, 13184. [Google Scholar] [CrossRef]
- Fernandes, C.H.d.A.; Silva, L.C.e.; Guarnieri, P.; Vieira, B.d.O. Multicriteria model proposition to support the management of systems of E-waste collection. Logistics 2021, 5, 60. [Google Scholar] [CrossRef]
- Guarnieri, P.; de Aguiar, R.C.; Thomé, K.M.; Watanabe, E.A.d.M. The role of logistics in food waste reduction in wholesalers and small retailers of fruits and vegetables: A multiple case study. Logistics 2021, 5, 77. [Google Scholar] [CrossRef]
- Ayantoyinbo, B.B.; Adepoju, O.O. Analysis of solid waste management logistics and its attendant challenges in Lagos metropolis. Logistics 2018, 2, 11. [Google Scholar] [CrossRef]
- Kroeger, S.; Wegmann, M.; Soellner, C.; Zaeh, M.F. Solution space management to enable data farming in strategic network design. Appl. Sci. 2023, 13, 8604. [Google Scholar] [CrossRef]
- Yaspal, B.; Jauhar, S.K.; Kamble, S.; Belhadi, A.; Tiwari, S. A data-driven digital transformation approach for reverse logistics optimization in a medical waste management system. J. Clean. Prod. 2023, 430, 139703. [Google Scholar] [CrossRef]
- Bhardwaj, A.; Soni, R.; Singh, L.P.; Mor, R.S. A simulation approach for waste reduction in the bread supply chain. Logistics 2023, 7, 2. [Google Scholar] [CrossRef]
- Ghiani, G.; Laganà, D.; Manni, E.; Musmanno, R.; Vigo, D. Operations research in solid waste management: A survey of strategic and tactical issues. Comput. Oper. Res. 2014, 44, 22–32. [Google Scholar] [CrossRef]
- Das, S.; Lee, S.H.; Kumar, P.; Kim, K.H.; Lee, S.S.; Bhattacharya, S.S. Solid waste management: Scope and the challenge of sustainability. J. Clean. Prod. 2019, 228, 658–678. [Google Scholar] [CrossRef]
- Sandoval-Reyes, M.; He, R.; Semeano, R.; Ferrão, P. Mathematical optimization of waste management systems: Methodological review and perspectives for application. Waste Manag. 2024, 174, 630–645. [Google Scholar] [CrossRef]
- Boresta, M.; Croella, A.L.; Gentile, C.; Palagi, L.; Pinto, D.M.; Stecca, G.; Ventura, P. Report Progetto PIPER—Caso di Studio AMA; Technical Report; Istituto di Analisi dei Sistemi ed Informatica: Rome, Italy, 2023. [Google Scholar]
- Mulholland, E.; Ragon, P.L.; Rodríguez, F. CO2 Emissions from Trucks in the European Union: An Analysis of the 2020 Reporting Period; ICCT: Washington, DC, USA, 2023. [Google Scholar]


Disclaimer/Publisher’s Note: The statements, opinions and data contained in all publications are solely those of the individual author(s) and contributor(s) and not of MDPI and/or the editor(s). MDPI and/or the editor(s) disclaim responsibility for any injury to people or property resulting from any ideas, methods, instructions or products referred to in the content. |
© 2024 by the authors. Licensee MDPI, Basel, Switzerland. This article is an open access article distributed under the terms and conditions of the Creative Commons Attribution (CC BY) license (https://creativecommons.org/licenses/by/4.0/).