
Detection of Cd2+ in Aqueous Solution by the Fluorescent Probe of CdSe/CdS QDs Based on OFF–ON Mode

 , , and
Abstract
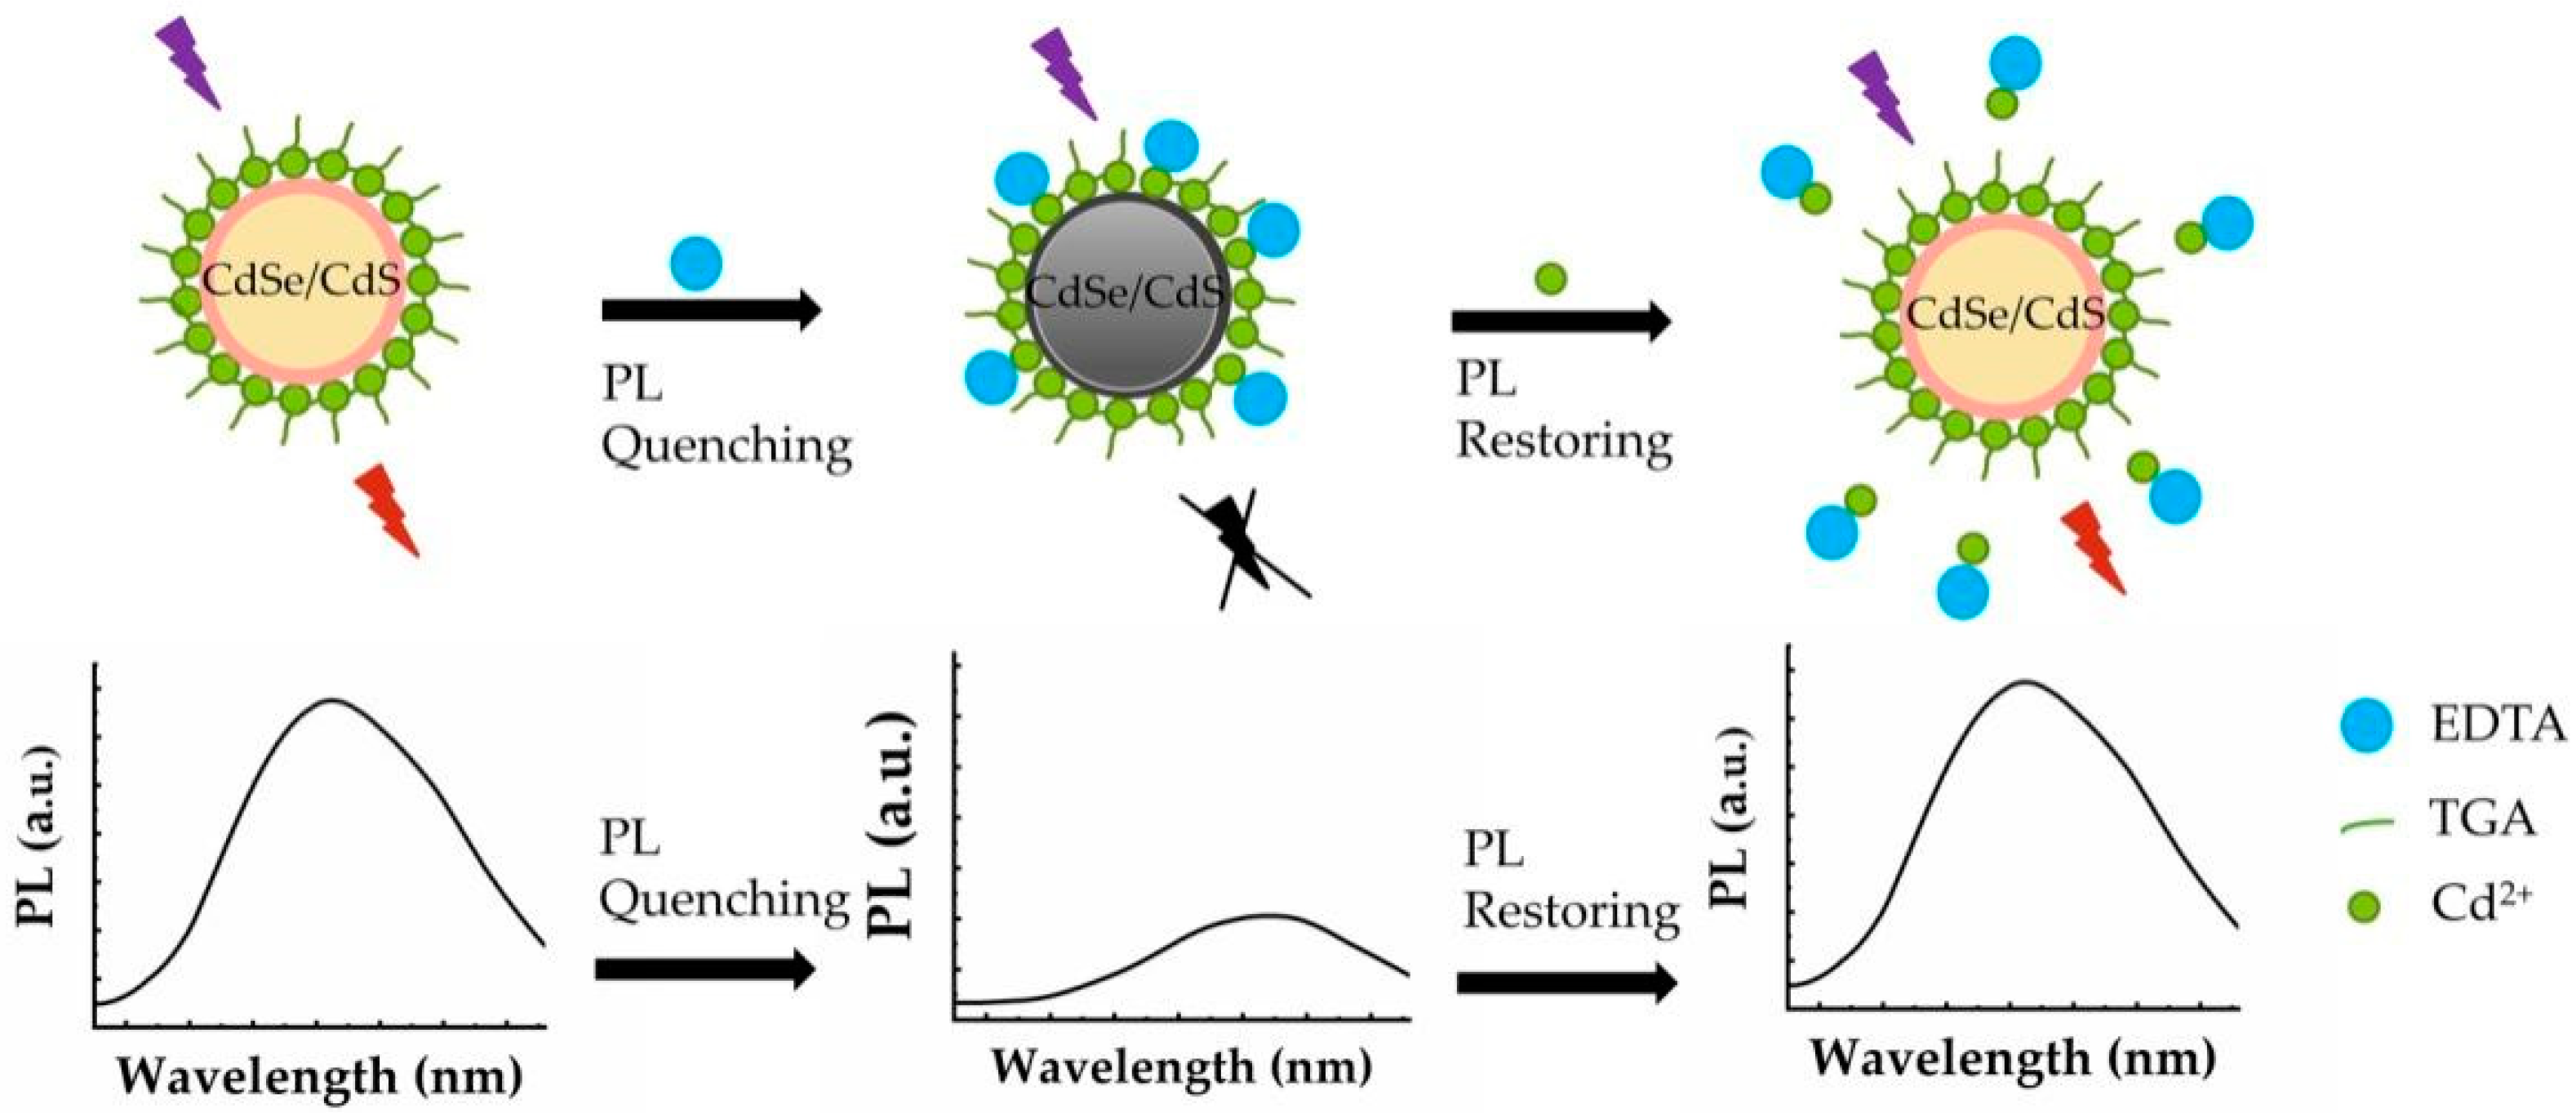
:1. Introduction
2. Materials and Methods
2.1. Apparatus and Reagents
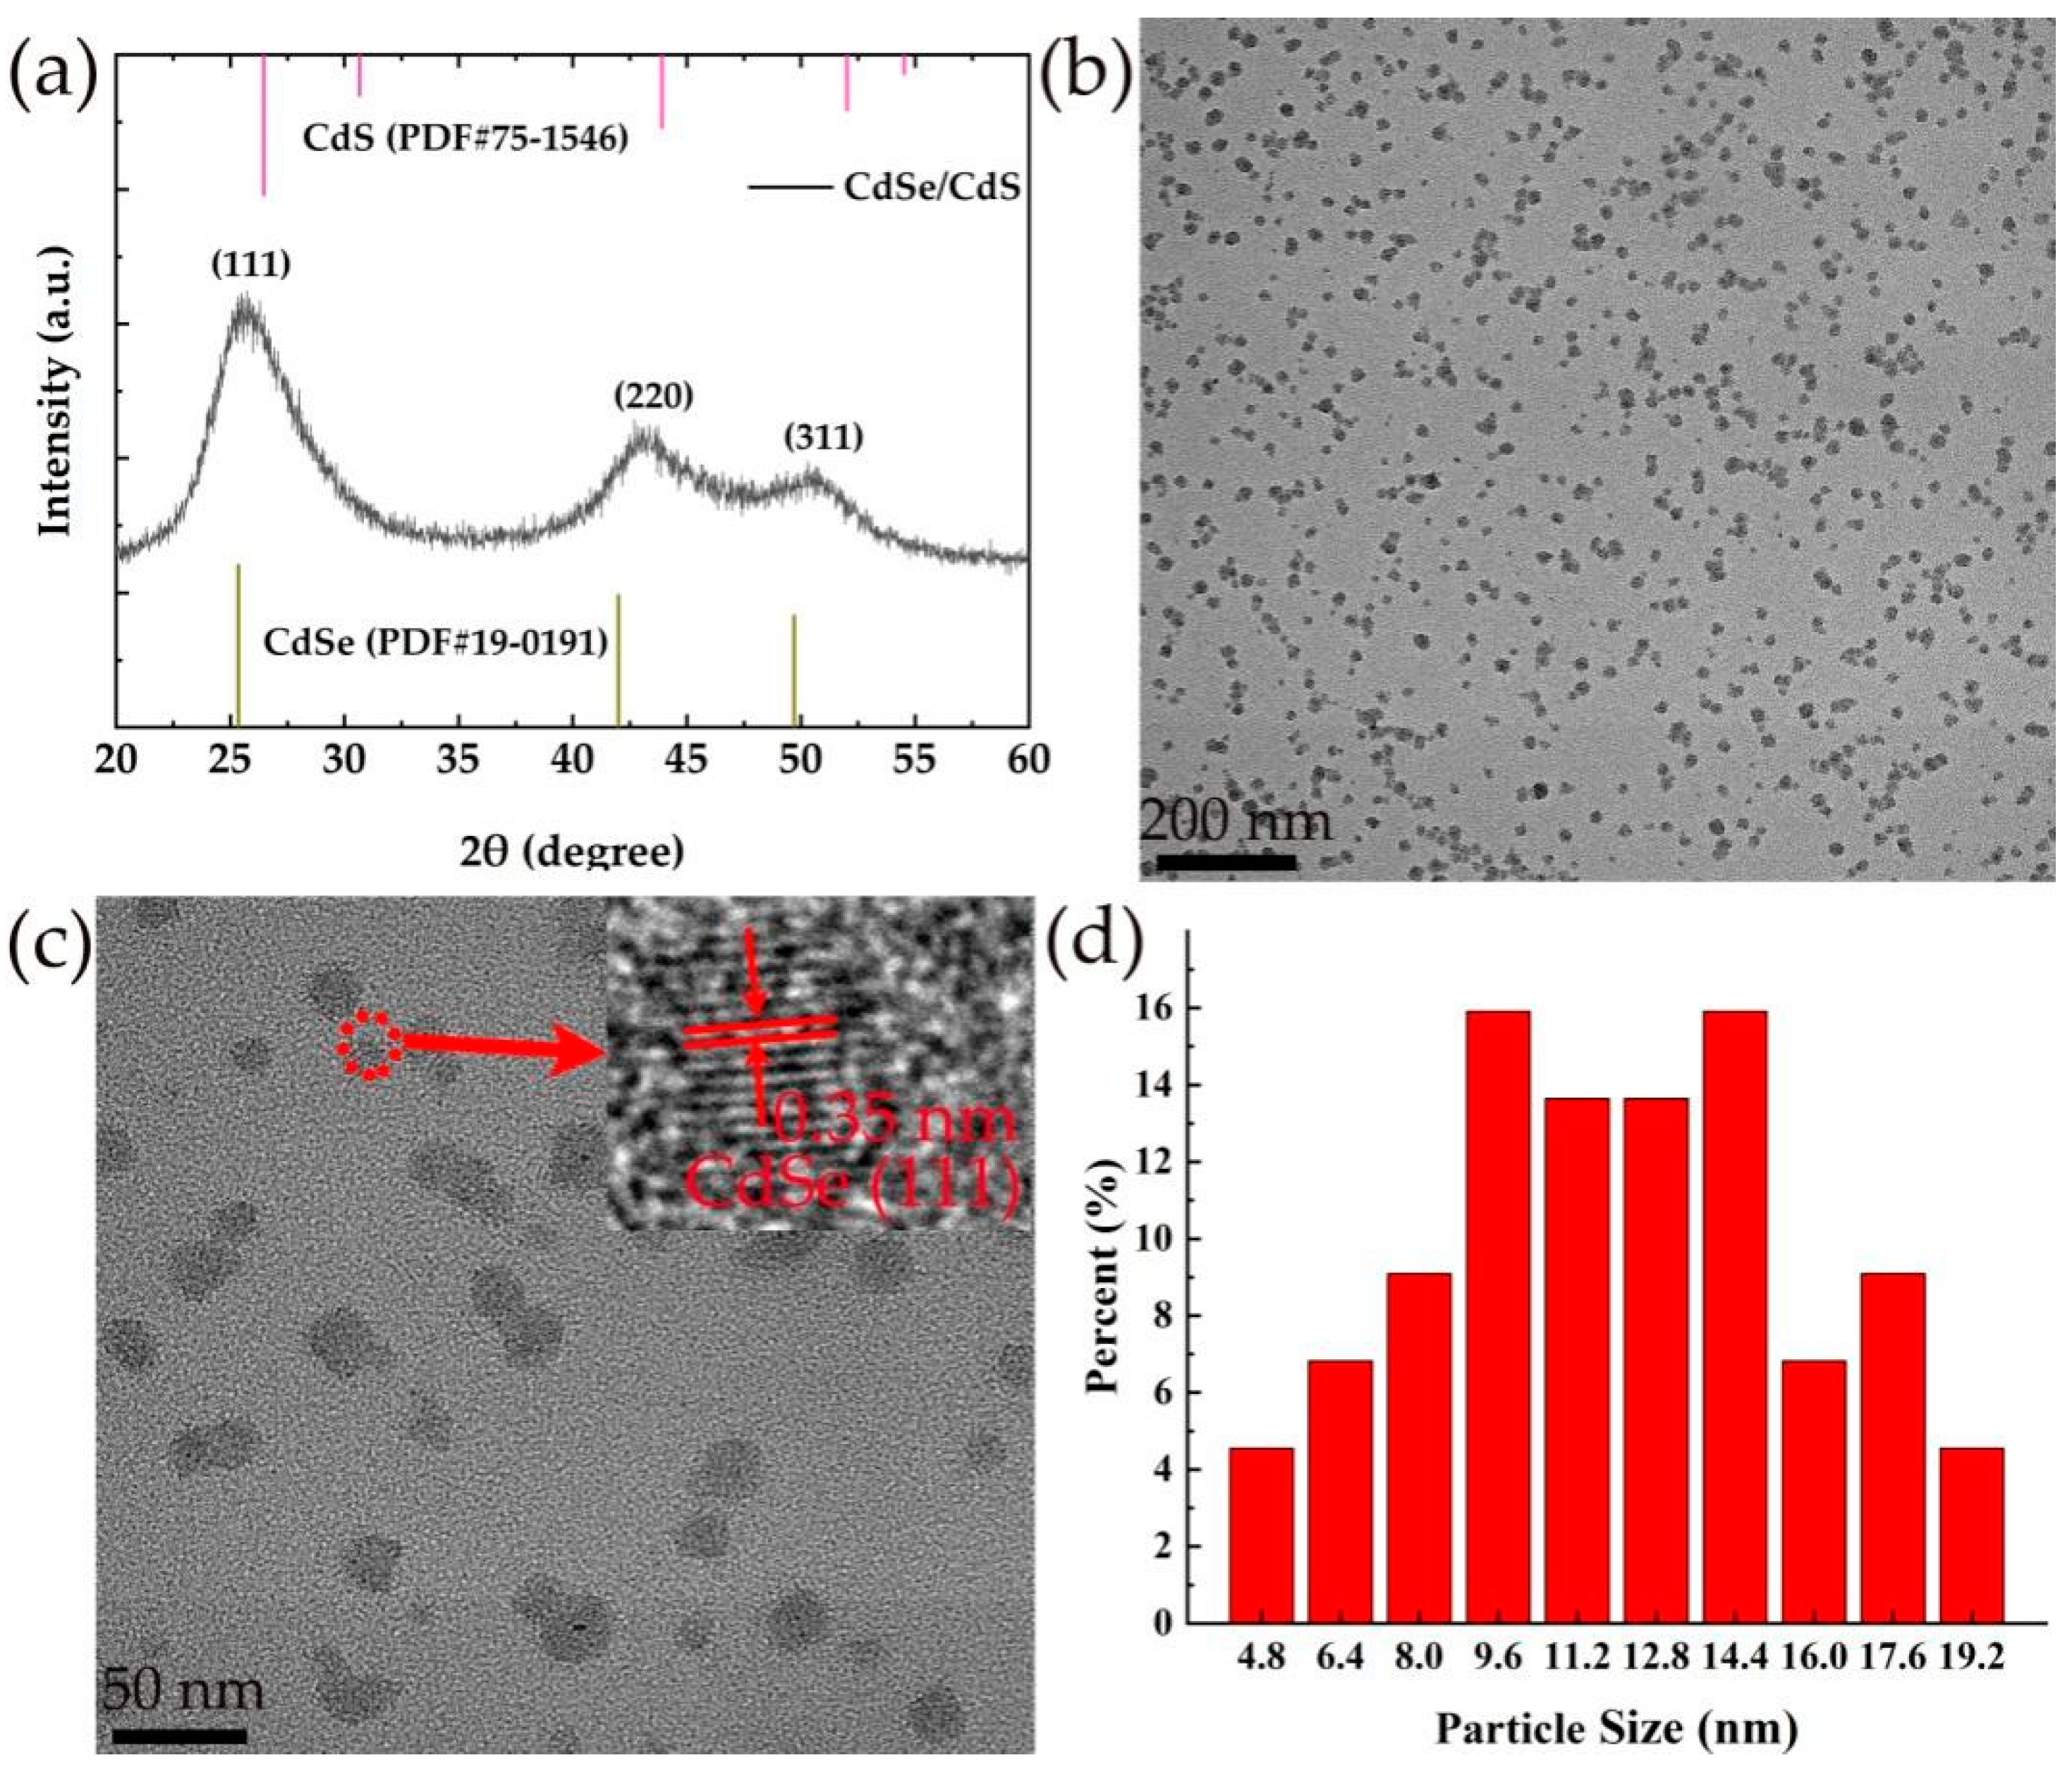
2.2. Synthesis of CdSe/CdS Core-Shell QDs
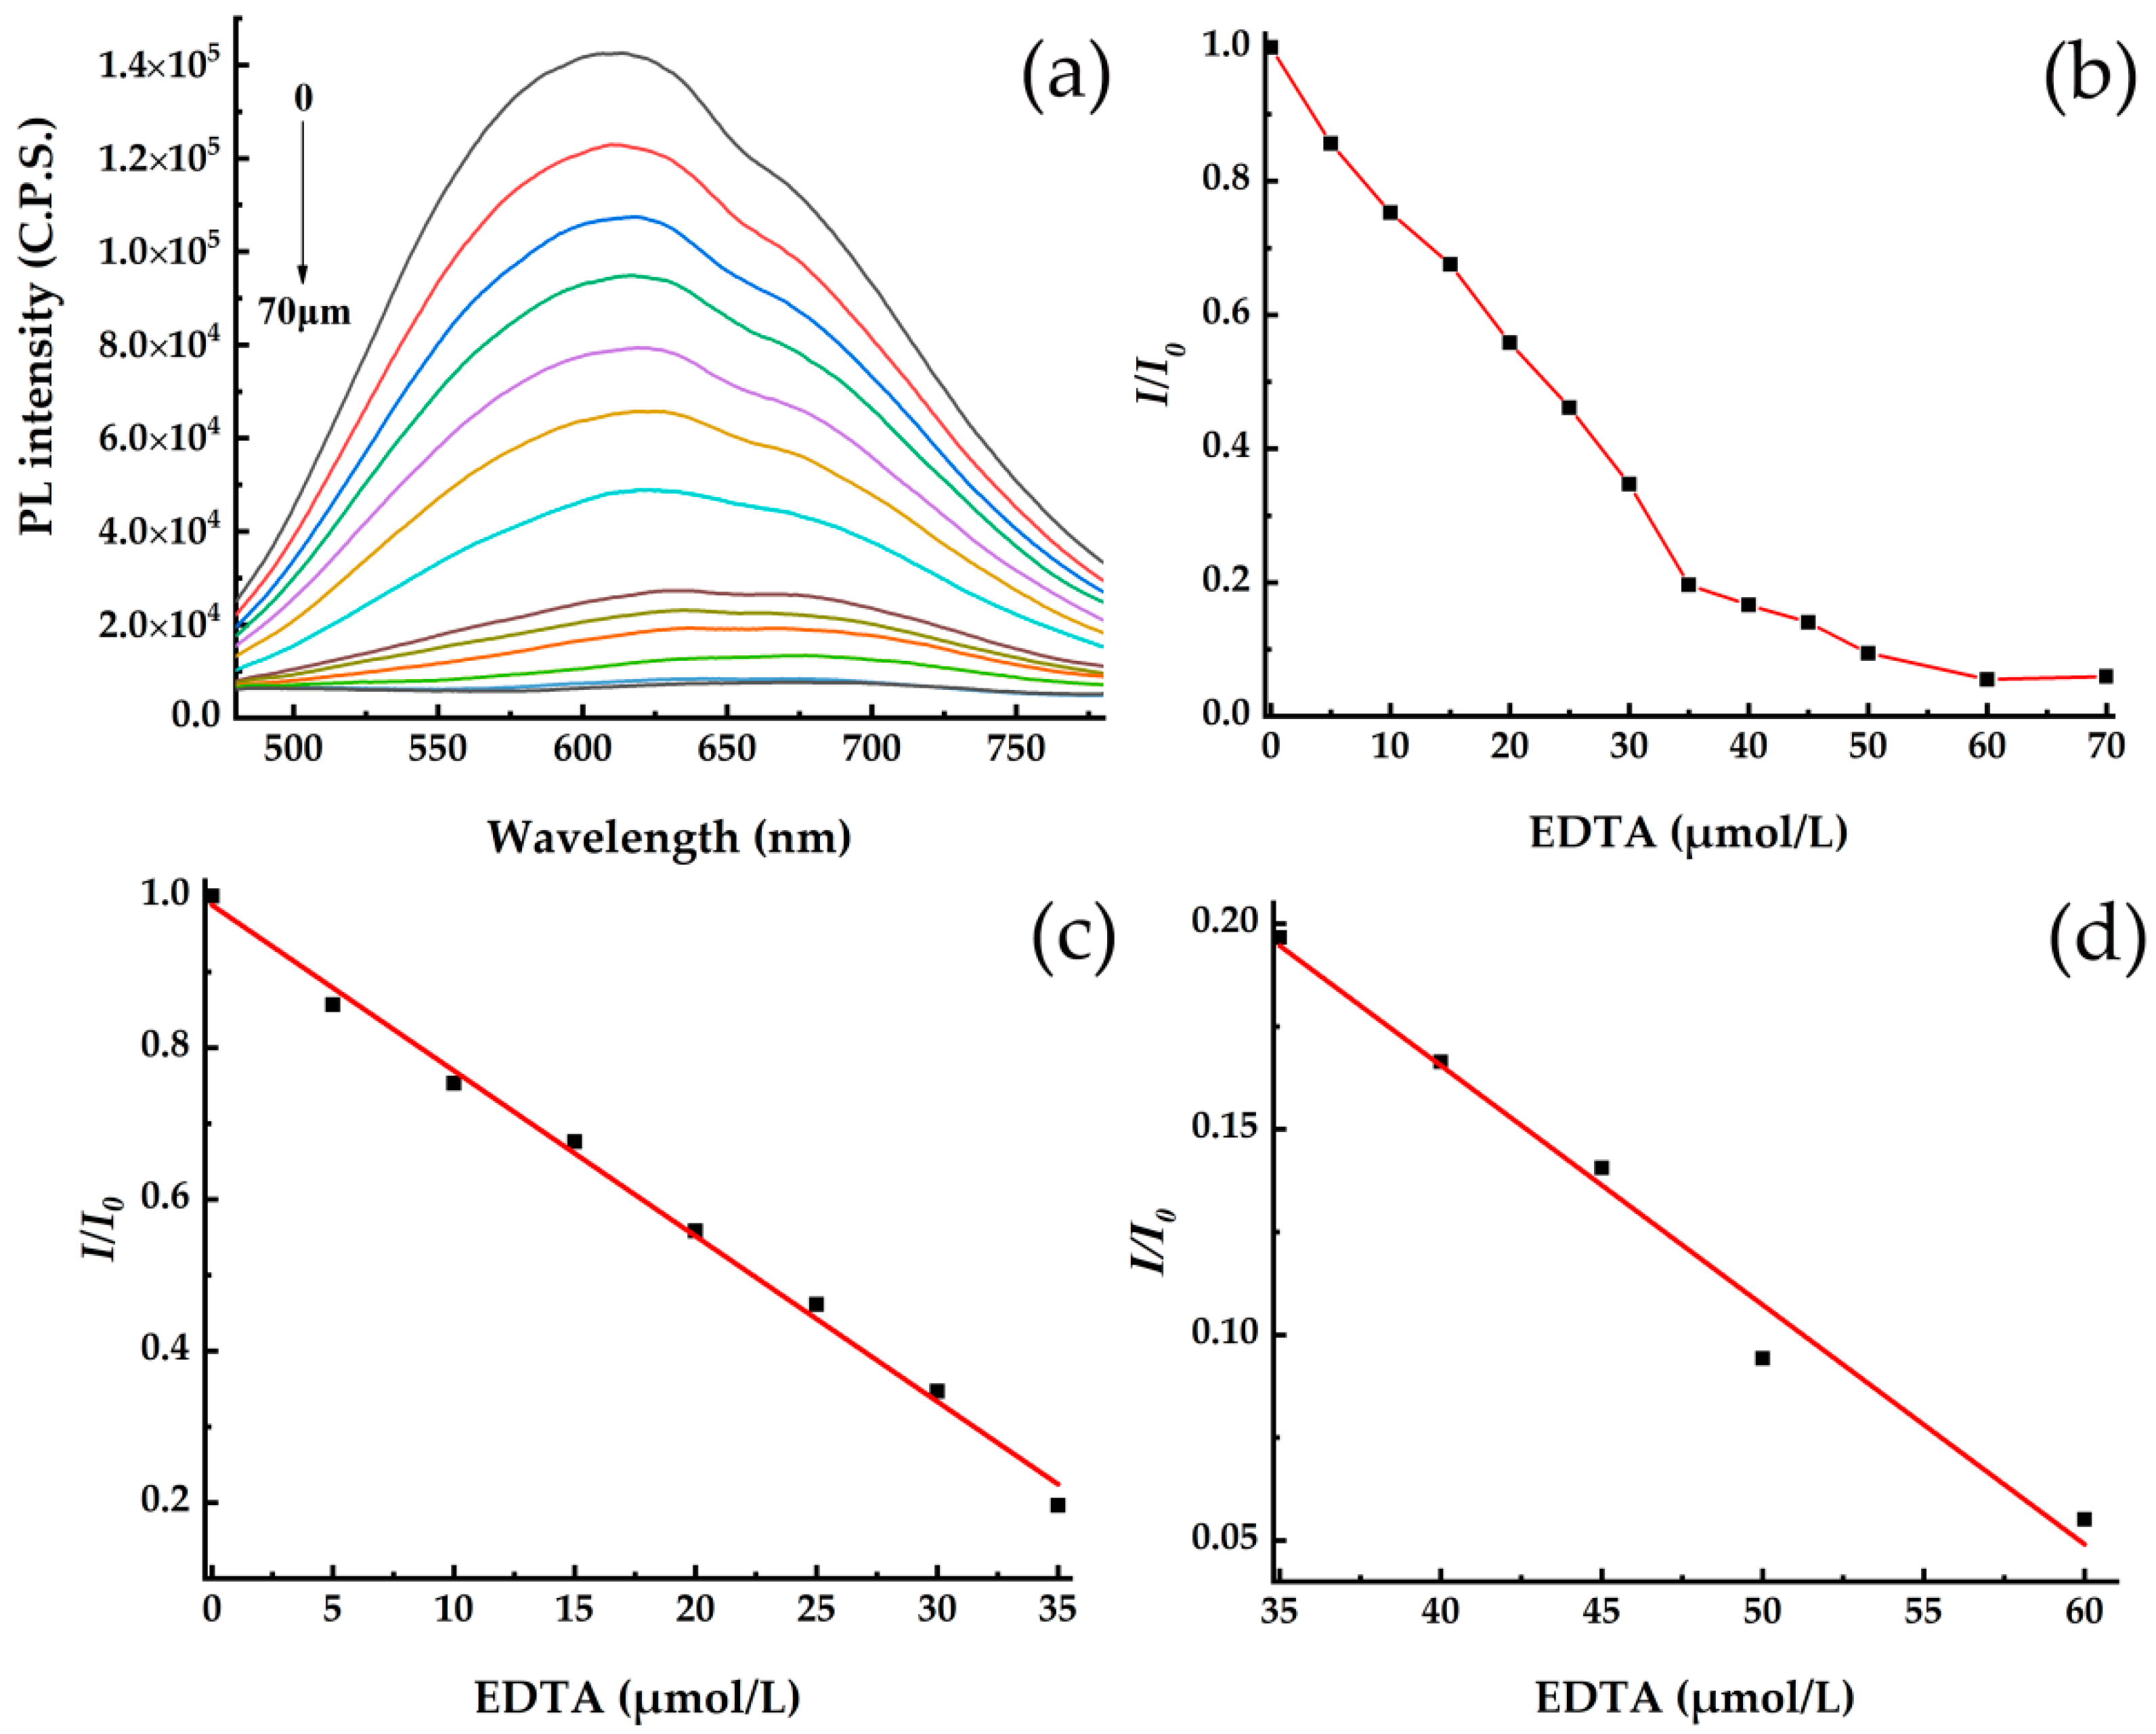
2.3. Fluorescence Quenching Method of CdSe/CdS by EDTA
2.4. Fluorescence Restore Method of EDTA-CdSe/CdS by Cd2+
3. Results and Discussion
3.1. Characterization of CdSe/CdS QDs
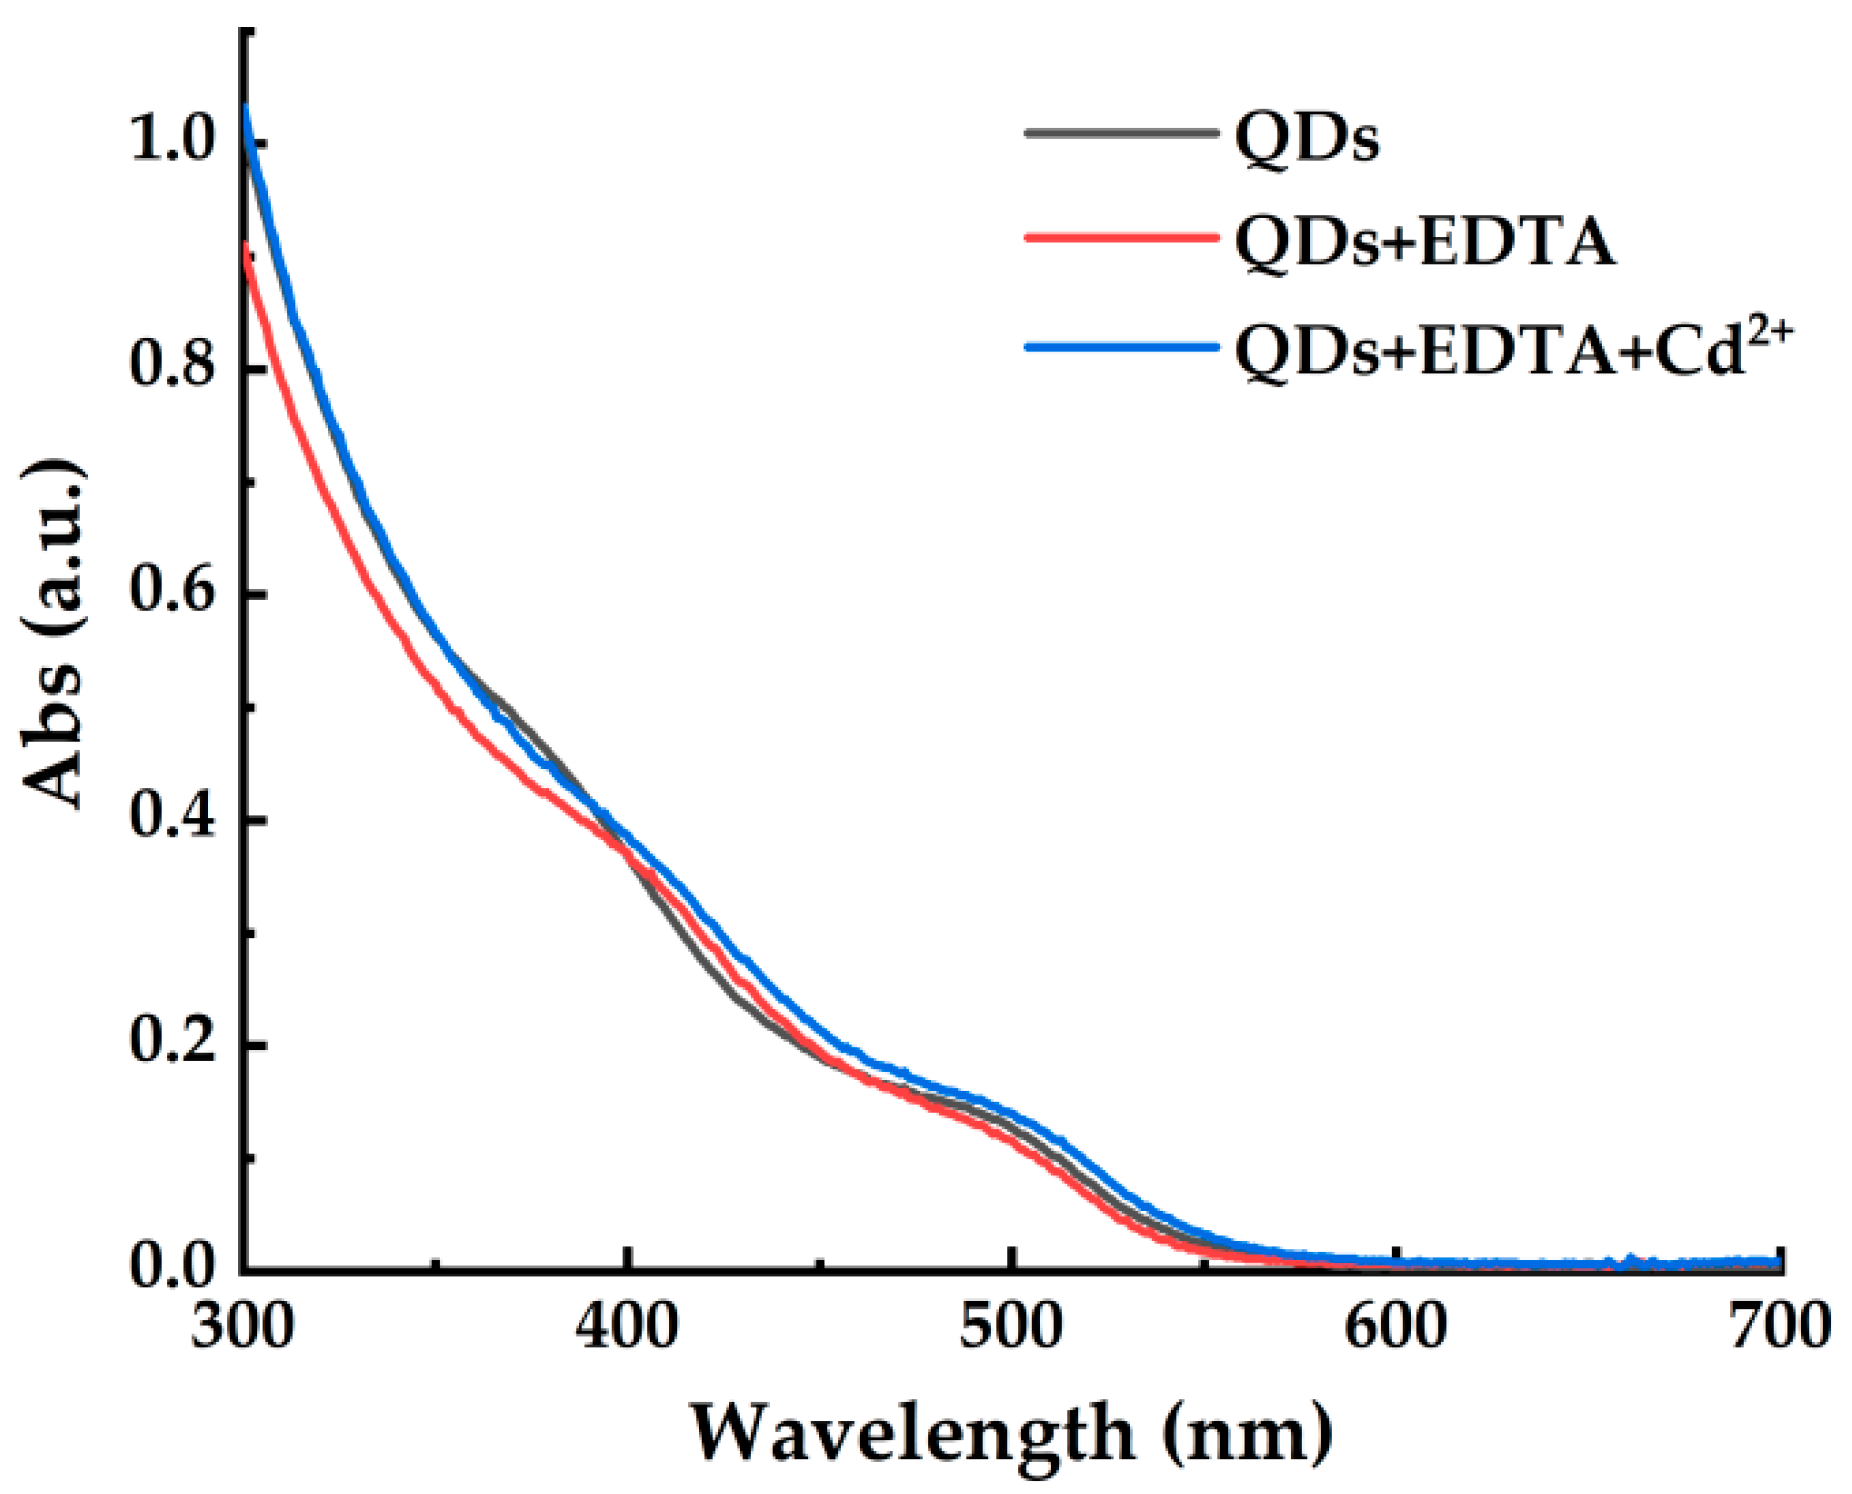
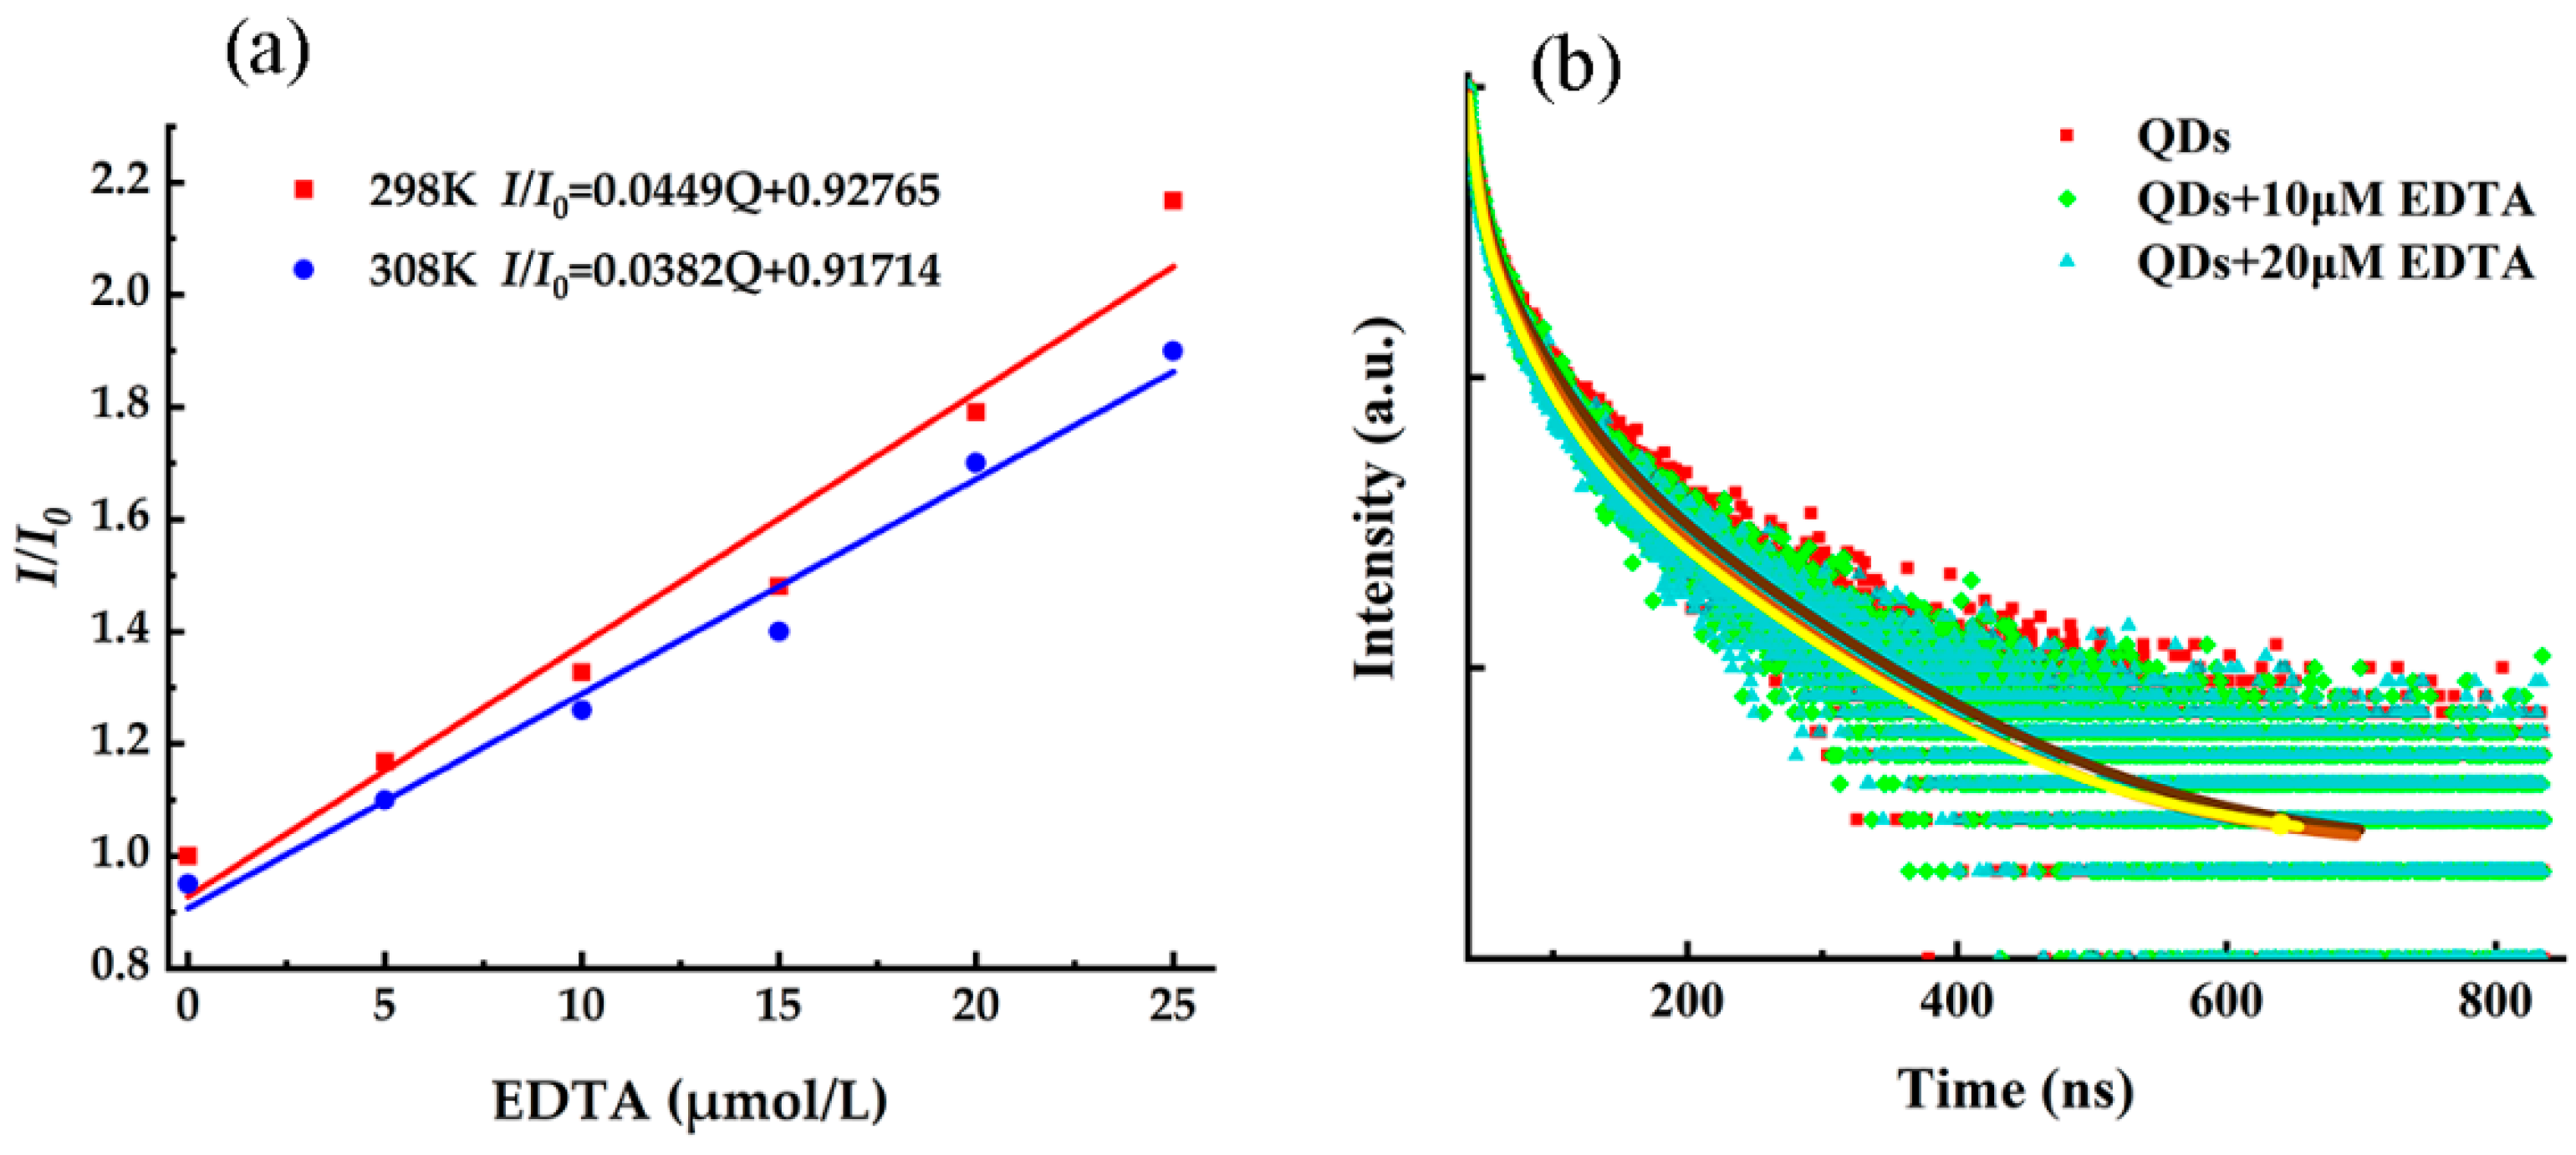
3.2. Fluorescence Quenching Effect of EDTA on CdSe/CdS QDs
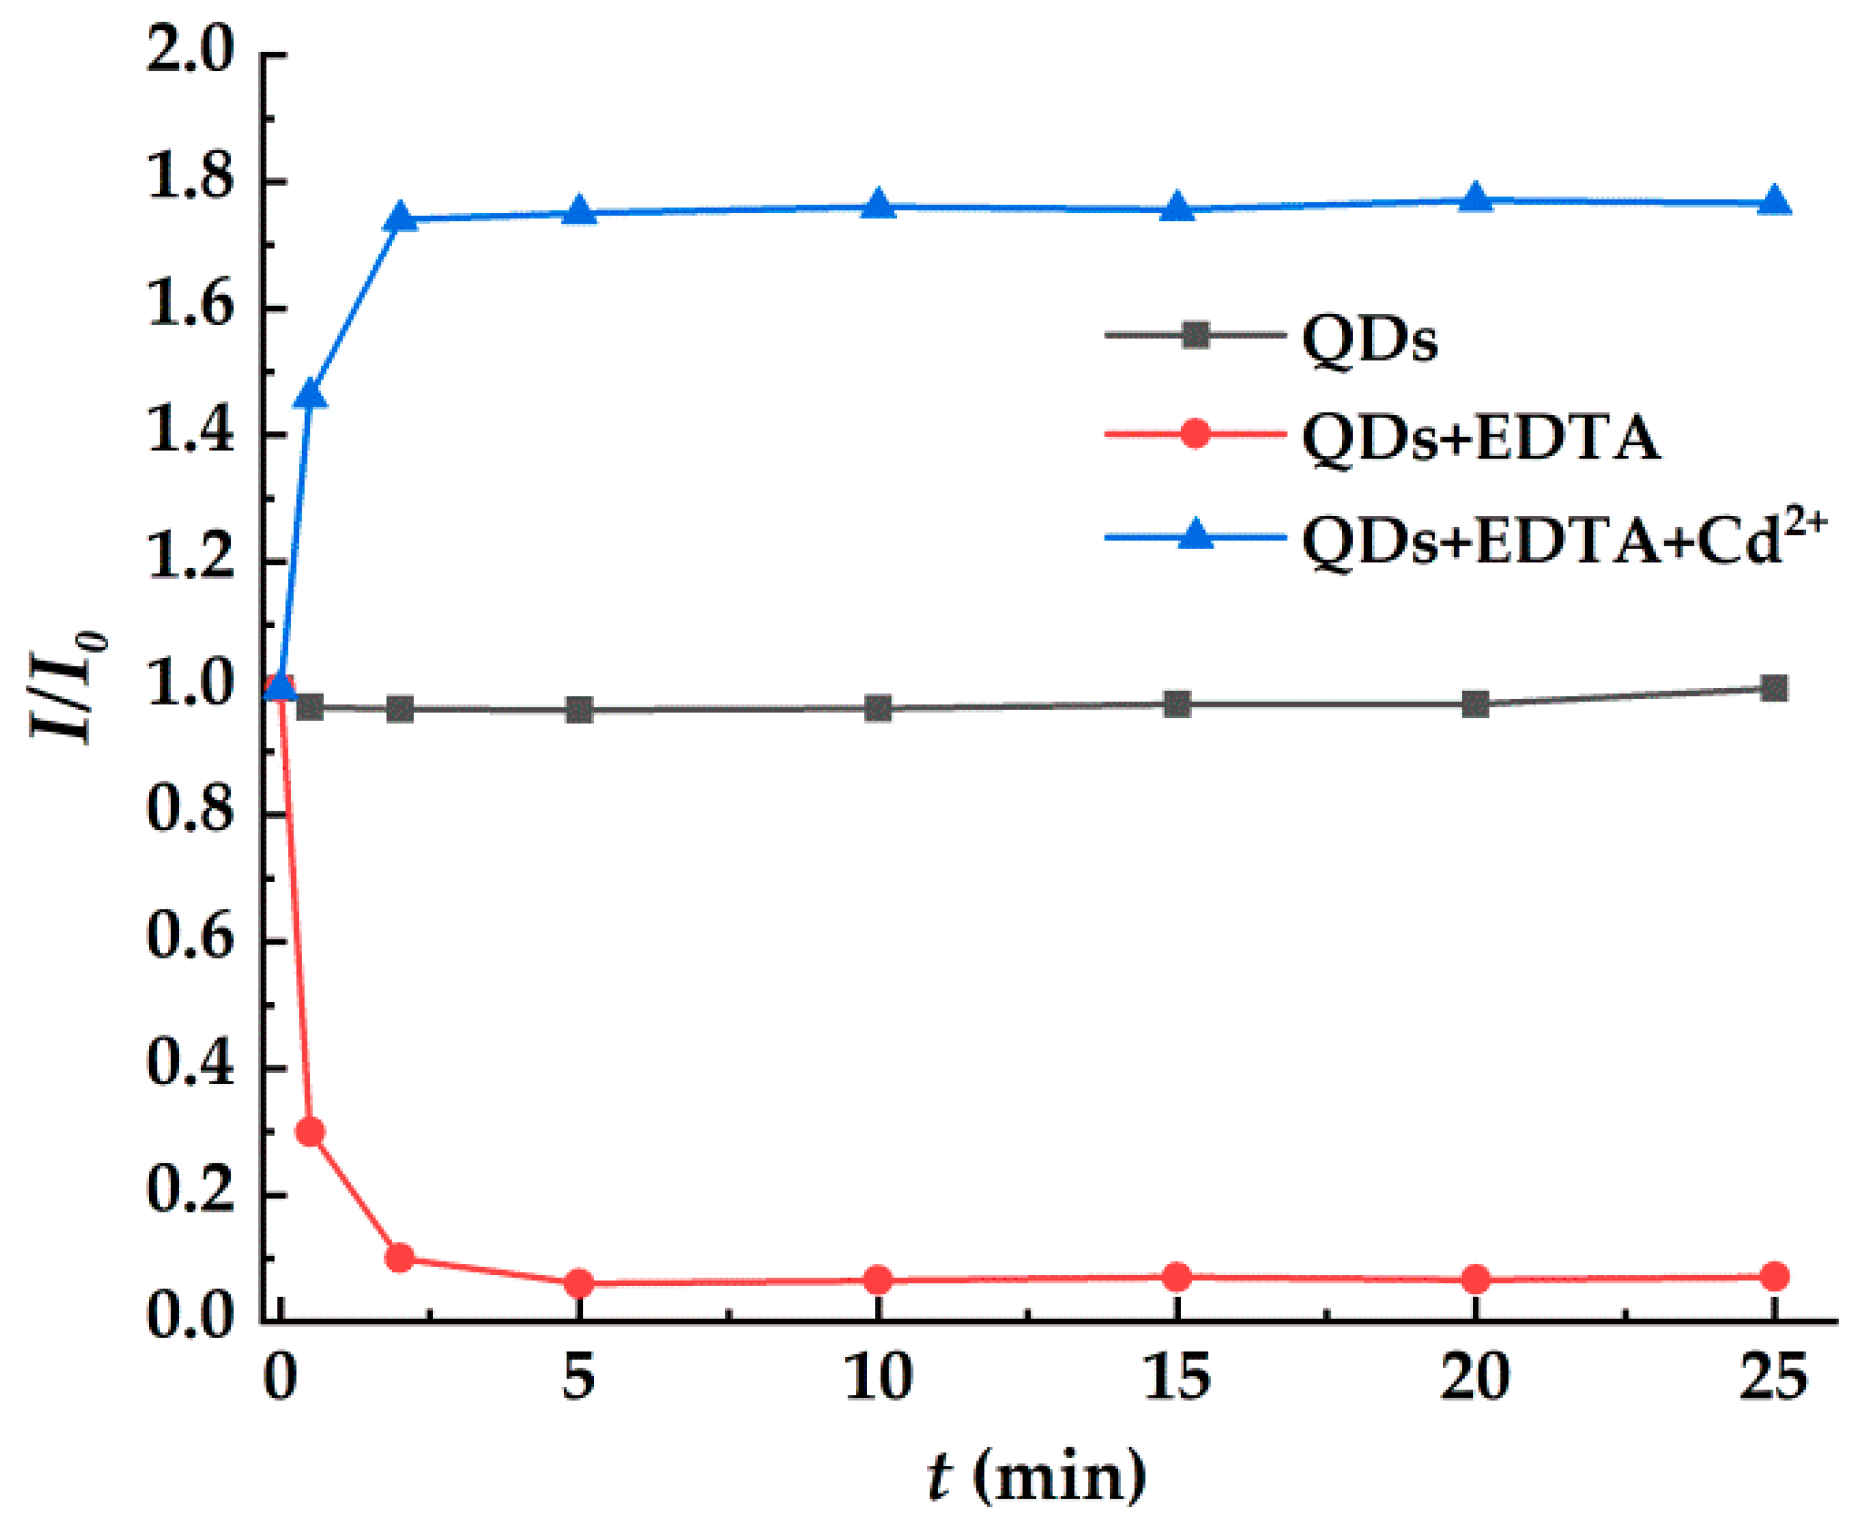
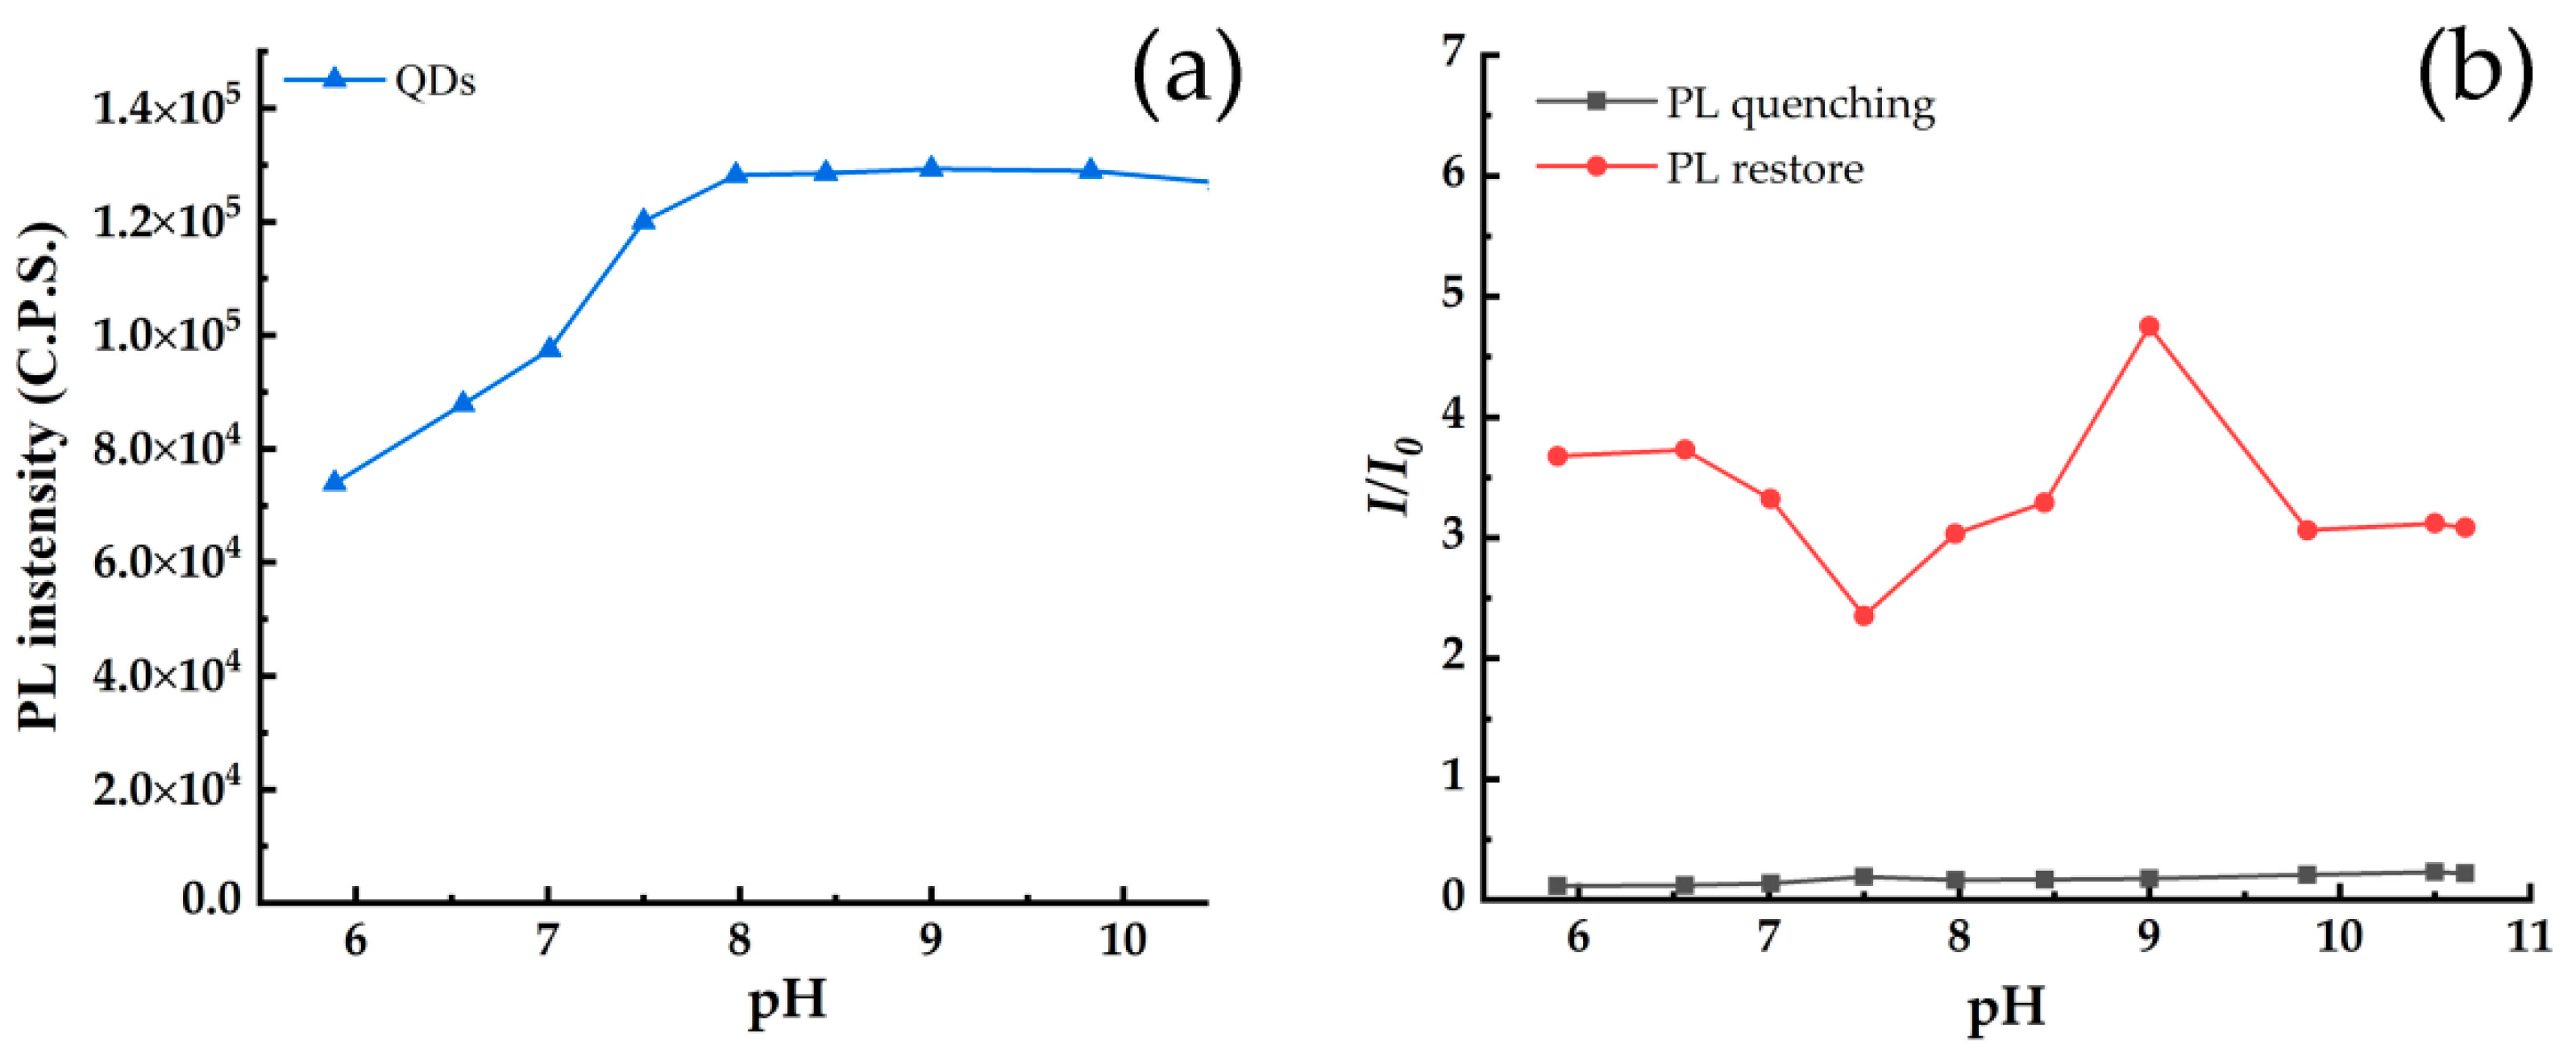
3.3. Relationship between Fluorescence Intensity and Incubation Time and pH of Solution
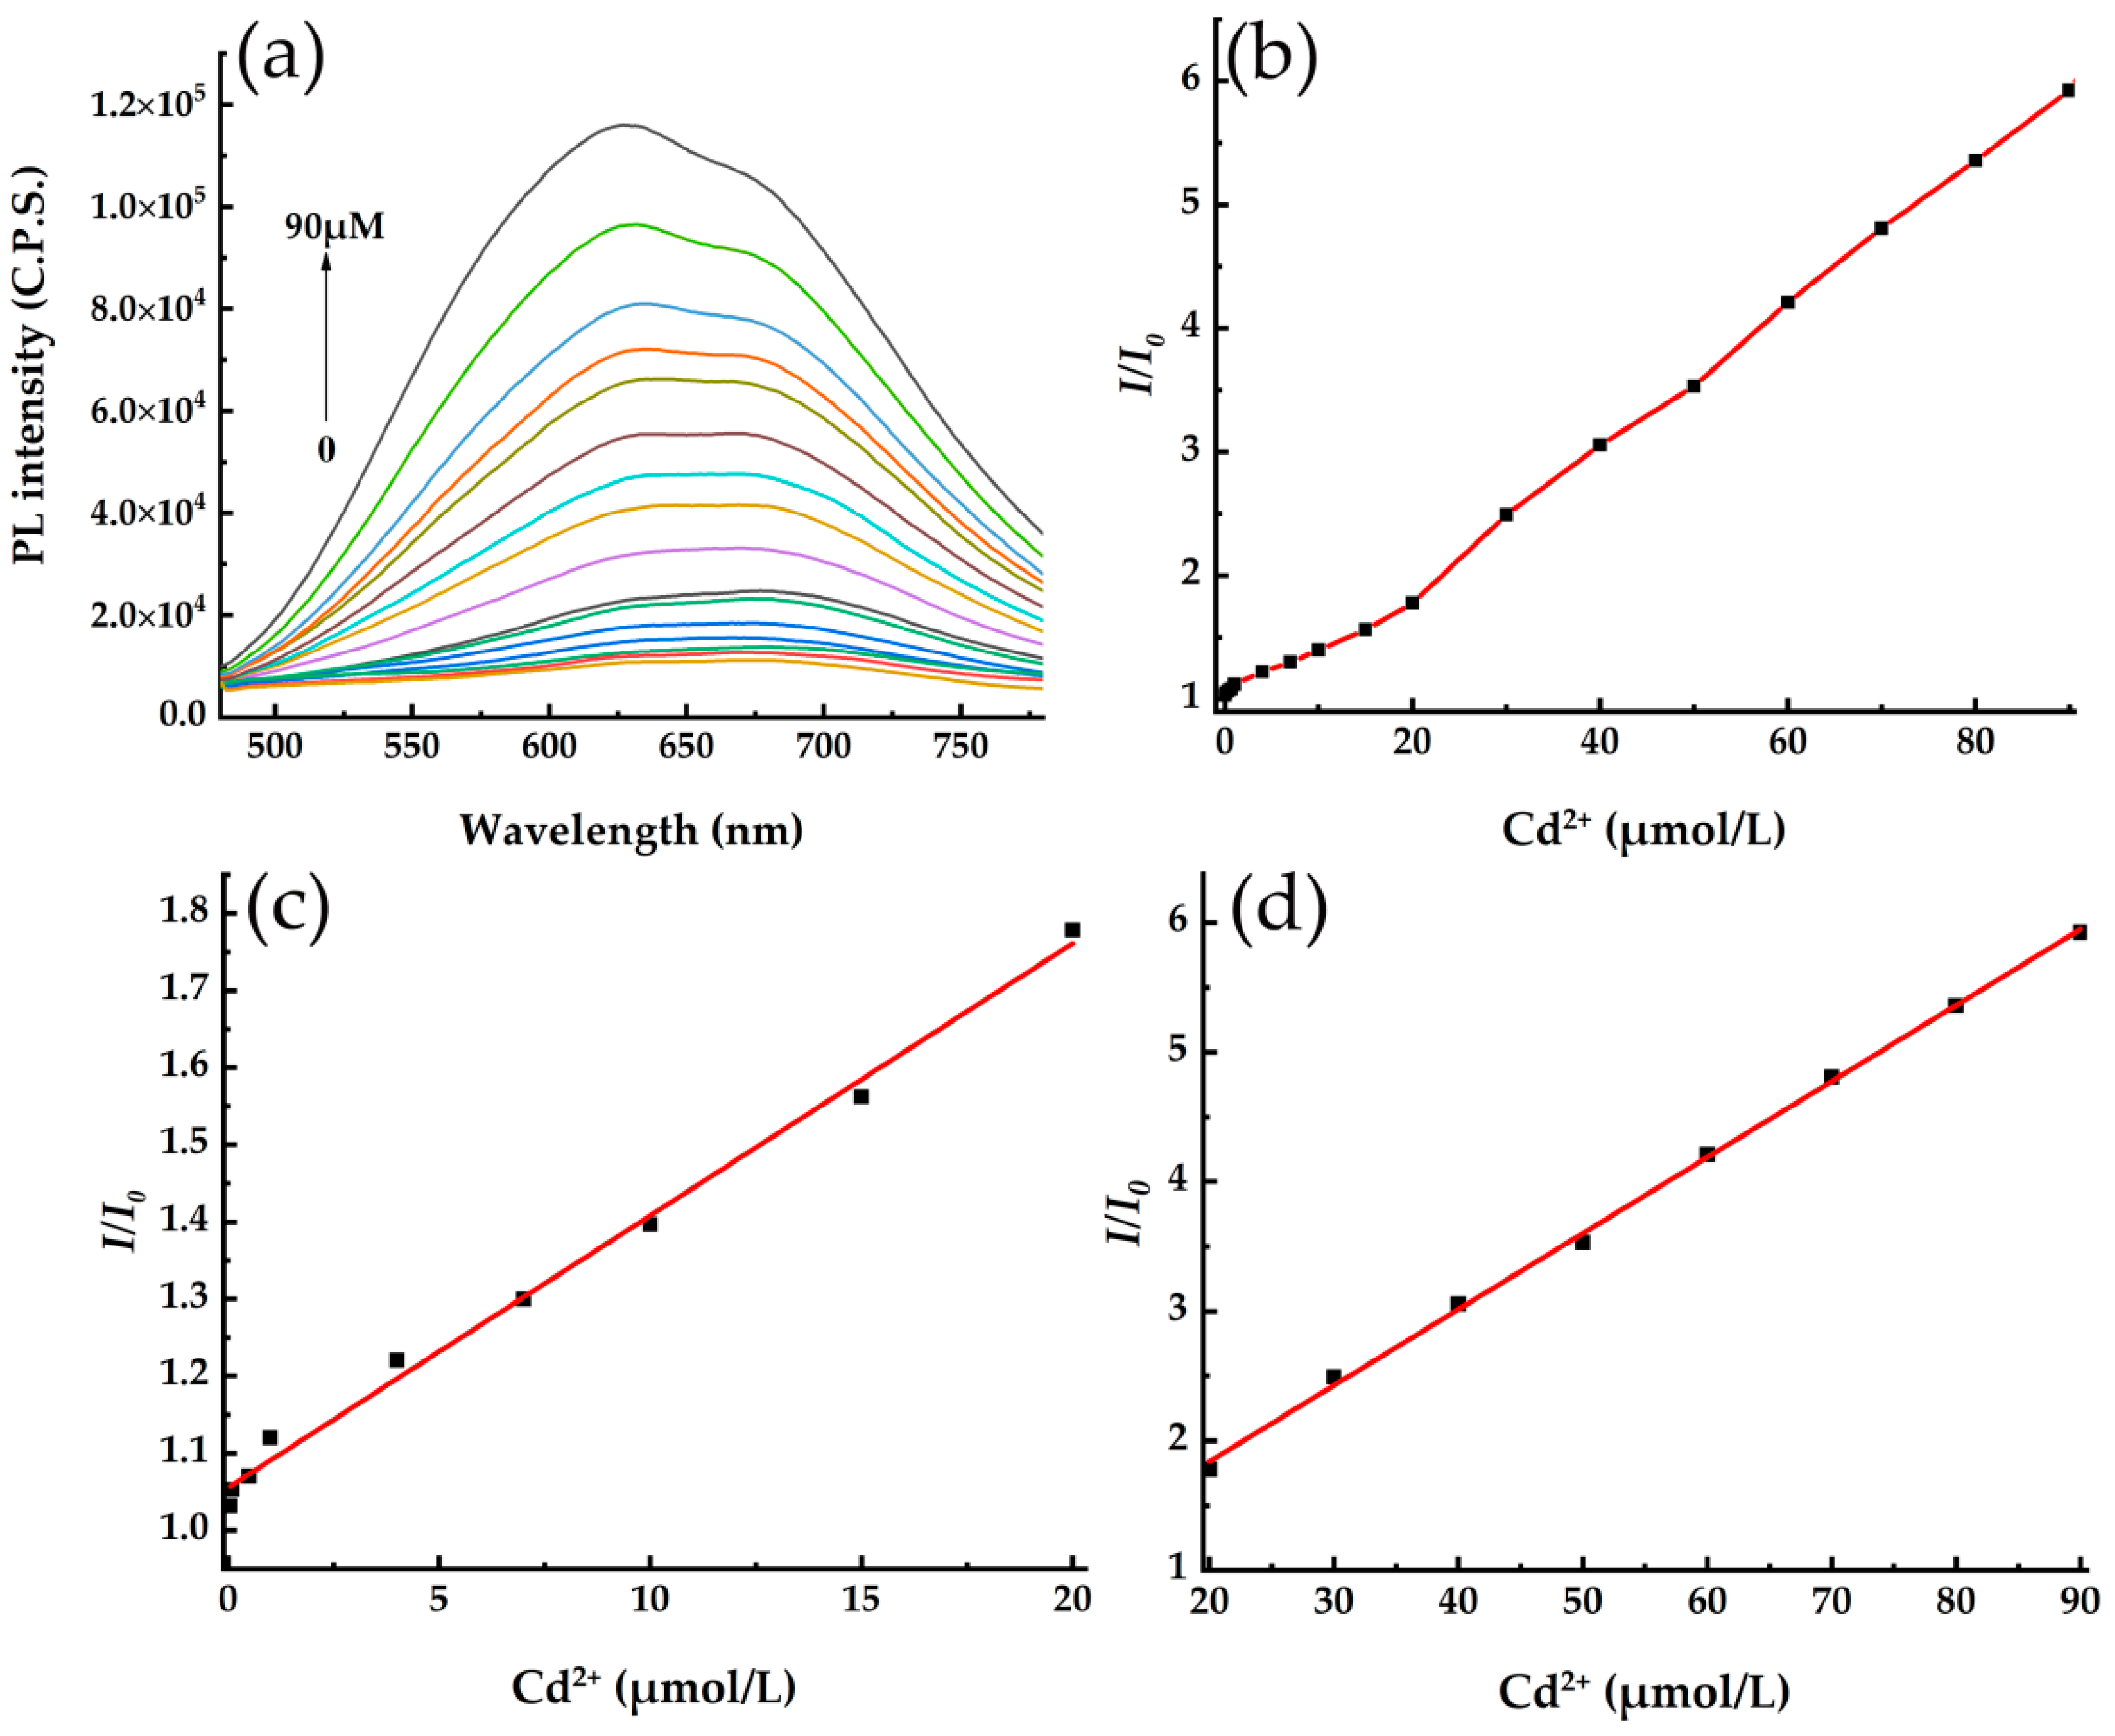
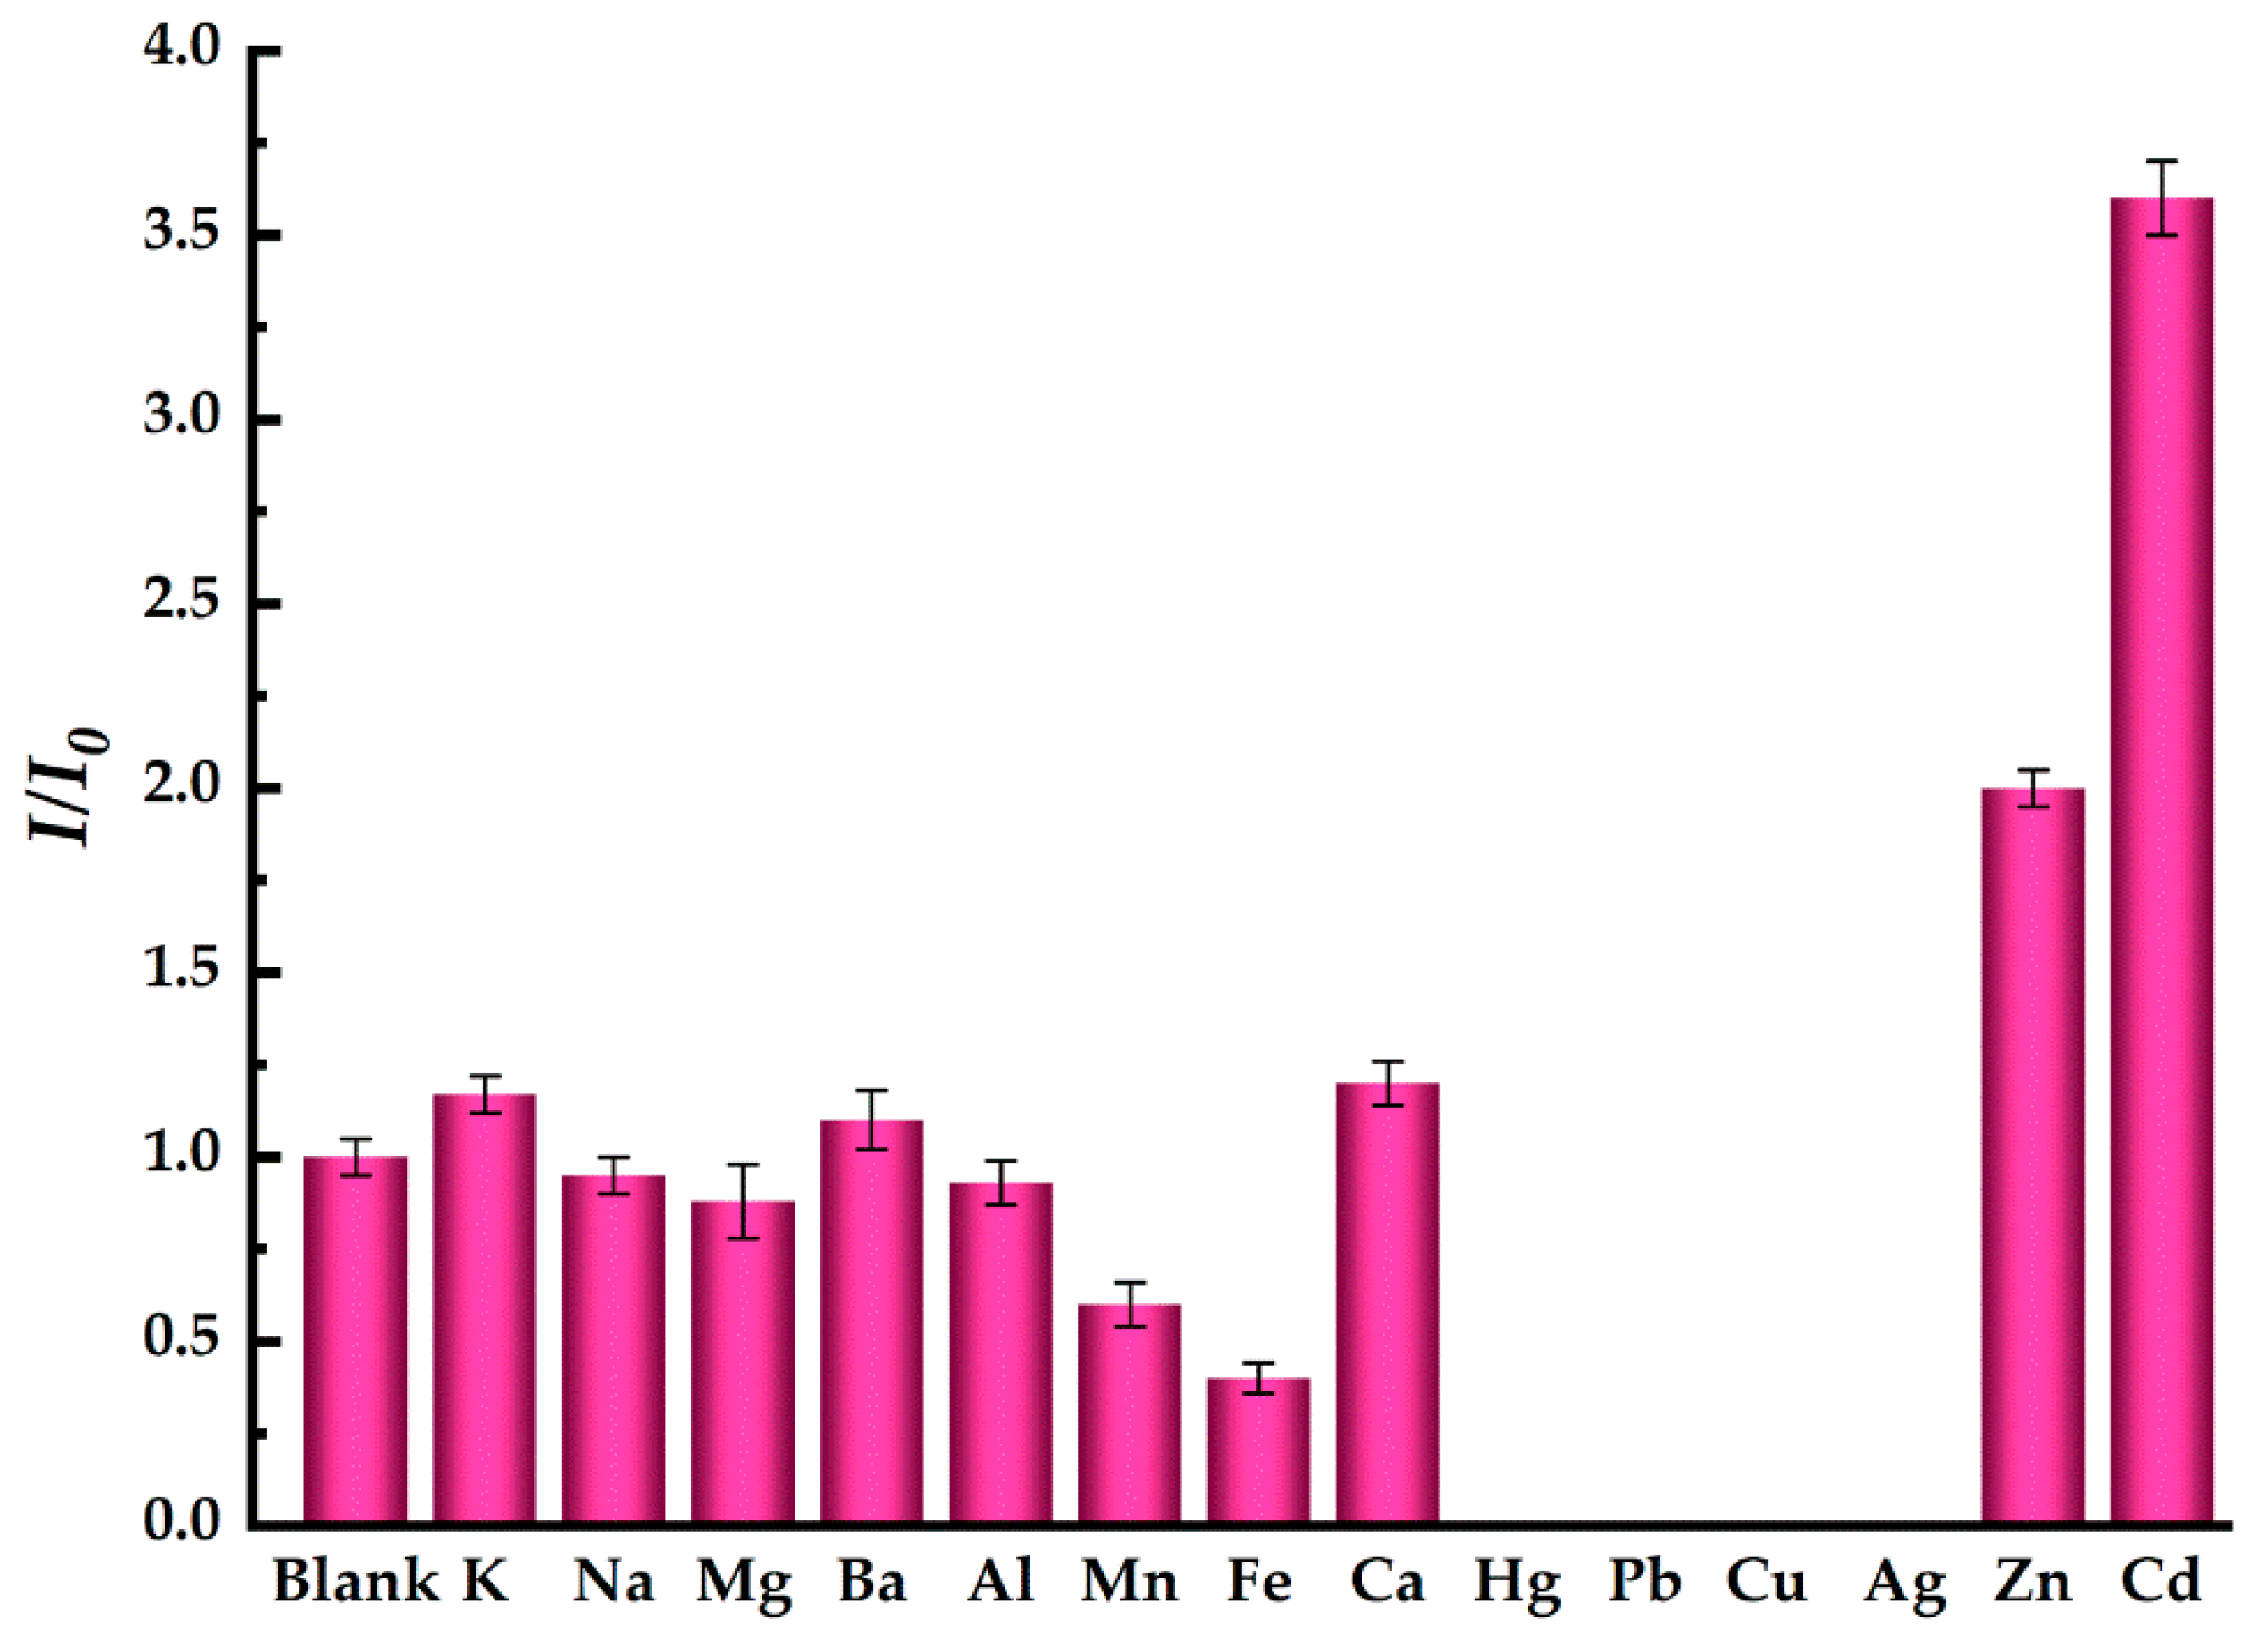
3.4. Detection of Cd2+ in Ultrapure Water Solution
3.5. Detection of Cd2+ in Tap Samples
4. Conclusions
Author Contributions
Funding
Institutional Review Board Statement
Informed Consent Statement
Data Availability Statement
Acknowledgments
Conflicts of Interest
References
- Zhang, X.; Zhang, M.; Liu, H.; Gu, J.; Liu, Y. Environmental sustainability: A pressing challenge to biological sewage treatment processes. Curr. Opin. Environ. Sci. Health 2019, 12, 1–5. [Google Scholar] [CrossRef]
- Yan, F.; Niu, Z.G. Evaluation model of major heavy metals pollution factors in coastal waters and sediments. Desalination Water Treat. 2019, 149, 335–340. [Google Scholar] [CrossRef] [Green Version]
- Huang, X.S.; Zhang, R.J.; Cui, M.J.; Lai, H.J. Experimental Investigation on Bioremediation of Heavy Metal Contaminated Solution by Sporosarcina pasteurii under Some Complex Conditions. Water 2022, 14, 595. [Google Scholar] [CrossRef]
- Zhang, H.; Li, C.; Chen, X.; Fu, H.; Chen, Y.; Ning, S.; Fujita, T.; Wei, Y.; Wang, X. Layered ammonium vanadate nanobelt as efficient adsorbents for removal of Sr2+ and Cs+ from contaminated water. J. Colloid Interface Sci. 2022, 615, 110–123. [Google Scholar] [CrossRef] [PubMed]
- Luo, X.; Zhang, G.H.; Wang, X.; Gu, P. Research on a pellet co-precipitation micro-filtration process for the treatment of liquid waste containing strontium. J. Radioanal. Nucl. Chem. 2013, 298, 931–939. [Google Scholar] [CrossRef]
- El-Saadani, Z.; Mingqi, W.; He, Z.; Hamukwaya, S.L.; Abdel Wahed, M.S.M.; Abu Khatita, A. Environmental geochemistry and fractionation of cadmium metal in surficial bottom sediments and water of the Nile River, Egypt. Toxics 2022, 10, 221. [Google Scholar] [CrossRef]
- Barone, G.; Storelli, A.; Garofalo, R.; Mallamaci, R.; Storelli, M.M. Residual levels of mercury, cadmium, lead and arsenic in some commercially key species from italian coasts (Adriatic Sea): Focus on human health. Toxics 2022, 10, 223. [Google Scholar] [CrossRef]
- Smichowski, P.; Londonio, A. The role of analytical techniques in the determination of metals and metalloids in dietary supplements: A review. Microchem. J. 2018, 136, 113–120. [Google Scholar] [CrossRef]
- Haribala; Hu, B.T.; Wang, C.G.; Gerilemandahu; Xu, X.; Zhang, S.; Bao, S.H.; Li, Y.H. Assessment of radioactive materials and heavy metals in the surface soil around uranium mining area of Tongliao, China. Ecotox. Environ. Safe. 2016, 130, 185–192. [Google Scholar] [CrossRef]
- He, D.; Zhu, Z.L.; Miao, X.; Zheng, H.T.; Li, X.L.; Belshaw, N.S.; Hu, S.H. Determination of trace cadmium in geological samples by membrane desolvation inductively coupled plasma mass spectrometry. Microchem. J. 2019, 148, 561–567. [Google Scholar] [CrossRef]
- Lee, W.; Kim, H.; Kang, Y.; Lee, Y.; Yoon, Y. A biosensor platform for metal detection based on enhanced green fluorescent protein. Sensors 2019, 19, 1846. [Google Scholar] [CrossRef] [PubMed] [Green Version]
- Yao, Y.; Wu, H.; Ping, J.F. Simultaneous determination of Cd(II) and Pb(II) ions in honey and milk samples using a single-walled carbon nanohorns modified screen-printed electrochemical sensor. Food. Chem. 2019, 274, 8–15. [Google Scholar] [CrossRef] [PubMed]
- Petryayeva, E.; Algar, W.R.; Medintz, I.L. Quantum dots in bioanalysis: A review of applications across various platforms for fluorescence spectroscopy and imaging. Appl. Spectrosc. 2013, 67, 215–252. [Google Scholar] [CrossRef] [Green Version]
- Lin, L.P.; Wang, Y.H.; Xiao, Y.L.; Liu, W. Hydrothermal synthesis of carbon dots codoped withnitrogen and phosphorusas a turn-on fluorescent probe for cadmium(II). Microchim. Acta 2019, 186, 147. [Google Scholar] [CrossRef] [PubMed]
- Pan, Y.C.; Xiao, W.S.; Fan, M.; Chen, W.X.; Xu, S.H. Detection of Cd(II) ions by a self-tuning method using quantum dot fluorescence sensing. Mater. Res. Express. 2017, 4, 105008. [Google Scholar] [CrossRef] [Green Version]
- Lin, W.X.; Xie, X.C.; Wang, Y.J.; Chen, J.J. A new fluorescent probe for selective Cd2+ detection and cell imaging. Z. Anorg. Allg. Chem. 2019, 645, 645–648. [Google Scholar] [CrossRef]
- Su, W.; Yuan, S.Z.; Wang, E.J. A rhodamine-based fluorescent chemosensor for the detection of Pb2+, Hg2+ and Cd2+. J. Fluoresc. 2017, 27, 1871–1875. [Google Scholar] [CrossRef]
- Pourreza, N.; Mousavi, H.Z. Determination of cadmium by flame atomic absorption spectrometry after preconcentration on naphthalene-methyltrioctylammonium chloride adsorbent as tetraiodocadmate (II) ions. Anal. Chim. Acta. 2004, 503, 279–282. [Google Scholar] [CrossRef]
- Aldewachi, H.; Chalati, T.; Woodroofe, M.N.; Bricklebank, N.; Sharrack, B.; Gardiner, P. Gold nanoparticle-based colorimetric biosensors. Nanoscale 2018, 10, 18–33. [Google Scholar] [CrossRef] [Green Version]
- Liu, J.; Zhao, X.Y.; Xu, H.Y.; Wang, Z.Y.; Dai, Z.H. Amino acid-capped water-soluble near-infrared region CuInS2/ZnS quantum dots for selective cadmium ion determination and multicolor cell imaging. Anal. Chem. 2019, 91, 8987–8993. [Google Scholar] [CrossRef]
- Wang, S.N.; Zhu, J.; Li, X.; Li, J.J.; Zhao, J.W. Fluorescence turn-on sensing of trace cadmium ions based on EDTA-etched CdTe@CdS quantum dot. Spectrochim. Acta A 2018, 201, 119–127. [Google Scholar] [CrossRef] [PubMed]
- Niu, W.J.; Shan, D.; Zhu, R.H.; Deng, S.Y.; Cosnier, S.; Zhang, X.J. Dumbbell-shaped carbon quantum dots/AuNCs nanohybrid as an efficient ratiometric fluorescent probe for sensing cadmium (II) ions and l-ascorbic acid. Carbon 2016, 96, 1034–1042. [Google Scholar] [CrossRef]
- Jing, W.; Chenxing, J.; Xiaoqi, W.; Ligeng, W.; Aimin, C.; Jun, H.; Zhihui, L. Fabrication of an “ion-imprinting” dual-emission quantum dot nanohybrid for selective fluorescence turn-on and ratiometric detection of cadmium ions. Analyst 2016, 141, 5886. [Google Scholar]
- Wang, Z.; Yang, Y.; Zou, T.; Xing, X.; Zhao, R.; Wang, Y. Novel method for the qualitative identification of chromium ions (III) using l-aspartic acid stabilized CdS quantum dots. J. Phys. Chem. Solids 2020, 136, 109160. [Google Scholar] [CrossRef]
- Liu, F.; Li, S.; Hu, R.; Shao, N. Core-shell structured CdTe/CdS@SiO2@CdTe@SiO2 composite fluorescent spheres: Synthesis and application for Cd2+ detection. Luminescence 2017, 32, 723–729. [Google Scholar] [CrossRef]
- Yin, Y.; Yang, Q.L.; Liu, G. Ammonium pyrrolidine dithiocarbamate-modified CdTe/CdS quantum dots as a turn-on fluorescent sensor for detection of trace cadmium ions. Sensors 2020, 20, 312. [Google Scholar] [CrossRef] [Green Version]
- Wang, J.; Zhou, X.; Ma, H.; Tao, G. Diethyldithiocarbamate functionalized CdSe/CdS quantum dots as a fluorescent probe for copper ion detection. Spectrochim. Acta A 2011, 81, 178–183. [Google Scholar] [CrossRef]
- Talapin, D.V.; Mekis, I.; Götzinger, S.; Kornowski, A.; Benson, O.; Weller, H. CdSe/CdS/ZnS and CdSe/ZnSe/ZnS core−shell−shell nanocrystals. Spectrochim. Acta A 2004, 108, 18826–18831. [Google Scholar] [CrossRef]
- Mohammad-Rezaei, R.; Razmi, H.; Abdolmohammad-Zadeh, H. d-penicillamine capped cadmium telluride quantum dots as a novel fluorometric sensor of copper (II). Luminescence 2013, 28, 503–509. [Google Scholar] [CrossRef]
- Xu, H.; Miao, R.; Fang, Z.; Zhong, X. Quantum dot-based “turn-on” fluorescent probe for detection of zinc and cadmium ions in aqueous media. Anal. Chim. Acta 2011, 687, 82–88. [Google Scholar] [CrossRef]
- Jiang, C.Q.; Gao, M.X.; He, J.X. Study of the interaction between terazosin and serum albumin: Synchronous fluorescence determination of terazosin. Anal. Chim. Acta 2002, 452, 185–189. [Google Scholar] [CrossRef]
- Bian, W.; Wang, F.; Zhang, H.; Zhang, L.; Wang, L.; Shuang, S. Fluorescent probe for detection of Cu2+ using core-shell CdTe/ZnS quantum dots. Luminescence 2015, 30, 1064–1070. [Google Scholar] [CrossRef] [PubMed]
- Punithakumari, G.; Wu, S.P.; Velmathi, S. Highly selective detection of Cr3+ ion with colorimetric & fluorescent response via chemodosimetric approach in aqueous medium. J. Fluoresc. 2018, 28, 663–670. [Google Scholar] [PubMed]
- Xia, Y.S.; Cao, C.; Zhu, C.Q. Two distinct photoluminescence responses of CdTe quantum dots to Ag (I). J. Lumin. 2008, 128, 166–172. [Google Scholar] [CrossRef]
- Xie, H.Y.; Liang, J.G.; Zhang, Z.L.; Liu, Y.; He, Z.K.; Pang, D.W. Luminescent CdSe-ZnS quantum dots as selective Cu2+ probe. Spectrochim. Acta Part A Mol. Biomol. Spectrosc. 2004, 60, 2527–2530. [Google Scholar] [CrossRef]
- Susha, A.S.; Javier, A.M.; Parak, W.J.; Rogach, A.L. Luminescent CdTe nanocrystals as ion probes and pH sensors in aqueous solutions. Colloids Surf. A Physicochem. Eng. Asp. 2006, 281, 40–43. [Google Scholar] [CrossRef]

| Sample (No.) | Cd2+ Concentration (µmol/L) | ICP-MS Method | Proposed Method (µmol/L) | Recovery (%) | RSD (%, n = 3) |
|---|---|---|---|---|---|
| (µmol/L) | |||||
| 1 | 10 | 9.65 | 9.68 | 96.8 | 2.6 |
| 2 | 20 | 20.56 | 20.95 | 104.8 | 1.8 |
| 3 | 30 | 30.08 | 29.12 | 97.1 | 3.8 |
| Mean value | / | / | 99.6 | 2.8 |
Publisher’s Note: MDPI stays neutral with regard to jurisdictional claims in published maps and institutional affiliations. |
© 2022 by the authors. Licensee MDPI, Basel, Switzerland. This article is an open access article distributed under the terms and conditions of the Creative Commons Attribution (CC BY) license (https://creativecommons.org/licenses/by/4.0/).
Share and Cite
Wang, D.; Gao, F.; Wang, X.; Ning, X.; Wang, K.; Wang, X.; Wei, Y.; Fujita, T. Detection of Cd2+ in Aqueous Solution by the Fluorescent Probe of CdSe/CdS QDs Based on OFF–ON Mode. Toxics 2022, 10, 367. https://doi.org/10.3390/toxics10070367
Wang D, Gao F, Wang X, Ning X, Wang K, Wang X, Wei Y, Fujita T. Detection of Cd2+ in Aqueous Solution by the Fluorescent Probe of CdSe/CdS QDs Based on OFF–ON Mode. Toxics. 2022; 10(7):367. https://doi.org/10.3390/toxics10070367
Chicago/Turabian StyleWang, Dengpeng, Feng Gao, Xianran Wang, Xiaomei Ning, Kaituo Wang, Xinpeng Wang, Yuezhou Wei, and Toyohisa Fujita. 2022. "Detection of Cd2+ in Aqueous Solution by the Fluorescent Probe of CdSe/CdS QDs Based on OFF–ON Mode" Toxics 10, no. 7: 367. https://doi.org/10.3390/toxics10070367