
Quantitative Representation of Water Quality Biotoxicity by Algal Photosynthetic Inhibition

Abstract
:1. Introduction
2. Algorithm
2.1. BP Neural Network
2.2. Support Vector Machine for Regression
3. Experiment Measurement and Parameters Selection
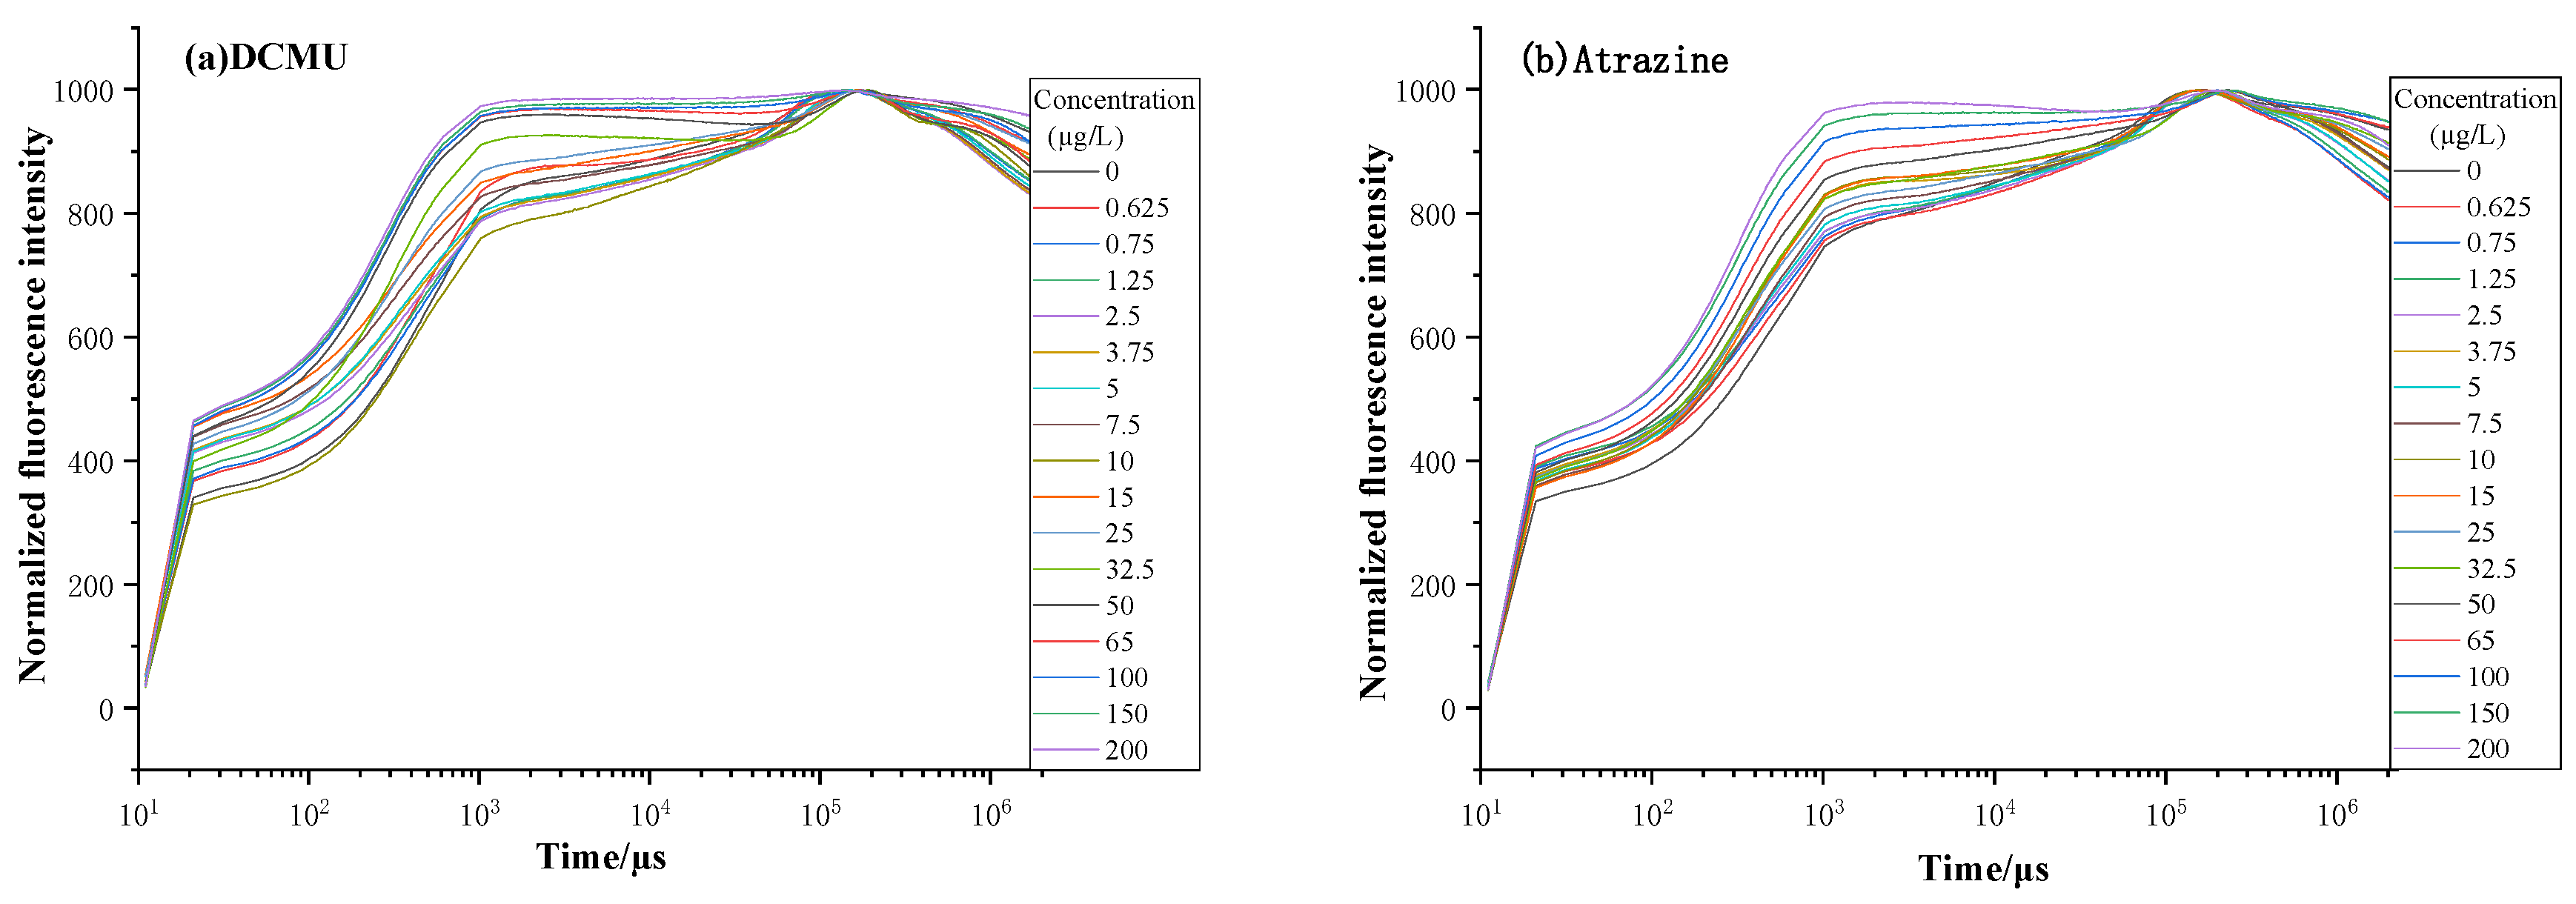
3.1. Experimental Measurement
3.2. Parameters Selection
4. Method and Results
4.1. Analysis of Single Parameter for Dose–Effect Curve Fitting
4.2. Analysis of Multi-Parameters for Data-Driven Model
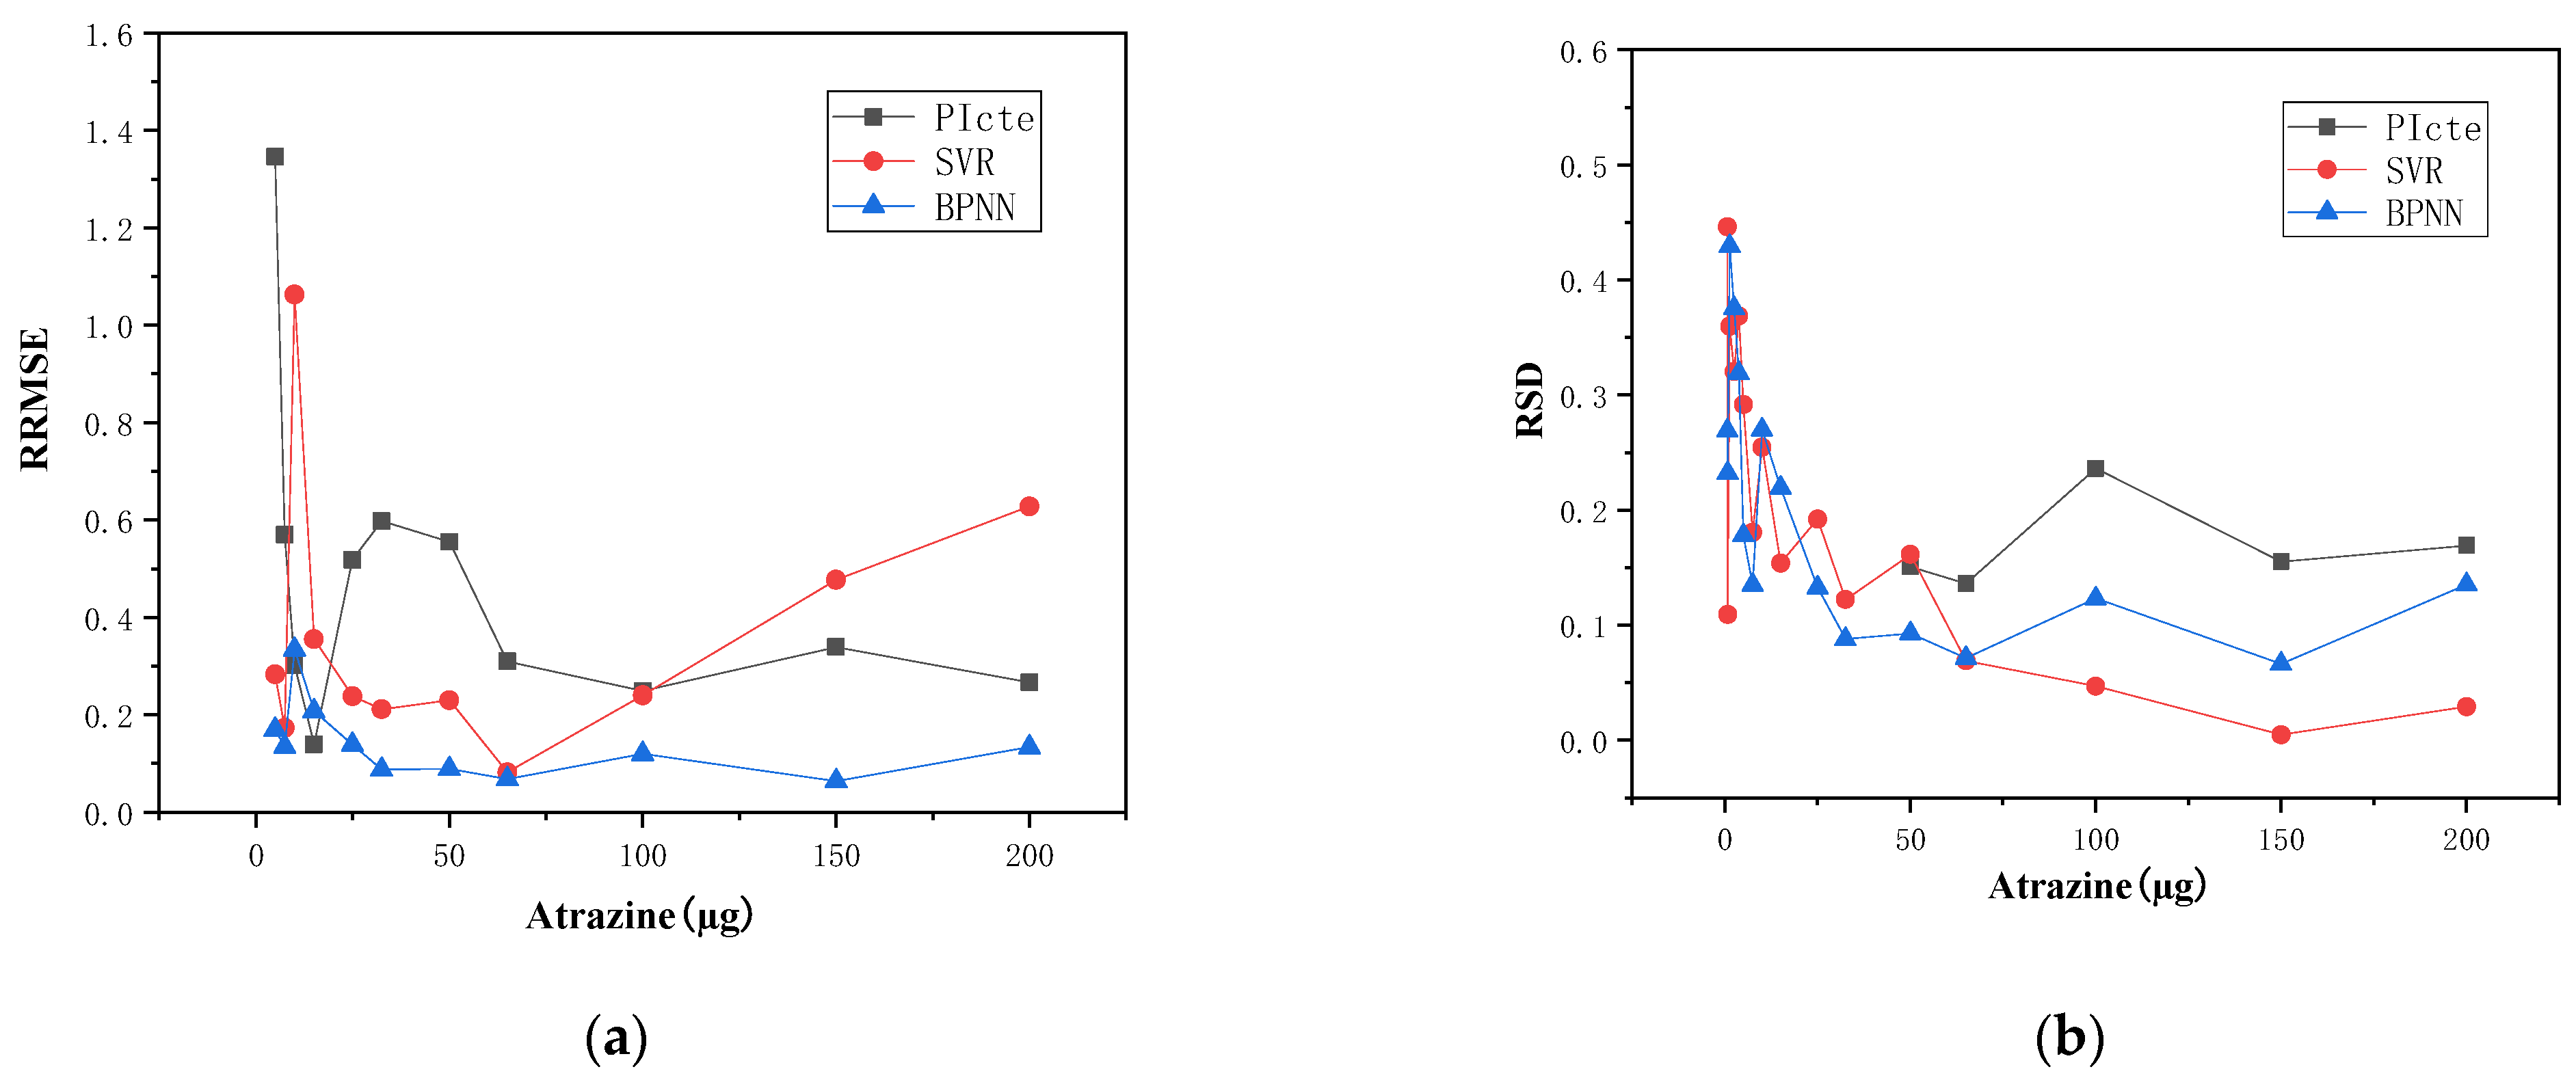
4.3. Experimental Verification of the Other Substance
5. Conclusions
Author Contributions
Funding
Institutional Review Board Statement
Informed Consent Statement
Data Availability Statement
Conflicts of Interest
References
- Xie, Y.; Li, Z.; Feng, L.; Wang, Q.; Cao, H. Detection Method and Its Application for Toxicant Using Algae. Environ. Sci. Technol. 2008, 12, 77–83. [Google Scholar]
- ISO. Water Quality—Fresh Water Algal Growth Inhibition Test with Unicellular Green Algae; International Organization for Standardization: Geneva, Switzerland, 2004; p. 6. [Google Scholar]
- Beaulieu, M.; Cabana, H.; Huot, Y. Adverse effects of atrazine, DCMU and metolachlor on phytoplankton cultures and communities at environmentally relevant concentrations using Fast Repetition Rate Fluorescence. Sci. Total Environ. 2019, 712, 136239. [Google Scholar] [CrossRef]
- Strasser, R.J. Analysis of the Chlorophyll a Fluorescence Transient. In Chlorophyll a Fluorescence: A Signature of Photosynthesis; Papageorgiou, G.C., Govindjee, Eds.; Springer: New York, NY, USA, 2004. [Google Scholar]
- Chen, M.; Yin, G.; Zhao, N.; Gan, T.; Feng, C.; Gu, M.; Qi, P.; Ding, Z. Rapid and Sensitive Detection of Water Toxicity Based on Photosynthetic Inhibition Effect. Toxics 2021, 9, 321. [Google Scholar] [CrossRef]
- Zhu, B.F.; Xu, G.Y.; Li, J.M. BP Neural Network Temperature Nonlinear Errors Correction of Pressure Sensor Based on LabView. Instrum. Metrol. Technol. 2007, 1, 3. [Google Scholar]
- Hongmin, X.; Haiying, W.; Jin, L. Support vector machine regression algorithm and its application. J. Beijing Inst. Petrochem. Technol. 2010, 18, 62–66. [Google Scholar]
- Chen, G.; Zhou, J. Research on Parameters and Forecasting Interval of Support Vector Regression Model to Small Sample. Acta Metrol. Sin. 2008, 29, 92–96. [Google Scholar]
- Guo, S.X.; Wang, Y.F.; Chen, A. Prediction on huge database on the regression model of support vector machine. Comput. Eng. Appl. 2007, 43, 12–14. [Google Scholar]
- Qin, Z.; Zhao, N.; Yin, G.; Shi, C.; Gan, T.; Xiao, X.; Duan, J.; Zhang, X.; Chen, S.; Liu, J.; et al. Inversion Method of Plant Photosynthesis Parameter Based on Fast Phase and Relaxation Fluorescence Kinetics. Acta Opt. Sin. 2017, 37, 0730002. [Google Scholar]
- Li, H.; Chen, M.; Yin, G.; Zhao, N.; Gan, N. Toxicity response parameters of Diaquilone based on photosynthetic inhibition effect of algae. Spectrosc. Spectr. Anal. 2021, 41, 1519–1524. [Google Scholar]
- Strasser, R.J.; Tsimilli-Michael, M.; Srivastava, A. Analysis of the Chlorophyll a Fluorescence Transient. In Chlorophyll a Fluorescence; Papageorgiou, G.C., Govindjee, Eds.; Advances in Photosynthesis and Respiration; Springer: Dordrecht, The Netherlands, 2004; Volume 19, pp. 321–362. [Google Scholar]
- Yang, W.; Tang, Z.; Zhou, F.; Zhang, W.; Song, L. Toxicity studies of tetracycline on Microcystis aeruginosa and Selenastrum capricornutum. Environ. Toxicol. Pharmacol. 2013, 35, 320–324. [Google Scholar] [CrossRef]
- Li, S.; Chu, R.; Hu, D.; Yin, Z.; Mo, F.; Hu, T.; Liu, C.; Zhu, L. Combined effects of 17beta-estradiol and copper on growth, biochemical characteristics and pollutant removals of freshwater microalgae Scenedesmus dimorphus. Sci. Total Environ. 2020, 730, 138597. [Google Scholar] [CrossRef]
- Wang, Y.X.; Wu, P.P.; Shen, H.Y. Effects of tetracycline stress on the growth and antioxidant system of Crescentophaga. J. Hebei Univ. Sci. Technol. 2019, 40, 7. [Google Scholar]
- Sun, C.; Xu, Y.; Hu, N.; Ma, J.; Sun, S.; Cao, W.; Klobučar, G.; Hu, C.; Zhao, Y. To evaluate the toxicity of atrazine on the freshwater microalgae Chlorella sp. using sensitive indices indicated by photosynthetic parameters. Chemosphere 2020, 244, 125514. [Google Scholar] [CrossRef]
- Gu, M.; Yin, G.; Gan, T.; Zhao, N.; Qi, P.; Chen, M.; Ding, Z.; Jia, R.; Liu, J.; Ma, M.; et al. Construction of characterization parameters of algal photosynthetic inhibition method for detection of comprehensive toxicity in water. Ecol. Indic. 2022, 136, 108651. [Google Scholar] [CrossRef]
- Gu, M.; Yin, G.; Zhao, N.; Qi, P.; Chen, M.; Ding, Z.; Jia, R.; Liu, J.; Ma, M.; Yang, R.; et al. Construction of characterization parameters of water comprehensive toxicity based on the different characteristics of OJIP curve. Acta Opt. Sin. 2022, 42, 7. [Google Scholar]
- Ministry of Environmental Protection. Environmental Monitoring Analysis Method Standard System Revision Technical Guidance; Ministry of Environmental Protection: Beijing, China, 2010. [Google Scholar]


| Toxin | Concentrations Tested | Stress Time |
|---|---|---|
| DCMU | 0.625, 0.75, 1.25, 1.5, 2.5, 3.75, 5, 7.5, 10, 15, 25, 32.5, 50, 75, 100, 150, 200 μg /L | 15 min |
| Atrazine | 0.625, 0.75, 1.25, 1.5, 2.5, 3.75, 5, 7.5, 10, 15, 25, 32.5, 50, 75, 100, 150, 200 μg/L | 15 min |
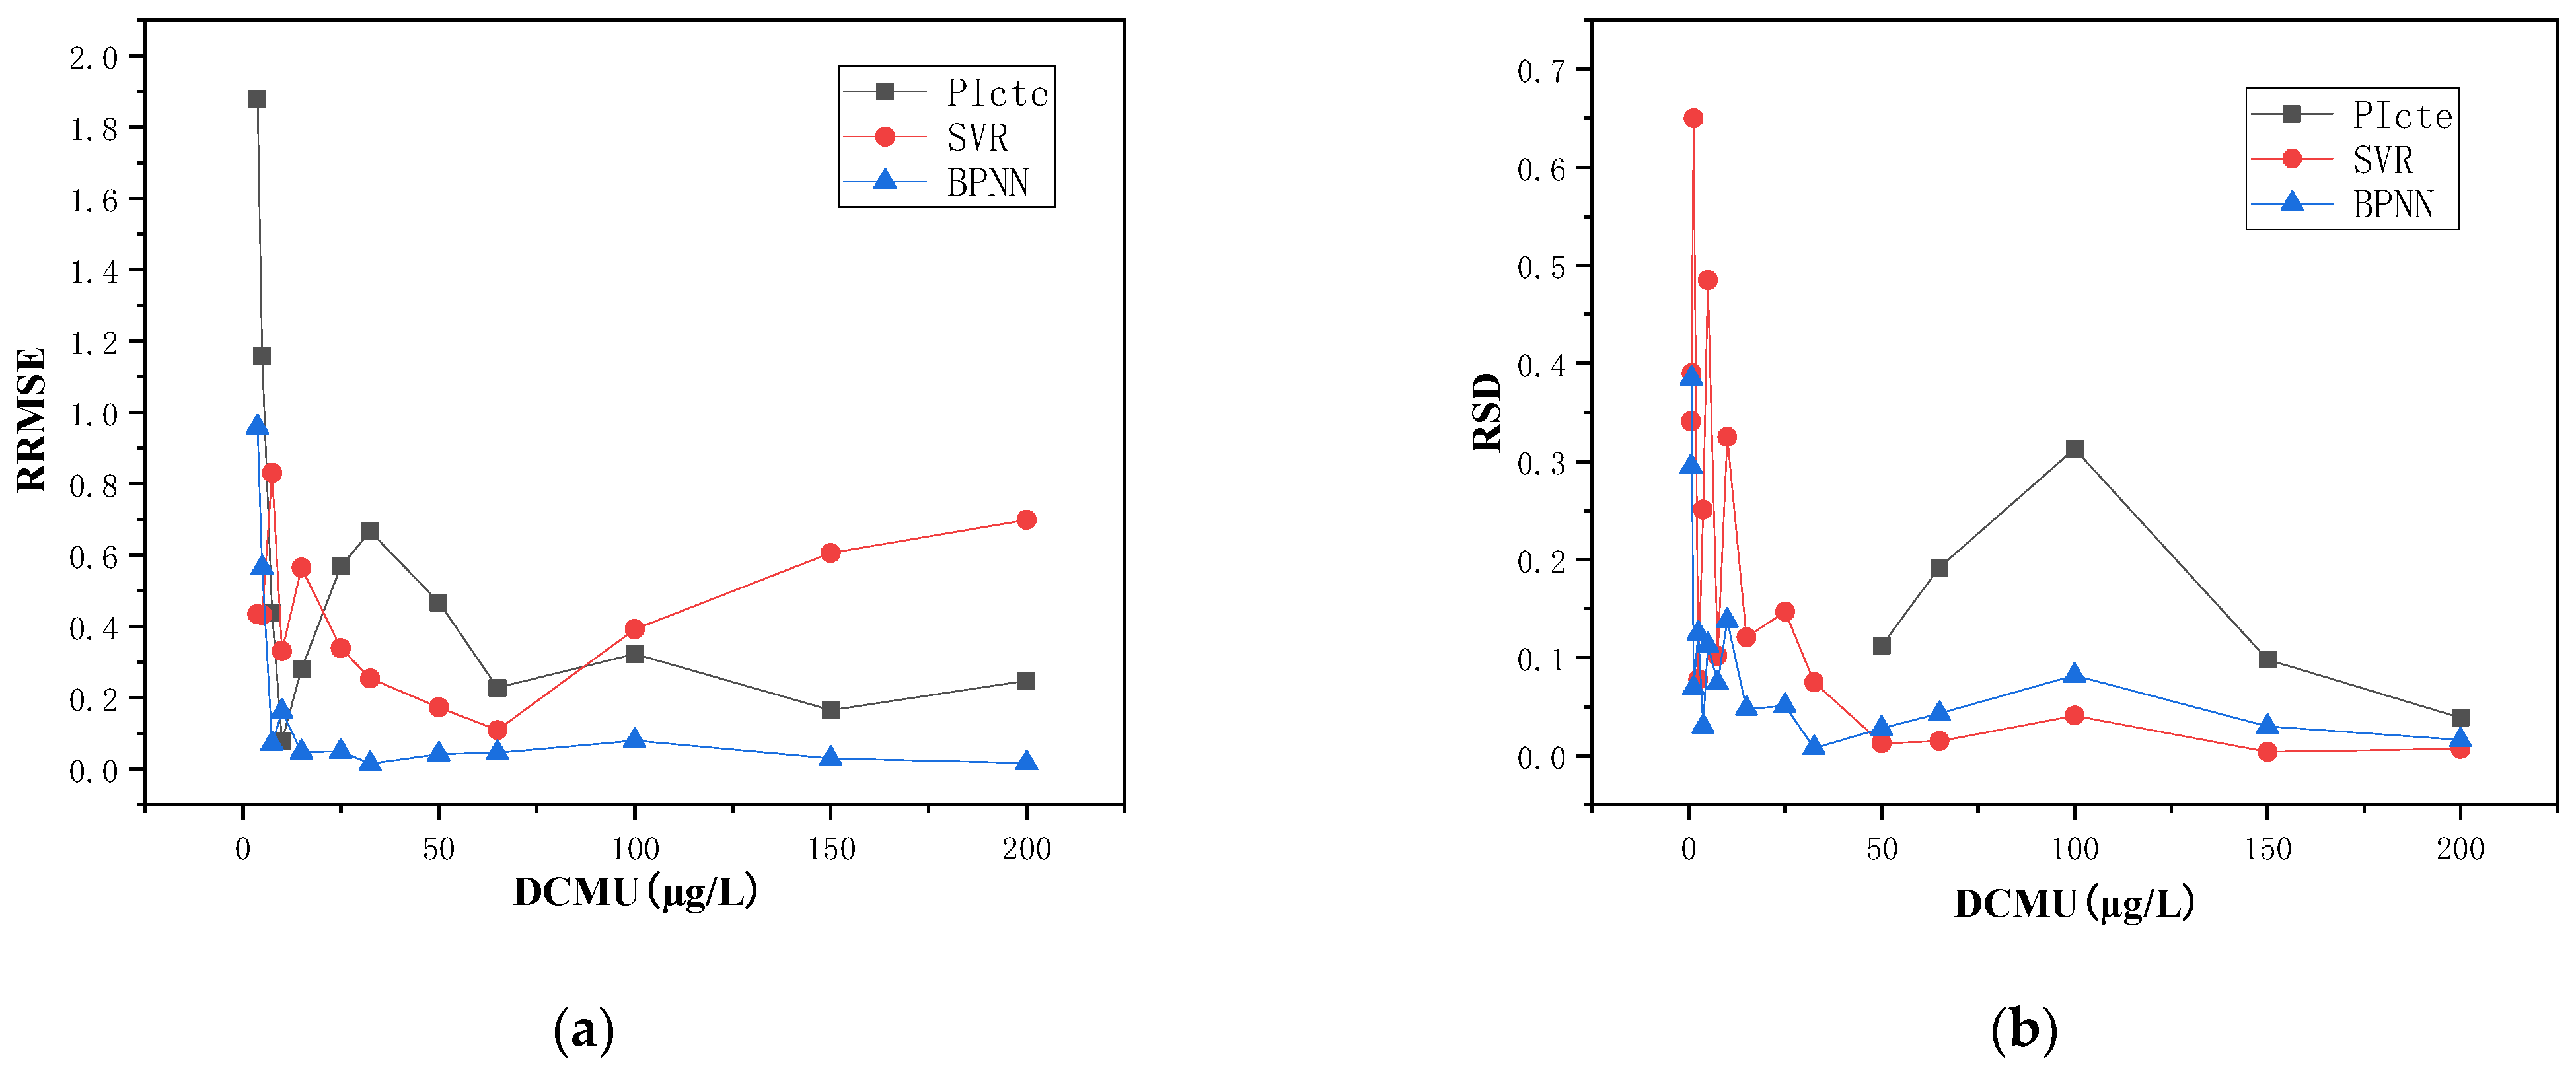
| Sample Groups | Concentration µg/L | RRMSE | RSD | ||||
|---|---|---|---|---|---|---|---|
| Dose–Effect Curve | SVR | BP Neural Network | Dose–Effect Curve | SVR | BP Neural Network | ||
| 1 | 0.625 | 16.266 | 9.923 | 8.867 | -- | 0.341 | 0.295 |
| 2 | 0.75 | 13.389 | 4.913 | 5.318 | -- | 0.390 | 0.385 |
| 3 | 1.25 | 7.633 | 0.875 | 2.518 | -- | 0.650 | 0.069 |
| 4 | 2.5 | 3.317 | 0.596 | 2.483 | -- | 0.078 | 0.125 |
| 5 | 3.75 | 1.878 | 0.435 | 0.959 | -- | 0.251 | 0.030 |
| 6 | 5 | 1.158 | 0.432 | 0.564 | -- | 0.485 | 0.113 |
| 7 | 7.5 | 0.439 | 0.831 | 0.072 | - | 0.102 | 0.074 |
| 8 | 10 | 0.079 | 0.331 | 0.162 | -- | 0.325 | 0.138 |
| 9 | 15 | 0.281 | 0.565 | 0.048 | -- | 0.121 | 0.048 |
| 10 | 25 | 0.568 | 0.339 | 0.050 | -- | 0.147 | 0.051 |
| 11 | 32.5 | 0.667 | 0.254 | 0.015 | 0.002 | 0.075 | 0.008 |
| 12 | 50 | 0.467 | 0.174 | 0.042 | 0.112 | 0.013 | 0.028 |
| 13 | 65 | 0.228 | 0.110 | 0.046 | 0.192 | 0.015 | 0.043 |
| 14 | 100 | 0.323 | 0.392 | 0.080 | 0.313 | 0.041 | 0.082 |
| 15 | 150 | 0.166 | 0.606 | 0.030 | 0.098 | 0.004 | 0.030 |
| 16 | 200 | 0.248 | 0.699 | 0.017 | 0.039 | 0.007 | 0.016 |
| Average (µg/L) | 1.246 | 0.474 | 0.506 | 0.151 | 0.165 | 0.061 | |
Disclaimer/Publisher’s Note: The statements, opinions and data contained in all publications are solely those of the individual author(s) and contributor(s) and not of MDPI and/or the editor(s). MDPI and/or the editor(s) disclaim responsibility for any injury to people or property resulting from any ideas, methods, instructions or products referred to in the content. |
© 2023 by the authors. Licensee MDPI, Basel, Switzerland. This article is an open access article distributed under the terms and conditions of the Creative Commons Attribution (CC BY) license (https://creativecommons.org/licenses/by/4.0/).
Share and Cite
Hu, L.; Liang, T.; Yin, G.; Zhao, N. Quantitative Representation of Water Quality Biotoxicity by Algal Photosynthetic Inhibition. Toxics 2023, 11, 493. https://doi.org/10.3390/toxics11060493
Hu L, Liang T, Yin G, Zhao N. Quantitative Representation of Water Quality Biotoxicity by Algal Photosynthetic Inhibition. Toxics. 2023; 11(6):493. https://doi.org/10.3390/toxics11060493
Chicago/Turabian StyleHu, Li, Tianhong Liang, Gaofang Yin, and Nanjing Zhao. 2023. "Quantitative Representation of Water Quality Biotoxicity by Algal Photosynthetic Inhibition" Toxics 11, no. 6: 493. https://doi.org/10.3390/toxics11060493
APA StyleHu, L., Liang, T., Yin, G., & Zhao, N. (2023). Quantitative Representation of Water Quality Biotoxicity by Algal Photosynthetic Inhibition. Toxics, 11(6), 493. https://doi.org/10.3390/toxics11060493