Article

The Distribution Characteristics and Potential Risk Assessment of Lead in the Soil of Tieguanyin Tea Plantations in Anxi County, China

1
Jinshan Soil and Water Conservation Research Center, Fujian Agriculture and Forestry University, Fuzhou 350002, China
2
Anxi County Soil Fertilizer Technology Extension Station, Quanzhou 362400, China
*
Author to whom correspondence should be addressed.
Toxics 2024, 12(1), 22; https://doi.org/10.3390/toxics12010022
Submission received: 25 November 2023 / Revised: 16 December 2023 / Accepted: 19 December 2023 / Published: 25 December 2023
(This article belongs to the Section Metals and Radioactive Substances)

Abstract

:
Assessing the distribution and risks associated with the soil lead content in the Tieguanyin tea plantations of Anxi County is critical, given the county’s significance as the primary Tieguanyin tea production area in Fujian Province. This study examined the distribution characteristics of soil lead in Anxi County’s tea plantations according to the Kriging spatial interpolation of the parameters of the semivariance function of the exponential model. Moreover, the sources of lead content were analyzed, considering geological backgrounds and anthropogenic influences. Ecological risks and the issuance of early warnings were also assessed. The soil lead content in the rocks of the Tieguanyin tea plantations in Anxi County followed the order: andesite > dacite > rhyolite > granite. The soil lead content gradually decreased from the center toward the east and west, forming four distinct north–south parallel zones. High-lead-content areas were identified at the border of Jiandou, Bailai, and Hushang; in the central part of Lutian; and in the southern part of Huqiu. The high levels of soil lead in the tea plantations possibly originated from industrial and mining activities, automobile exhaust, and agricultural activities. The distribution of single-factor pollution indices and potential risk evaluation based on the Soil Environmental Quality Standard, Environmental Technical Conditions for Tea Production Area, and Environmental Technical Conditions for Organic Tea Production Area indicated that the soil in Tieguanyin tea plantations in Anxi County was clean and safe for tea cultivation.

1. Introduction

Tea is an important cash crop in China. Its planting areas are widely distributed in the southern provinces, and the yield and quality of tea are closely related to the soil environment. However, China’s industrialization and substantial fertilizer use have impacted tea plantation soils. In recent years, studies have shown that human activities such as industrialization and agricultural fertilization can continuously increase the concentration of potentially toxic elements in tea plantation soil, leading to excessive heavy metal content in the soil, which poses a threat to human ecosystems and health [1,2]. Lead, a common heavy metal, is nonessential to human metabolism and is classified as a toxic substance by the United States Environmental Protection Agency [3]. Excessive intake of lead from tea can lead to health problems such as kidney disease, bone disease, and reduced intelligence quotient [4]. Studies have shown that a linear relationship exists between the heavy metal content of tea and the heavy metal content of the soil [5]. Tea trees thrive in well-drained and acidic soils, ideally within a pH range from 4 to 6.5. Low-pH soil environments pose a heightened risk for lead accumulation, which, in turn, hampers the soil’s microbial population diversity, thereby affecting the ecosystem of the tea plantation soil and hindering the growth and development of tea plants [6]. With the increase in tea planting years and the amount of nitrogen fertilizer input, the tea plantation soil gradually becomes acidified, which leads to the loss of nutrients such as nitrogen and phosphorus and increases the content of effective lead in the soil, exacerbating the lead accumulation in the tea plant [7].
Tieguanyin has a unique “Guanyin rhyme” and a delicate fragrance. When brewed, it yields a rich and long-lasting aroma, earning it the reputation of “seven bubbles with lingering fragrance”. Owing to its excellent quality and unique fragrance, it is renowned both domestically and internationally. Anxi County is the primary Tieguanyin-tea-producing region and the birthplace of the nationally renowned oolong tea. Its unique natural conditions foster excellent tea cultivation, resulting in high-quality products. In recent years, numerous studies have found that tea plantation soils feature a considerably high lead content, which will significantly limit the market of Tieguanyin. The lead content in the tea plantation soils in Anxi County has also garnered widespread concern. Identifying the sources of lead in tea plantations and implementing restrictions to ensure the soil environment’s safety are pivotal for the development of Tieguanyin in Anxi County. Research has found that geological variations primarily dictate the distribution of heavy metals in soil. It has been observed that soils derived from Permian limestone and Cambrian weakly mineralized dolomite exhibit significantly higher heavy metal content than soils developed from Silurian detrital rock [8]. Sun et al. [9] studied the soil lead content of 15 Tieguanyin tea gardens in Anxi County. They discovered that the surface soil lead content (48.0 mg/kg) significantly exceeded the background value, whereas the deep soil lead content (41.5 mg/kg) showed no significant difference from the background value. This suggests that anthropogenic activities have had a more pronounced impact on the surface soil [8]. Cong et al. [10] found that the roots of the Tieguanyin tea plant in Anxi County contained the highest lead content (23.89 mg/kg), primarily originating from the soil. By quantitatively analyzing the potential sources of heavy metals using the Pb–Sr multi-isotope mixing model, they found that agricultural activities contribute the most to the heavy metal content in tea. Zhang et al. [11] studied heavy metals in tea plantations in southern Fujian and found that 63.27% of the sampling points featured a lead content higher than the natural background value, and that the lead content in tea plantation soil is attributable to human activities. Sun et al. [12] found that lead in tea plantation soil mainly originated from parent material and automobile exhaust, while lead in tea mainly originated from automobile exhaust; automobile exhaust accounted for as high as 80% and 60% of the lead contents in new and old leaves, respectively. At present, there has been no comparative study on the distribution, accumulation, and health risk of lead in tea plantation soil in different geologic background areas of Anxi County, and it is of great significance to quantify the soil lead content and spatial distribution in tea plantations for the safe production of tea.
Studies on soil heavy metal pollution status have focused on the distribution and morphology of multiple metals, with less research on the sources of single metals in tea plantation soil. Therefore, in the present study, to reveal the current situation and sources of soil lead contamination in Tieguanyin tea plantations in Anxi County, soils and rocks were collected from the study area. The contamination and sources of lead in tea plantation soil were evaluated via a combination of stepwise linear regression and spatial-analysis-based methods. The objective was to provide a scientific basis for preventing and controlling the lead in tea plantation soil, which is essential for alleviating the ecological impact on tea plantation soil and protecting human health.

2. Materials and Methods

2.1. Overview of Study Area

The study area is located in Anxi County, Quanzhou City, Fujian Province, China (117°35′–118°17′ E, 24°50′–25°26′ N). Anxi County belongs to the southern and central subtropical marine monsoon climate. Owing to variations in topography and geomorphology, Anxi features distinct climatic characteristics, falling within the southern subtropical zone. The average annual temperature in the eastern area ranges from 19 to 21 °C, with an annual rainfall of 1600 mm. Meanwhile, in the western region, the average annual temperature varies from 16 to 18 °C, with an annual rainfall of 1800 mm. Anxi County is located in the southeastern extension of the Daiyun Mountains, with a terrain sloping from northwest to southeast. The northwestern part of the county features rolling hills, large slopes, and narrow valleys, with an average elevation of over 700 m. The southeastern part of the county features relatively gentle but hilly and mountainous terrain, with an average elevation of <500 m. The soil types in Anxi County mainly include red soil, yellow soil, paddy soil, latosol, calcareous soil, fluvisols, and purplish soil. Currently, the tea planting area in Anxi County spans over 40,000 hm2, with a tea yield of 62,000 t and a total tea output value of CNY 19.1 billion [13].

2.2. Sample Collection and Processing

A large and representative tea garden in Anxi County was selected for this study. Considering the actual production situation of tea gardens in Anxi County, a Tieguanyin tea garden located within a 10 m distance from a south-facing slope with a soil layer thickness exceeding 1 m was selected. Two to three pieces of unweathered rocks consistent with the soil’s parent rock were collected. After surface impurities were removed from the rocks, they were preserved in self-sealable bags. A total of 95 rock samples were collected, comprising 78 magmatic rocks, 4 metamorphic rocks, and 13 sedimentary rocks. This collection included 12 pieces of andesite, 39 pieces of dacite, 9 pieces of rhyolite, and 18 pieces of granite. The collected rocks were identified and utilized as the rock background for the sampling site. Some of the rocks were ground and sieved through a 200-mesh sieve, then stored in self-sealing bags for the determination of the heavy metal content.
Soil samples were collected from selected tea plantations. Composting points and rhizosphere soil were avoided during the collection process. The “S” or plum blossom type 5-point sampling method was employed, with each sampling point comprising more than five sub-samples taken at a depth of 0–20 cm. After mixing the freshly collected soil samples and removing debris, ~1 kg of soil samples was retained, in accordance with the quadratic method. After air drying, the soil samples were passed through 20-mesh and 100-mesh sieves and placed into self-sealing bags with labels for the determination of the soil heavy metals. A total of 109 soil samples were collected and their locations were concurrently recorded using GPS. The distribution of these samples is shown in Figure 1.

2.3. Methods of Analysis

The heavy metal elements in the rock samples were determined via X-ray fluorescence spectrometry. The soil lead content was determined through the heat digestion of the soil samples using a mixture of HCl, HF, HNO3, and HClO4, followed by an analysis using a graphite furnace atomic absorption spectrophotometer. The soil effective lead content was determined via the diethylenetriaminepentaacetic acid–Calcium chloride–triethanolamine combined extraction method and assessed via atomic spectrometry. The soil pH was determined using a pH meter, and the soil organic matter was determined via the potassium dichromate volumetric method. The soil Cu, Mn, Zn, Cd, and Fe contents were determined via inductively coupled plasma-mass spectrometry. The composition of the soil particles was determined using a laser particle sizer (BT-9300ST, Bettersize Instruments Ltd., Dangdong, China). Relevant studies have shown that soil lead is associated with soil Cu, Mn, Zn, and Cd [14,15], and thus these metals were selected for the study. The heavy metals in the rocks of the Tieguanyin tea plantations in Anxi County are shown in the following Table 1.

2.4. Potential Ecological Hazard Index

The ecological risk assessment of heavy metals mainly focuses on analyzing the presence and impact of metal element pollution. This study adopts the ecological hazard index method to assess the pollution caused by metal elements. Proposed by Swedish scientist Hakanson [16] in 1980, this method integrates chemistry, biotoxicology, and ecology. It can effectively reflect the impact of individual metal pollutants in specific environments by establishing potential ecological risk indexes for each metal. The potential ecological hazard index method fully considers the toxicity and effectiveness of the metals, and the corresponding toxicity response coefficients of the metals are selected to calculate the potential ecological hazard index E of a single heavy metal element. The calculation formula is as follows:
E = T × C/B
where E is the potential ecological hazard index, C denotes the monitored content, B is the background reference value of the element, and T is the toxicity response factor of the corresponding heavy metal. The ecological hazard level grading and toxicity coefficients of single-factor pollutants are shown in Table 2 [17,18].

2.5. Data Processing

SPSS 26, Excel 2010, and OriginPro 2021 were used to analyze the sample data. The spatial distribution map of the soil lead was drawn using GIS10.2 software combined with the Kriging interpolation method.

3. Results

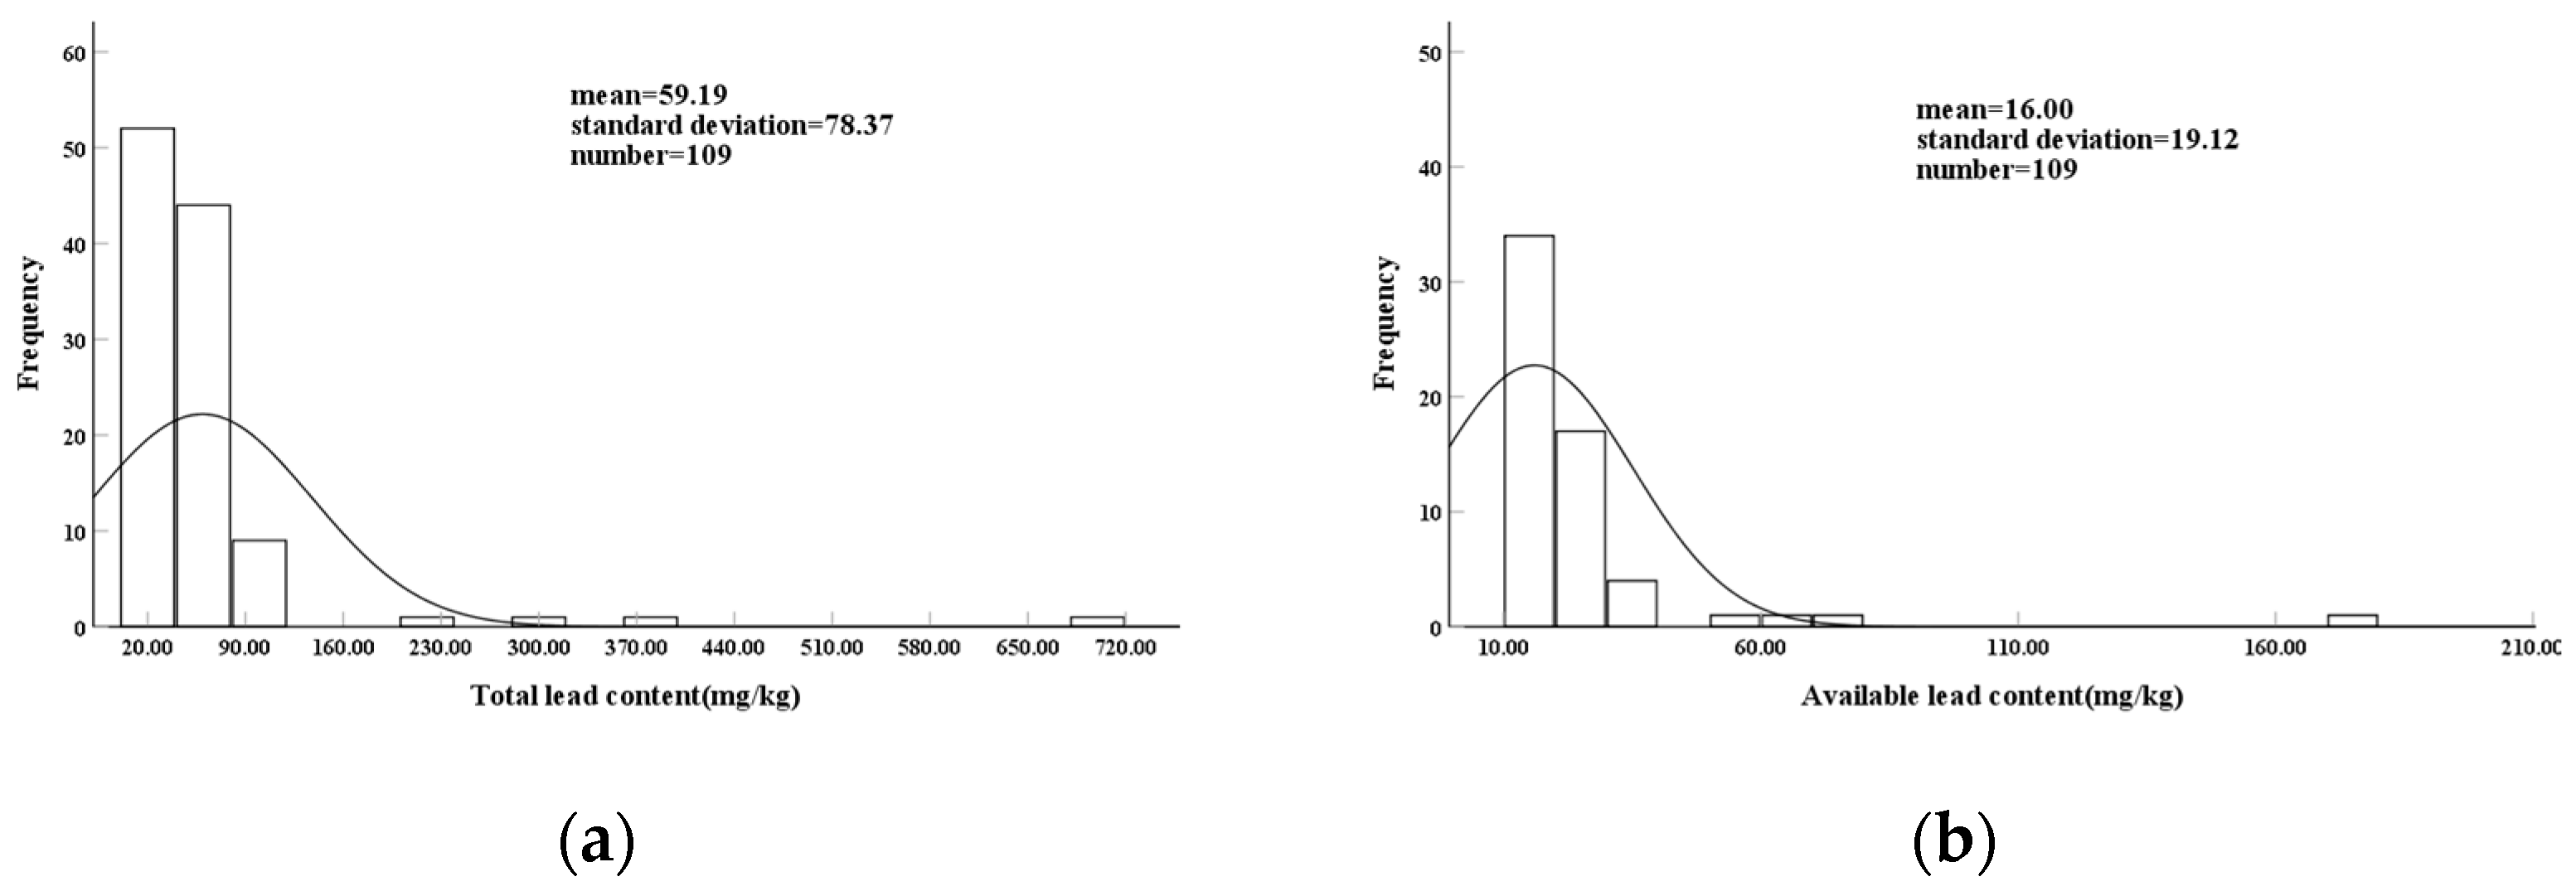
3.1. Tea Plantation Soil Lead Content

3.1.1. Soil Lead Content in Various Rock Formations

The analysis of the soil lead content in tea plantations across Anxi County revealed average levels of 59.19 mg/kg for the total soil lead and 16.00 mg/kg for effective lead (Figure 2). The lead content in the soil developed from different types of rocks in Anxi County varied. The ranges of soil lead content in the soil derived from the three major rock types were 14.90–700.60 mg/kg for magmatic rocks, 26.90–45.90 mg/kg for metamorphic rocks, and 17.00–53.10 mg/kg for sedimentary rocks. Specifically, within the magmatic rock category, the ranges of soil lead content were as follows: andesite: 21.10–700.60 mg/kg, rhyolite: 15.70–308.50 mg/kg, dacite: 15.70–364.70 mg/kg, and granite: 14.90–118.20 mg/kg. The mean values of soil lead content in the rocks were as follows: magmatic rock (64.70 mg/kg) > metamorphic rock (32.64 mg/kg) > sedimentary rock (30.88 mg/kg). The ranking based on the magnitude of lead content within magmatic rocks was as follows: andesite (99.88 mg/kg) > dacite (62.06 mg/kg) > rhyolite (60.95 mg/kg) > granite (50.32 mg/kg). The coefficients of variation (CVs) for the soil lead content in the three major rock types in Anxi County were as follows: magmatic rock (130.87%) > sedimentary rock (32.06%) > metamorphic rock (23.95%). Specifically, within the magmatic rock category, the CVs for different rocks were as follows: andesite (182.13%) > rhyolite (117.45%) > dacite (93.81%) > granite (52.57%) (Table 3).
A comparative analysis of the soil lead content in different rock types in Anxi County was conducted using the national soil elemental background values by Wei [19] and the soil elemental background values from Fujian Tieguanyin tea plantations obtained by Zhou [20] as control references. The average soil lead content values in the three major rock types were lower than the soil elemental background values of the Fujian Tieguanyin tea plantation. However, among these, only andesite exhibited a higher soil lead content than the soil elemental background values of the Fujian Tieguanyin tea plantation. The average content of the heavy metal lead in the soil from the three major rock types exceeded the national background value for soil elements (Table 4).

3.1.2. Soil Lead Content of Tea Plantations in Different Townships

A statistical analysis was conducted on the soil lead content in tea plantations across various townships of Anxi County (Table 5). The contents of lead in the tea plantation soils in areas such as Hushang (230.95 mg/kg), Lutian (148.98 mg/kg), Huqiu (82.25 mg/kg), Bailai (71.68 mg/kg), and Kuidou (70.05 mg/kg) exceeded the soil environmental quality standard limit (70 mg/kg), showing a decreasing trend from north to south. The soil lead content in all township tea plantations was below the standard environmental limit for tea-producing areas (250 mg/kg). In addition to the high content of available lead (66.02 mg/kg) in the tea plantation soil of Hushang, the available lead content in the other towns was lower than 30 mg/kg. The CV of the lead content in the tea plantation soil exceeded 50% in several areas, such as Hushang (135.64%), Huqiu (112.50%), Lutian (98.78%), Guanqiao (57.63%), Jiandou (52.73%), and other towns (50.08%). Hushang, Huqiu, and Lutian exhibited larger coefficients of variation, which corresponded to higher lead contents. The CVs of the soil available lead content in tea plantations in towns such as Hushang (110.79%), Lutian (90.41%), Jiandou (86.17%), Huqiu (79.14%), Guanqiao (61.85%), other towns (60.07%), Longjuan (56.38%), and Daping (51.12%) exceeded 50%. The CVs of lead in the tea plantation soil in Anxi County revealed that the lead content is not uniformly distributed and is significantly affected by external disturbances.
The national soil elemental background values presented in Wei Fusheng’s article [19] and the soil elemental background values specific to Fujian Tieguanyin tea plantations by Zhou Guohua [20] were used as control background values for the comparative analysis of the average soil lead content in tea plantations across Anxi County. The average lead contents in the soil of the tea plantations in the Huqiu, Kuidou, Lutian, Bailai, and Hushang townships exceeded the soil element background values of the Fujian Tieguanyin tea plantation, with increases of 17.25, 5.05, 83.98, 6.68, and 165.95 mg/kg, respectively. The average lead contents in the soil of the tea gardens in Daping, Guanqiao, Longmen, Penglai, Xiping, Gande, Jiandou, Jingu, Changkeng, Futian, Longjuan, Taozhou, Xianghua, and other townships were lower than the background value of the soil element in the Tieguanyin tea plantations of Fujian. These areas showed decreases of 14.43, 24.12, 3.87, 20.60, 26.56, 25.73, 0.73, 0.93, 17.08, 43.67, 39.32, 34.25, 28.93, and 12.18 mg/kg, respectively. All townships in Anxi County, except for Futian, exhibited a higher tea plantation soil lead content than the national background values (Table 6).

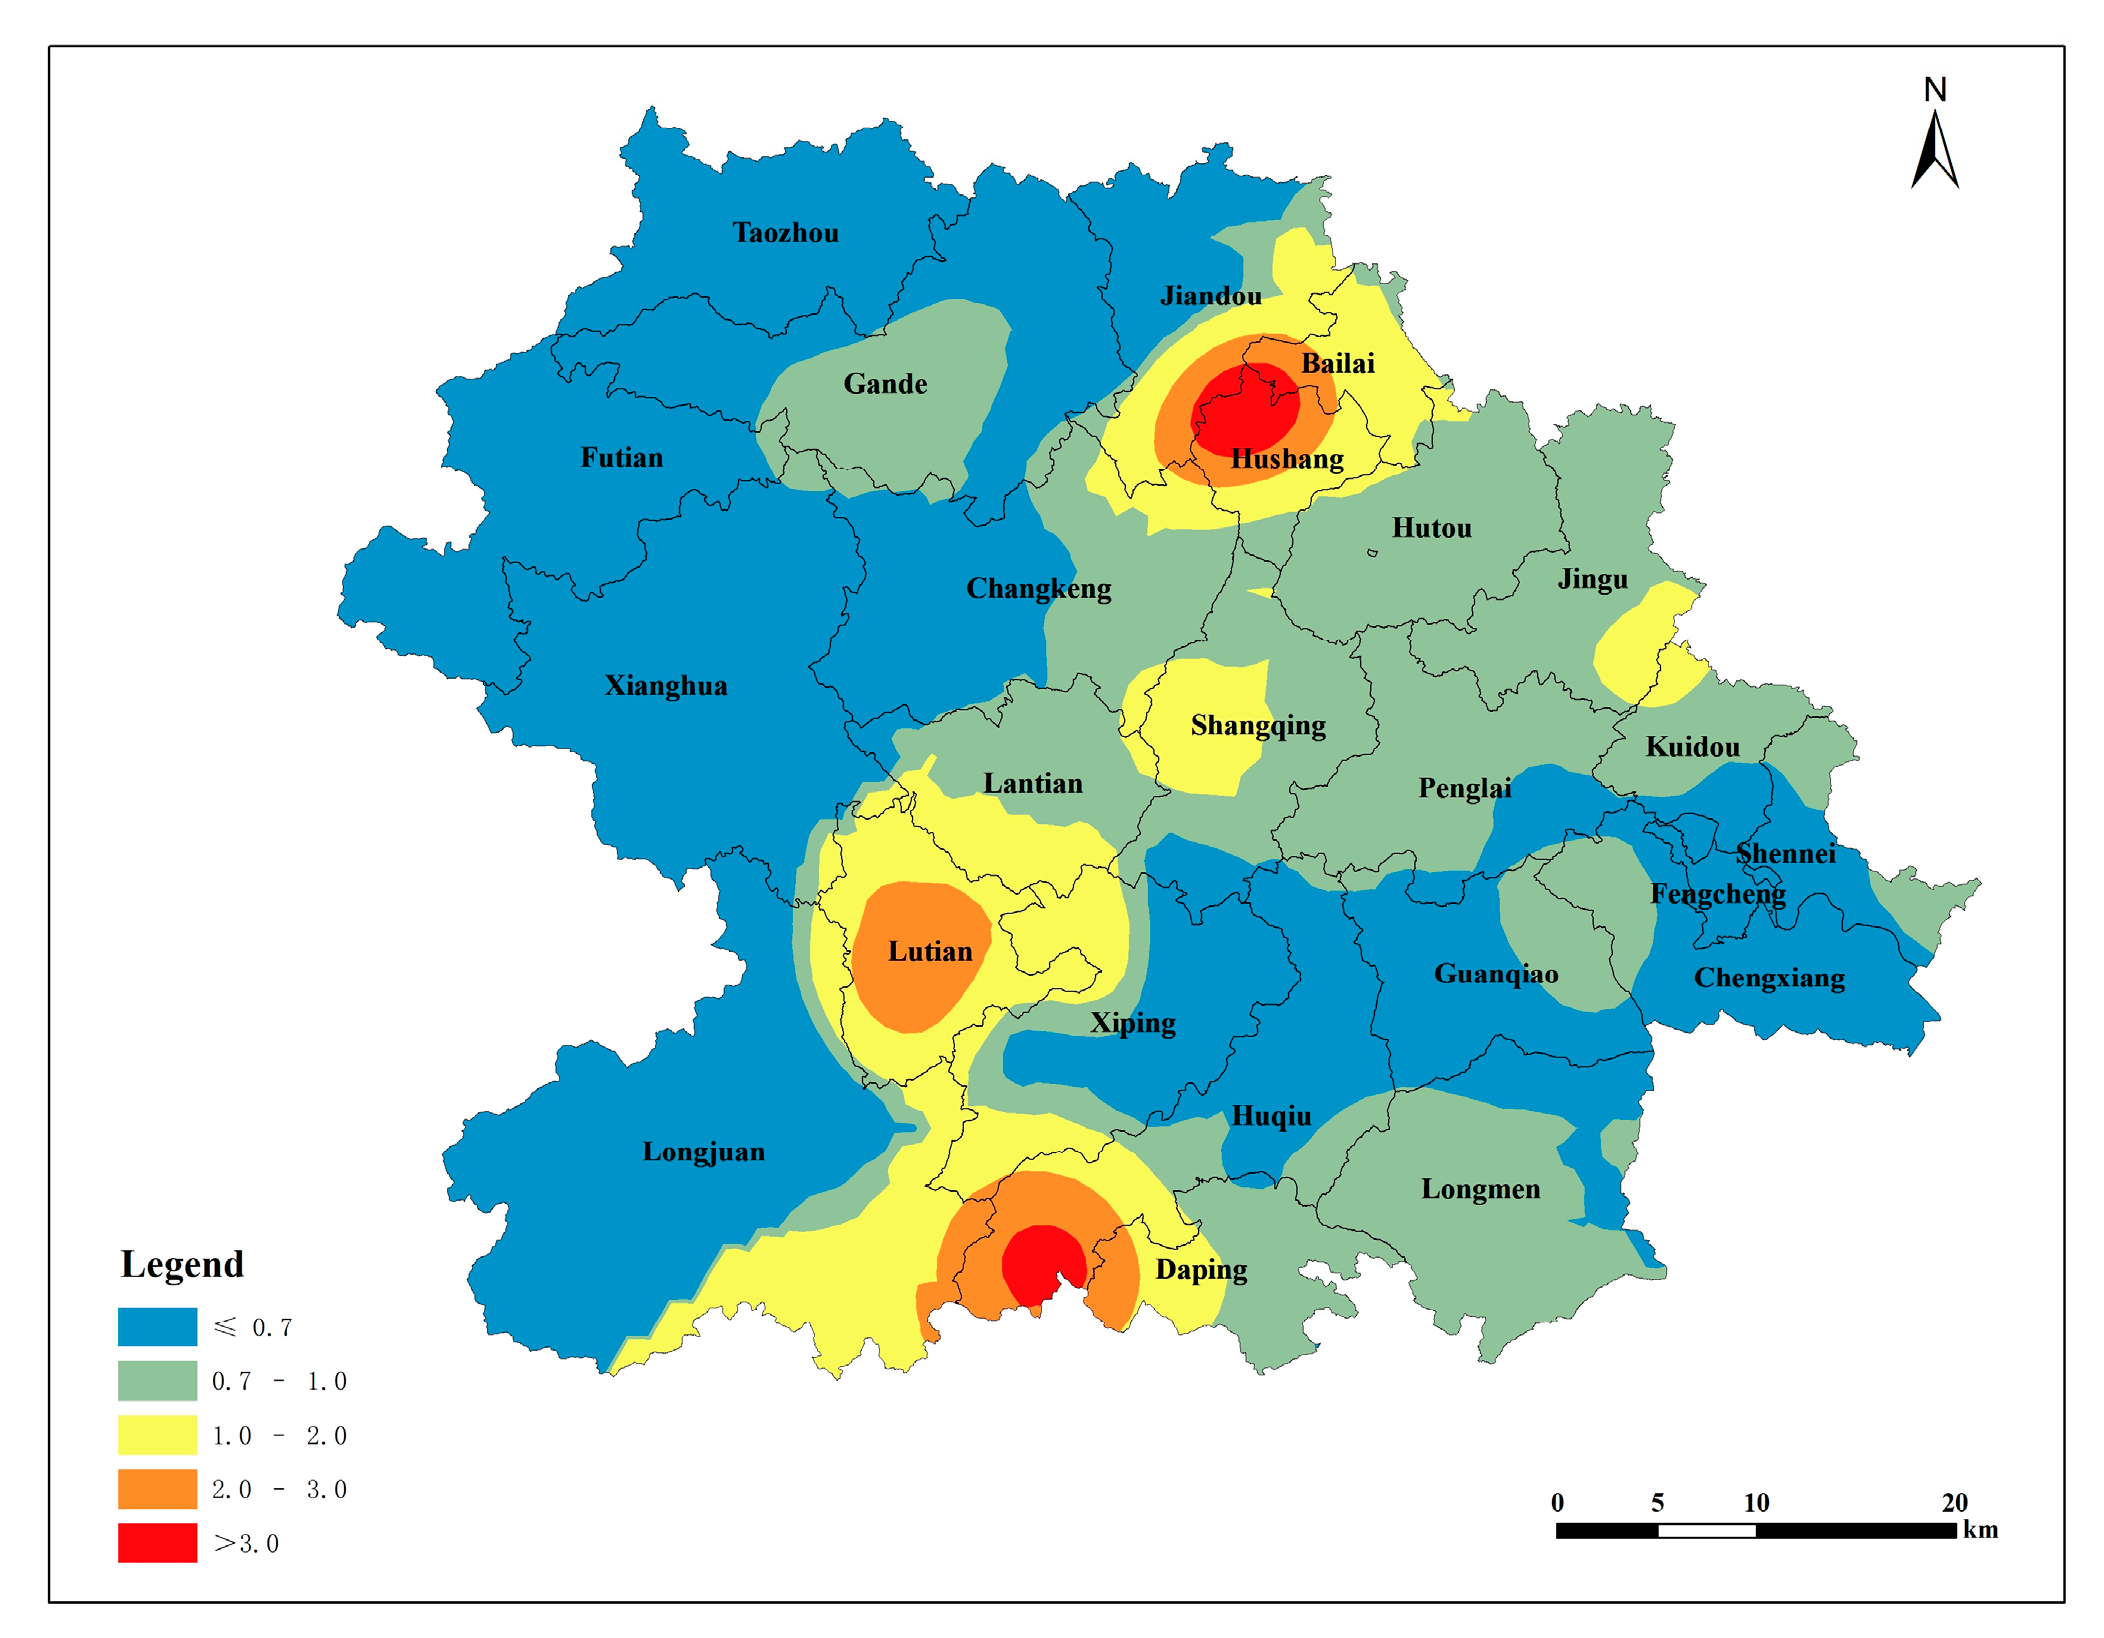
3.1.3. Spatial Distribution of Soil Lead in Tea Plantation

The sample data were fitted via geostatistical methods, using the semi-variance function, and the optimal model was selected. The soil lead content in the study area conformed to the exponential model, and the determination coefficients of the semi-variance function model were all small, indicating that their spatial distribution was relatively dispersed. The nugget effect was used to represent the proportion of the spatial variation in relation to the total variation, thereby serving as a measure for assessing the magnitude of spatial correlation among the study variables. A ratio below 0.25 indicates a relatively strong spatial autocorrelation, while a ratio between 0.25 and 0.75 indicates a moderate spatial autocorrelation. A ratio exceeding 0.75 signifies a weak spatial autocorrelation. Range is another important parameter of the semi-variance function. It indicates the extent of spatial autocorrelation effects within a certain scale. Numerous studies have shown that, the closer the Residual Sum of Squares value is to 0, the better the model fit of the semi-variance function and the shorter the range. The block basis ratios for the soil lead and available lead content were 0.13 and 0.10, respectively, with range values of 4260.00 m and 2490.00 m. These values suggest that variations in the lead content were influenced by both structural and stochastic factors, indicating a relatively strong spatial distribution (Table 7).
According to the spatial interpolation of the parameters of the semivariance function of the exponential model, the spatial distribution of the soil lead content in the tea plantations in Anxi County was obtained. The findings revealed a gradual decline in the soil lead content from the county’s central region toward the east and west, resulting in the formation of four distinct and parallel distribution zones oriented in a north–south direction. A high lead content occurred at the borders of Jiandou, Bailai, and Hushang; the central part of Lutian; and the southern region of Huqiu. The distribution of soil available lead content in tea plantations across Anxi County was consistent with the distribution of lead content (Figure 3).

3.2. Ecological Risk Evaluation of Lead in Tea Plantation Soil

3.2.1. Evaluation Based on the Soil Environmental Quality Standard

The single pollution index was calculated using the measured data of the soil lead content in Anxi County’s tea plantations and the soil pH values, in accordance with the land quality geochemical evaluation specification. The soil environmental quality standard [21] was taken as the basis for evaluation. The spatial distribution map was obtained via Kriging interpolation based on the single pollution index. Heavily polluted areas were identified in the southern part of Huqiu, the central part of Lutian, and the northern part of Hushang. The pollution index gradually decreased from the source area to the surrounding area, indicating a decline in the soil lead content in the tea plantation with an increasing distance from the source area (Figure 4). According to the distribution of the single-factor pollution index based on the soil environmental quality standard (Table 8), 47.37% of the tea plantation soil lead in Anxi County is categorized as clean soil, 31.58% belongs to slight pollution, 10.53% belongs to mild pollution, 5.26% belongs to moderate pollution, and 5.26% belongs to heavy pollution.

3.2.2. Evaluation Based on the Environmental and Technical Conditions of Tea Production Areas

The single pollution index was calculated using the measured data of the lead content in the tea plantation soil in Anxi County and the soil pH values, with the environmental technical conditions of tea origin [22] as the evaluation basis. The spatial distribution map was obtained via Kriging interpolation based on the single pollution index. The northern part of Hushang, the central part of Lutian, and the southern part of Huqiu exhibited second-level pollution, categorized as slight pollution. Other townships in Anxi County displayed clean soil conditions. This indicates that, by the standards of the environmental and technical conditions of tea origin, the soil in Anxi County’s Tieguanyin tea plantations is generally clean and safe. The vast majority of soils are suitable for the production of non-pollution tea (Figure 5). According to the distribution of the single-factor pollution index based on the environmental technical conditions of tea origin (Table 8), 94.74% of the lead in the tea garden soil in Anxi County belongs to clean soil, and 5.26% belongs to slight pollution.

3.2.3. Evaluation Based on the Environmental and Technical Conditions of Organic Tea Production Areas

The single pollution index was calculated using the measured data of the soil lead content in the tea gardens in Anxi County and the soil pH value, with the environmental conditions of organic tea production [23] as the evaluation basis. The spatial distribution map was obtained via Kriging interpolation based on the single pollution index. The pollution level in the northern part of Hushang, the central part of Lutian, and the southern part of Huqiu reached the fifth level, corresponding to heavy pollution. Areas with the fourth level of pollution were distributed near fifth-level-pollution source areas (Figure 6). The terrain in Anxi County slopes from northwest to southeast, and the primary source areas are mainly concentrated in three regions: the northern part of Hushang, the central part of Lutian, and the southern part of Huqiu. The pollution spreads from the source areas to the lower southeast direction, and the northwest of Anxi County is less affected by the source areas owing to its higher terrain. According to the distribution of the single-factor pollution index derived from the environmental conditions of organic tea production areas (Table 8), the lead content in the tea garden soil in Anxi County is categorized as follows: 15.79% as clean soil, 31.58% as slight pollution, 42.11% as mild pollution, 5.26% as moderate pollution, and 5.26% as heavy pollution.

3.2.4. Evaluation of Potential Ecological Risk

The potential ecological hazard index of the soil lead in the Tieguanyin tea plantations of Anxi County was calculated using a formula that considers the measured soil lead content and the background value and toxicity coefficient of lead. Then, the spatial distribution of the potential ecological hazard index of the soil lead in the Tieguanyin tea plantations in Anxi County was obtained via Kriging interpolation (Figure 7). The spatial distribution maps of the potential ecological hazard index, generated using the background values of Soil Environmental Quality Standard, Environmental Technical Conditions for Tea Production Area, and Environmental Technical Conditions for Organic Tea Production Area, indicated that the soil lead pollution in the Tieguanyin tea plantations in Anxi County was at a low level, posing no potential risk of pollution.

3.3. Relationship between Soil Lead Content and Factors in Tea Plantation

The correlation between the lead content in the soil of Tieguanyin tea gardens and rocks, soil elements, and physical and chemical properties was analyzed. The results showed a significant correlation between the lead content and rock Mn. Moreover, the soil lead exhibited a significant correlation with rock lead, Cu, and Zn, indicating a close relationship between soil lead and rocks. Additionally, a significant correlation existed between soil lead and Cd, and a highly significant correlation existed between soil lead and Cu, Mn, and Zn, indicating that soil lead may have the same source pathway as Cu, Mn, Zn, and Cd. A highly significant correlation existed between the soil lead and soil available lead, both of which had no correlation with the soil pH, organic matter, soil Fe, sand, silt, and clay. A significant correlation existed between the soil available lead and Fe/Mn, and a highly significant correlation existed between the soil lead and Fe/Mn. The correlation between the soil available lead and other indicators is consistent with that of soil lead (Figure 8).
According to the close relationship between the soil lead, rock, and soil indicators, the soil lead and available lead of the Tieguanyin tea plantations in Anxi County were selected as dependent variables, and the closely related indicators were used as the independent variables to establish multiple linear regression equations. The F-value of the third model was 44.541, and the p-value was 0.00, which is less than 0.01, indicating that the independent variables in the model jointly had a highly significant effect on the dependent variable; that is, the rock Cu, soil Zn, and Mn had a highly significant effect on the soil lead content (Table 9). The standardized coefficient of the soil Zn was greater than that of the rock Cu and soil Mn, indicating that the soil Zn had a greater effect on the soil lead (Table 10). The F-value of the fifth model was 151.770, and the p-value was 0.00, which is less than 0.01, indicating that the independent variables in the model jointly had a highly significant effect on the dependent variable; that is, the soil lead, Mn, Cu, Zn, and rock lead had a highly significant effect on the soil available lead content (Table 11). Furthermore, the absolute value of the standardized coefficient of the soil lead was greater than those of the rock lead, soil Mn, lead, Zn, and Cu, indicating that the soil lead had the greatest effect on the soil available lead (Table 12). The variance inflation factors of the soil lead and available lead were less than 10, and the covariance relationship between the variables was not significant (Table 10 and Table 12). According to the above, the optimal fitting multiple linear regression equations for soil lead and available lead were obtained (Table 13). The regression standardized residuals of the soil lead and available lead followed a normal distribution, which indicates that the multiple linear regression equations were well-fitted (Figure 9 and Figure 10).
Rock lead samples, which accounted for 74.31% of the total samples, exhibited lower lead levels than the soil lead. The ratio of rock lead to soil lead was 0.90 (Table 14), suggesting that the soil lead in Tieguanyin tea plantations in Anxi County was not solely a result of parent rock weathering. There might be additional lead introduced due to anthropogenic activities. The ratio of soil available lead to soil lead was 0.27, indicating the reactivity of soil lead in the Tieguanyin tea plantations of Anxi County. This portion of lead can easily migrate from soil to tea trees, become absorbed by the tea trees, and accumulate in the tea. Upon consumption of the tea, this lead enters the human body, posing a hidden health risk.

4. Discussion

4.1. Distribution Characteristics and Source Analysis of Soil Lead Content in Tea Plantation

Soil is formed through the long-term weathering of rocks, and its elemental composition and content largely inherit the geochemical characteristics of the parent rock. Most of the elements in soil are derived from the parent rock [24]. Through geochemical and chronological studies on the Carboniferous magmatic rock of the Sauer Mountains in northwestern Junggar, China, Weng et al. [25] found that potassium feldspar granite exhibited high levels of potassium (K) and lead, clear I-type affinity, and high potassium–calcium alkalinity. Some related studies have also found that the abnormal lead content in granite originates from the crustal composition [26,27]. Ahankoub et al. [28] found significant lead enrichment in all samples during their study of magmatic rocks in western Iran. During their study of tea gardens in the metamorphic region of Guizhou Province, Li et al. [29] found that some soil samples exceeded the heavy metal standards, but this did not impact the growth and development of the tea. Additionally, the tea plant did not show enrichment of As, Cr, Hg, and lead from the soil. According to the geological survey results of Anxi County, tuff lava is predominantly found in the regions of Gande, Xianghua, Bailai, Jingu, Kuidou, Penglai, Lutian, Huqiu, Xiping, and southern Longmen. Granite is mainly distributed in Hushang, Changkeng, Lantian, Shangqing, Guanqiao, Longjuan, and Longmen. Sandstone is predominantly located in Futian, northern Taozhou, central Xianghua, southern Taozhou, and southern Longjuan. Magmatic rock accounts for 89.9% of the county’s area, and the soil weathering process associated with magmatic rock serves as a significant source of soil lead accumulation. In this study, the soil derived from magmatic rock exhibited the highest lead content (64.7 mg/kg) and the most pronounced variability (130.87%), aligning with previous research findings and the geological background of Anxi County. Moreover, the geological composition of Lutian and the southern region of Huqiu predominantly consisted of rhyolitic tuff lava, which continuously contributed lead to the soil in Lutian and the southern part of Huqiu during the soil weathering process.
The magnitude of soil lead content depends on the local geological background and is strongly influenced by factors such as industrial production, agricultural fertilization, and traffic exhaust [30]. Cao et al. [31] conducted a risk evaluation of tea plantation soil in Anxi County and found that the average concentration of soil lead was 1.24 times the background value. The elevated lead content primarily originated from anthropogenic sources related to agricultural and industrial activities. Lead is a signature element of motor vehicle pollution. The friction between the tires of a moving vehicle and the ground produces Zn [32]. This aligns with the highly significant correlation observed in this study between the two elements, suggesting a possible link between abnormal lead levels in tea plantation soil and automobile exhaust. Atmospheric deposition from coal combustion in industrial and mining industries leads to the enrichment of lead in soil [33]. The mining industry is more developed near the convergence of Jiandou, Bailai, and Hushang in Anxi County, which is consistent with the observed high soil lead content distribution in this study. Long-term directed fertilization has a certain effect on soil lead and Cd content [34]. Both soil lead and Cd exhibit similarities. The southern tea plantations in Anxi County are primarily core tea plantation areas, and the elevated soil lead content in this region might be linked to prolonged fertilization practices. The research results suggest that a portion of the soil lead in tea plantations in Anxi County originates from the soil parent rock, while a larger portion may result from automobile exhaust, atmospheric deposition, and agricultural activities. There appears to be a higher likelihood of contribution from automobile exhaust. Tea plantations in Anxi County should be located as far away from roads and mines as possible to reduce the impact of anthropogenic activities on heavy metal accumulation in tea plantation soil. To improve the soil properties and mitigate the ecological risks associated with heavy metals in tea plantation soil, measures tailored to soil conditions and tea tree growth, such as the application of organic fertilizers [35] or amendments [36], can be implemented on susceptible plantations.

4.2. Potential Risks and Early Warning concerning Soil Lead in Tea Plantation

Ecological risk warning involves a qualitative analysis that combines quantitative evaluation values with pollution grading. This approach, to a certain extent, reflects the pollution status of the experimental site and issues a warning, to provide a basis for management actions. In this study, the soil lead content of the Tieguanyin tea plantations of Anxi County was higher than the national soil element background value, indicating that the tea plantation soil in Anxi County features a certain amount of lead pollution. The evaluation and early warning of heavy metal pollution in soil, coupled with in-depth research on contaminated soil and assessments of potential risk situations in polluted areas, holds important practical significance for the governance and protection of these areas. In this study, the qualitative analysis of tea plantation soil in Anxi County was based on the evaluation of the Soil Environmental Quality Standard, Environmental Technical Conditions of Tea Production Areas, and Environmental Technical Conditions of Organic Tea Production Areas. The potential ecological pollution index of lead in the soil of the Tieguanyin tea plantations of Anxi County was determined to be at a low level, indicating the absence of a potential pollution risk.
The heavy metals in tea garden soil mainly exist in several forms: water-soluble, exchangeable, organic-bound, oxidized iron and manganese, carbonate, and residual. The bioavailability of the water-soluble and exchangeable forms is high, and they are greatly affected by the soil pH [37,38]. The available state of soil heavy metals is the portion that plants can absorb and accumulate. Evaluating this state is complex, owing to various influencing factors, including plant species, root exudation, soil organic matter, and soil pH [39,40,41]. In this study, the ratio of soil available lead to the total lead amount was 0.27; this ratio helps to assess the amount of lead available in the soil. A higher utilization rate signifies increased lead activity and easier absorption by tea trees. The distribution order of soil lead and available lead in each township’s tea plantation in Anxi County varies, possibly owing to differences in soil pH across the townships’ tea plantations. The planting times of tea plantations vary across the townships of Anxi County, with southern plantations having longer durations. The long-term cultivation of tea plants has resulted in the accumulation of organic matter in tea plantation soil and a decrease in soil pH. This decrease has caused an increase in the water-soluble and exchangeable lead content absorbed by tea plants [37]. The distribution and migration of lead in soil and tea are affected by soil organic matter and redox processes [42]. Soil iron, manganese, and pH play pivotal roles in altering redox conditions and organic chemical processes [43]. In the present study, the soil available lead was significantly correlated with the soil Mn and Fe/Mn, and no correlation existed between the soil available lead and the soil Fe or pH. This indicates that the distribution of lead in soil is affected by the geochemical behavior of Mn [44,45]. Therefore, the management of soil lead pollution in tea production areas in Anxi County can focus on altering the structure of soil lead, reducing the levels of available lead, and mitigating the ecological risks posed by soil lead on the plant growth environment.

5. Conclusions

(1)
The lead content in soils developed from the three major rock types was generally lower than the background soil element value in the Fujian Tieguanyin tea plantation. Only the average lead content in soils derived from andesite in magmatic rocks exceeded the background value of soil elements in the Fujian Tieguanyin tea plantation. The average soil lead content developed by these rock types is higher than the national background value.
(2)
The soil lead content in Tieguanyin tea plantations within the townships of Huqiu, Kuidou, Lutian, Bailai, and Hushang exceeded the background value of soil elements in Tieguanyin tea plantations in Fujian. Except for Futian, other townships of Anxi County’s Tieguanyin tea plantations exhibited a soil lead content higher than the national background value of soil elements. The distribution of soil lead in Anxi County’s Tieguanyin tea plantations was uneven and significantly impacted by external factors.
(3)
The soil lead content of the Tieguanyin tea plantations of Anxi County gradually declined from the center to the east and west, forming four distinct parallel distribution zones in the north–south direction. High-lead-content areas occurred at the convergence of Jiandou, Bailai, and Hushang; in Lutian’s central region; and in the southern part of Huqiu. The distribution of available lead content in the tea plantation soil of Anxi County was consistent with the lead content distribution.
(4)
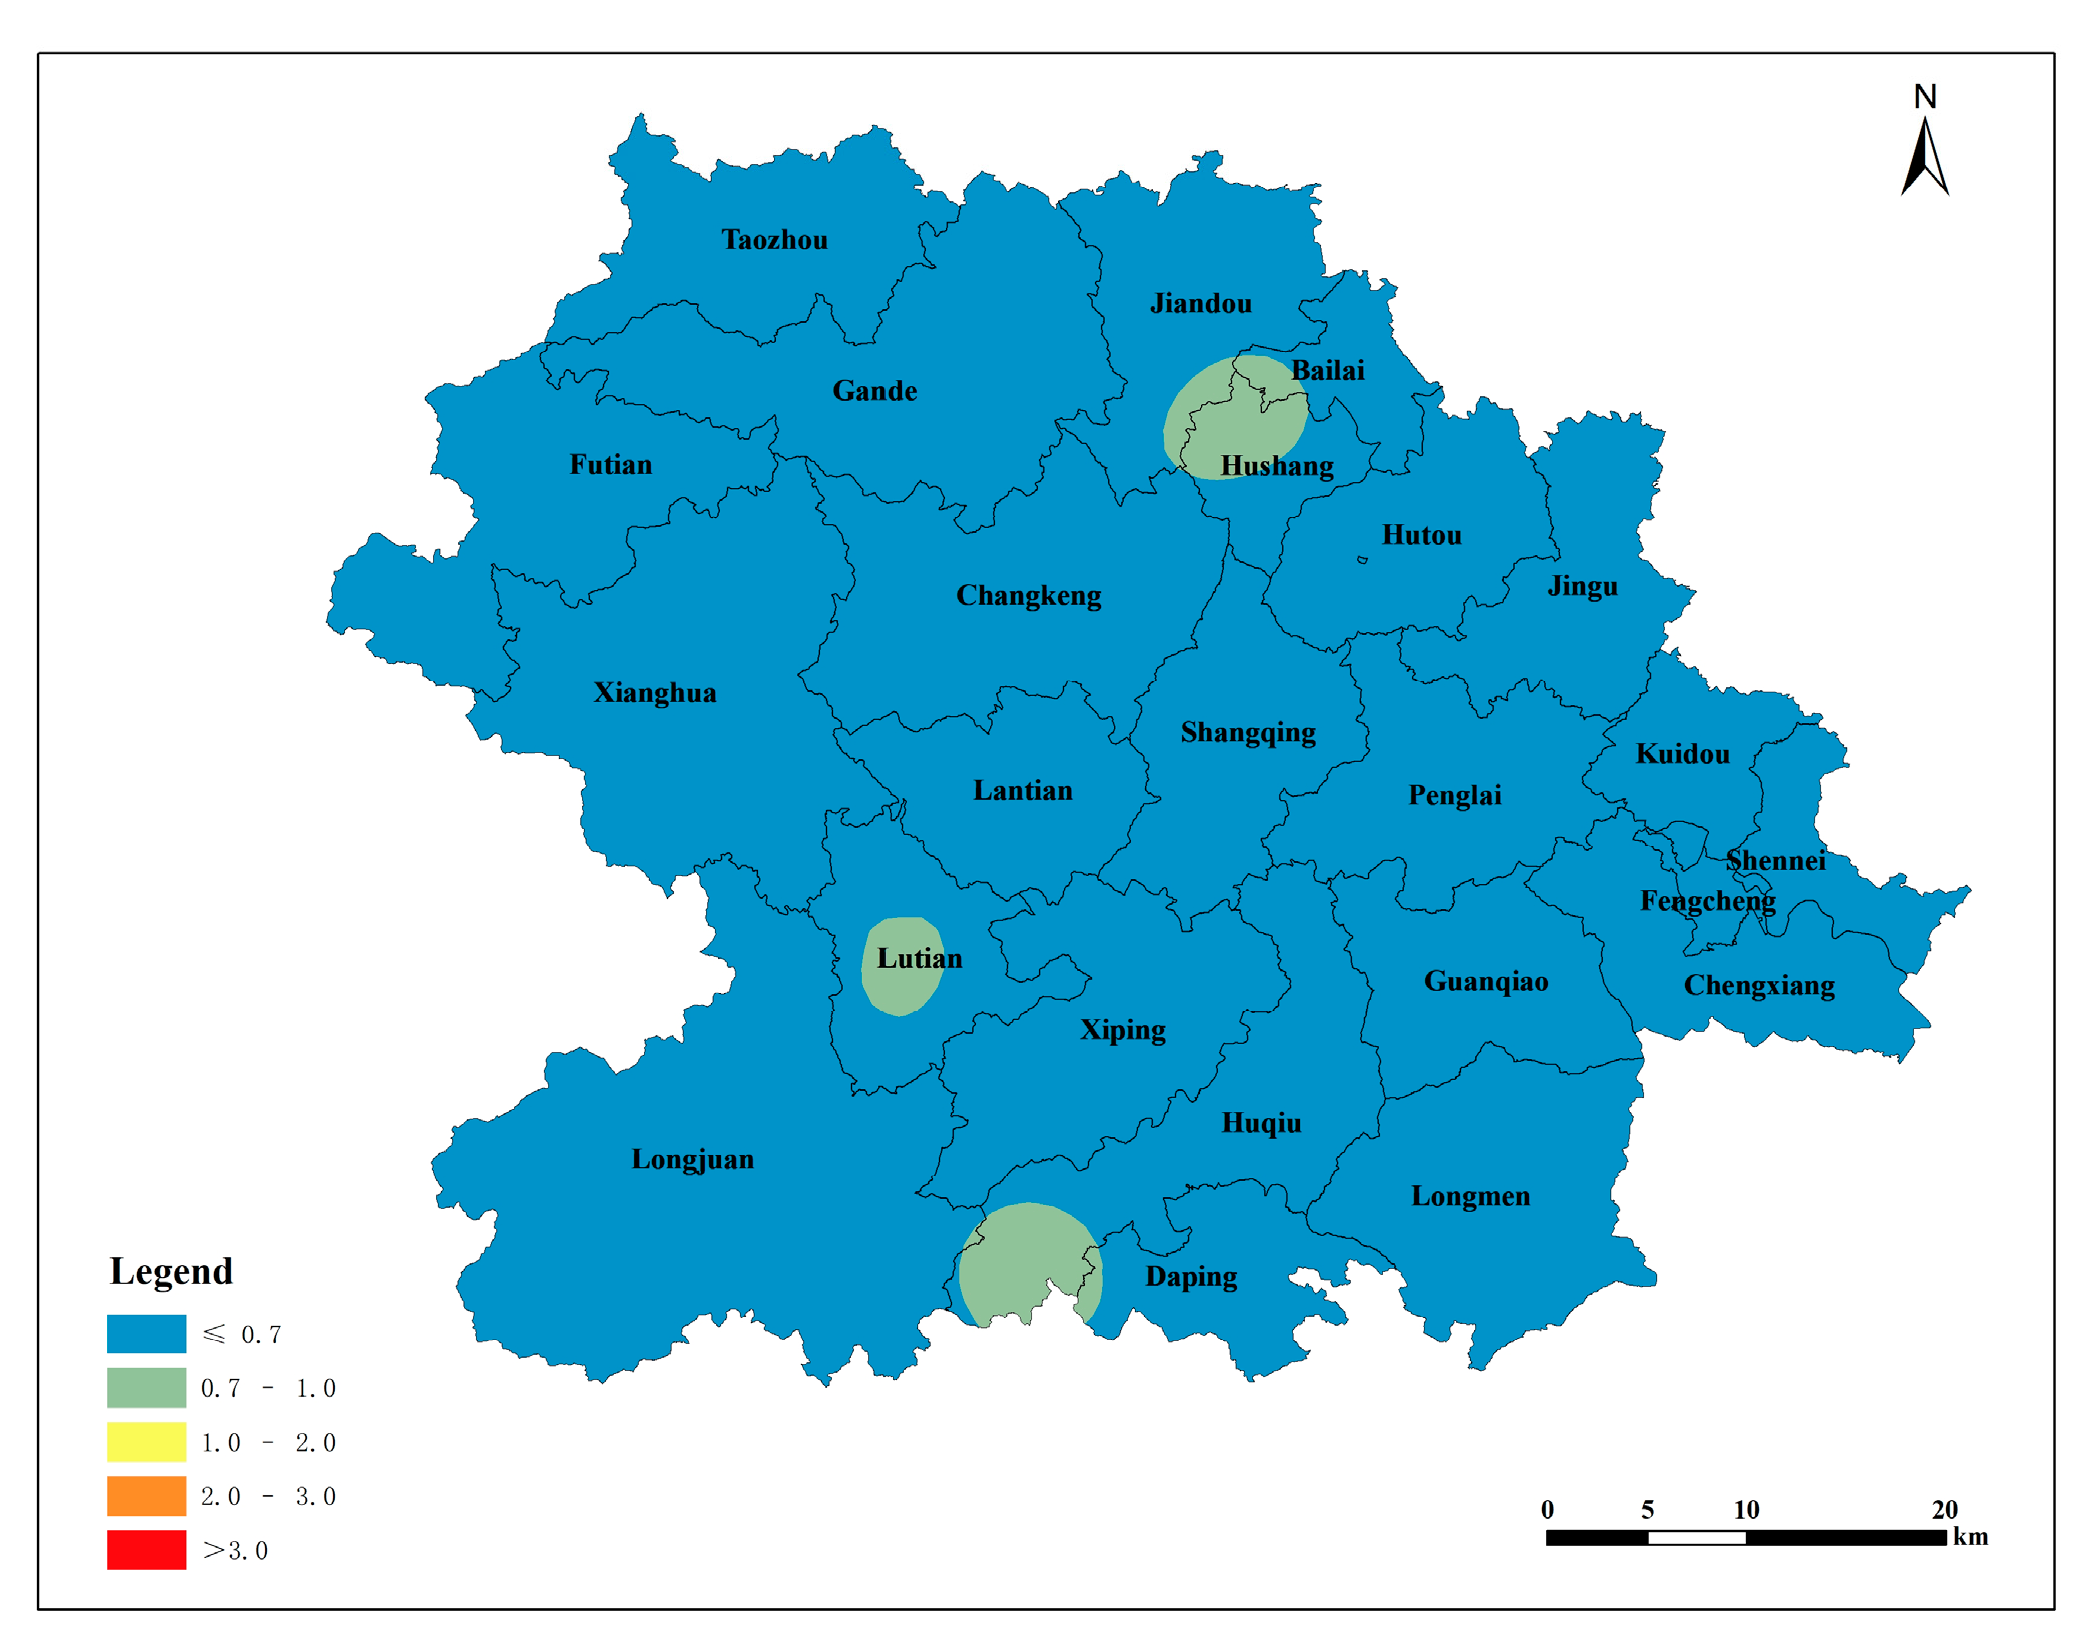
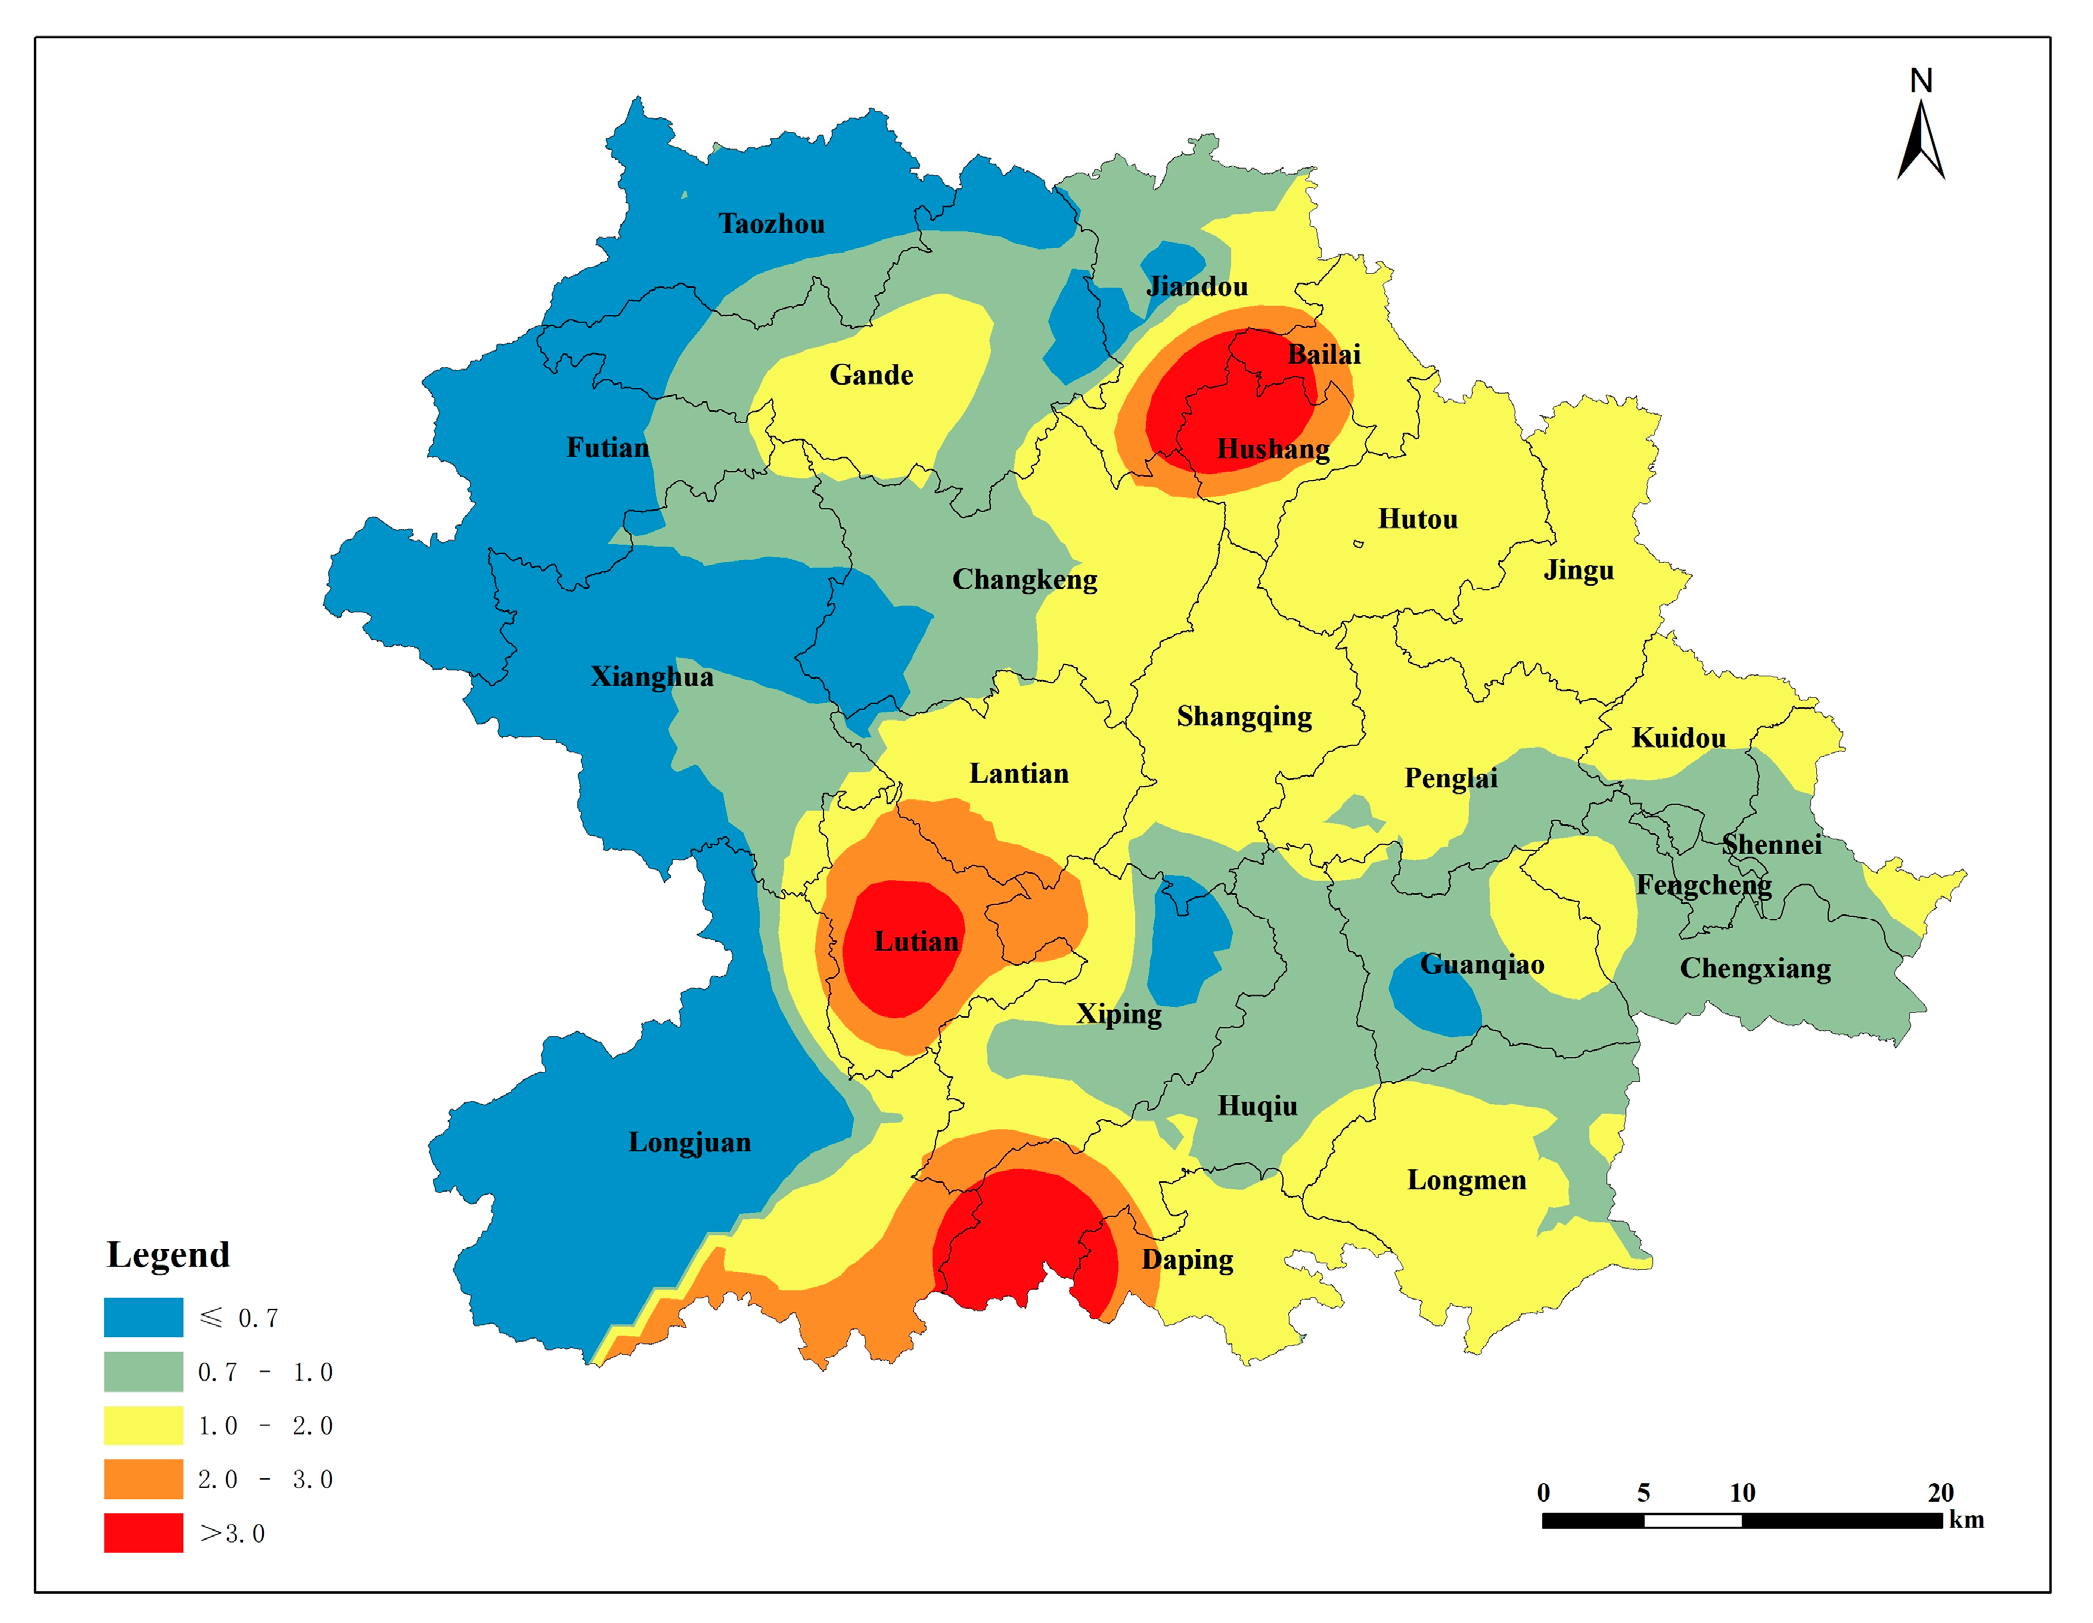
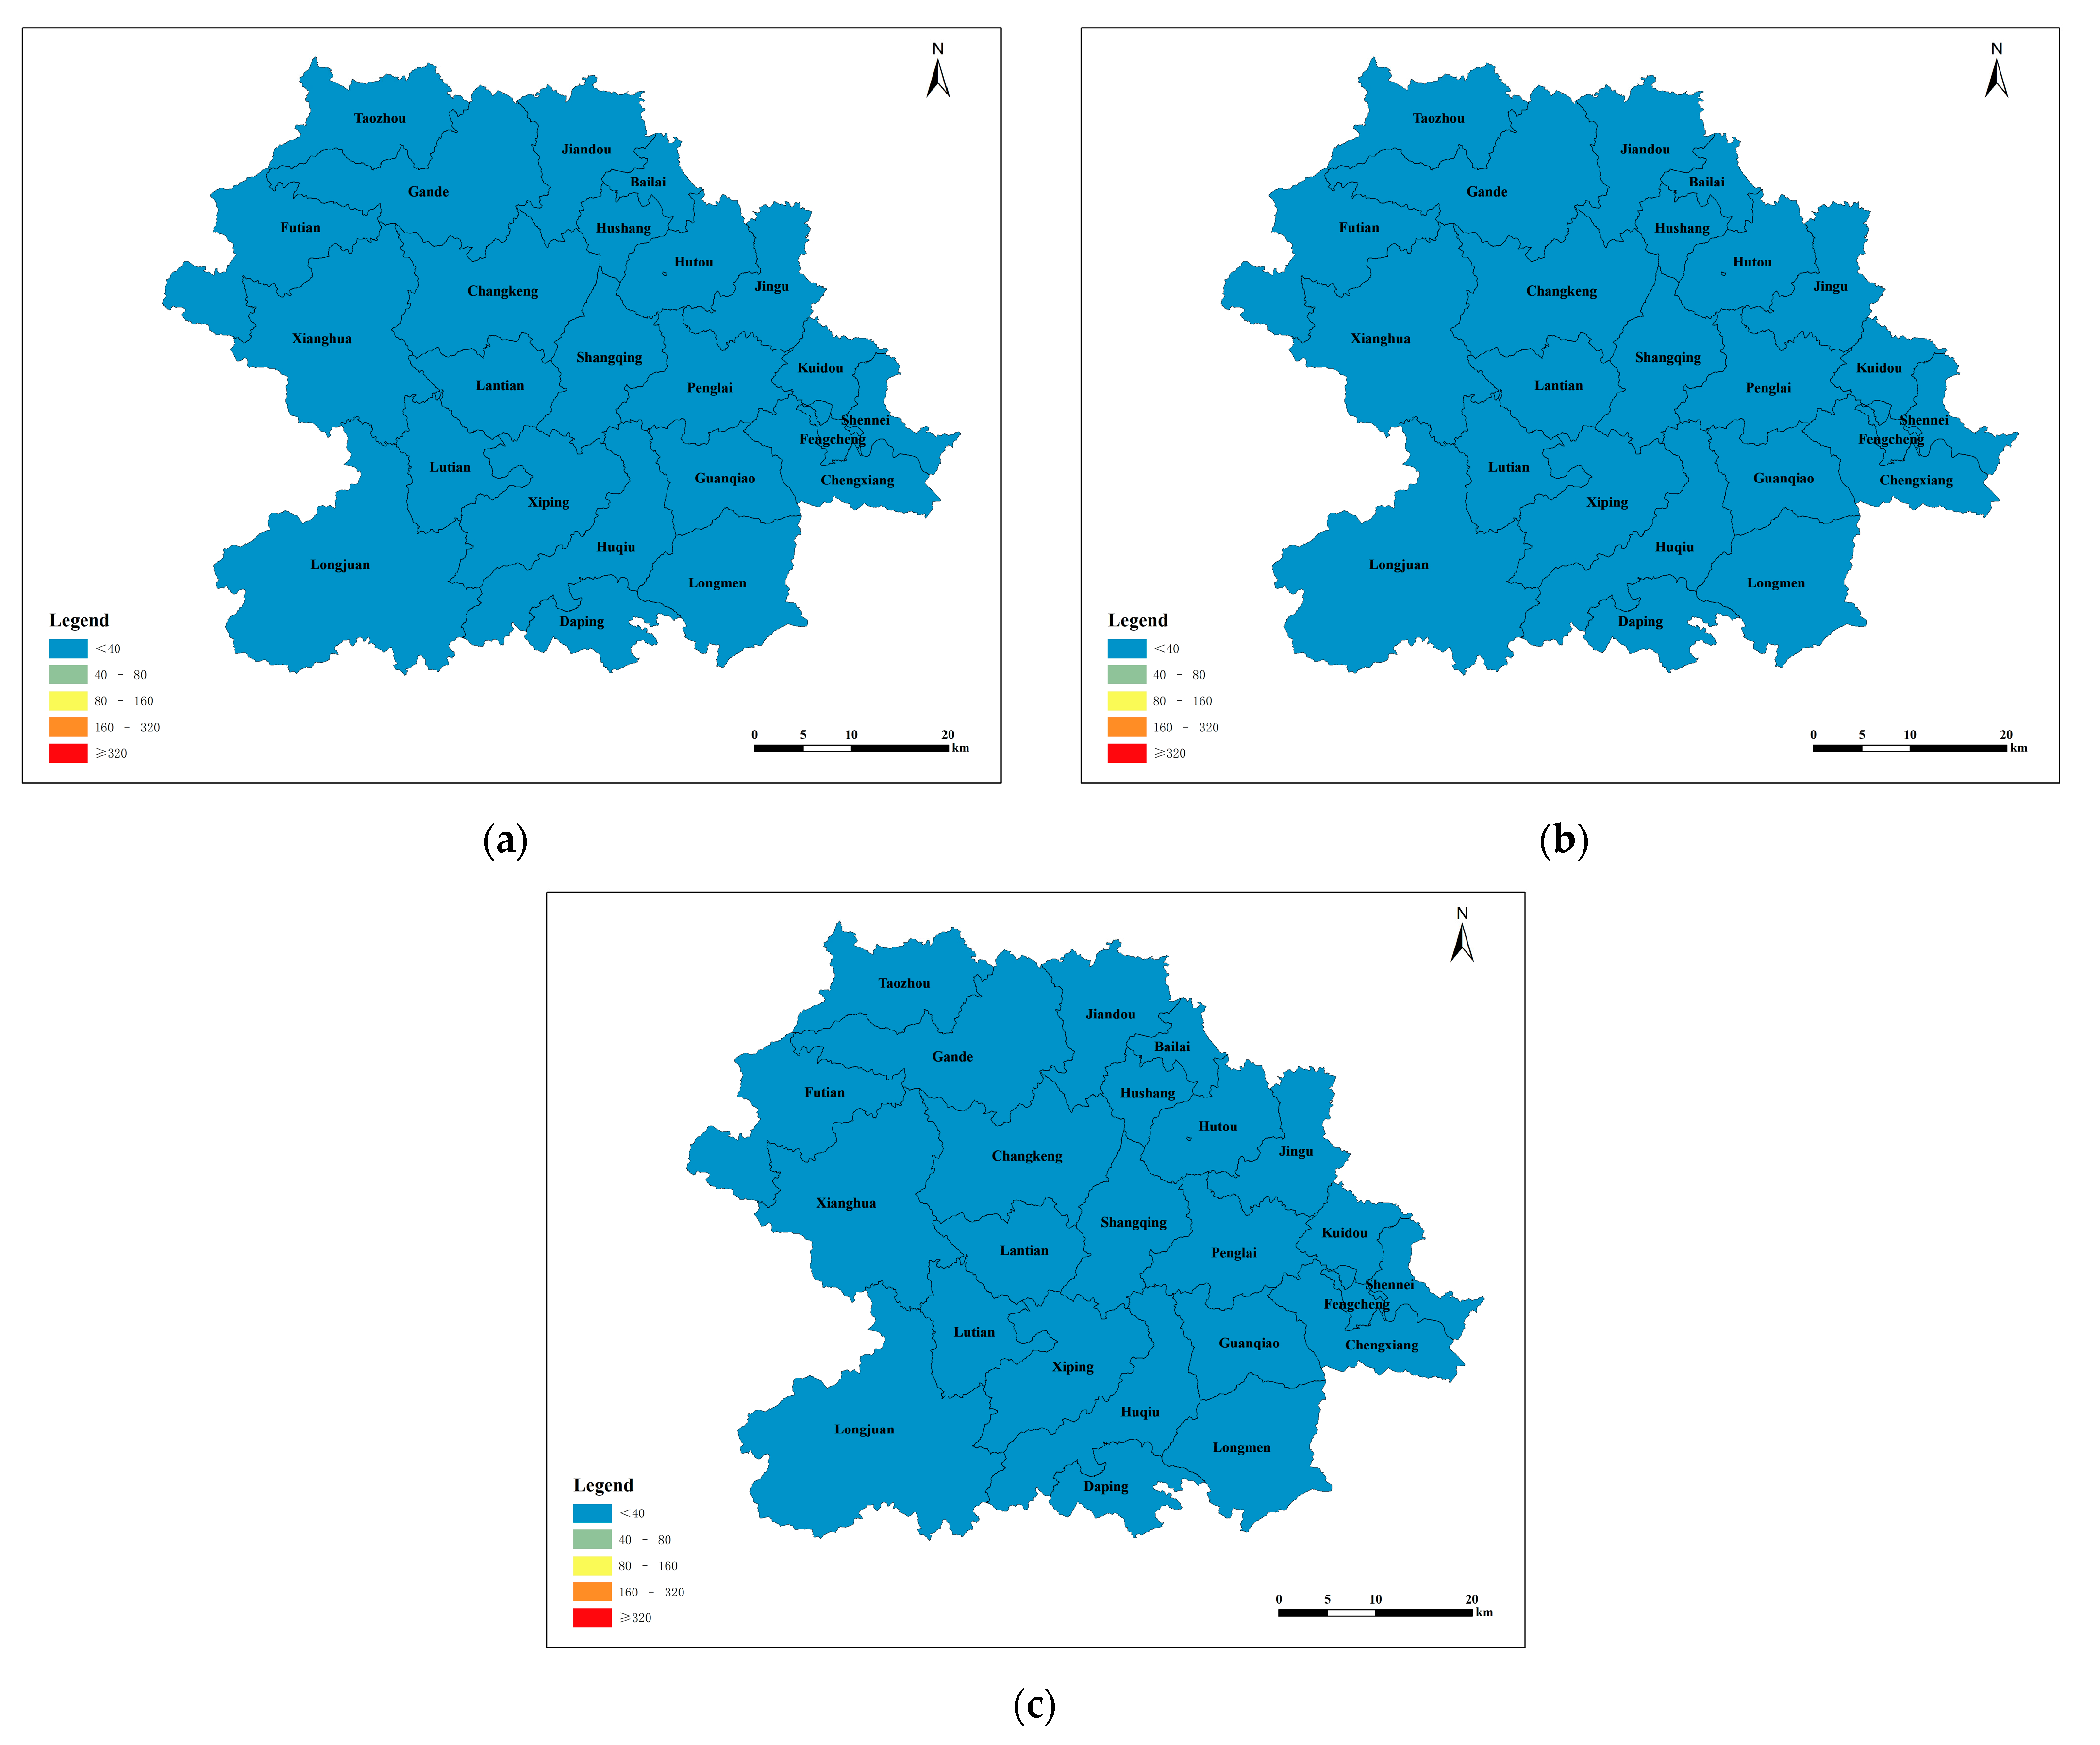
The spatial distribution map of potential ecological hazard indexes, based on the background values of the Soil Environmental Quality Standard, Environmental Technical Conditions for Tea Production Area, and Environmental Technical Conditions for Organic Tea Production Area, indicated that the soil lead pollution in the Tieguanyin tea plantations of Anxi County was at a low level, posing no risk of potential pollution. Part of the soil lead in the Tieguanyin tea plantations of Anxi County originates from the soil parent rock, but a larger portion is attributed to automobile exhaust, atmospheric deposition, and agricultural activities, with automobile exhaust being the more likely source.

Author Contributions

Conceptualization, Y.Z. (Yuanyuan Zhan) and F.J.; methodology, Y.Z. (Yuanyuan Zhan) and Q.Z.; software, Y.Z. (Yuanyuan Zhan) and C.T.; investigation, H.S. and Y.W.; data curation, Y.Z. (Yuanyuan Zhan) and X.L.; writing—original draft preparation, Y.Z. (Yuanyuan Zhan) and Q.Z.; writing—review and editing, F.J. and Y.Z. (Yuanyuan Zhan); supervision, J.L., Y.Z. (Yue Zhang) and Y.H.; project administration, F.J.; funding acquisition, Y.H. and F.J. All authors have read and agreed to the published version of the manuscript.

Funding

This research was funded by the Ministry of Agriculture and Rural Affairs: The Construction of Anxi Modern Agricultural Industrial Park (KMD18003A). The funder: Yanhe Huang and Jinke Lin. The funding number: 15.

Institutional Review Board Statement

Not applicable.

Informed Consent Statement

Not applicable.

Data Availability Statement

Data are contained within the article.

Conflicts of Interest

The authors declare no conflicts of interest.

References

  1. Rai, P.K.; Lee, S.S.; Zhang, M.; Tsang, Y.F.; Kim, K.H. Heavy metals in food crops: Health risks, fate, mechanisms, and management. Environ. Int. 2019, 125, 365–385. [Google Scholar] [CrossRef] [PubMed]
  2. Kamil, J.; Elzbieta, K.P.; Miroslaw, K. The Control and Comprehensive Safety Assessment of Heavy Metal Impurities (As, Pb, and Cd) in Green Tea Camellia sinensis (L.) Samples (Infusions) Available in Poland. Biol. Trace Elem. Res. 2023, 1–10. [Google Scholar] [CrossRef]
  3. Khalid, S.; Shahid, M.; Niazi, N.K.; Murtaza, B.; Bibi, I.; Dumat, C. A comparison of technologies for remediation of heavy metal contaminated soils. J. Geochem. Explor. 2017, 182, 247–268. [Google Scholar] [CrossRef]
  4. Kumar, V.; Sharma, A.; Kumar, R.; Bhardwaj, R.; Kumar, T.A.; Rodrigo, C.J. Assessment of heavy-metal pollution in three different Indian water bodies by combination of multivariate analysis and water pollution indices. Hum. Ecol. Risk Assess. 2020, 26, 1–16. [Google Scholar] [CrossRef]
  5. Yemane, M.; Chandravanshi, B.S.; Wondimu, T. Levels of essential and non-essential metals in leaves of the tea plant (Camellia sinensis L.) and soil of Wushwush farms, Ethiopia. Food Chem. 2008, 107, 1236–1243. [Google Scholar] [CrossRef]
  6. Zhang, Z.Y.; Deng, Q.M.; Ye, H.; Ge, G.F. Bacterial and fungal diversities examined through high-throughput sequencing in response to lead contamination of tea garden soil. Front. Microbiol. 2023, 14, 1121199. [Google Scholar] [CrossRef]
  7. Li, Y.; Liu, K.H.; Zhu, J.; Jiang, Y.R.; Huang, Y.Y.; Zhou, Z.M.; Chen, C.S.; Yu, F.M. Manganese accumulation and plant physiology behavior of Camellia oleifera in response to different levels of nitrogen fertilization. Ecotoxicol. Environ. Saf. 2019, 184, 109603. [Google Scholar] [CrossRef]
  8. Zhang, J.; Yang, R.; Li, Y.C.; Peng, Y.; Wen, X.; Ni, X. Distribution, accumulation, and potential risks of heavy metals in soil and tea leaves from geologically different plantations. Ecotoxicol. Environ. Saf. 2020, 195, 110475. [Google Scholar] [CrossRef]
  9. Sun, J.W.; Hu, G.R.; Liu, K.K.; Yu, R.L.; Lu, Q.Y.; Zhang, Y.F. Potential exposure to metals and health risks of metal intake from Tieguanyin tea production in Anxi, China. Environ. Geochem. Health 2019, 41, 1291–1302. [Google Scholar] [CrossRef]
  10. Cong, Y.; Yu, R.L.; Yan, Y.; Weng, B.S.; Hu, G.R.; Sun, J.W.; Cui, J.Y.; Yan, Y.; Huang, Y.Y. Source analysis of metals in the tea plant using linear correlation analysis combined with a lead-strontium isotope tracer. Catena 2023, 229, 107194. [Google Scholar] [CrossRef]
  11. Zhang, W.H.; Yan, Y.; Yu, R.L.; Hu, G.R. The sources-specific health risk assessment combined with APCS/MLR model for heavy metals in tea garden soils from south Fujian Province, China. Catena 2021, 203, 105306. [Google Scholar] [CrossRef]
  12. Sun, J.; Yu, R.; Yan, Y.; Hu, G.; Qiu, Q.; Jiang, S.; Cui, J.; Wang, X.; Ma, C. Isotope tracers for lead and strontium sources in the Tieguanyin tea garden soils and tea leaves. Chemosphere 2020, 246, 125638. [Google Scholar] [CrossRef] [PubMed]
  13. Research Office of Party History and Local History of Anxi County Committee of the Communist Party of China. Anxi County Yearbook; Strait Literature and Art Publishing House: Fuzhou, China, 2020. [Google Scholar]
  14. Yang, L.; Ge, S.J.; Liu, J.H.; Iqbal, Y.; Jiang, Y.L.; Sun, R.L.; Ruan, X.L.; Wang, Y.Y. Spatial Distribution and Risk Assessment of Heavy Metal(oid)s Contamination in Topsoil around a Lead and Zinc Smelter in Henan Province, Central China. Toxics 2023, 11, 427. [Google Scholar] [CrossRef] [PubMed]
  15. Ahamad, A.; Janardhana, R.N.; Madhav, S.; Gossel, W.; Ram, P.; Wycisk, P. Potentially toxic elements in soil and road dust around Sonbhadra industrial region, Uttar Pradesh, India: Source apportionment and health risk assessment. Environ. Res. 2021, 202, 111685. [Google Scholar] [CrossRef] [PubMed]
  16. Hakanson, L. An ecological risk index for aquatic pollution control. A sedimentological approach. Water Res. 1980, 14, 975–1001. [Google Scholar] [CrossRef]
  17. He, H.F.; Shi, L.Q.; Yang, G.; You, M.S.; Vasseur, L. Ecological Risk Assessment of Soil Heavy Metals and Pesticide Residues in Tea Plantations. Agriculture 2020, 10, 47. [Google Scholar] [CrossRef]
  18. Sarmah, M.; Borgohain, A.; Gogoi, B.B.; Yeasin, M.; Paul, R.K.; Malakar, H.; Handique, J.G.; Saikia, J.; Deka, D.; Khare, P.; et al. Insights into the effects of tea pruning litter biochar on major micronutrients (Cu, Mn, and Zn) pathway from soil to tea plant: An environmental armour. J. Hazard. Mater. 2023, 442, 129970. [Google Scholar] [CrossRef]
  19. Wei, F.S. Background Values of Soil Elements in China; China Environmental Science Press: Beijing, China, 1990. [Google Scholar]
  20. Zhou, G.H.; Zeng, D.M.; He, L.; Zhu, X.T.; Sun, B.B.; Bai, J.F.; Zhou, Z.Q. Ecogeochemical characteristics of Tieguanyin Tea Garden in Fujian Province. Geol. China 2015, 42, 2008–2018. [Google Scholar]
  21. GB 15618-2018; Ministry of Ecology and Environment, State Administration for Market Regulation. Soil Environmental Quality, Agricultural Land Soil Pollution Risk Control Standards (Trial). Standards Press of China: Beijing, China, 2018.
  22. NY/T 853-2004; Environmental and Technical Conditions of Tea Producing Areas. Ministry of Agriculture of the People’s Republic of China: Beijing, China, 2004.
  23. NY 5199-2002; Environmental Conditions of Organic Tea Producing Areas. Ministry of Agriculture of the People’s Republic of China: Beijing, China, 2002.
  24. Stafilov, T.; Šajn, R. Spatial distribution and pollution assessment of heavy metals in soil from the Republic of North Macedonia. J. Environ. Sci. Health A 2019, 54, 1457–1474. [Google Scholar] [CrossRef]
  25. Weng, K.; Dong, Y.P.; Xu, X.Y.; Ma, Z.P.; Chen, B.; Cao, K. Geochemistry and geochronology of Carboniferous magmatic rocks in the Sawur Mountains, northern West Junggar, NW China: Implications for accretionary orogeny. Int. J. Earth Sci. 2020, 109, 605–630. [Google Scholar] [CrossRef]
  26. Basua, A.A.E.; Ma, C.Q.; Nguo, K.S.; Wang, L.X.; Lentz, D.R.; Mukherjee, S.; Signe, N.N.S.; Syprien, B.Y. Petrogenesis and tectonic setting of A-type granites in the Babouri-Figuil Magmatic Complex (North Cameroon): Constraints from whole rock geochemistry, zircon UPb geochronology and Sr-Nd-Hf isotopes. Lithos 2022, 414, 106618. [Google Scholar] [CrossRef]
  27. Andonaegui, P.; Abati, J.; Ruben, D.F. Late Cambrian magmatic arc activity in peri-Gondwana: Geochemical evidence from the Basal Allochthonous Units of NW Iberia. Geol. Acta 2017, 15, 305–321. [Google Scholar]
  28. Ahankoub, M.; Asahara, Y.; Tsuboi, M. Petrology and geochemistry of the Lattan Mountain magmatic rocks in the Sanandaj–Sirjan Zone, west of Iran. Arab. J. Geosci. 2020, 13, 809. [Google Scholar] [CrossRef]
  29. Li, Q.H.; Li, C.F.; Liu, L.J.; Heng, W.; Chen, C.; Long, J.; Wen, X.F. Geochemical characteristics of heavy metals of bedrock, soil, and tea in a metamorphic rock area of Guizhou Province, China. Environ. Sci. Pollut. Res. 2022, 30, 7402–7414. [Google Scholar] [CrossRef] [PubMed]
  30. Guo, G.H.; Li, K.; Zhang, D.G.; Lei, M. Quantitative source apportionment and associated driving factor identification for soil potential toxicity elements via combining receptor models, SOM, and geo-detector method. Sci. Total Environ. 2022, 830, 154721. [Google Scholar] [CrossRef]
  31. Cao, H.L.; Cai, F.Y.; Jiao, W.B.; Liu, C.; Zhang, N.; Qiu, H.Y.; Rensing, C.; Lü, J. Assessment of tea garden soils at An’xi County in southeast China reveals a mild threat from contamination of potentially harmful elements. R. Soc. Open Sci. 2018, 5, 180050. [Google Scholar] [CrossRef]
  32. Wang, S.; Cai, L.M.; Wen, H.H.; Luo, J.; Wang, Q.S.; Liu, X. Spatial distribution and source apportionment of heavy metals in soil from a typical county-level city of Guangdong Province, China. Sci. Total Environ. 2019, 655, 92–101. [Google Scholar] [CrossRef]
  33. Fan, S.X.; Wang, X.D.; Lei, J.; Ran, Q.Q.; Ren, Y.X.; Zhou, J.H. Spatial distribution and source identification of heavy metals in a typical Pb/Zn smelter in an arid area of northwest China. Hum. Ecol. Risk Assess. 2019, 25, 1661–1687. [Google Scholar] [CrossRef]
  34. Williams, C.; David, D. The effect of superphosphate on the cadmium content of soils and plants. Soil. Res. 1973, 11, 43–56. [Google Scholar] [CrossRef]
  35. Lin, W.W.; Lin, M.H.; Zhou, H.Y.; Wu, H.M.; Li, Z.W.; Lin, W.X. The effects of chemical and organic fertilizer usage on rhizosphere soil in tea orchards. PLoS ONE 2019, 14, e0217018. [Google Scholar] [CrossRef]
  36. Yi, X.Y.; Ji, L.F.; Hu, Z.M.; Yang, X.D.; Li, H.T.; Jiang, Y.Y.; He, T.H.; Yang, Y.Y.; Ni, K.; Ruan, J.Y. Organic amendments improved soil quality and reduced ecological risks of heavy metals in a long-term tea plantation field trial on an Alfisol. Sci. Total Environ. 2022, 838, 156017. [Google Scholar] [CrossRef] [PubMed]
  37. Zhang, M.; Fang, L. Tea Plantation-Induced Activation of Soil Heavy Metals. Commun. Soil. Sci. Plant Anal. 2007, 38, 1467–1478. [Google Scholar] [CrossRef]
  38. Ye, J.H.; Zhang, Q.; Liu, G.Y.; Lin, L.W.; Wang, H.B.; Lin, S.X.; Wang, Y.C.; Wang, Y.H.; Zhang, Q.X.; Jia, X.L.; et al. Relationship of soil pH value and soil Pb bio-availability and Pb enrichment in tea leaves. J. Sci. Food Agric. 2021, 102, 1137–1145. [Google Scholar] [CrossRef] [PubMed]
  39. Giuseppe, G.; Anna, G.; Grazia, D.; Antonio, L.; Matteo, F.; Emanuele, T.; Marcella, M.G. Irrigation with Treated Municipal Wastewater on Artichoke Crop: Assessment of Soil and Yield Heavy Metal Content and Human Risk. Water 2018, 10, 255. [Google Scholar]
  40. Chen, D.; Liu, X.Y.; Bian, R.J.; Cheng, K.; Zhang, X.H.; Zheng, J.F.; Joseph, S.; Crowley, D.; Pan, G.X.; Li, L.Q. Effects of biochar on availability and plant uptake of heavy metals—A meta-analysis. J. Environ. Manag. 2018, 222, 76–85. [Google Scholar] [CrossRef] [PubMed]
  41. Seenivasan, S.; Anderson, T.A.; Muraleedharan, N. Heavy metal content in tea soils and their distribution in different parts of tea plants, Camellia sinensis (L). O. Kuntze. Environ. Monit. Assess. 2016, 188, 428. [Google Scholar] [CrossRef]
  42. Tao, C.J.; Song, Y.X.; Chen, Z.; Zhao, W.F.; Ji, J.F.; Shen, N.P.; Ayoko, G.A.; Frost, R.L. Geological load and health risk of heavy metals uptake by tea from soil: What are the significant influencing factors? Catena 2021, 204, 105419. [Google Scholar] [CrossRef]
  43. Bourg, A.C.M.; Loch, J.P.G. Mobilization of Heavy Metals as Affected by pH and Redox Conditions; Springer: Berlin/Heidelberg, Germany, 1995; pp. 87–102. [Google Scholar]
  44. Xu, W.; Lan, H.C.; Wang, H.J.; Liu, H.M.; Qu, J.H. Comparing the adsorption behaviors of Cd, Cu and Pb from water onto Fe-Mn binary oxide, MnO2 and FeOOH. Front. Environ. Sci. Eng. 2015, 9, 385–393. [Google Scholar] [CrossRef]
  45. Balistrieri, L.S.; Murray, J.W. The surface chemistry of sediments from the panama basin: The influence of mn oxides on metal adsorption. Geochim. Cosmochim. Acta 1986, 50, 2235–2243. [Google Scholar] [CrossRef]
Figure 1. Location of the study area and the sampling points.
Toxics 12 00022 g001
Figure 2. Frequency plot of soil lead content in the study area. (a): Histogram of total lead content frequency; (b): Histogram of available lead content frequency.
Toxics 12 00022 g002
Figure 3. Spatial distribution of lead in Tieguanyin tea plantation soils. (a): Spatial distribution of lead in tea plantation soils; and (b): spatial distribution of available lead in tea plantation soils.
Toxics 12 00022 g003
Figure 4. Spatial distribution of individual pollution index of lead in tea plantation soils (The soil environmental quality standard was taken as the basis for evaluation).
Toxics 12 00022 g004
Figure 5. Spatial distribution of individual pollution index of lead in tea plantation soils (The environmental technical conditions of tea origin was taken as the basis for evaluation).
Toxics 12 00022 g005
Figure 6. Spatial distribution of individual pollution index of lead in tea plantation soils(The environmental conditions of organic tea production was taken as the basis for evaluation).
Toxics 12 00022 g006
Figure 7. Spatial distribution of potential ecological hazard index of soil lead content in tea plantation. (a): The soil environmental quality standard is used as the background value; (b): the background value is based on the environmental and technical conditions of tea producing areas; and (c): the background value is based on the environmental and technical conditions of organic tea production areas.
Toxics 12 00022 g007
Figure 8. Correlation analysis of lead content in soil with rocks, soil elements and physicochemical properties.
Toxics 12 00022 g008
Figure 9. Standard residual histograms (a) and normal P−P plot (b) of the multiple linear regression equation for soil lead.
Toxics 12 00022 g009
Figure 10. Standard residual histograms (a) and normal P−P plot (b) of the multiple linear regression equation for soil available lead.
Toxics 12 00022 g010
Table 1. Descriptive statistics of heavy metal content in rocks and soils of Tieguanyin tea plantations in Anxi County (mg/kg).
TypeNormMeanSDCVMinMax
RockCu9.93 15.07 1.52 0.30 82.30
Mn750.84 1197.67 1.60 78.00 9741.00
Pb53.33 86.52 1.62 8.10 640.60
Zn84.47 126.77 1.50 8.90 1006.50
SoilCu12.389.900.800.3056.7
Mn403.38377.380.9465.002356.00
Zn71.6837.280.5220.90262.80
Cd0.050.040.660.0030.18
Fe3.381.710.511.1810.64
The cadmium content of rock was not tested; thus, it is not presented in this paper.
Table 2. Classification of ecological hazards and toxicity coefficient of the single factor pollutants.
Ecological Hazard LevelLowMediumHighHigherExtremely HighToxicity Factor
E<4040–8080–160160–320≥3205
Table 3. Lead content in soils with different rock development in Anxi County.
Rock TypeNumberMean (mg/kg)SDMin (mg/kg)Max (mg/kg)CV
magmatic rockandesite1399.88 181.90 21.10 700.60 182.13%
rhyolite1560.95 71.58 15.70 308.50 117.45%
dacite4362.06 58.22 15.70 364.70 93.81%
granite2050.32 26.45 14.90 118.20 52.57%
Three major rock typemagmatic9164.70 84.67 14.90 700.60 130.87%
metamorphic532.64 7.8226.90 45.90 23.95%
sedimentary1330.88 9.90 17.00 53.10 32.06%
Table 4. Comparison of lead content and background values in soils developed from different rocks in Anxi County.
Rock TypeABCABAC
magmatic rockandesite99.88 65.00 23.30 34.88 76.58
rhyolite60.95 65.00 23.30 −4.05 37.65
dacite62.06 65.00 23.30 −2.94 38.76
granite50.32 65.00 23.30 −14.69 27.02
three major rock typemagmatic64.70 65.00 23.30 −0.30 41.40
metamorphic32.64 65.00 23.30 −32.36 9.34
sedimentary30.88 65.00 23.30 −34.12 7.58
A represents the mean value of lead content in different rock development soil in Anxi County; B and C represent the background values of soil elements in Fujian Tieguanyin Tea Plantation and China, respectively; and AB and AC represent the difference between the mean value of lead content in different rock development soil in Anxi County and the respective background values, respectively.
Table 5. Determination results of lead content in tea garden soil in Anxi County.
Study AreaNumberLead (mg/kg)Available Lead (mg/kg)
MeanCVMeanCV
Anxi County Daping450.58 ± 20.3040.14%11.13 ± 5.6951.12%
Guanqiao540.88 ± 23.5657.63%10.53 ± 6.5161.85%
Huqiu882.25 ± 92.53112.50%20.54 ± 16.2679.14%
Kuidou470.05 ± 20.8229.72%22.43 ± 9.5442.54%
Longmen361.13 ± 12.4120.29%15.64 ± 5.9938.31%
Penglai344.40 ± 12.7028.60%12.72 ± 2.6220.64%
Xiping938.44 ± 12.5832.72%13.60 ± 6.0544.51%
Lutian5148.98 ± 147.1698.78%28.67 ± 25.9290.41%
Bailai471.68 ± 16.1022.46%19.97 ± 6.8434.27%
Gande1539.27 ± 14.9838.15%10.58 ± 4.7544.84%
Jiandou664.27 ± 33.8952.73%23.70 ± 20.4286.17%
Jingu364.07 ± 5.087.93%13.22 ± 2.5319.17%
Changkeng547.92 ± 14.4130.06%14.54 ± 6.6245.55%
Futian321.33 ± 8.3339.04%5.51 ± 2.1939.79%
Hushang4230.95 ± 313.27135.64%66.02 ± 73.14110.79%
Longjuan1025.68 ± 7.0627.48%6.07 ± 3.4256.38%
Taozhou430.75 ± 3.8612.57%6.19 ± 2.3337.61%
Xianghua636.07 ± 7.8821.85%8.46 ± 2.0123.78%
Other townships852.83 ± 26.4550.08%16.53 ± 9.9360.07%
Entire study area10961.31 ± 86.06140.37%16.52 ± 20.85126.60%
Townships with too few sampling points were aggregated into other townships for analysis; 2 in Shennei, 2 in Chengxiang, 2 in Lantian, 1 in Hutou, and 1 in Shangqing.
Table 6. Comparison of soil lead content and background values in tea plantations of various towns in Anxi County.
TownshipsABCABAC
Daping50.5865.0023.30−14.4327.28
Guanqiao40.8865.0023.30−24.1217.58
Huqiu82.2565.0023.3017.2558.95
Kuidou70.0565.0023.305.0546.75
Longmen61.1365.0023.30−3.8737.83
Penglai44.4065.0023.30−20.6021.10
Xiping38.4465.0023.30−26.5615.14
Lutian148.9865.0023.3083.98125.68
Bailai71.6865.0023.306.6848.38
Gande39.2765.0023.30−25.7315.97
Jiandou64.2765.0023.30−0.7340.97
Jingu64.0765.0023.30−0.9340.77
Changkeng47.9265.0023.30−17.0824.62
Futian21.3365.0023.30−43.67−1.97
Hushang230.9565.0023.30165.95207.65
Longjuan25.6865.0023.30−39.322.38
Taozhou30.7565.0023.30−34.257.45
Xianghua36.0765.0023.30−28.9312.77
Other townships52.8365.0023.30−12.1829.53
A represents the average value of soil lead content in tea gardens in each township of Anxi County; B and C represent the background value of soil element in Fujian Tieguanyin tea plantation and China, respectively; and AB and AC represent the difference between the average value of soil lead content in tea plantation in each township of Anxi County and each background value, respectively.
Table 7. Semi-variance function model and parameters for spatial interpolation of lead in tea plantation soil.
NormModelNugget Sill Nugget/SillRange (m)R2RSS
total leadindex0.050.390.134260.000.330.036
available leadindex0.050.490.102490.000.150.037
Table 8. Distribution of single-factor pollution index for the three evaluation criteria in Anxi County. Unit: %.
Study AreaEvaluation CriteriaStandard
Limit Value
p ≤ 0.70.7 < p ≤ 1.01.0 < p ≤ 2.02.0 < p ≤ 3.0p > 3.0
Anxi County Environmental quality standards for soil7047.3731.5810.535.265.26
Environmental technical conditions for tea production areas25094.745.260.000.000.00
Environmental technical conditions for organic tea production areas5015.7931.5842.115.265.26
Table 9. Analysis of variance table for regression equation of soil lead content a.
Model Sum of SquareDegrees of FreedomMean SquareFSignificance
1regression 321,330.7371321,330.73789.7990.000 b
residual332,786.816933578.353
total654,117.55394
2regression 372,504.5512186,252.27560.8470.000 c
residual281,613.003923061.011
total654,117.55394
3regression389,119.2083129,706.40344.5410.000 d
residual264,998.345912912.070
total654,117.55394
a Dependent variable lead; b predictor variable: (constant), Zn; c predictor variable: (constant), Zn, rock Cu; and d predictor variable: (constant), Zn, rock Cu, Mn.
Table 10. Stepwise regression results of soil lead content.
ModelUnstandardized CoefficientStandardization
Coefficient
TSignificanceCollinearity Statistics
BetaStandard
Error
ToleranceVIF
1(Constant)−46.82313.011 −3.5990.001
Zn1.4900.1570.7019.4760.0001.0001.000
2(Constant)−49.19012.048 −4.0830.000
Zn1.3010.1530.6128.5290.0000.9091.101
Rock Cu1.6240.3970.2934.0890.0000.9091.101
3(Constant)−46.89111.790 −3.9770.000
Zn1.0280.1880.4835.4740.0000.5711.752
Rock Cu1.5060.3910.2723.8550.0000.8941.119
Mn0.0440.0180.2102.3890.0190.5761.735
Table 11. Analysis of variance for regression equation of available lead content a in soil.
Model Sum of Square Degrees of FreedomMean SquareFSignificance
1regression32,888.392132,888.392518.1710.000 b
residual5902.7299363.470
total38,791.12294
2regression 33,676.203216,838.101302.8600.000 c
residual5114.9199255.597
total38,791.12294
3regression 34,172.926311,390.975224.4550.000 d
residual4618.1969150.749
total38,791.12294
4regression 34,461.92548615.481179.1080.000 e
residual4329.1979048.102
total38,791.12294
5regression 34,719.16056943.832151.7700.000 f
residual4071.9628945.752
total38,791.12294
a Dependent variable: available lead; b predictor variable: (constant),lead; c predictor variable: (constant), lead, Mn; d Predictor variable: (constant),lead, Mn, rock lead; e predictor variable: (constant), lead, Mn, rock lead, Cu; and f predictor variable: (constant), lead, Mn, rock lead, Cu, Zn.
Table 12. Stepwise regression results of soil available lead content.
ModelUnstandardized
Coefficient
Standardization
Coefficient
TSignificanceCollinearity Statistics
BetaStandard
Error
ToleranceVIF
1(Constant)2.7661.020 2.7120.008
lead0.2240.0100.92122.7630.0001.0001.000
2(Constant)5.0471.130 4.4640.000
lead0.2500.0121.02721.7270.0000.6411.560
Mn−0.0090.002−0.178−3.7640.0000.6411.560
3(Constant)4.0061.130 3.5450.001
lead0.2360.0120.96819.7450.0000.5441.837
Mn−0.0080.002−0.160−3.5250.0010.6311.584
rock lead0.0290.0090.1243.1290.0020.8311.203
4(Constant)5.4741.252 4.3700.000
lead0.2410.0120.99120.3680.0000.5231.910
Mn−0.0070.002−0.137−3.0230.0030.6031.658
rock lead0.0300.0090.1263.2620.0020.8311.203
Cu−0.1900.078−0.096−2.4510.0160.8051.242
5(Constant)2.7811.668 1.6670.099
lead0.2270.0130.93117.2730.0000.4062.462
Mn−0.0090.002−0.177−3.7420.0000.5261.901
rock lead0.0310.0090.1303.4510.0010.8291.206
Cu−0.2150.076−0.109−2.8130.0060.7901.266
Zn0.0650.0270.1252.3710.0200.4222.370
Table 13. Optimal multivariate linear fitting equations for soil lead content.
Dependent VariableMultiple Linear Regression EquationR2Significance
leadY = 1.028 X5 + 1.506 X6 + 0.044 X2 − 46.891 0.595 0.000
available leadY = 0.277 X1 − 0.009 X2 + 0.031 X3 − 0.215 X4 + 0.065 X5 + 2.781 0.895 0.000
X1 is soil lead; X2 is soil Mn; X3 is rock lead; X4 is soil Cu; X5 is soil Zn; and X6 is rock Cu.
Table 14. Comparison of rock and soil lead content in tea plantation.
Norm<1=1>1Mean Value Ratio
Lead of rock/Lead of soil74.31%0.00%25.69%0.90
Available lead of soil/Lead of soil100.00%0.00%0.00%0.27
Disclaimer/Publisher’s Note: The statements, opinions and data contained in all publications are solely those of the individual author(s) and contributor(s) and not of MDPI and/or the editor(s). MDPI and/or the editor(s) disclaim responsibility for any injury to people or property resulting from any ideas, methods, instructions or products referred to in the content.

