Abstract
Since zinc oxide (ZnO) nanoparticles (NPs) have been widely applied, the nano community and the general public have paid great attention to the toxicity of ZnO NPs. We detected 20-nm ZnO NPs biotoxicity following nasal exposure utilizing the non-invasive and real-time magnetic resonance imaging (MRI) technique. MR images were scanned in the rat olfactory epithelium (OE) and olfactory bulb (OB) on a 4.7 T scanner following the treatment (as early as 1 day and up to 21 days after), and the histological changes were evaluated. The influence of the size of the ZnO NPs and chemical components was also investigated. Our study revealed that 20-nm ZnO NPs induced obvious structural disruption and inflammation in the OE and OB at the acute stage. The results suggest that the real-time and non-invasive advantages of MRI allow it to observe and assess, directly and dynamically, the potential toxicity of long-term exposure to ZnO NPs in the olfactory system. These findings indicate the size-dependent toxicity of ZnO NPs with respect to the olfactory bulb. Further study is needed to reveal the mechanism behind ZnO NPs’ toxicity.
1. Introduction
Zinc oxide (ZnO) nanoparticles (NPs) have been employed in a wide range of rubber, cosmetic, foods, medical, and biological fields [1,2]. The potential health risks of mass-produced nanomaterials have received great public and academic attention. ZnO NPs’ aerosol exposure can originate from welding fumes and manufacturing processing [3,4], which has been proven to cause pulmonary impairment [5,6] and metal fume fever [7].
Studies have shown the translocation of nanosized particles from the nose to the central nervous system (CNS), an important mechanism by which these particles enter the brain. An early study demonstrated the anterograde axonal transport of 50-nm silver-coated gold colloids along the olfactory nerve to the olfactory bulb in the squirrel monkey after intranasal instillation [8]. Oberdörster, G. et. al. investigated the migration of inhaled ultrafine 13C particles (36 nm) in the rat brain and found that after 6 h of inhalation exposure, there was a significant and sustained increase in 13C concentration in the olfactory bulb, from which they inferred that the migration of 13C particles from the nasal cavity to the CNS was mainly accomplished via olfactory sensory neurons [9]. Likewise, metal oxide NPs such as manganese oxide (MnO) and iron oxide have been found to translocate into the brain via the olfactory route [10,11,12]. Therefore, we hypothesized that environmental and occupational exposures to ZnO NPs by the respiratory system, by virtue of their extremely small size, may enter the nasal cavity and affect the CNS via the olfactory pathway.
Nano-sized particles may exhibit distinct biological responses in contrast to bulk-sized particles of the same chemical composition [13]. Some cellular studies have reported the high cytotoxicity of ZnO NPs compared with larger-sized ZnO particles [14,15]. NPs were found to cause more immune function, inflammation, and transcriptomic responses than larger particles of the same material within the in vivo studies focused on nasal olfactory epithelium (OE), the respiratory tract, and oral exposure [16,17,18]. Tin-Tin-Win-Shwe et. al. demonstrated the size-dependent immune function of ultrafine carbon black in mice’s olfactory bulb (OB) following intranasal instillation [16]. After oral administration, ZnO NPs showed more transcriptomic responses than bulk-sized ZnO in rat liver [18]. Studies addressing the possibility of the effects of ZnO NPs versus larger-sized particles on the OB are very limited.
ZnO NPs have been manufactured in bulk and widely applied. The potential health risks of the mass-produced nanomaterials prompted us to pay attention to the NP’s safety application. ZnO NPs belong to highly soluble metal oxide. The results from cellular experiments demonstrate that ZnO NPs are more toxic than other metal oxide NPs [19,20,21]. Our understanding of how the ZnO NPs may disturb the olfactory pathway is poor. Cellular studies co-incubating human nasal mucosa cells with ZnO NPs illustrated cytotoxic, pro-inflammatory, and apoptosis responses in these cells [22,23]. Short-term inhalation exposure to ZnO NPs caused nasal necrosis in rats [24]. In the previous study, we proved that 30-nm ZnO NPs instilled in the nasal cavities of rats caused cellular injury and inflammation to the OE [25].
In this study, to further identify the influence of particle scale on the olfactory system (OE and OB), we applied magnetic resonance imaging (MRI) and histochemical methods to investigate the size effect of the intranasal exposure of nano-sized and submicron-sized ZnO particles (20 and 500 nm) on rats. Moreover, the influence of the chemical properties of the ZnO NPs and the zinc ions dissolved before the instillation was also considered.
The novelty of this article is that our study identifies the ZnO NPs-induced adverse effect on the olfactory bulb. As far as we know, olfactory bulb damage caused by ZnO NPs has never been reported before. The olfactory impairment caused by NPs could be screened by MRI. This work will facilitate the study of the link between ZnO NPs exposure and neurodegenerative disease.
2. Materials and Methods
2.1. Chemicals
ZnO NPs with a diameter of 20 nm and Fe2O3 NPs with a diameter of 30 nm were purchased from Haitai Nano Material Co., Ltd., Nanjing, China, and ZnO NPs with a diameter of 500 nm were purchased from National Pharmaceutical Chemical Reagent Co., Ltd., Beijing, China. We used sodium carboxymethyl cellulose (CMC) as an agent to suspend the NPs, which was manufactured by Sinopharm Chemical Reagent Co., Ltd., Shanghai, China. CMC is a water-soluble polymer that increases the viscosity of a solution, thereby helping to disperse nanoparticles and prevent aggregation. By forming a viscous solution, CMC effectively reduces the settling rate of the particles and therefore provides a good suspension aid.
2.2. Characterization of NPs
For the particle size characterization, the ZnO and Fe2O3 NPs were measured using JEM-200CX transmission electron microscopy (JEOL, Japan). The purity of the NPs was evaluated via an X-ray fluorescence spectrometer (Bruker, Germany). For the crystalline phase characterization, the NPs were analyzed via D/MAX 2000 X-ray diffraction (Rigaku, Japan). The specific surface area of the NPs was measured using an ASAP2010 Brunauer–Emmett–Teller technique. ZnO NP-CMC suspension was prepared by dispersing the ZnO NPs within 1 wt% CMC saline solution. The Fe2O3 NPs were also dispersed within the same solution to prepare Fe2O3 NP-CMC suspension. The concentration of Zn2+ in the supernatant of ZnO NP-CMC suspension was determined using complexometric titration: ammonia–ammonium chloride buffer solution (pH 10.0) was added to the suspension, followed by the addition of Chromium Black T indicator, and titration was carried out with a standard solution of 9.92 mM Na2EDTA. The endpoint of the titration was reached when the color of the mixture changed from sky blue to purplish red. The concentration of Zn2+ in the 20-nm and 500-nm ZnO NP-CMC suspensions was to be about 0.065 mg·mL−1 in both cases. The ZnO NP-CMC suspensions were centrifuged at 12,000× g rpm and/or 16,099× g for 10 min; then, the supernatants were extracted.
2.3. Animals
All experimental animals were handled in accordance with the National Committee for the Ethics and Use of Laboratory Animals. Male Sprague-Dawley rats (140–200 g in weight) were bought from the Animal Laboratory of Zhongnan Hospital of Wuhan University. The rats were group-housed in clean polypropylene cages in the SPF-level laboratory animal room. They are maintained within a light-cycle-controlled and temperature-controlled environment. Relative humidity was kept at 50 ± 5%. Rats are free to commercial rodent food and water. The animals were subjected to experimental studies following at least 5 days of laboratory domestication.
2.4. Experimental Preparation
Animals without obvious nasal structural abnormalities were chosen for intranasal exposure. Exposure doses were designed in the same way as our previous study [25]. Animals were randomly separated into five groups to receive unilateral intranasal drops of one of the following 40 μL of solution/suspension (given with a 20 µL pipette tip):
(1) 1 wt% saline solution of CMC, n = 8;
(2) Supernatant of 40 mg ZnO mL−1 20-nm ZnO NP-CMC suspension (S-ZnO20), n = 5;
(3) 40 mg Fe2O3 mL−1 Fe2O3 NP-CMC suspension (Fe2O3), n = 8;
(4) 40 mg ZnO mL−1 20-nm ZnO NP-CMC suspension (ZnO20), n = 8;
(5) 40 mg ZnO mL−1 500-nm ZnO NP-CMC suspension (ZnO500), n = 8.
Before the intranasal exposure, all suspensions were sonicated for 10 min.
2.5. MRI Study
A Bruker Biospec 4.7 T/30 cm small animal scanner was utilized to perform all MRI scans. A 12 cm diameter Helmholtz volume coil was used for radiofrequency (RF) pulse transmission, and a 2.5 cm diameter single loop surface coil was used for signal reception, both of which were decoupled. The nasal structures of the animals were scanned via the spin-echo T1-weighted MRI sequence to avoid including unsuitable animals in the trials. At 0 days (before) and 1 day (1 d), 4 days (4 d), and 7 days (7 d) after intranasal instillation, T2-weighted image acquisition screening for OE defects and quantitative measurement of T1 values were performed on the OE of all rats under chloral hydrate anesthesia (5 wt% solution, 7 mL kg−1 dosage), respectively, to monitor changes in the OE dynamically in the following five groups: CMC (n = 6), S-ZnO20 (n = 5), Fe2O3 (n = 6), ZnO20 (n = 6), and ZnO500 (n = 6). At the same time points, T2-weighted images were acquired to monitor OB alterations in five groups (n = 3 in each group). At 21 days (21 d), the damage to the olfactory bulbs of the ZnO20 (n = 3) and ZnO500 (n = 3) groups were scanned with T2-weighted and T1 inversion recovery images. The spin-echo T1-weighted image parameters were as follows: repetition time: 400 ms; echo time: 15 ms; field of view: 1.5 cm × 1.5 cm; matrix size: 128 × 128; slice thickness: 0.8 mm; and number of averages: 2. The T2-weighted image parameters were as follows: a repetition time of 3000 ms; 6 echoes, with echo times ranging from 25 to 175 ms; and an echo interval of 25 ms. T1 values of the OE were measured by the fast Look–Locker T1 imaging measurement sequence (LL T1) with a repetition time of 5000 ms. The T1 values were fitted by 24 small-angle gradient echo signals acquired with an excitation interval of 150 ms. The imaging parameters for the T1 inversion recovery sequence were as follows: repetition time: 5000 ms; echo time: 15 ms; inversion recovery time: 450 ms. In the other MRI scans, the field of view parameters, matrix size, slice thickness, and number of averages are the same as those in the spin-echo T1-weighted image.
2.6. Histologic Examination
At 1 and 22 days after treatment, except for the S-ZnO20 group, two typical rats in every group were executed for pathohistological evaluation of the OE and OB. For hematoxylin–eosin staining, animals were perfused with 0.9 wt% NaCl and 4 wt% paraformaldehyde solutions through the left ventricular aorta. The OE and OB of each animal were then dissected, sampled, and fixed in 4 wt% paraformaldehyde solutions for one night. For the next 7 days, the fixed OE samples were decalcified within 15% EDTA. After that, the OE and OB specimens were embedded in paraffin and sliced to a thickness of 4 μm. The sections were deparaffinized, rehydrated, and stained with hematoxylin and eosin. At last, the sections were dehydrated, cleared, and covered with a neutral balsam.
2.7. Statistical Analysis
The region of interest (ROI) on the LL T1 image was selected in ectoturbinate 2 (susceptible region) of the instilled side of the OE in the CMC group, and the T1 value of ROI was fitted using a house-made MATLAB program. The data were expressed as mean ± standard deviation and statistically analyzed using the SPSS19.0 software package. Two-way analysis of variance (ANOVA) was used to analyze T1 value data. Two-tailed Student’s t-tests were used to evaluate the statistical significance of inter- and intro-group differences. The significance level was set at p < 0.05 with Bonferroni correction for multiple comparisons.
3. Results
3.1. Characterization Results of NPs
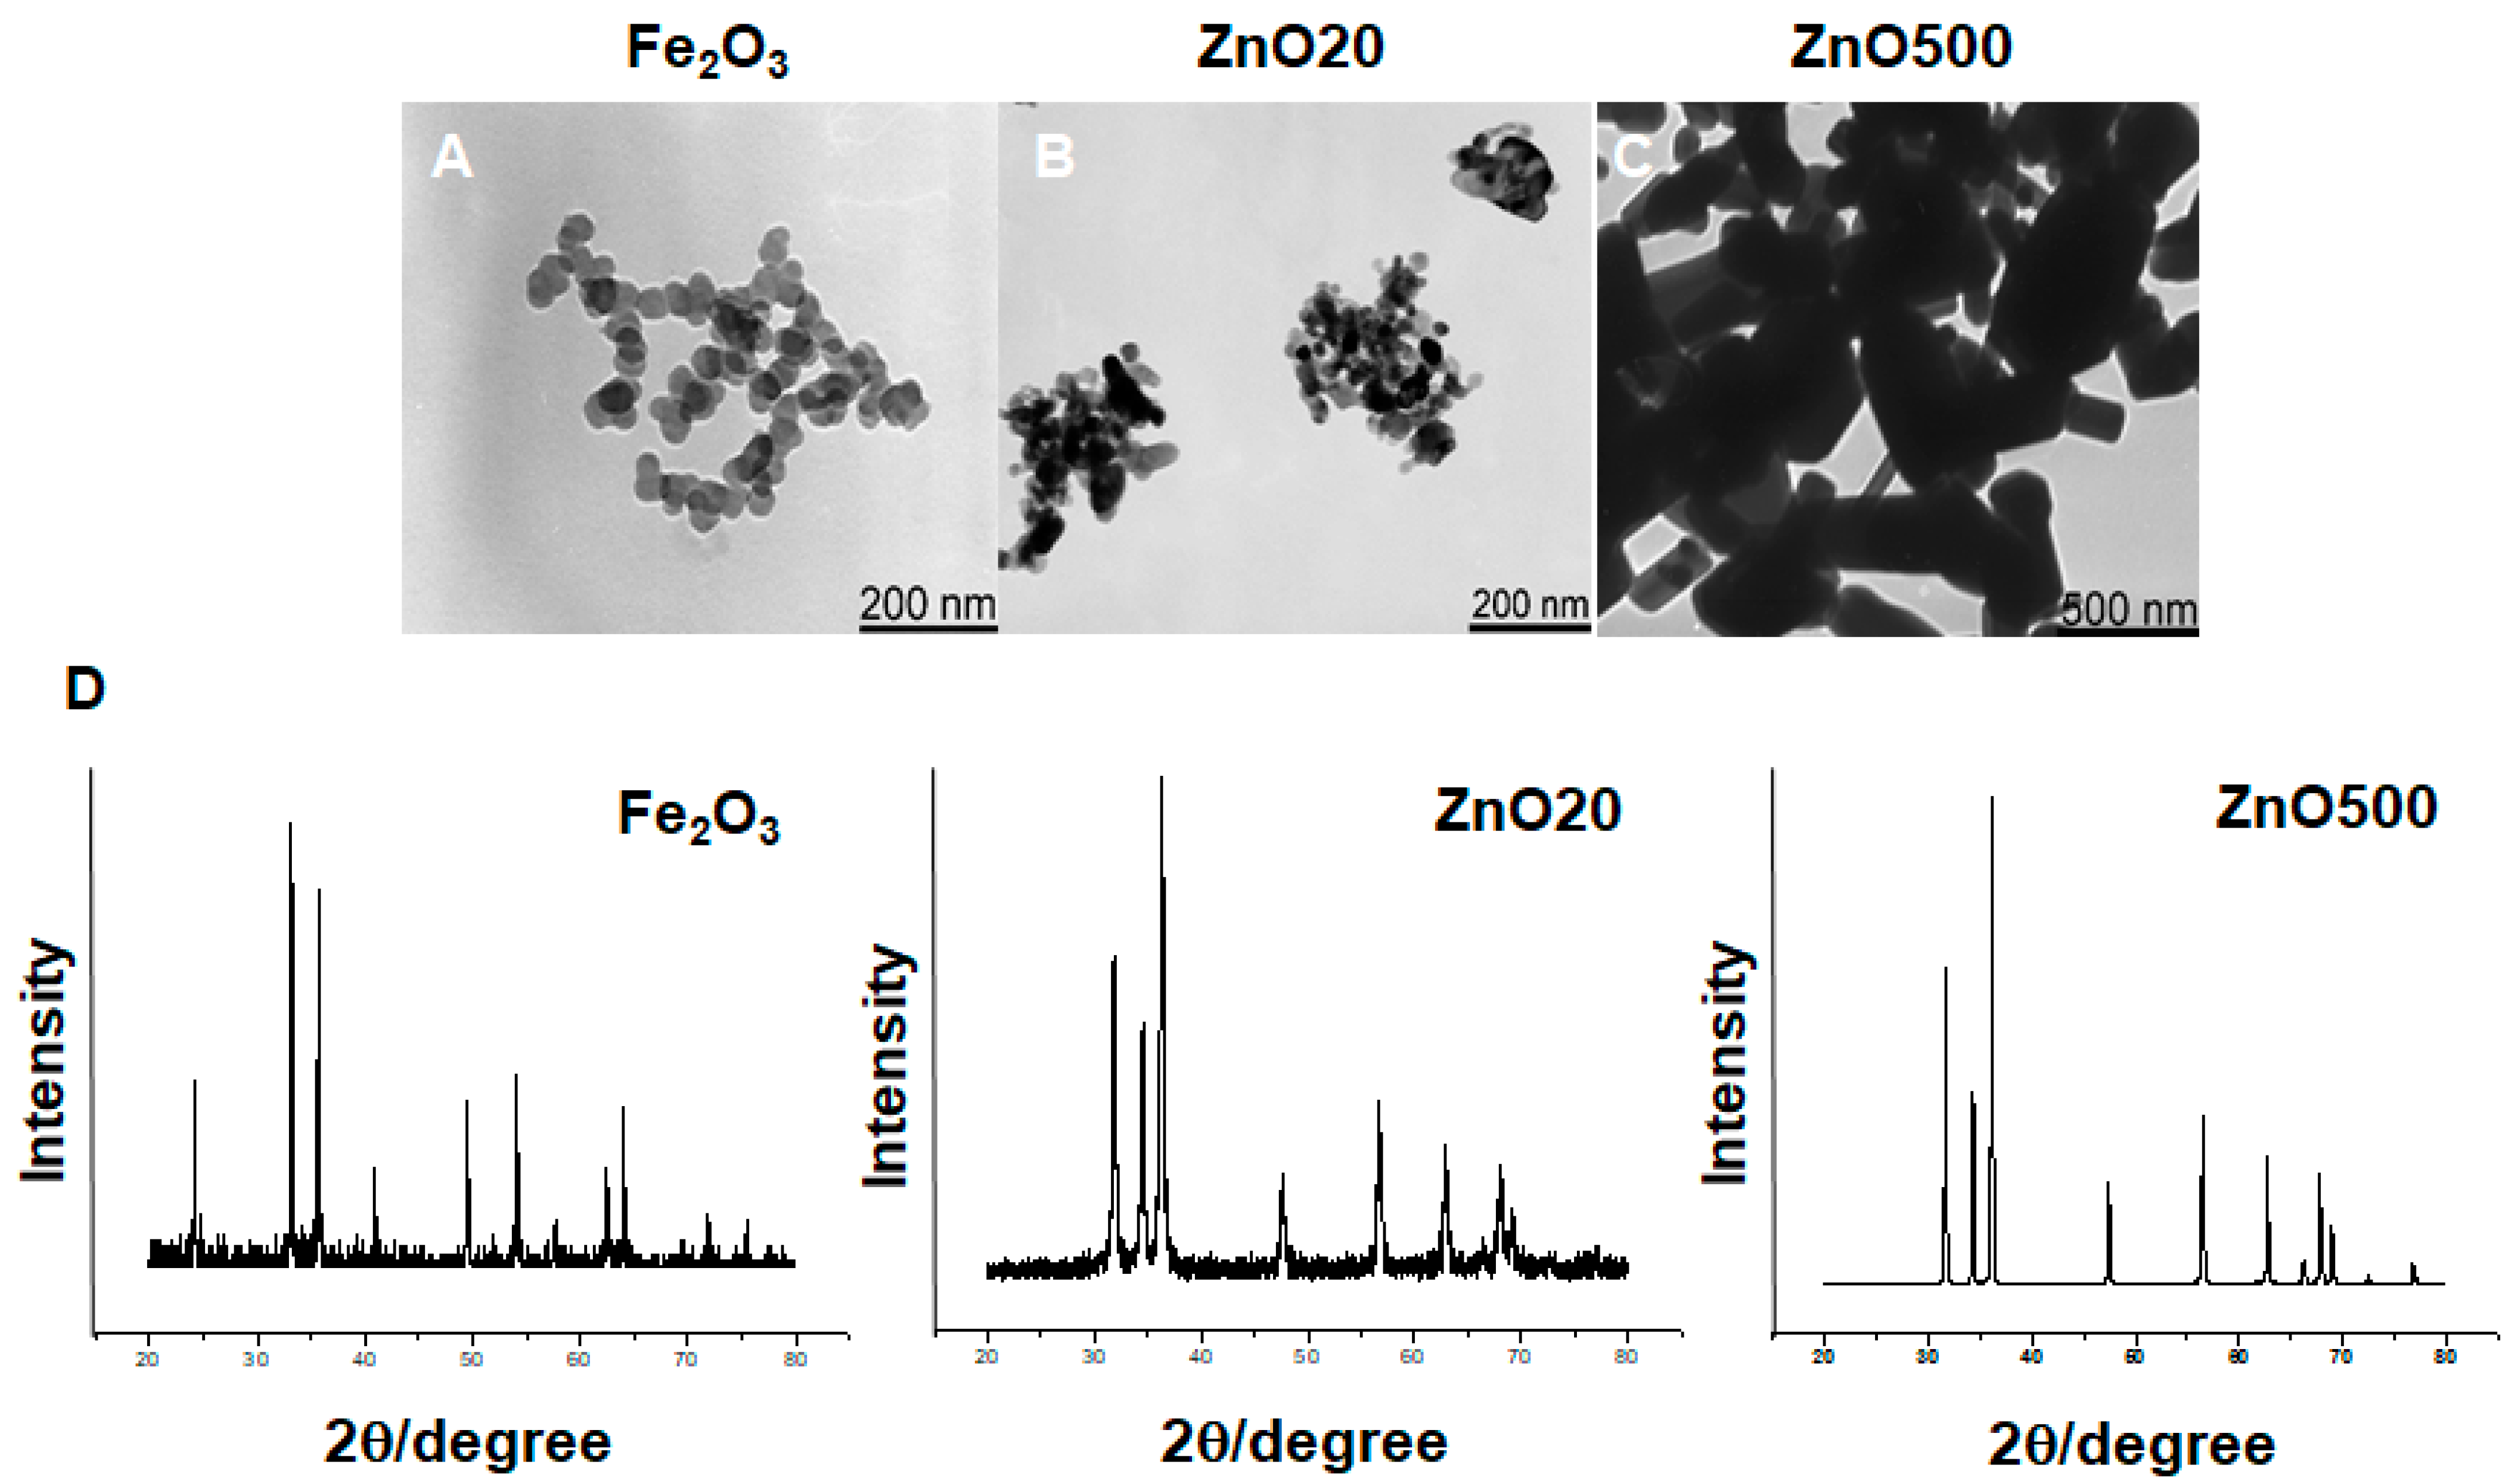
In Table 1, the range of the diameter of the ZnO NPs (20 nm) was between 15 and 30 nm, and the length range was between 20 and 40 nm. The purity was 99.9 wt%. The specific surface area was 31.5 m2⋅g−1. The crystalline structure was a zincite phase crystal. Figure 1B shows representative transmission electron microscopy images of 20-nm ZnO NPs. The characterization results of the Fe2O3 NPs and the ZnO NPs (500 nm) are shown in Table 1 and Figure 1.

Table 1.
The characterization results of Fe2O3 NPs, 20-nm and 500-nm ZnO NPs (the data of Fe2O3 and 500-nm ZnO NPs are from the literature [25]).
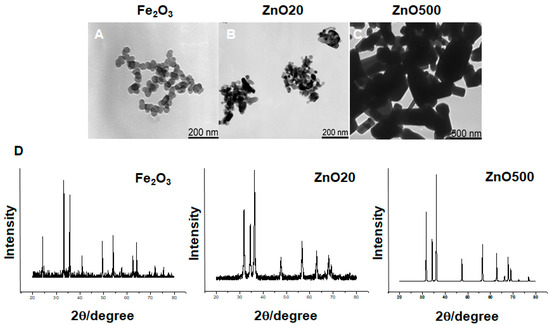
Figure 1.
Representative transmission electron microscopy images and X-ray diffraction spectra of Fe2O3 nanoparticles (NPs), 20-nm zinc oxide (ZnO) NPs, and 500-nm ZnO NPs. (A–C) transmission electron microscopy images; (D) X-ray diffraction spectra. A and B: bar 200 nm; C: bar 500 nm. The TEM images and X-ray diffraction spectra of Fe2O3 NPs and 500-nm ZnO NPs are from the literature [25].
3.2. Toxic Effects of 20-nm ZnO NPs
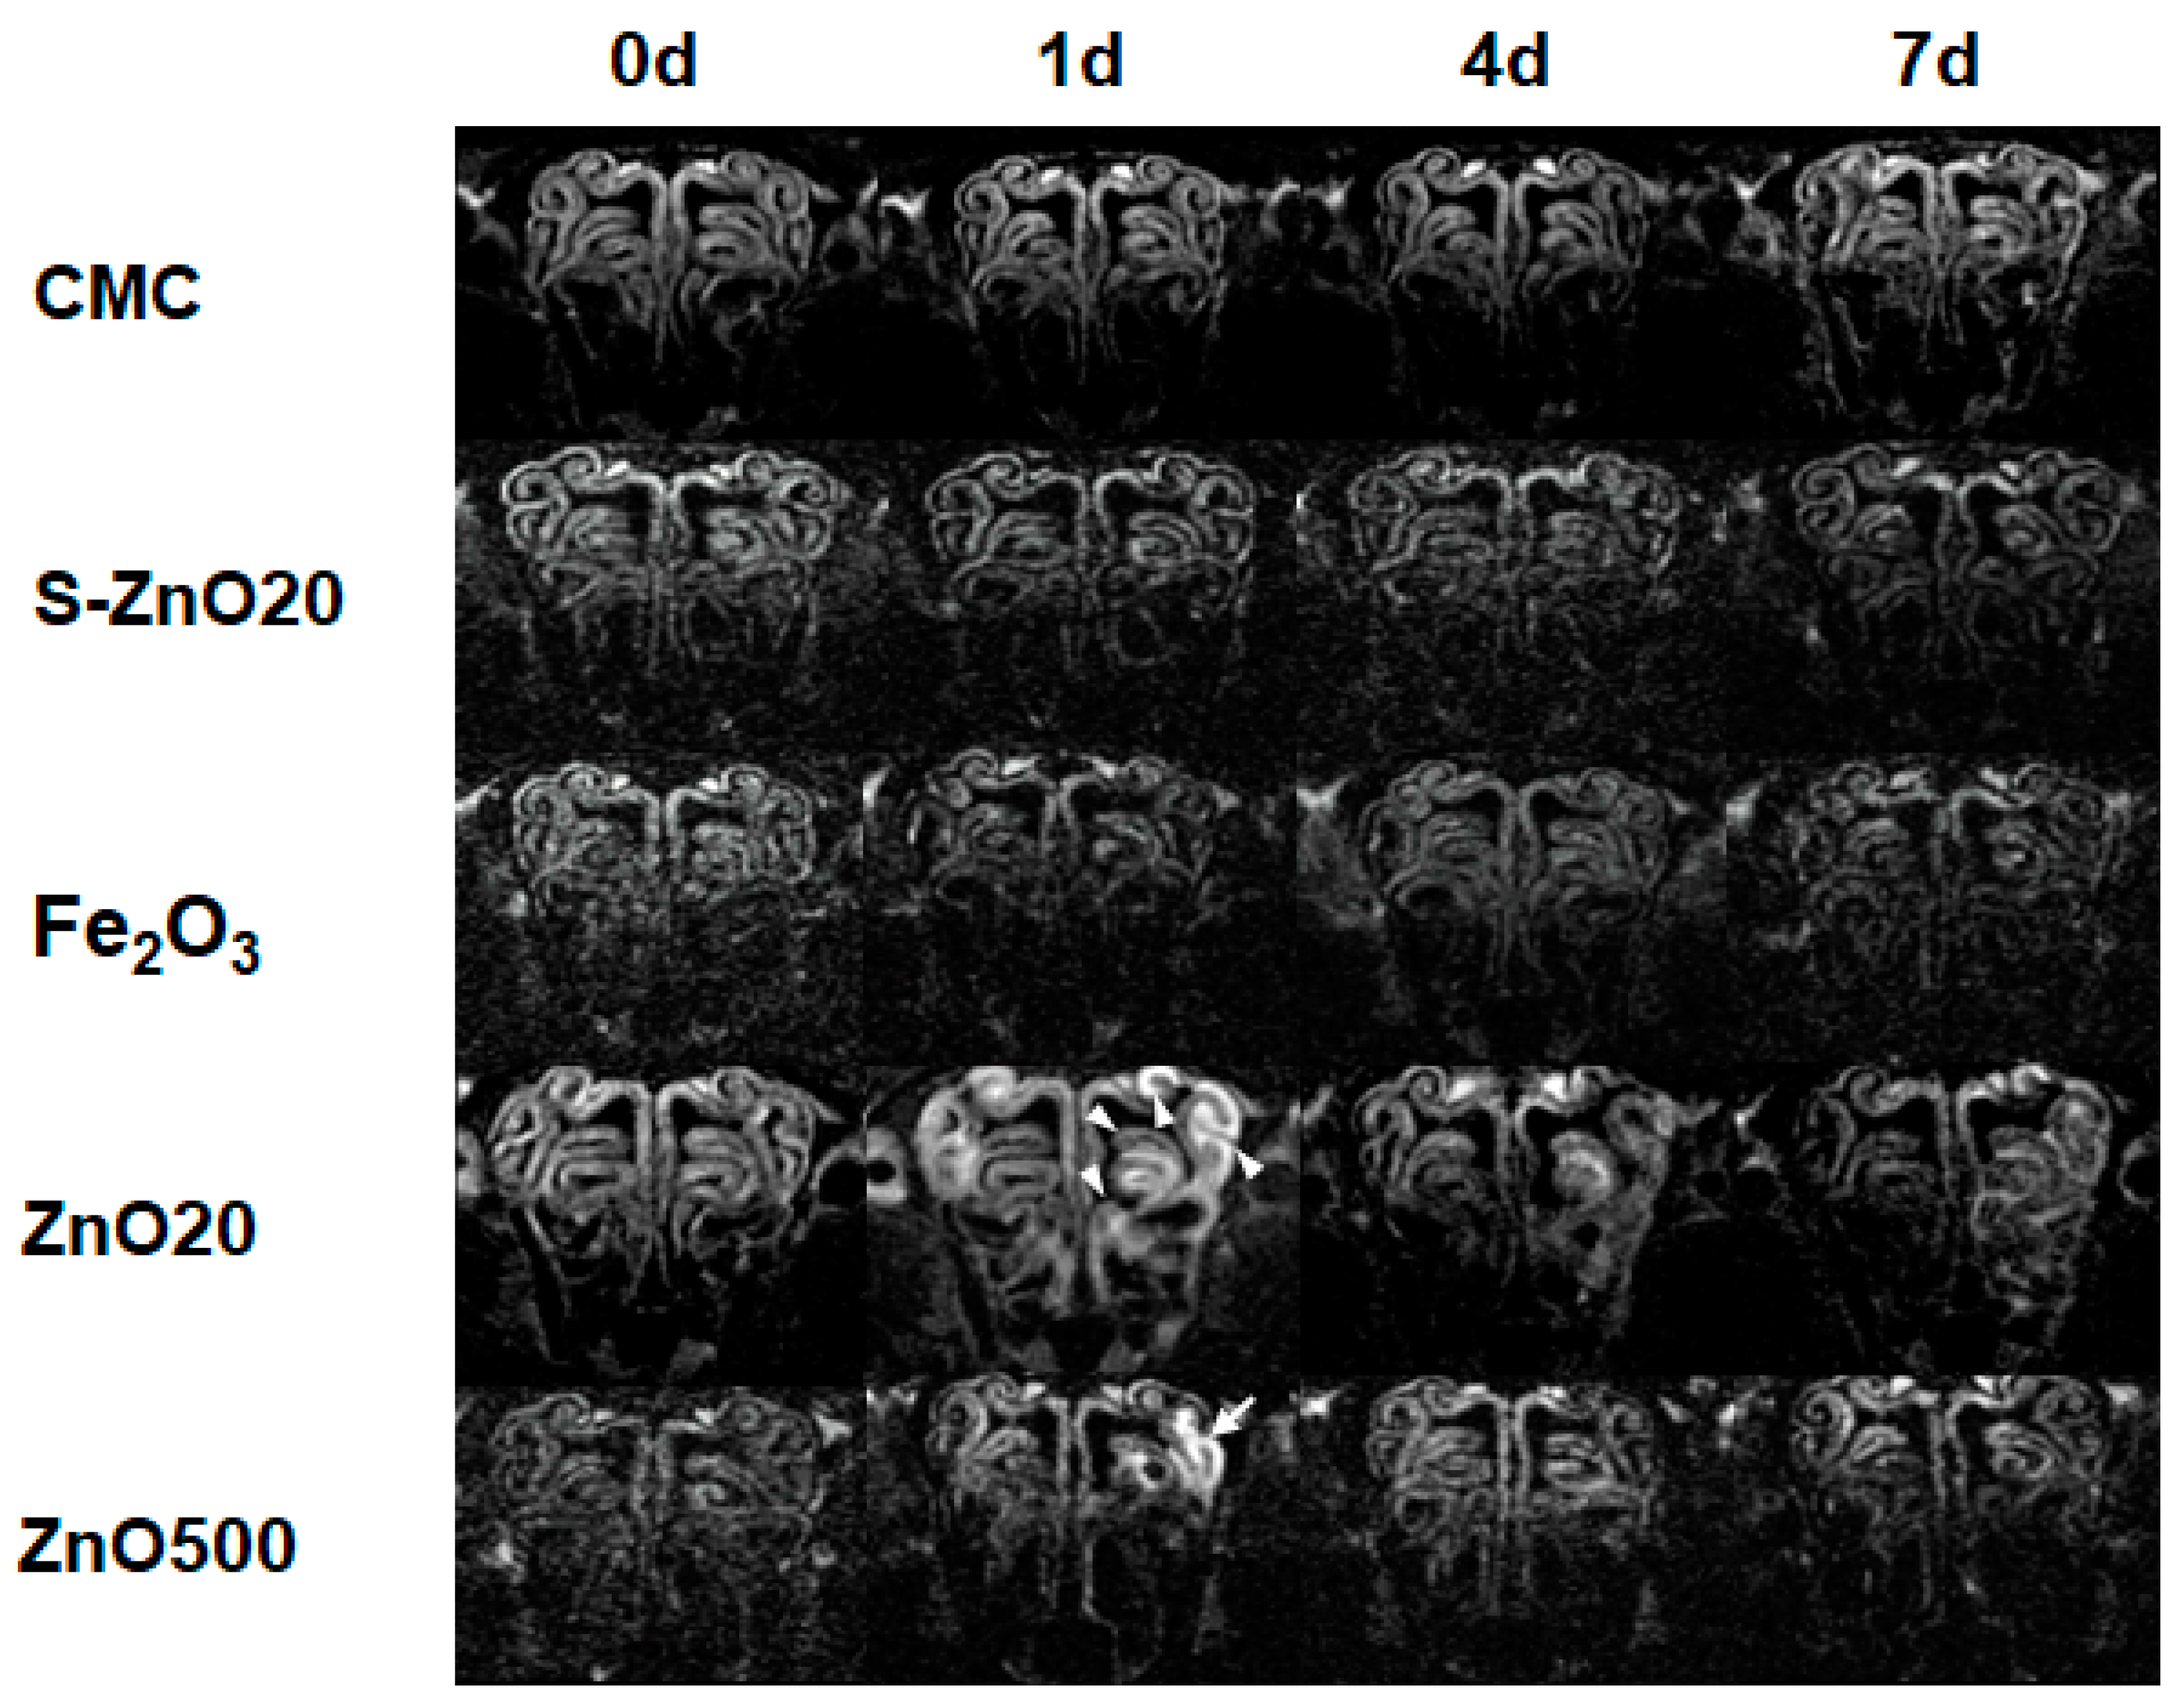
T2-weighted images of the OE are shown in Figure 2. At 1 d, 4 d, and 7 d after intranasal exposure, the rats instilled with CMC, S-ZnO20, and Fe2O3 exhibited no evident abnormities in the OE compared to before the treatment (0 d). At 1 d, the rats treated with ZnO20 occasionally exhibited hyperintensity in areas of the OE in the bilateral turbinates, which can be explained by the septal window connecting two sides of the nasal cavity. The regions with hyperintensity were visible at 4 d and 7 d after the exposure to ZnO20. At 1 d, compared with the rats instilled with ZnO20, those treated with ZnO500 exhibited less-pronounced edema in OE. Edema was less apparent on T2-weighted images at 4 d and 7 d after the exposure to ZnO500.
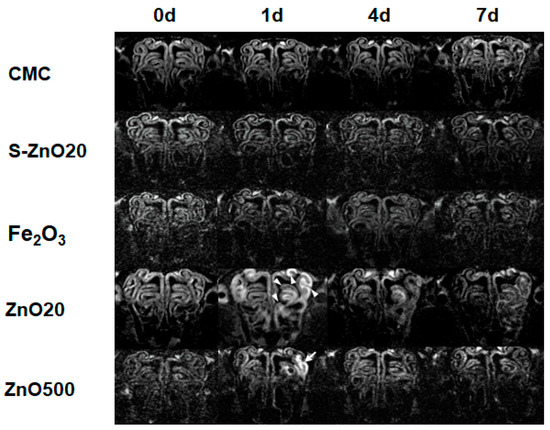
Figure 2.
T2-weighted images of the OE before (0 d) and at 1, 4, and 7 days after exposure to CMC, S-ZnO20, Fe2O3, ZnO20, and ZnO500. The white arrow indicates the bright signal in the turbinate at 1 d in the ZnO20 group, while the white arrowhead marks the bright signal in the turbinate at 1 d in the ZnO500 group, suggesting different extents of edema.
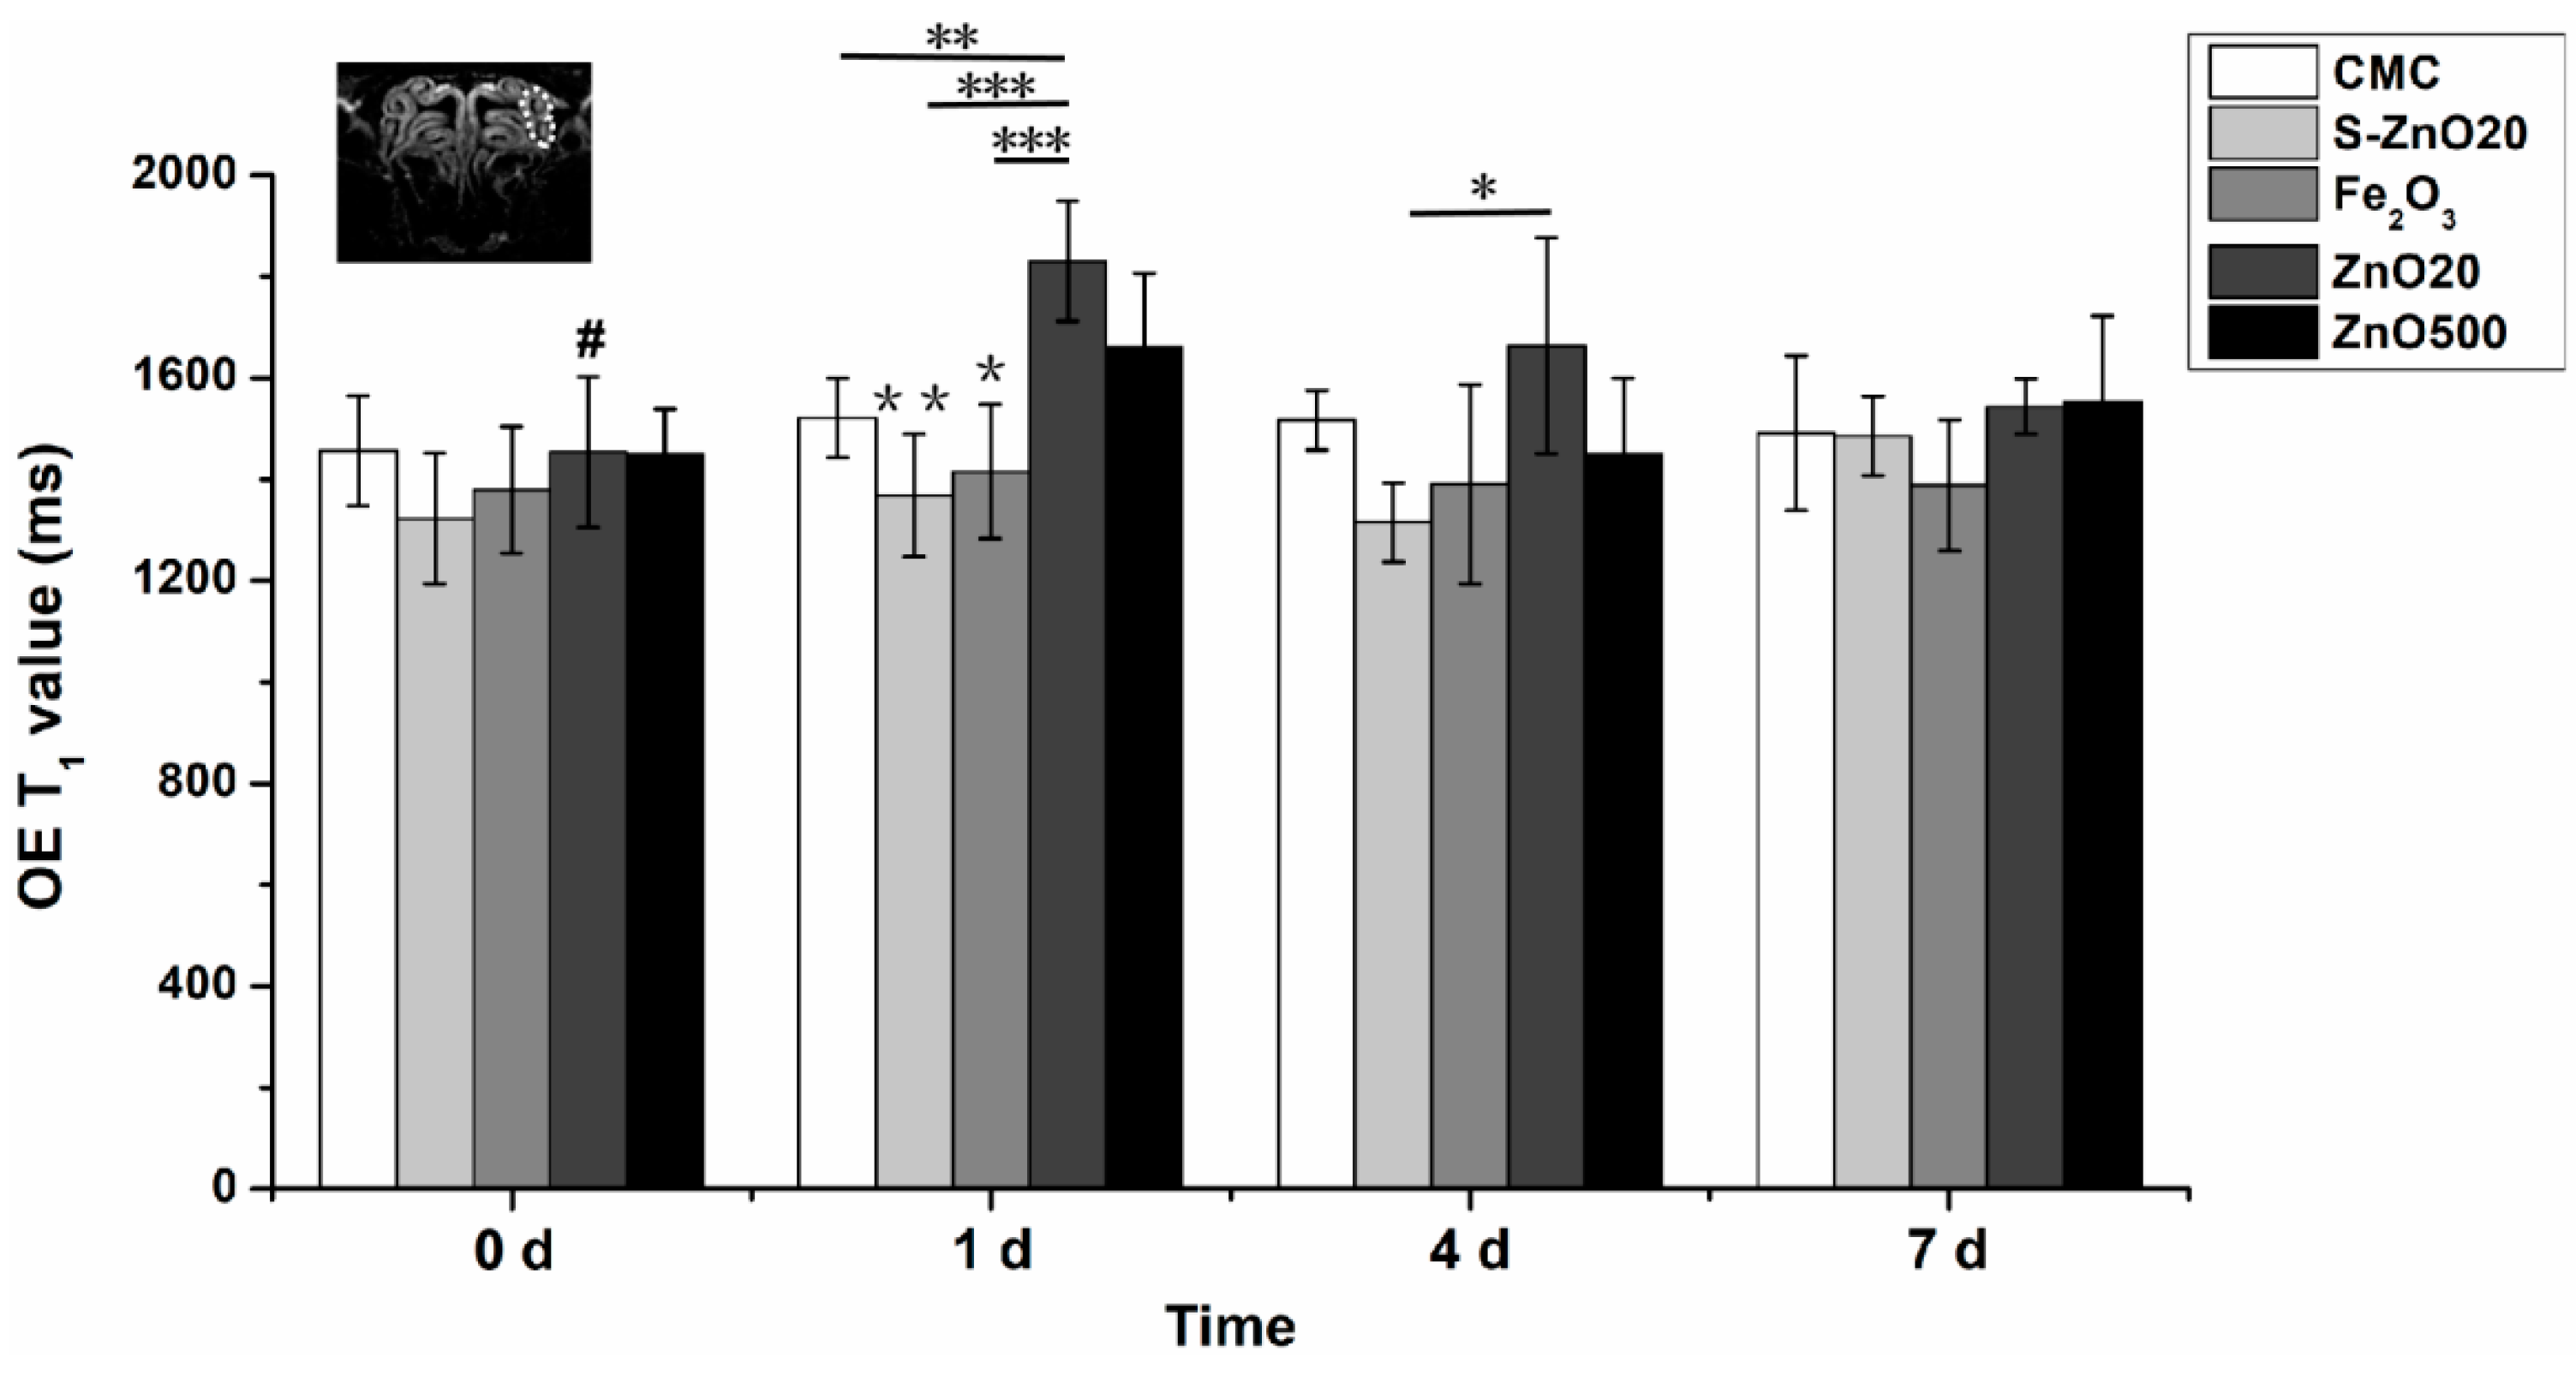
Figure 3 shows the T1 relaxation time (T1 value) changes in the ectoturbinate 2 of the instilled side of the OE in the CMC, S-ZnO20, Fe2O3, ZnO20, and ZnO500 group rats over time.
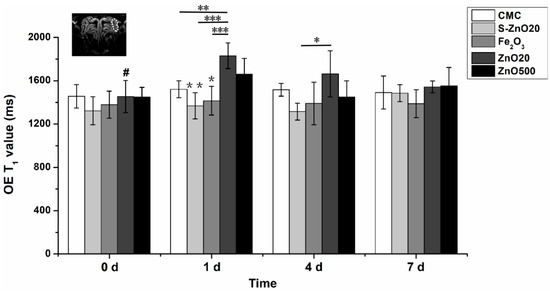
Figure 3.
Histogram graph showing the T1 relaxation time (T1 value) of the region of interest (ROI) in the olfactory epithelium (OE) before (0 d) and after intranasal instillation in each group of rats. The white dashed line indicates the ROI in the ectoturbinate 2 of the OE in the CMC group. At 1 d, in the ZnO20 group, the T1 value of the ROI significantly increases compared with its baseline at 0 d (#, p = 0.003), which is significantly higher than that of the CMC, S-ZnO20, and Fe2O3 groups, respectively (**, p < 0.005, ***, p < 0.001). At 1 d, the T1 value in the ROI of the ZnO500 group is significantly higher than that of the Fe2O3 and S-ZnO groups, respectively (*, p < 0.05; **, p < 0.01). At 4 d, the T1 value of the ZnO20 group is significantly higher than that of the S-ZnO20 group (*, p < 0.05).
Two-way ANOVA revealed that the main effects of time, group, and time × group interaction were statistically significant for T1 value. At 1 d, the T1 value of the ZnO20 group significantly increased compared to its baseline (0 day) (1830.3 ± 118.5 ms vs. 1453.8 ± 148.6 ms, p = 0.003). It also significantly increased compared to the CMC group (vs. 1521.67 ± 78.2 ms, p < 0.005), S-ZnO20 group (vs. 1368.6 ± 121.3 ms, p < 0.001), and Fe2O3 group (vs. 1415.7 ± 132.4 ms, p < 0.001) at 1 d, respectively. There was a trend of a rise in the OE’s T1 value in the ZnO20 group relative to that in the ZnO500 group. After that, the T1 value of the ZnO20 group gradually decreased to 1664.3 ± 213.5 ms at 4 d and 1543.7 ± 54.7 ms at 7 d, respectively. At 4 d, the T1 value of the ZnO20 group was higher than that of the S-ZnO20 group (1664.3 ± 213.5 ms vs. 1314.8 ± 78.0 ms, p < 0.05). In the ZnO500 group at 1 d, a significant T1 value increase was seen compared to the Fe2O3 group (1661.2 ± 145.8 ms vs. 1415.7 ± 132.4 ms, p < 0.05) and S-ZnO20 (vs. 1368.6 ± 121.3 ms, p < 0.01), respectively. An upward trend was shown compared to its baseline (0 day) (vs. 1450.7 ± 88.2 ms). Then, the T1 value of the ZnO500 group returned to the normal level.
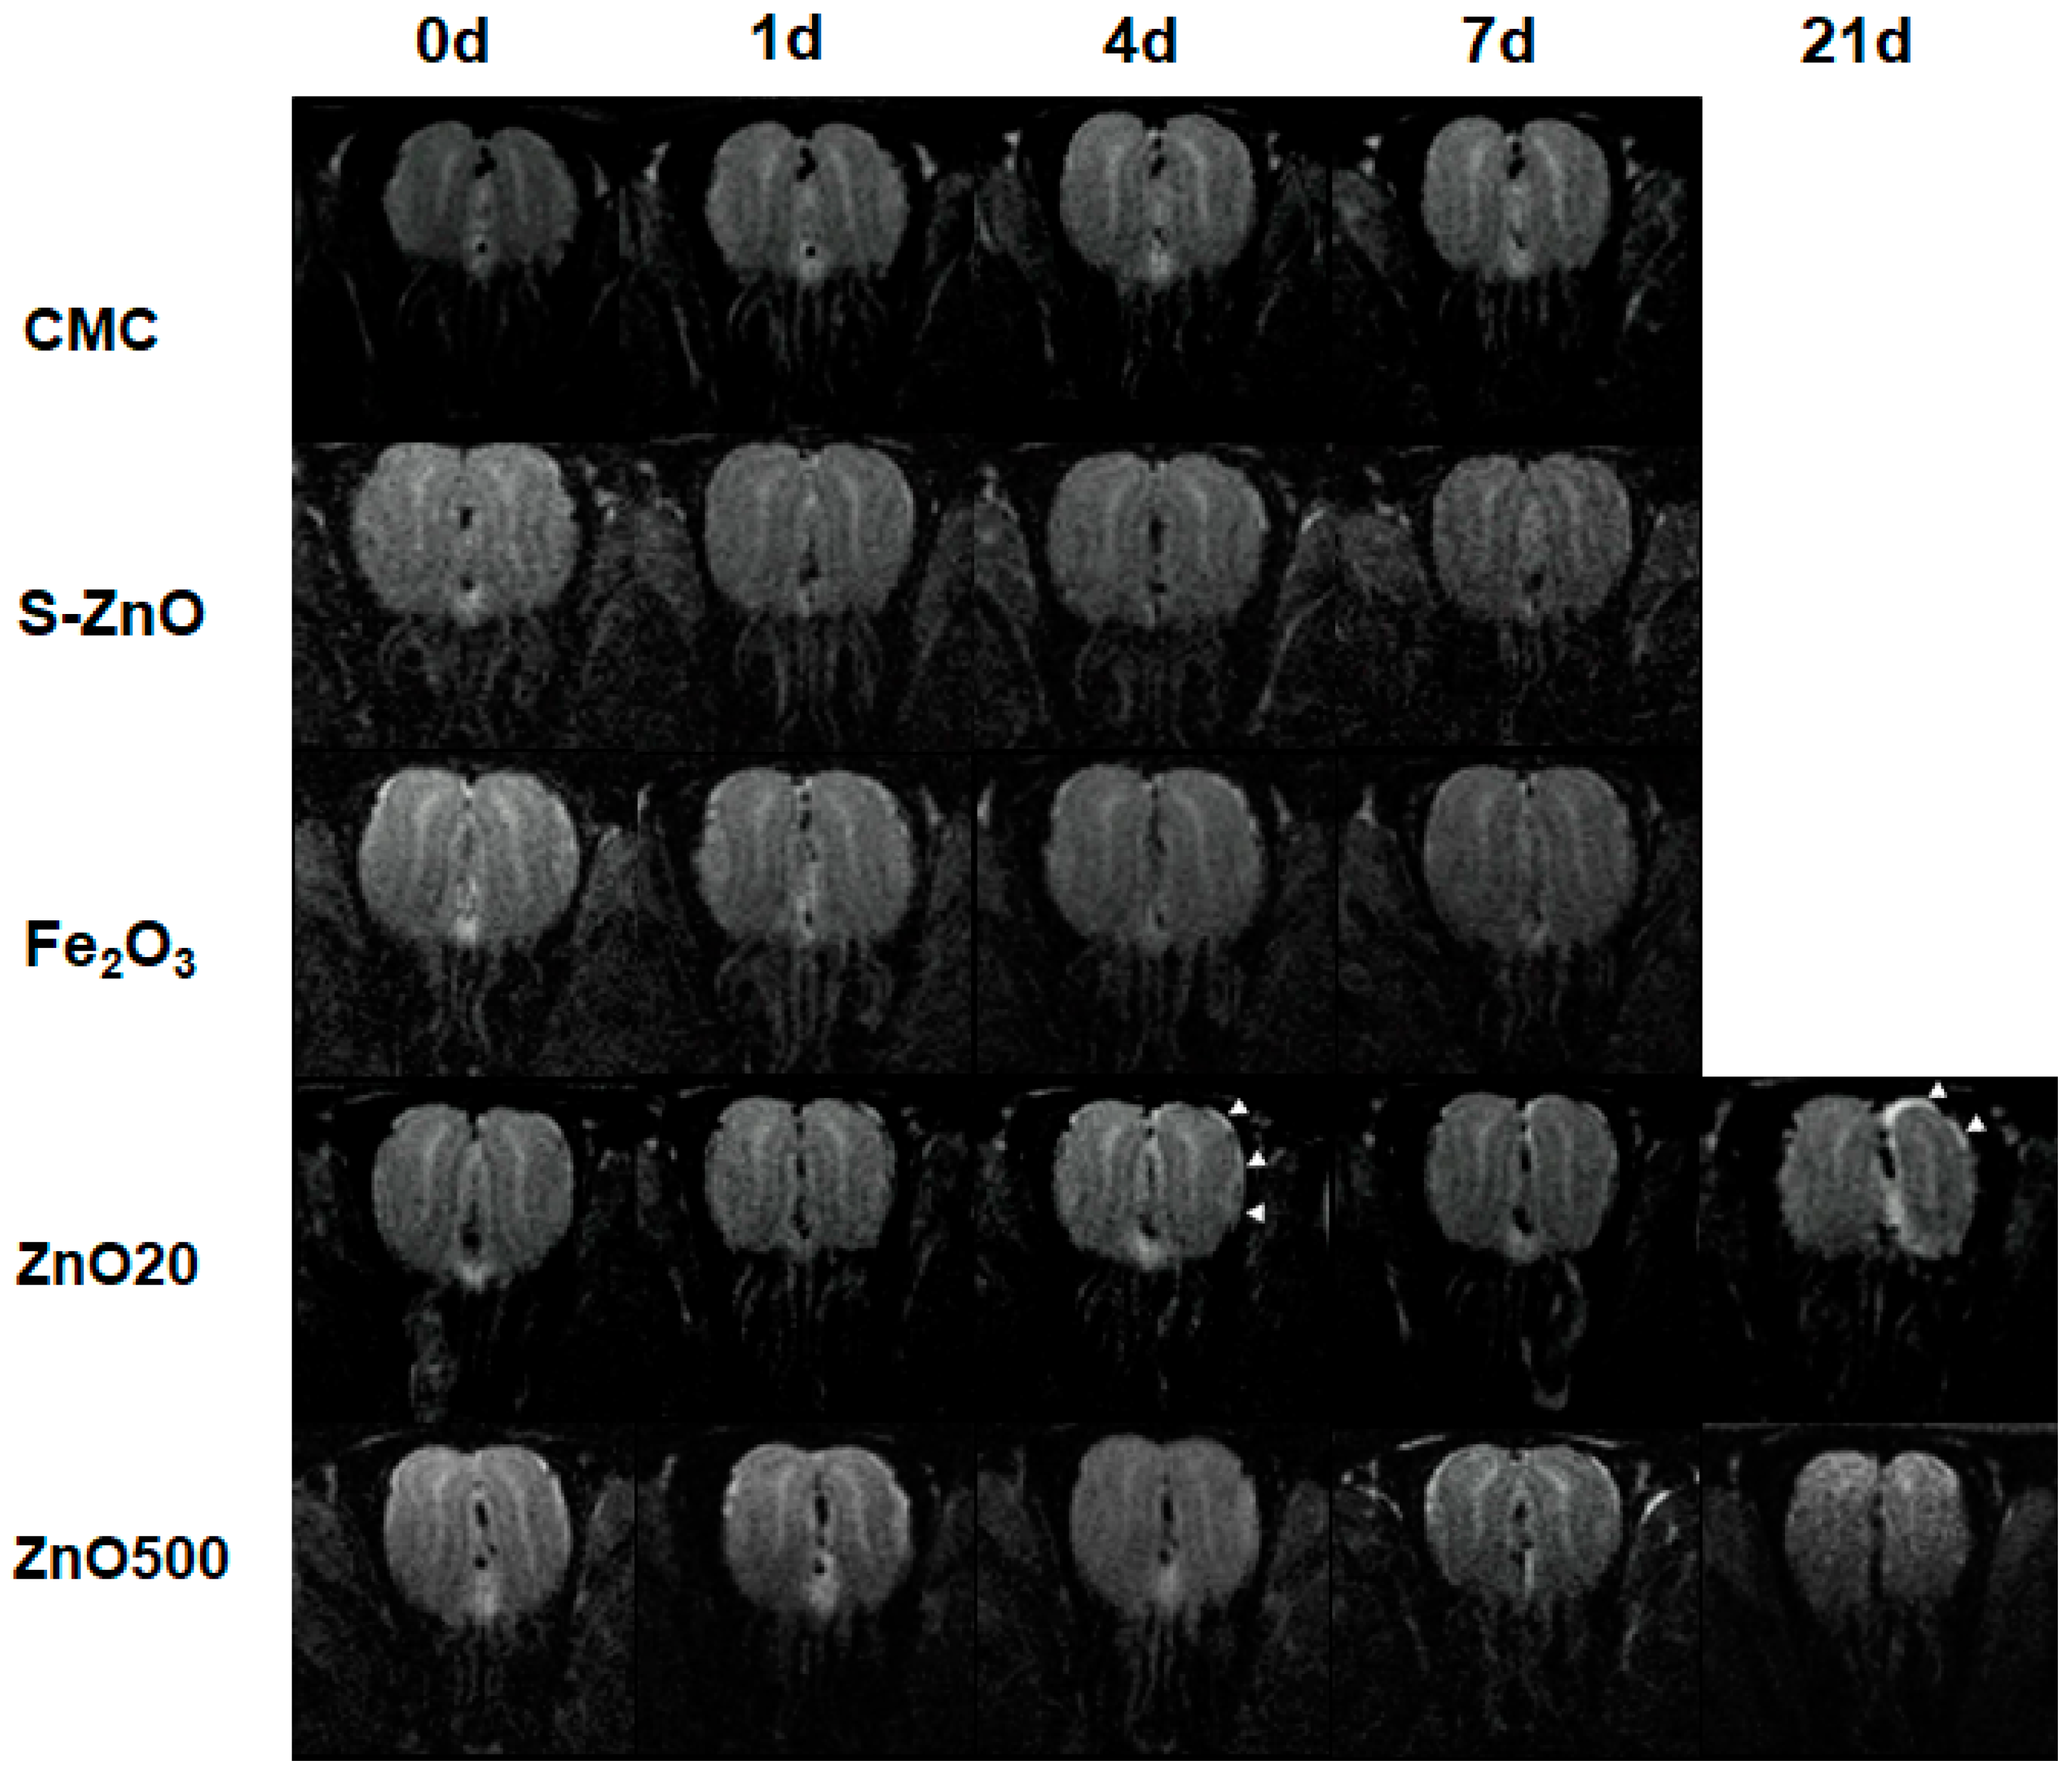
Figure 4 shows the T2-weighted images of the OB in one representative rat from the CMC, S-ZnO20, Fe2O3, ZnO20, and ZnO500 groups at each time point before and after intranasal instillation. At 4 d, bright signal intensity was shown in the ZnO20 group along part of the lateral and dorsal borders of the treated OB, which became more pronounced at 21 d. Transient bright signal intensity on the lateral border in the ZnO500 group was shown at 4 d. However, it returned to a normal level at 21 d. At 21 d, the treated OB size in the ZnO20 group showed a significant decrease compared with left untreated OB, while no apparent shrinkage was observed in the ZnO500 group. The treated OB in CMC, S-ZnO20, and Fe2O3 groups had not shown any changes in T2 signal intensity until 7 d.
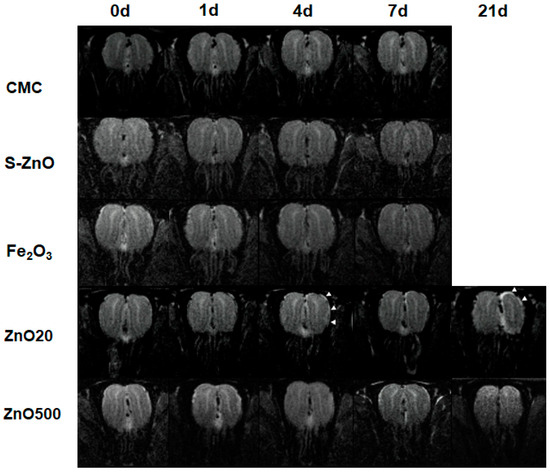
Figure 4.
The T2-weighted image of the olfactory bulb (OB) before and after exposure to CMC, S-ZnO20, Fe2O3, ZnO20, and ZnO500. At 4 d and 21 d, the white arrow indicates the region of high signal intensity along the lateral and dorsal border of the right treated OB in the ZnO20 group, suggesting edema.
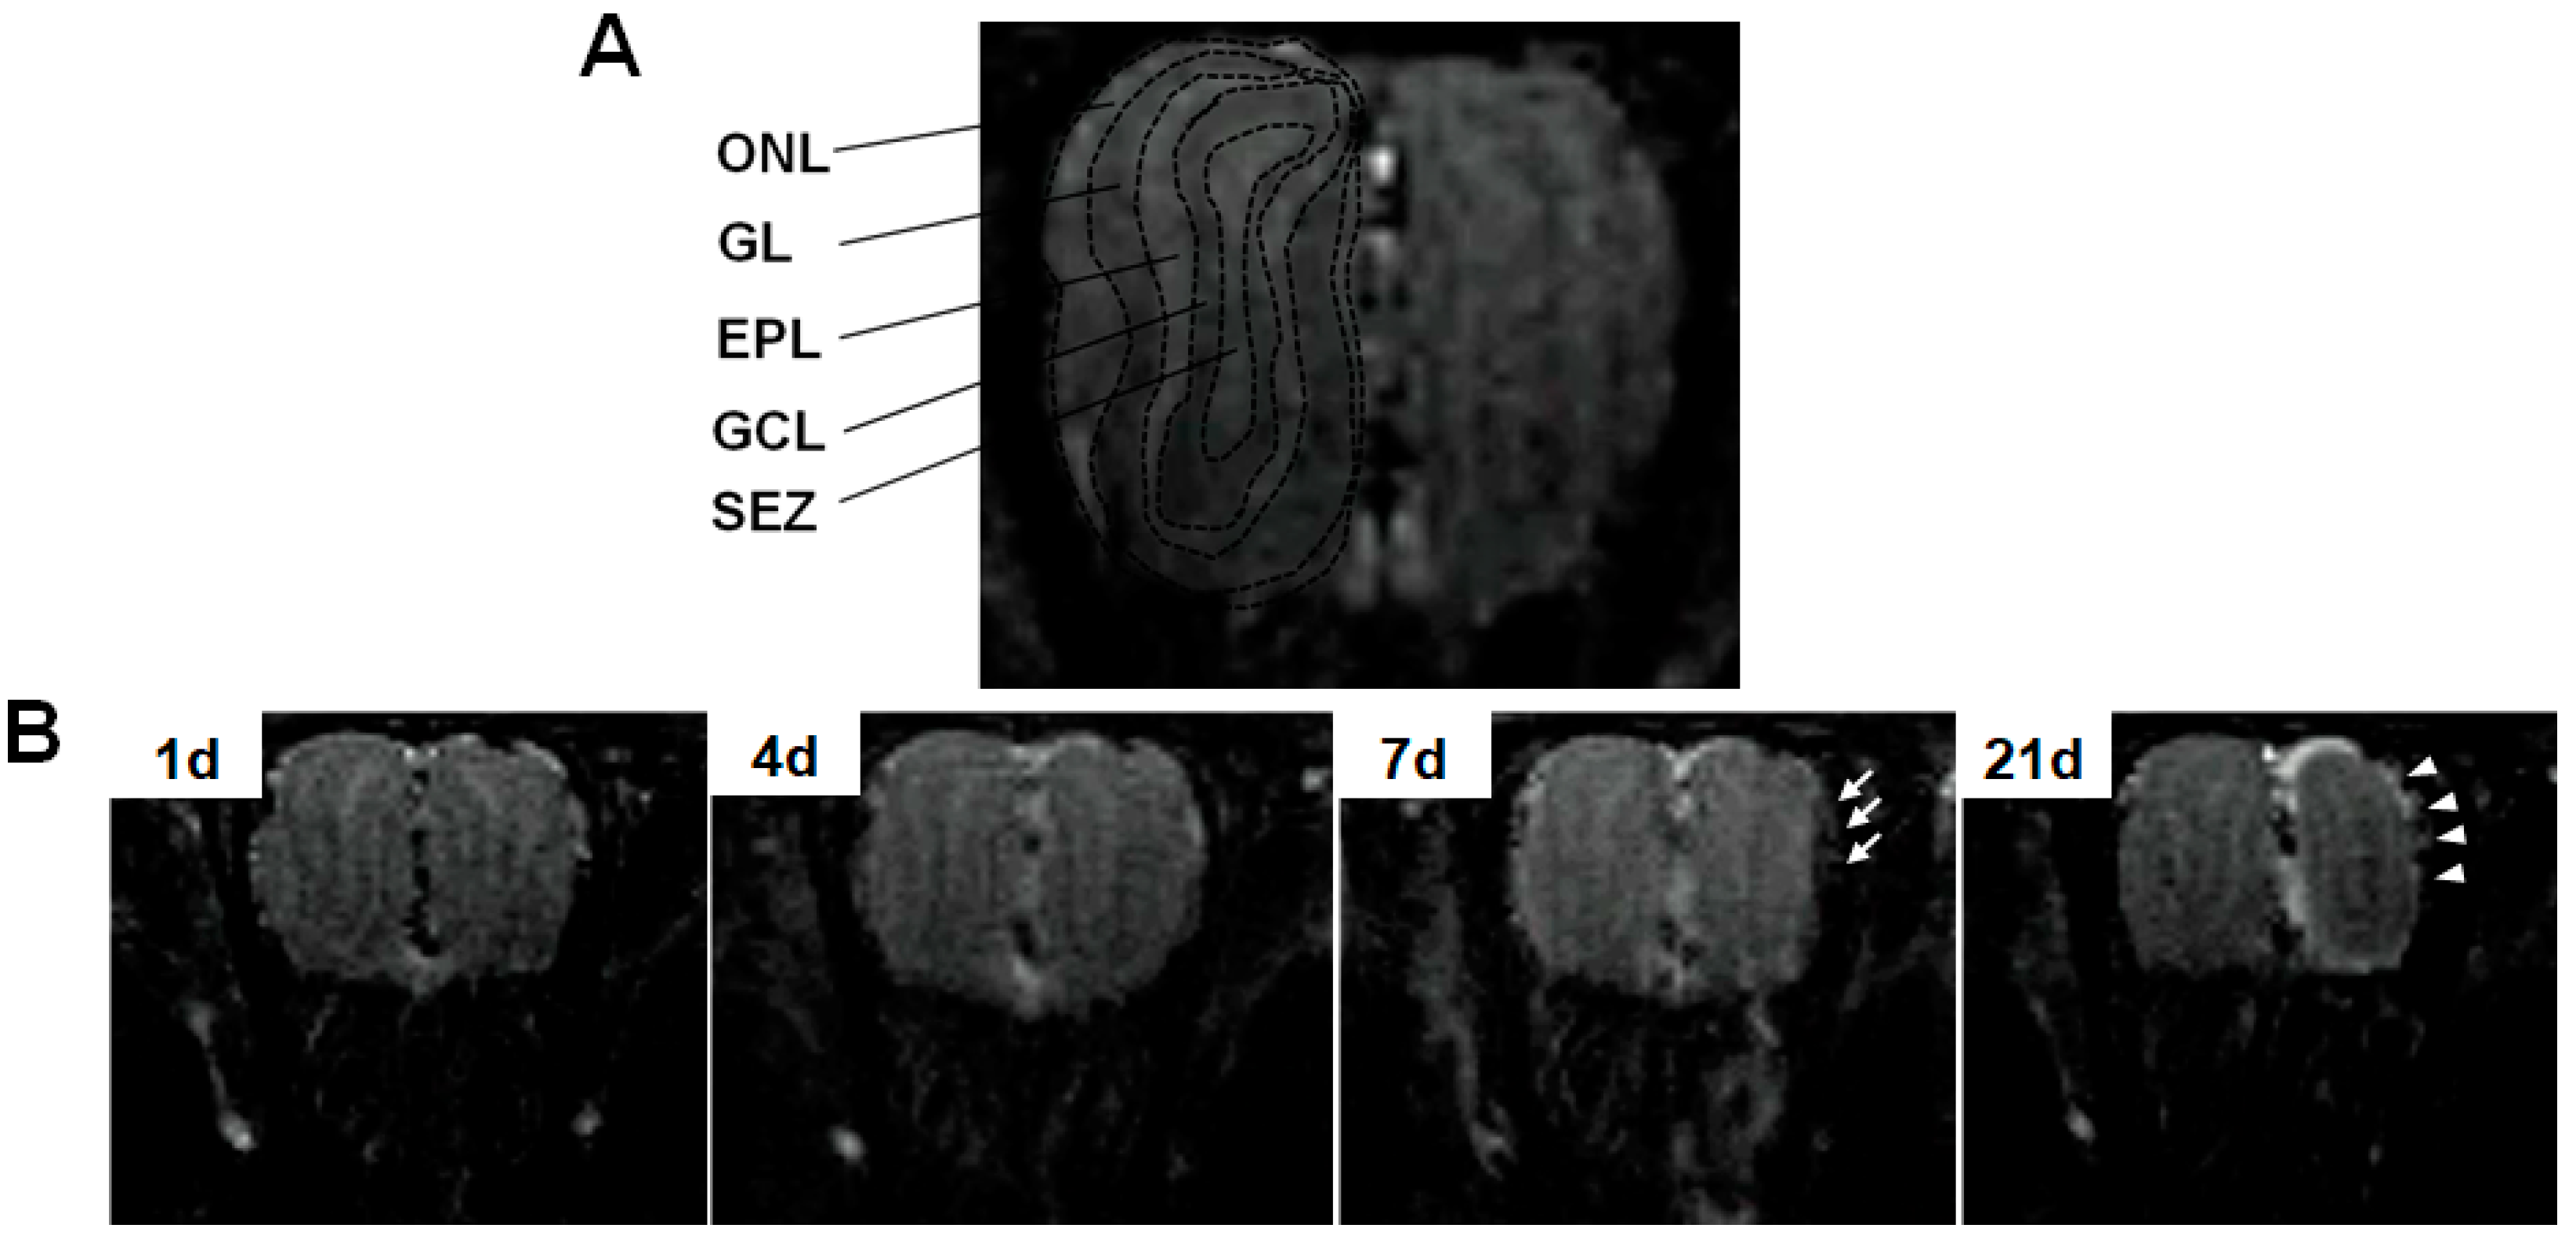
Figure 5 shows the inversion recovery T1-weighted images of the rat OB at 1, 4, 7, and 21 days after intranasal instillation of ZnO20. At 7 d, there was an apparent region of low signal intensity along the lateral border of the instilled side of the OB, indicating tissue edema and inflammation. At 21 d, the instilled side of the OB significantly shrunk compared with the control side, probably due to the thinning of the olfactory nerve layer (ONL) to some extent.
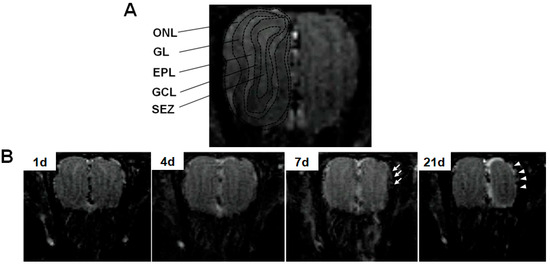
Figure 5.
The inversion recovery T1-weighted images of the rat olfactory bulb (OB). In panel (A), the black dashed line outlines the distinct layer structure of the control side of the OB in the CMC group, from the outer layer to the inner layer, including the ONL (olfactory nerve layer), GL (glomerular layer), EPL (external plexiform layer), GCL (granule cell layer), and SEZ (subependymal zone). In panel (B), the inversion recovery T1-weighted images of the OB in the ZnO20 group at 1 d, 4 d, 7 d, and 21 d are shown. The arrow indicates the region of low signal intensity in the inversion recovery T1-weighted image on the instilled side, and the arrowhead reveals the thinning of the ONL.
3.3. Structural Changes of the OE and OB
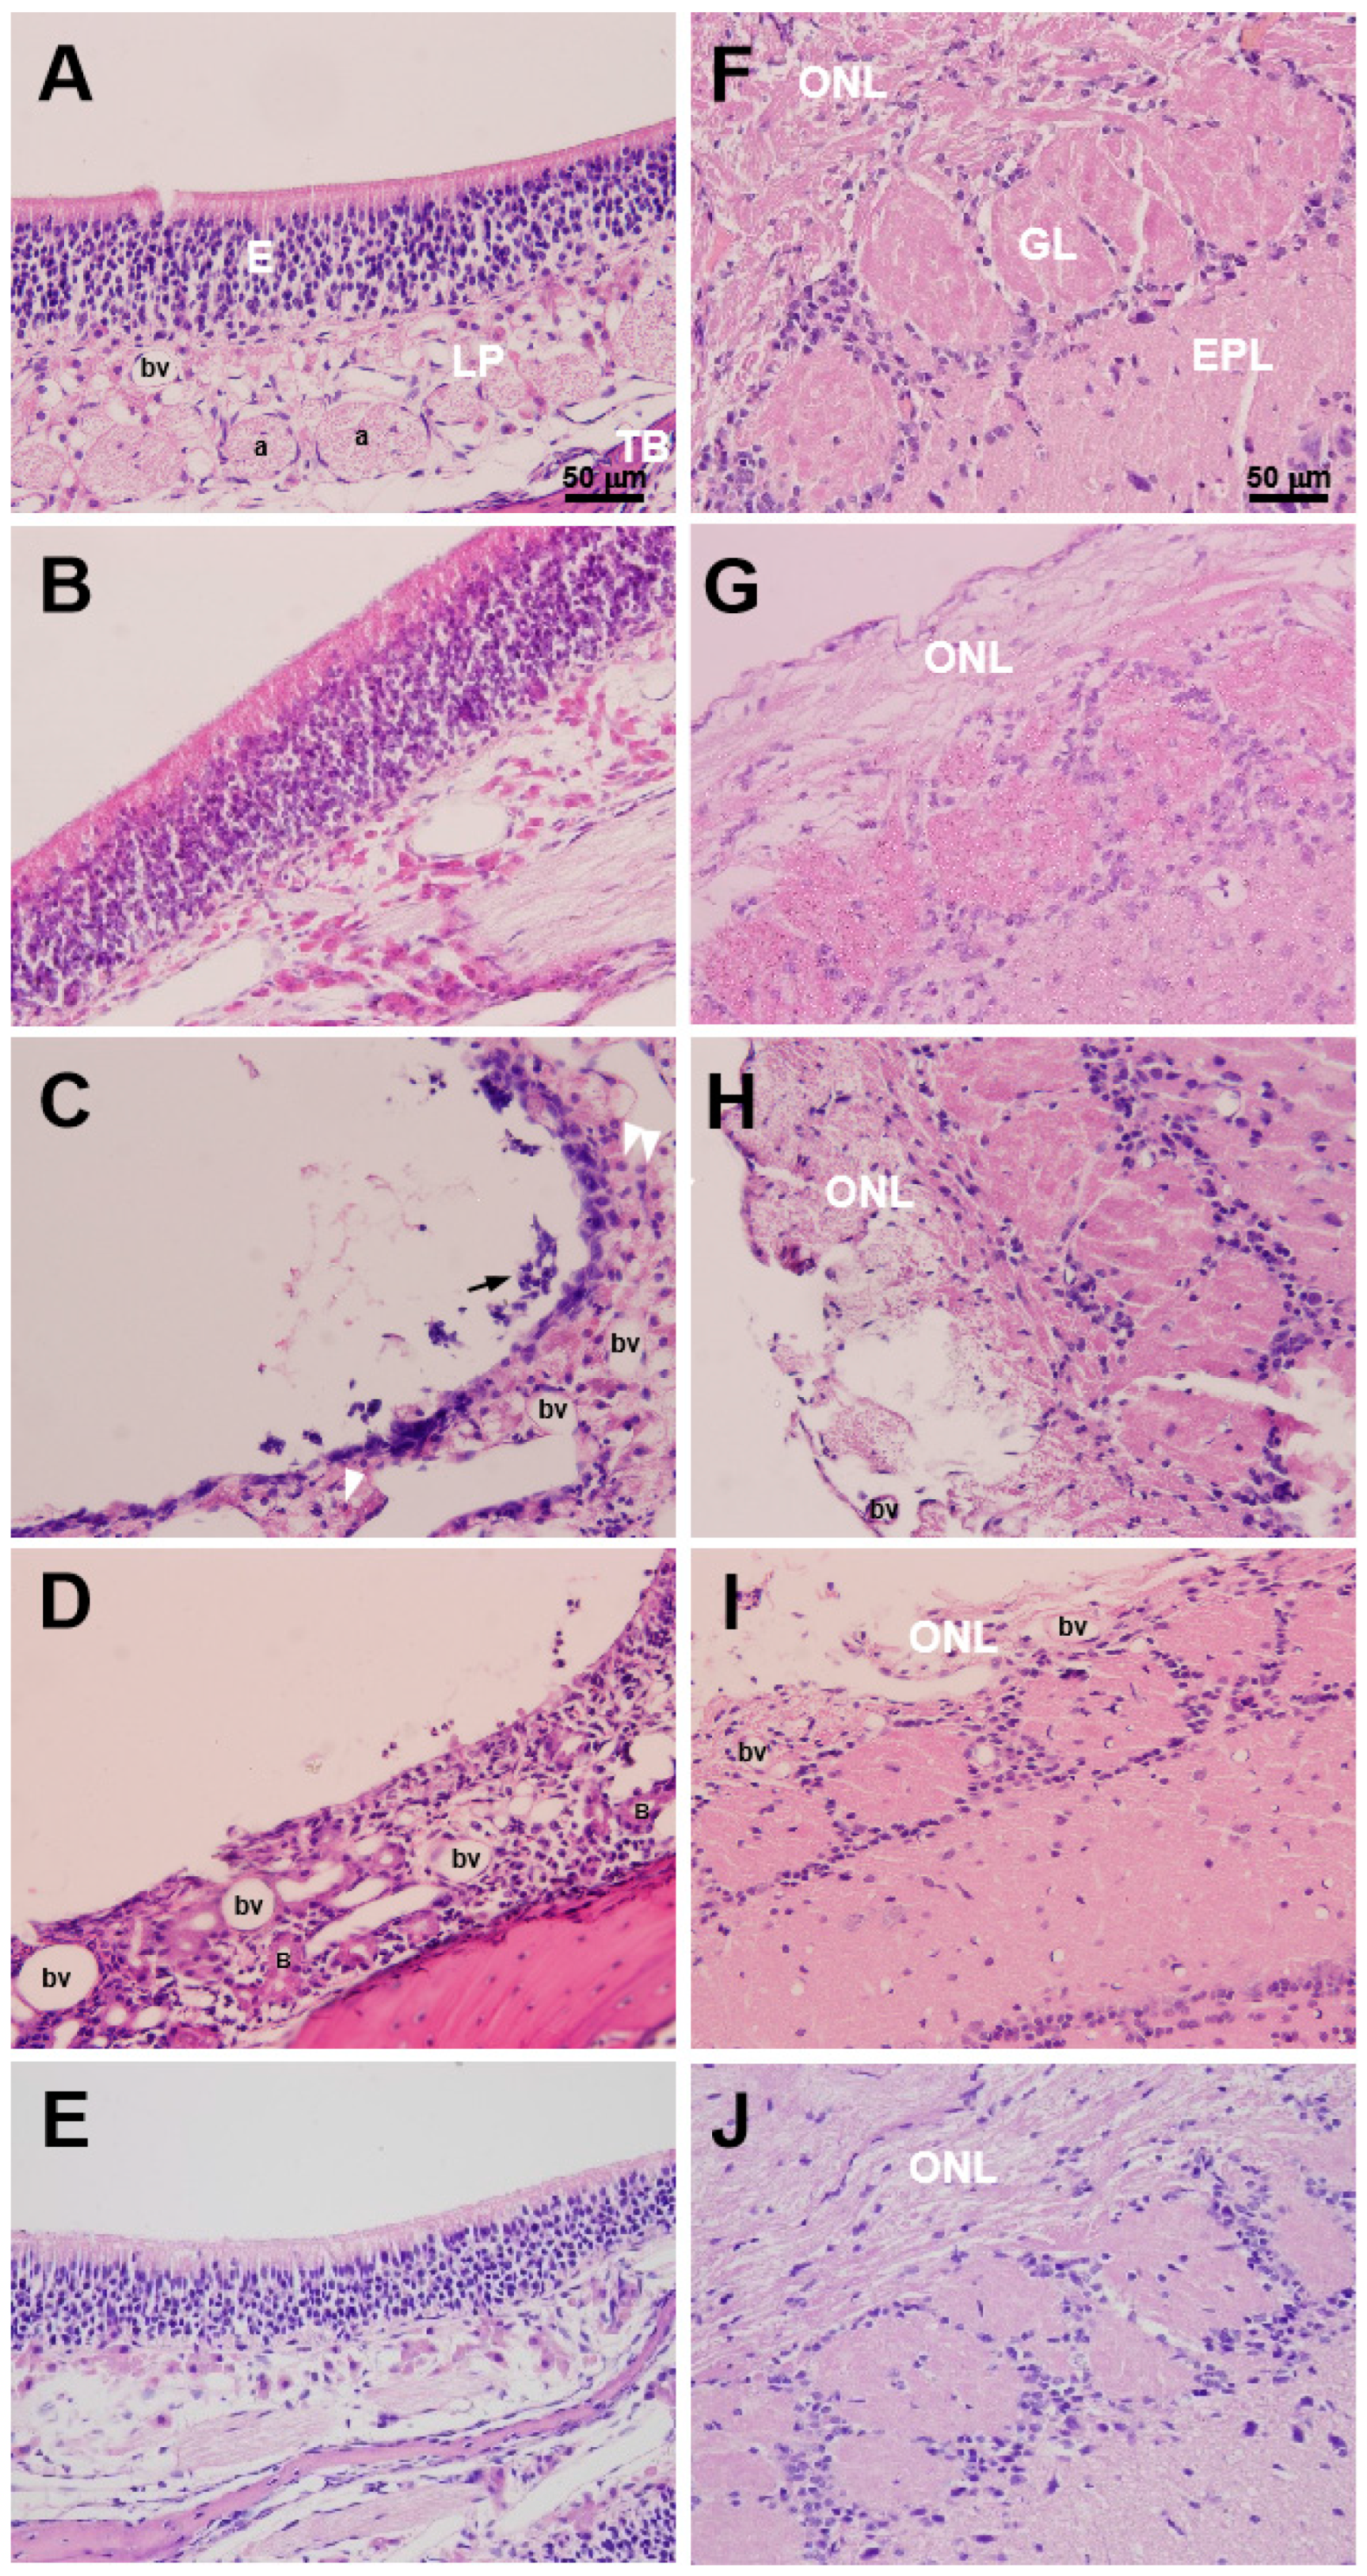
In Figure 6, cellular damage and inflammation in OE, as well as olfactory nerve fiber losses in OB, are induced by 20-nm ZnO NPs. The normal structure of the OE in the CMC-treated rat is presented in Figure 6A, which is composed of epithelial cells (E), lamina propria (LP), and turbinate (TB). The olfactory axons penetrate and terminate in the olfactory glomeruli after traveling across the surface of the OB, which constitute the ONL (Figure 6F). The ZnO20 group showed an acute inflammatory cell infiltration in the OE at 1 d, with disorganized epithelial cells, accompanied by the disappearance or reduction of olfactory axons. At 22 d, it was likely an epithelial cell reproduction originating from the LP, indicating a recovery state of the injured OE. A vacuole was apparent in the ONL on the lateral OB as early as 1 day after the treatment. By 22 days after the treatment, the olfactory axons no longer formed an intact layer, and the thickness of the ONL was thinner than before. The blood vessels in the OE and OB of the ZnO20-treated rats were significantly dilated, suggesting increased vascular permeability due to inflammatory reactions. At 22 d, the hematoxylin–eosin staining results of the OE and OB in both the Fe2O3 and ZnO500 groups illustrated well-organized columnar epithelial cells and the compact structure of the ONL.

Figure 6.
The hematoxylin–eosin staining images of rat olfactory epithelium (OE) and olfactory bulb (OB) after exposure to CMC, Fe2O3, ZnO20, and ZnO500. (A–E) represent the stainings of the OE at 1 d after exposure to CMC, at 22 d after exposure to Fe2O3, at 1 d and 22 d after exposure to ZnO20, and at 22 d after exposure to ZnO500, respectively. (F–J) represent the correspondent stainings of OB. The white arrowheads mark infiltrated phagocyte cells, and the black arrow points out the cellular debris in (C). TB: turbinate; LP: lamina propria; E: epithelial cells; a: bundles of olfactory axons; bv: blood vessel; ONL: olfactory nerve layer; GL: glomerular layer; EPL: external plexiform layer (bar: 50 µm).
4. Discussion
The main findings of this study are that the qualitative and quantitative analysis on the OE and OB in rats using MRI and combined with histopathological examination confirm that intranasally instilled 20-nm ZnO NPs acutely results in cellular damage and inflammation in the OE, accompanied with edema and atrophy in the OB.
Our experimental results are consistent with the viewpoint of particle size as a major factor influencing the toxic effects of nanomaterials. The size of the NPs makes their movement in the body across cell membranes and normal diffusion barriers possible. We found that 20-nm ZnO NPs caused the most severe damage to the rat OE and OB. Quantitative T1 value measurement illustrated that at 1 d, the T1 value of the OE in the ZnO20 group increased compared to those in all of the other groups at the same time point, which was consistent with the T2-weighted imaging results, suggesting most severe edema [26] in the OE of the ZnO20 group. An obvious low signal intensity was observed in the inversion recovery T1-weighted image on the lateral side of the OB of the ZnO20 group at 7 d, which may mark tissue edema, followed by atrophy at 21 d. The MRI findings were identified via the histological results. Typical pathological features of the OE in the ZnO20 group were structural disorganization of the epithelial cell layer, disappearance or shrinkage of the olfactory axons, and infiltration of inflammatory cells; the OB was characterized by the thinning of the ONL. Changes in vascular permeability induced by inflammatory responses were present in both the OE and OB. For the 500-nm ZnO NPs, the instilled side of the OE and OB did not appear to be very obviously damaged, either from the MRI findings (only a transient olfactory epithelial edema highlight signal was visible on the T2 weighted image) or from the hematoxylin–eosin pathology findings. These results suggest that 20-nm ZnO NPs exert more toxicity responses to the OE and OB than those induced by 500-nm ZnO NPs. The olfactory nerve axon diameter is <200 nm [27], which may be the “threshold” limiting the uptake of particulate matter into the olfactory nerve terminals. Elder et al. [10] found that inhaled 30-nm MnO NPs could enter the OB via the olfactory nerve. Then, there were increases in Mn concentrations in the OB, striatum, frontal cortex, and cerebellum. Tumor necrosis factor-α protein, macrophage inflammatory protein-2, and glial fibrillary acidic protein were also increased in the OB. Bermudez et al. [28,29] found that 20-nm TiO2 NPs induced inflammatory responses and cytotoxicity in rats at a rate 5–10 times higher than 300-nm TiO2 NPs. Our results also found that the smaller the particle size, the more likely they were to cause injury to the OE and OB. Wang et al. [11] reported the TEM results of neurodendron degeneration, membranous structure disruption, and the lysosome increase in the OB after long-term and low-dose intranasal exposure to nano-sized Fe2O3 (21 nm). However, in our study, the MRI results at each time point did not show any signal abnormality in the OE and OB after Fe2O3 NPs exposure, and the hematoxylin–eosin pathology results did not show any significant damage (except for vasodilatation). Therefore, we conclude that Fe2O3 NPs did not cause obvious damage to the olfactory system of the rats in the present experiment. Fe2O3 NP was designed as a negative control in our study because it is classified as insoluble metal oxide. The element-dependent nanotoxicity of metal oxide NPs implies that the Zn element might be the toxicant form. Zn2+ could inhibit cellular energy production by blocking mitochondrial respiration and could even induce neuronal death. Given that ZnO NP is a kind of highly soluble metal oxide, we infer that the releases of zinc ions will rise as the particle size decreases. We suggest that the dissolution should be regarded as a crucial step in producing the toxicity of ZnO NPs.
There are some arguments about the induction of the adverse effects of ZnO NPs. Due to the high solubility of ZnO NPs, some in vitro studies have suggested that ZnO-NP cytotoxicity stems mainly from the release of Zn2+ ions [24,30,31]. However, several studies suggest that particle dependence is another important toxicity mechanism for ZnO NPs [32,33,34,35]. A review discussed that ZnO NP-induced genotoxicity could originate from the release of Zn2+ ions and particle form [36]. Given that the smaller the particles of substances with the same chemical properties are, the greater solubility they have, the [Zn2+] in both the supernatants of the 20-nm and 500-nm ZnO NP-CMC suspensions was measured in our study. Exceeding our expectations, the [Zn2+] is equal in both suspensions. Furthermore, the [Zn2+] in the supernatant of the 20-nm ZnO NP-CMC suspension did not induce significant defects to the OE and OB. We show that the dissolved fraction of the ZnO NPs in suspension does not account for the toxicity of the ZnO NP-CMC suspensions to the rat olfactory system, which is consistent with the results of our previous research [25] and the toxicity of the ZnO NP suspensions to Daphnia magna [33].
ZnO NPs are among the more soluble metal oxide nanomaterials. Therefore, it is more likely to be transformed into soluble zinc ions after in vivo treatment. Except for the particle size factor, dissolved Zn2+, as the other negligible aspect, may play a major role in the ZnO NPs’ toxicity to nasal mucosal cells [22]. Previous studies have found that intranasal instilled ZnSO4 can destroy OE, leading to peripheral afferent nerve deafferentation [37]. Persson et al. reported that Zn2+ (as ZnCl2) could be translocated along the olfactory nerves of the rat into the olfactory bulb and even the anterior portion of the olfactory cortex, and that zinc ions have been found to accumulate in the olfactory glomerulus axon terminals of primary olfactory neurons [38]. We speculate that the slightly acidic environment (pH 5.5–6.5) of the nasal mucosa [39] and the low pH within cytoplasmic vesicles (e.g., lysosomes, pH 5.2) facilitate the dissolution of ZnO NPs [40]. In line with this opinion, surface coatings on the ZnO nanoparticles mitigated cellular responses such as cell stress, inflammatory, and apoptosis [23]. Interestingly, accumulated Zn in the form of ZnO in rat liver has recently been revealed, demonstrating some overlaps and considerable specificity in metabolism profiles related to the antioxidant systems and energy metabolism pathways versus ZnSO4 exposure [35]. ZnO in particulate form in the OB synaptosomes and brain has been found following nasal exposure of rats to airborne ZnO NPs (12–14 nm particle size), demonstrating an OB–brain translocation pathway for ZnO NPs [41]. However, the brain-region-specific distribution of exogenous ZnO NPs was not further clarified in that study. In a sense, our study located the ZnO NPs-induced adverse effect in OB.
In clinics, olfactory impairment and deficits have been reported in neurodegenerative disorders such as Parkinson’s disease (PD) and Alzheimer’s disease (AD) [42,43]. Damage to the olfactory pathway may be an early sign of AD and PD [44,45]. Epidemiologic investigations have shown a link between excessive zinc exposure and demyelinating diseases [46]. Zinc dysregulation will lead to an increase in extracellular Zn2+ concentration, which may precipitate β amylase and play a role in Alzheimer’s disease [47]. Van Denderen et al. [48] suggested that a decrease in the metabolic activity in the olfactory brain would result in a drop of the nerve fiber density in the anterior cerebral artery after ZnSO4-induced loss of olfaction. A decrease in nerve fiber density in the precommunicating part of the anterior cerebral artery was also found in patients with Alzheimer’s disease [49]. Moreover, ZnO NPs have been reported to be involved in the pathogenesis of neuronal diseases [50] and cause neural stem cell apoptosis [51]. For occupational workers chronically exposed to zinc-containing powders, fumes from zinc-plating factories, and welding environments, ZnO NPs might deposit in the nasal mucosa and subsequently undergo cellular uptake of primary olfactory sensory neurons, enter the olfactory bulb via axonal transport, and arrive at the olfactory cortex or even deeper brain regions via the axonal transmission of secondary olfactory neurons, resulting in excessive Zn element overload in the brain. Suppose that inhalation of ZnO NPs adversely affects the olfactory system and induces or aggravates the development of neurodegenerative disorders; in this case, the health of the occupationally exposed population should be given more attention.
As a well-established technique in medical and biological applications, the value of MRI has been greatly underestimated for nanotoxicology studies. The results of this study indicate that MRI could be used as a bio-screening tool to assess the reverse consequences of nasal exposure to ZnO NPs. It is important to ensure the safe application of nanomaterials [52] by elucidating the biological effects of nanomaterials and then exploring ways to eliminate and avoid their nanotoxicity.
5. Conclusions
The global rise in nanomaterials production has prompted people to pay attention to the safe application of NPs. We found acute toxicity effects on the rat olfactory system using MRI technology via nasally instilled 20-nm ZnO NPs. Our study revealed that 20-nm ZnO NPs caused obvious structural disruption and inflammation to the OE and OB at the acute stage. The results of our study support the viewpoint of the size-dependent toxic effect of NPs. The T1 value of the OE in the ZnO20 group increased at 1 d, consistent with the T2-weighted imaging results, suggesting severe edema. OB edema and atrophy were illustrated in the inversion recovery T1-weighted images following cellular damage and inflammation in the OE. The MRI findings were identified via the histological results. Structural disorganization of the epithelial cell layer, shrinkage of the olfactory axons, and infiltration of inflammatory cells are typical pathological features in the OE; the OB was characterized by the thinning of the ONL. Changes in vascular permeability were present in both the OE and OB. To the best of our knowledge, OB damage caused by ZnO NPs has never been reported before. The results suggest that the real-time and non-invasive advantages of MRI allow it to directly and dynamically observe and assess the potential toxicity of long-term exposure to ZnO NPs in the olfactory system. More studies are required to pinpoint the mechanism behind the ZnO NPs’ toxicity.
In the future, our research will focus on the biosafety assessment of manufactured nanoparticles, including, but not limited to, the nanoparticle toxicity of long-term nasal exposure and the transport mechanism of nanoparticles in neurodegenerative disease.
Author Contributions
Conceptualization, X.W. and L.G.; methodology, L.G.; software, Y.M.; validation, X.L.; formal analysis, X.L.; investigation, J.C.; resources, Y.M.; data curation, X.W.; writing—original draft preparation, L.G.; writing—review and editing, X.W.; visualization, X.L.; supervision, J.C.; project administration, J.C.; funding acquisition, L.G. and X.W. All authors have read and agreed to the published version of the manuscript.
Funding
This research was funded by the Natural Science Foundation of China (No. 81601204), the Research Fund of Jianghan University (No. 2022SXZX26), and the Project in the Field of Laboratory Animal Research in Hubei Province (No. 2023CFA002).
Institutional Review Board Statement
The animal study protocol was approved by the Ethics Committee of the Department of Medicine, Jianghan University (No: JHDXLL2022-069).
Data Availability Statement
The data are contained within the article.
Conflicts of Interest
The authors declare no conflicts of interest.
References
- Sabir, S.; Arshad, M.; Chaudhari, S.K. Zinc oxide nanoparticles for revolutionizing agriculture: Synthesis and applications. Sci. World J. 2014, 2014, 925494. [Google Scholar] [CrossRef] [PubMed]
- Raha, S.; Ahmaruzzaman, M. ZnO nanostructured materials and their potential applications: Progress, challenges and perspectives. Nanoscale Adv. 2022, 4, 1868–1925. [Google Scholar] [CrossRef]
- Fine, J.M.; Gordon, T.; Chen, L.C.; Kinney, P.; Falcone, G.; Sparer, J.; Beckett, W.S. Characterization of clinical tolerance to inhaled zinc oxide in naive subjects and sheet metal workers. J. Occup. Environ. Med. 2000, 42, 1085–1091. [Google Scholar] [CrossRef] [PubMed]
- Osmond, M.J.; Mccall, M.J. Zinc oxide nanoparticles in modern sunscreens: An analysis of potential exposure and hazard. Nanotoxicology 2010, 4, 15–41. [Google Scholar] [CrossRef] [PubMed]
- Kuschner, W.G.; D’Alessandro, A.; Wong, H.; Blanc, P.D. Early pulmonary cytokine responses to zinc oxide fume inhalation. Environ. Res. 1997, 75, 7–11. [Google Scholar] [CrossRef]
- Lam, H.F.; Conner, M.W.; Rogers, A.E.; Fitzgerald, S.; Amdur, M.O. Functional and morphologic changes in the lungs of guinea pigs exposed to freshly generated ultrafine zinc oxide. Toxicol. Appl. Pharmacol. 1985, 78, 29–38. [Google Scholar] [CrossRef]
- Beckett, W.S.; Chalupa, D.F.; Pauly-Brown, A.; Speers, D.M.; Stewart, J.C.; Frampton, M.W.; Utell, M.J.; Huang, L.S.; Cox, C.; Zareba, W.; et al. Comparing inhaled ultrafine versus fine zinc oxide particles in healthy adults: A human inhalation study. Am. J. Resp. Crit. Care 2005, 171, 1129–1135. [Google Scholar] [CrossRef]
- De Lorenzo, A.J.D. The olfactory neuron and the blood-brain barrier. In Ciba Foundation Symposium—Internal Secretions of the Pancreas (Colloquia on Endocrinology); John Wiley & Sons, Ltd.: London, UK, 1970. [Google Scholar]
- Oberdörster, G.; Sharp, Z.; Atudorei, V.; Elder, A.; Gelein, R.; Kreyling, W.; Cox, C. Translocation of inhaled ultrafine particles to the brain. Inhal. Toxicol. 2004, 16, 437–445. [Google Scholar] [CrossRef]
- Elder, A.; Gelein, R.; Silva, V.; Feikert, T.; Opanashuk, L.; Carter, J.; Potter, R.; Maynard, A.; Finkelstein, J.; Oberdörster, G. Translocation of inhaled ultrafine manganese oxide particles to the central nervous system. Environ. Health Perspect. 2006, 114, 1172–1178. [Google Scholar] [CrossRef]
- Wang, B.; Feng, W.Y.; Zhu, M.T.; Wang, Y.; Wang, M.; Gu, Y.Q.; Ouyang, H.; Wang, H.J.; Li, M.; Zhao, Y.L.; et al. Neurotoxicity of low-dose repeatedly intranasal instillation of nano- and submicron-sized ferric oxide particles in mice. J. Nanopart. Res. 2009, 11, 41–53. [Google Scholar] [CrossRef]
- Wu, J.; Ding, T.T.; Sun, J. Neurotoxic potential of iron oxide nanoparticles in the rat brain striatum and hippocampus. Neurotoxicology 2013, 34, 243–253. [Google Scholar] [CrossRef] [PubMed]
- Aillon, K.L.; Xie, Y.M.; El-Gendy, N.; Berkland, C.J.; Forrest, M.L. Effects of nanomaterial physicochemical properties on toxicity. Adv. Drug Deliv. Rev. 2009, 61, 457–466. [Google Scholar] [CrossRef] [PubMed]
- Hsiao, I.L.; Huang, Y.J. Effects of serum on cytotoxicity of nano- and micro-sized ZnO particles. J. Nanopart. Res. 2013, 15, 1829. [Google Scholar] [CrossRef]
- Sahu, D.; Kannan, G.M.; Vijayaraghavan, R. Size-Dependent Effect of Zinc Oxide on Toxicity and Inflammatory Potential of Human Monocytes. J. Toxicol. Environ. Health A 2014, 77, 177–191. [Google Scholar] [CrossRef] [PubMed]
- Tin-Tin-Win-Shwe; Yamamoto, S.; Ahmed, S.; Kakeyama, M.; Kobayashi, T.; Fujimaki, H. Brain cytokine and chemokine mRNA expression in mice induced by intranasal instillation with ultrafine carbon black. Toxicol. Lett. 2006, 163, 153–160. [Google Scholar] [CrossRef] [PubMed]
- Donaldson, K.; Duffin, R.; Langrish, J.P.; Miller, M.R.; Mills, N.L.; Poland, C.A.; Raftis, J.; Shah, A.; Shaw, C.A.; Newby, D.E. Nanoparticles and the cardiovascular system: A critical review. Nanomedicine 2013, 8, 403–423. [Google Scholar] [CrossRef] [PubMed]
- Yu, J.; Choi, S.J. Particle size and biological fate of ZnO do not cause acute toxicity, but affect toxicokinetics and gene expression profiles in the rat livers after oral administration. Int. J. Mol. Sci. 2021, 22, 1698. [Google Scholar] [CrossRef]
- Gojova, A.; Guo, B.; Kota, R.S.; Rutledge, J.C.; Kennedy, I.M.; Barakat, A.I. Induction of inflammation in vascular endothelial cells by metal oxide nanoparticles: Effect of particle composition. Environ. Health Perspect. 2007, 115, 403–409. [Google Scholar] [CrossRef]
- Jeng, H.A.; Swanson, J. Toxicity of metal oxide nanoparticles in mammalian cells. J. Environ. Sci. Health Part A Toxic Hazard. Subst. Environ. Eng. 2006, 41, 2699–2711. [Google Scholar] [CrossRef]
- Kahru, A.; Dubourguier, H.C. From ecotoxicology to nanoecotoxicology. Toxicology 2010, 269, 105–119. [Google Scholar] [CrossRef]
- Hackenberg, S.; Scherzed, A.; Technau, A.; Kessler, M.; Froelich, K.; Ginzkey, C.; Koehler, C.; Burghartz, M.; Hagen, R.; Kleinsasser, N. Cytotoxic, genotoxic and pro-inflammatory effects of zinc oxide nanoparticles in human nasal mucosa cells. Toxicol. Vitr. 2011, 25, 657–663. [Google Scholar] [CrossRef] [PubMed]
- Osmond-McLeod, M.J.; Osmond, R.I.W.; Oytam, Y.; McCall, M.J.; Feltis, B.; Mackay-Sim, A.; Wood, S.A.; Cook, A.L. Surface coatings of ZnO nanoparticles mitigate differentially a host of transcriptional, protein and signalling responses in primary human olfactory cells. Part Fibre Toxicol. 2013, 10, 54. [Google Scholar] [CrossRef] [PubMed]
- Landsiedel, R.; Ma-Hock, L.; Kroll, A.; Hahn, D.; Schnekenburger, J.; Wiench, K.; Wohlleben, W. Testing Metal-Oxide Nanomaterials for Human Safety. Adv. Mater. 2010, 22, 2601–2627. [Google Scholar] [CrossRef] [PubMed]
- Gao, L.F.; Yang, S.T.; Li, S.R.; Meng, Y.G.; Wang, H.F.; Lei, H. Acute toxicity of zinc oxide nanoparticles to the rat olfactory system after intranasal instillation. J. Appl. Toxicol. 2013, 33, 1079–1088. [Google Scholar] [CrossRef]
- Loubinoux, I.; Volk, A.; Borredon, J.; Guirimand, S.; Tiffon, B.; Seylaz, J.; Méric, P. Spreading of vasogenic edema and cytotoxic edema assessed by quantitative diffusion and T2 magnetic resonance imaging. Stroke 1997, 28, 419–427. [Google Scholar] [CrossRef]
- Griff, E.R.; Greer, C.A.; Margolis, F.; Ennis, M.; Shipley, M.T. Ultrastructural characteristics and conduction velocity of olfactory receptor neuron axons in the olfactory marker protein-null mouse. Brain Res. 2000, 866, 227–236. [Google Scholar] [CrossRef]
- Bermudez, E.; Mangum, J.B.; Asgharian, B.; Wong, B.A.; Reverdy, E.E.; Janszen, D.B.; Hext, P.M.; Warheit, D.B.; Everitt, J.I. Long-term pulmonary responses of three laboratory rodent species to subchronic inhalation of pigmentary titanium dioxide particles. Toxicol. Sci. 2002, 70, 86–97. [Google Scholar] [CrossRef]
- Bermudez, E.; Mangum, J.B.; Wong, B.A.; Asgharian, B.; Hext, P.M.; Warheit, D.B.; Everitt, J.I. Pulmonary responses of mice, rats, and hamsters to subchronic inhalation of ultrafine titanium dioxide particles. Toxicol. Sci. 2004, 77, 347–357. [Google Scholar] [CrossRef]
- Brunner, T.J.; Wick, P.; Manser, P.; Spohn, P.; Grass, R.N.; Limbach, L.K.; Bruinink, A.; Stark, W.J. In vitro cytotoxicity of oxide nanoparticles: Comparison to asbestos, silica, and the effect of particle solubility. Environ. Sci. Technol. 2006, 40, 4374–4381. [Google Scholar] [CrossRef]
- De Berardis, B.; Civitelli, G.; Condello, M.; Lista, P.; Pozzi, R.; Arancia, G.; Meschini, S. Exposure to ZnO nanoparticles induces oxidative stress and cytotoxicity in human colon carcinoma cells. Toxicol. Appl. Pharmacol. 2010, 246, 116–127. [Google Scholar] [CrossRef]
- Poynton, H.C.; Lazorchak, J.M.; Impellitteri, C.A.; Smith, M.E.; Rogers, K.; Patra, M.; Hammer, K.A.; Allen, H.J.; Vulpe, C.D. Differential gene expression in Daphnia magna suggests distinct modes of action and bioavailability for ZnO nanoparticles and Zn ions. Environ. Sci. Technol. 2011, 45, 762–768. [Google Scholar] [CrossRef] [PubMed]
- Hua, J.; Vijver, M.G.; Richardson, M.K.; Ahmad, F.; Peijnenburg, W.J.G.M. Particle-specific toxic effects of differently shaped zinc oxide nanoparticles to zebrafish embryos (Danio rerio). Environ. Toxicol. Chem. 2014, 33, 2859–2868. [Google Scholar] [CrossRef] [PubMed]
- Khare, P.; Sonane, M.; Nagar, Y.; Moin, N.; Ali, S.; Gupta, K.C.; Satish, A. Size dependent toxicity of zinc oxide nano-particles in soil nematode Caenorhabditis elegans. Nanotoxicology 2015, 9, 423–432. [Google Scholar] [CrossRef] [PubMed]
- Guo, Z.L.; Luo, Y.L.; Zhang, P.; Chetwynd, A.J.; Xie, H.D.Q.H.; Monikh, F.A.; Tao, W.Q.; Xie, C.J.; Liu, Y.Y.; Xu, L.; et al. Deciphering the particle specific effects on metabolism in rat liver and plasma from ZnO nanoparticles versus ionic Zn exposure. Environ. Int. 2020, 136, 105437. [Google Scholar] [CrossRef] [PubMed]
- Scherzad, A.; Meyer, T.; Kleinsasser, N.; Hackenberg, S. Molecular mechanisms of zinc oxide nanoparticle-induced genotoxicity short running title: Genotoxicity of ZnO NPs. Materials 2017, 10, 1427. [Google Scholar] [CrossRef] [PubMed]
- Burd, G.D. Morphological study of the effects of intranasal zinc sulfate irrigation on the mouse olfactory epithelium and olfactory bulb. Microsc. Res. Tech. 1993, 24, 195–213. [Google Scholar] [CrossRef]
- Persson, E.; Henriksson, J.; Tallkvist, J.; Rouleau, C.; Tjälve, H. Transport and subcellular distribution of intranasally administered zinc in the olfactory system of rats and pikes. Toxicology 2003, 191, 97–108. [Google Scholar] [CrossRef]
- Mei, D.; Mao, S.R.; Sun, W.; Wang, Y.J.; Kissel, T. Effect of chitosan structure properties and molecular weight on the intranasal absorption of tetramethylpyrazine phosphate in rats. Eur. J. Pharm. Biopharm. 2008, 70, 874–881. [Google Scholar] [CrossRef]
- Xia, T.; Kovochich, M.; Liong, M.; Mädler, L.; Gilbert, B.; Shi, H.B.; Yeh, J.I.; Zink, J.I.; Nel, A.E. Comparison of the mechanism of toxicity of zinc oxide and cerium oxide nanoparticles based on dissolution and oxidative stress properties. ACS Nano 2008, 2, 2121–2134. [Google Scholar] [CrossRef]
- Kao, Y.Y.; Cheng, T.J.; Yang, D.M.; Wang, C.T.; Chiung, Y.M.; Liu, P.S. Demonstration of an olfactory bulb-brain translocation pathway for ZnO nanoparticles in rodent cells in vitro and in vivo. J. Mol. Neurosci. 2012, 48, 464–471. [Google Scholar] [CrossRef]
- Duda, J.E.; Moberg, P.J.; Balderston, C.; Roalf, D.R.; Doty, R.L.; Stern, M.B. Meta-analysis of olfactory dysfunction in Alzheimer’s, Parkinson’s and Huntington’s Diseases. Neurobiol. Aging 2004, 25, S95. [Google Scholar] [CrossRef]
- Ibarretxe-Bilbao, N.; Junque, C.; Marti, M.J.; Valldeoriola, F.; Vendrell, P.; Bargallo, N.; Zarei, M.; Tolosa, E. Olfactory impairment in Parkinson’s disease and white matter abnormalities in central olfactory areas: A voxel-based diffusion tensor imaging study. Mov. Disord. 2010, 25, 1888–1894. [Google Scholar] [CrossRef] [PubMed]
- Roberts, E.; Junque, C.; Marti, M.J.; Valldeoriola, F.; Vendrell, P.; Bargallo, N.; Zarei, M.; Tolosa, E. Alzheimer’s disease may begin in the nose and may be caused by aluminosilicates. Neurobiol. Aging 1986, 7, 561–567. [Google Scholar] [CrossRef] [PubMed]
- Doty, R.L.; Bromley, S.M.; Stern, M.B. Olfactory testing as an aid in the diagnosis of Parkinson’s disease: Development of optimal discrimination criteria. Neurodegeneration 1995, 4, 93–97. [Google Scholar] [CrossRef] [PubMed]
- Prodan, C.I.; Holland, N.R. CNS demyelination from zinc toxicity? Neurology 2000, 54, 1705–1706. [Google Scholar] [CrossRef] [PubMed]
- Frederickson, C.J.; Bush, A.I. Synaptically released zinc: Physiological functions and pathological effects. Biometals 2001, 14, 353–366. [Google Scholar] [CrossRef]
- van Denderen, J.C.M.; van Wieringen, G.W.; Hillen, B.; Bleys, R.L.A.W. Zinc sulphate-induced anosmia decreases the nerve fibre density in the anterior cerebral artery of the rat. Auton. Neurosci. 2001, 94, 102–108. [Google Scholar] [CrossRef]
- Bleys, R.L.; Cowen, T.; Groen, G.J.; Hillen, B. Perivascular nerves of the human basal cerebral arteries: II. Changes in aging and Alzheimer’s disease. J. Cereb. Blood Flow Metab. 1996, 16, 1048–1057. [Google Scholar] [CrossRef]
- Frederickson, C.J.; Koh, J.Y.; Bush, A.I. The neurobiology of zinc in health and disease. Nat. Rev. Neurosci. 2005, 6, 449–462. [Google Scholar] [CrossRef]
- Deng, X.Y.; Luan, Q.X.; Chen, W.T.; Wang, Y.L.; Wu, M.H.; Zhang, H.J.; Jiao, Z. Nanosized zinc oxide particles induce neural stem cell apoptosis. Nanotechnology 2009, 20, 115101. [Google Scholar] [CrossRef]
- Gandhi, S.; Shastri, D.H.; Shah, J.G.; Nair, A.B.; Jacob, S. Nasal Delivery to the Brain: Harnessing Nanoparticles for Effective Drug Transport. Pharmaceutics 2024, 16, 481. [Google Scholar] [CrossRef] [PubMed]
Disclaimer/Publisher’s Note: The statements, opinions and data contained in all publications are solely those of the individual author(s) and contributor(s) and not of MDPI and/or the editor(s). MDPI and/or the editor(s) disclaim responsibility for any injury to people or property resulting from any ideas, methods, instructions or products referred to in the content. |
© 2024 by the authors. Licensee MDPI, Basel, Switzerland. This article is an open access article distributed under the terms and conditions of the Creative Commons Attribution (CC BY) license (https://creativecommons.org/licenses/by/4.0/).