Article

Cadmium-Induced Physiological Responses, Biosorption and Bioaccumulation in Scenedesmus obliquus

1
State Key Laboratory of Freshwater Ecology and Biotechnology, Institute of Hydrobiology, Chinese Academy of Sciences, Wuhan 430072, China
2
University of Chinese Academy of Sciences, Beijing 100049, China
3
Geophysical Exploration Brigade of Hubei Geological Bureau, Wuhan 430056, China
4
College of Life Science, Wuhan University, Wuhan 430072, China
*
Author to whom correspondence should be addressed.
Toxics 2024, 12(4), 262; https://doi.org/10.3390/toxics12040262
Submission received: 22 February 2024 / Revised: 19 March 2024 / Accepted: 29 March 2024 / Published: 31 March 2024
(This article belongs to the Section Metals and Radioactive Substances)

Abstract

:
Cadmium ion (Cd2+) is a highly toxic metal in water, even at low concentrations. Microalgae are a promising material for heavy metal remediation. The present study investigated the effects of Cd2+ on growth, photosynthesis, antioxidant enzyme activities, cell morphology, and Cd2+ adsorption and accumulation capacity of the freshwater green alga Scenedesmus obliquus. Experiments were conducted by exposing S. obliquus to varying concentrations of Cd2+ for 96 h, assessing its tolerance and removal capacity towards Cd2+. The results showed that higher concentrations of Cd2+ (>0.5 mg L−1) reduced pigment content, inhibited algal growth and electron transfer in photosynthesis, and led to morphological changes such as mitochondrial disappearance and chloroplast deformation. In this process, S. obliquus counteracted Cd2+ toxicity by enhancing antioxidant enzyme activities, accumulating starch and high-density granules, and secreting extracellular polymeric substances. When the initial Cd2+ concentration was less than or equal to 0.5 mg L−1, S. obliquus was able to efficiently remove over 95% of Cd2+ from the environment through biosorption and bioaccumulation. However, when the initial Cd2+ concentration exceeded 0.5 mg L−1, the removal efficiency decreased slightly to about 70%, with biosorption accounting for more than 60% of this process, emerging as the predominant mechanism for Cd2+ removal. Fourier transform infrared correlation spectroscopy analysis indicated that the carboxyl and amino groups of the cell wall were the key factors in removing Cd2+. In conclusion, S. obliquus has considerable potential for the remediation of aquatic environments with Cd2+, providing algal resources for developing new microalgae-based bioremediation techniques for heavy metals.

Graphical Abstract

1. Introduction

Cadmium (Cd), a non-essential trace metal element, is a major toxic metal pollutant even at low concentrations [1,2]. Cd can enter natural water through various sources, causing physiological and morphological changes in animals and plants, especially in microalgae, which are primary producers of water ecosystems [3]. Cadmium has been shown to affect growth [4], reproduction, physiological and biochemical processes in microalgae [5]. For example, cadmium affects photosynthesis, leads to chloroplasts and mitochondria damage, upregulates antioxidant capacity, and alters cellular ultrastructure [6,7]. However, the same heavy metal has different effects on algal cell growth and metabolism.
Despite the toxicity of Cd, microalgae have evolved complex resistance mechanisms. These mechanisms include extracellular immobilization, intracellular sequestration, and detoxification of metal ions [8]. The cell wall and extracellular polymeric substances (EPS) can adsorb toxic metals through electrostatic interactions, complexation, reduction, ion exchange, and surface precipitation [9,10]. In the cytoplasm, amino acids, chelating peptides, and organic acids are capable of chelating heavy metals [11]. Furthermore, cells can regulate reactive oxygen species (ROS) induced oxidative damage through the antioxidant system [5]. Different algae may use different strategies to counteract metal toxicity due to differences in living environment, structure, and physiological level.
The Genus Scenedesmus is a group of green algae widely distributed in aquatic ecosystems with the ability to accumulate high concentrations of metal ions. Some studies have investigated the interaction of Scenedesmus sp. with Cd, focusing on heavy metal risk assessment, biotechnology of heavy metal removal by microalgae, and integration of microalgae biofuel with wastewater treatment [12]. Other studies have investigated the response mechanisms of Scenedesmus obliquus to Cd, for example, Mangal and Nguyen et al. [13] used an untargeted metabolomics approach to characterize the response of algal metabolites to cadmium stress. Previously, we studied the interaction between algal organic matter (AOM) and Cd2+ in S. obliquus and elucidated the detoxification mechanism of AOM [14]. Innovations in biotechnology have led to new methods for heavy metal removal, such as the immobilization of microalgae cells for the treatment of cadmium-rich wastewater [15] and the development of fixed-bed biosorption systems for Cd2+ removal [16]. In addition, the combination of microalgal biomass production with wastewater treatment [17] has been proposed as a cost-effective bioremediation strategy.
Despite numerous studies on Cd toxicity and adsorption by Scenedesmus sp., a comprehensive analysis incorporating various effects and mechanisms has been lacking. Therefore, we conducted a 96-h toxicological experiment with S. obliquus under varying Cd2+ concentrations to investigate physiological changes such as morphology, structure, optical density, pigment content, and antioxidant enzyme activities under Cd stress, including the identification of Cd damage sites through chlorophyll fluorescence. We also measured Cd2+ concentrations on the cell surface, inside the cell, and in the medium to assess biosorption and bioaccumulation capacities. In addition, extracellular polymeric substances were quantitatively and qualitatively analyzed to explore their mechanisms of action in biosorption. The physiological parameters measured in this study can be used for environmental risk assessment, which will help to develop more effective guidelines for environmental protection and provide algal resources and theoretical references for the future development of heavy metal removal technologies using S. obliquus.

2. Materials and Methods

2.1. The Algal Cultivation

Scenedesmus obliquus (F-417) was purchased from Freshwater Algae Culture Collection at the Institute of Hydrobiology (FACHB), Chinese Academy of Sciences (Wuhan, China). Algal cells were cultivated in BG11 medium [18] using aseptic techniques in 250 mL Erlenmeyer flasks and placed in a PGX-350B (Yanghui Co., Ltd., Ningbo, China) light incubator with a light intensity of 30 μmol photons m−2 s−1 (white fluorescent lamp) at 25 ± 1 °C, following a day/night cycle of 12:12 h.

2.2. Cd Toxicity Test

Considering prior findings the metal ion chelator EDTA (ethylenediaminetetraacetic acid, at 1 mg L−1) mitigates cadmium toxicity without significantly affecting algal growth and photosynthesis [19]. We opted for a modified BG11 medium devoid of EDTA for our experiments. A 1000 mg L−1 Cd2+ stock solution was prepared by dissolving CdCl2 in sterile water, which was then sterilized and filtered through a 0.22 μm filter for purity.
Algal cells, in their logarithmic growth phase, were harvested and resuspended in 250 mL Erlenmeyer flasks filled with 150 mL of the sterilized BG11 medium. The initial optical density (OD680 nm) was set to 0.3, corresponding to a cell density of approximately 3 × 10⁶ cells mL−1. To simulate varying environmental cadmium concentrations, cadmium stock solutions were added to achieve final Cd2+ concentrations of 0.005, 0.01, 0.05, 0.5, 5, and 10 mg L−1 in the culture medium, referencing heavy metal wastewater discharge standards and existing research on cadmium’s effects on algae. A control group was maintained in a Cd2+-free BG11 medium. Each treatment, including the control, was replicated three times to ensure reliability, and the cultures were incubated for 96 h under standard conditions, mirroring the control setup.

2.3. Algal Growth

To determine the effect of Cd2+ on the growth of S. obliquus, the growth parameters such as optical density (OD), chlorophyll a (Chl a), and chlorophyll b (Chl b) were determined for each group of flasks. The optical density at 680 nm was measured using a spectrophotometer (UV-1780, Shimadzu, Kyoto, Japan) at 0, 24, 48, 72 and 96 h.
The concentrations of Chl a and Chl b were determined according to Fan [20]. S. obliquus cells were harvested by centrifugation (12,000× g for 3 min) at 0, 24, 48, 72 and 96 h. Cells were then suspended in 1 mL of 100% methanol and homogenized with a cryogenic grinder at 4 °C for 10 min (steps of 30 s) and 70 Hz which using an automatic sample cryogenic grinder (Shanghai Jing Xin, Shanghai, China). The extracted material was kept in a water bath at 45 °C in the dark for 30 min and then centrifuged at 10,000× g for 3 min to remove cell debris before measuring the absorbance of the supernatants at 470, 646, and 663 nm with a UV-Vis spectrophotometer (UV-1780, Shimadzu, Japan), using 100% methanol was used as blank reference.
The toxic responses of test microalgae to cadmium were analyzed by the EC50 values, which are the doses causing 50% inhibition of microalgae. The EC50 value after 96 h exposure was calculated by fitting the DoseResp curve based on pigment contents (Equation (1)) using Origin 2023 (OriginLab Corporation, Northampton, MA, USA) according to Li et al. [21].
y = A 1 + ( A 2 A 1 ) / ( 1 + 10 log X 0 X P )
where: A1 is bottom asymptote, A2 is top asymptote, LogX0: Center, and P is Hill slope, and EC50 = 10LOGx0.

2.4. Photosynthesis and Respiration

The rate of photosynthetic oxygen evolution and respiratory oxygen consumption of algal cells at 96 h was determined using a liquid-phase oxygen measurement system (Chlorolab 2, Hansatech Ltd., King’s Lynn, UK). The temperature of the assay was 25 °C, and the respiratory oxygen consumption rate of the cells was determined preferentially under dark conditions, followed by turning on the light source and determining the rate of photosynthetic oxygen evolution under 400 μmol photons m−2 s−1 light (saturated light intensity) [22]. A smooth curve was chosen to calculate the apparent photosynthetic oxygen evolution rate and the respiratory oxygen consumption rate.

2.5. Chlorophyll Fluorescence

To access the effect of Cd2+ on photosynthesis in S. obliquus, the kinetics of chlorophyll fluorescence induction after 96 h of incubation in different concentrations of Cd2+ were measured using an Aqua-Pen-100 fluorometer (Photo Systems Instruments, Brno, Czech Republic) according to Zhang [23]. Briefly, a 3 mL sample of algal solution (OD680 nm = 0.5) was dark-adapted for 15 min, and then the minimum fluorescence level (Fo) was first measured under weak red light (<1 μmol m−2 s−1) irradiation at 450 nm. The maximum fluorescence level (Fm) was then measured using saturating flash irradiation at 400 μmol m−2 s−1. A typical kinetic curve for the induction of fast chlorophyll fluorescence has four phases: O, J, I, and P, with the J, I, and P phases occurring at approximately 2, 30, and 400 ms, respectively. When the PS II action centers are fully opened, the fluorescence of all electron acceptors (QA, QB, PQ, etc.) in the maximally oxidized state is called the initial fluorescence and is defined as the point O. The fluorescence intensity in the J stage represents the accumulation of QAQB and QAQB, and the intermediate I stage reflects the accumulation of QAQB2−. Point P represents the fluorescence of PS II electron acceptors in the maximally reduced state. For comparison, we normalized the fluorescence signals of different samples to relative variable fluorescence (Vt) using the mathematical formula Vt = (Ft − Fo)/(Fm − Fo) and analyzed using the JIP–test [24]. The relevant parameters are presented in Table 1.

2.6. QA Reoxidation Kinetics

QA reoxidation measurement can reflect the inhibition of electron transport on the receptor side of PSII. The positions of the potential gradients for the “donor side of PSII”, “acceptor side of PSII”, “QB binding site”, and “reduction of plastoquinone” are shown in the schematic diagram of the electron transport chain in Figure S1 [24] of Supplementary Material. To further localize the site of action of Cd2+ on the photosystem of S. obliquus, the kinetics of QA reoxidation was determined by taking 3 mL of algal solution (OD680 nm = 0.5) and dark-adapted for 15 min using FL–6000 dual–modulation kinetic fluorometer (Photon Systems Instruments, Brno, Czech Republic). The fitting of QA reoxidation kinetics curves is referred to in Beauchemin’s paper [25].
QA reoxidation kinetic curves were fitted by the following Equation (2):
F t = A 1 ex p t / T 1   + A 2 exp t / T 2   + A 3 exp t / T 3 + A 0
where F(t) is the variable fluorescence yield, A0 to A3 are the amplitudes, and T1 to T3 are the time constants from which the half-life values can be calculated as t1/2 = ln 2T.
After fitting, the fast, middle, and slow phases of the fluorescence decay process of QA reoxidation were obtained; corresponding to the amplitudes (A1, A2, A3) and time constants (T1, T2, T3), respectively. The half−life values t1/2 = ln 2T for the fast, middle, and slow phases can be calculated from the time constants T1 to T3. The fast phase is the transfer of electrons from QA to QB, that is, QA transfers electrons to QB/QB, when the QB site in the reaction center has bound PQ molecules (oxidized or semi-reduced state) before the flash, with a half−life of a few hundred microseconds. The mid−phase is also the transfer of electrons from QA to QB, but the re-oxidation of QA is limited by the rate of diffusion of the PQ molecules into the empty QB site, and the process in the mid−phase usually lasts for a few milliseconds, and the slow phase arises from the reverse charge recombination of the QA with the OEC S2 state, and usually lasts for a few seconds to several tens of seconds.

2.7. Total Protein Quantification

Total proteins were extracted using the Plant Protein Extraction Kit (Cowin, Beijing, China) [26]. Briefly, 1 mL of algal solution was centrifuged at 4000× g for 5 min. The cells were then suspended in 1 mL of plant protein extraction reagent and homogenized with a cryogenic grinder at 4 °C for 10 min (steps of the 30 s) and 70 Hz (Shanghai Jing Xin, China). The extracted material was kept in an ice bath for 30 min and then centrifuged at 13,400× g for 20 min to remove cell debris and protein content was determined using the BCA protein quantification kit (Cowin, Beijing, China), according to the method of Rogatsky [27].

2.8. Reactive Oxygen Species Measurement

Reactive oxygen species (ROS) were determined according to Aranda et al. [28]. The ROS content was determined using the Reactive Oxygen Species Assay Kit (Beyotime Biotechnology, Shanghai, China) according to the manufacturer’s instructions. 1 mL of cells was collected using centrifugation at 3500× g for 5 min; the cell paste was resuspended in 1 mL of PBS plus 10 μM 2′,7′-dichlorofluorescein-diacetate (DCFH-DA) and cultivated in the dark for 30 min at 37 °C. After incubation, the cells were centrifuged at 3500× g for 5 min and washed twice with PBS. 2′,7′-dichlorofluorescein (DCF) fluorescence (485/525 nm) was determined using a Multi-Mode Microplate reader (VICTOR Nivo; PerkinElmer, Turku, Finland) and normalized to chlorophyll fluorescence (430/670 nm).

2.9. Determination of Antioxidant Enzyme Activities

The superoxide dismutase (SOD) and catalase (CAT) were measured using detection kits (Jiancheng Institute of Biological Engineering, Nanjing, China). A 5 mL culture sample was taken from each experimental group and centrifuged at 3500× g for 10 min. The cells were suspended in 5 mL of a 10 mM phosphate-buffered saline (PBS) solution (pH 7.0). Then homogenized with a cryogenic grinder at 4 °C for 10 min (steps of the 30 s) and 70 Hz, followed by another 10 min of centrifugation (3500× g). The supernatant, serving as the enzyme extract, was analyzed for SOD and CAT activities. SOD activity was determined using the WST-1 method, in which WST-1 reacts with the superoxide anion catalyzed by xanthine oxidase to form the water-soluble methazazanine dye, a reaction step that can be inhibited by SOD, and the enzyme activity of SOD was calculated by colorimetric analysis of the WST-1 product at 450 nm, expressed as U mg−1 protein. CAT activity was quantified spectrophotometrically by reacting hydrogen peroxide with ammonium molybdate to form a yellow complex, and the enzyme activity of CAT was calculated by colorimetric analysis of the product at a wavelength of 405 nm. CAT activity is defined as the amount of enzyme that catalyzes the conversion of 1 micromole of H2O2 per minute per milligram of protein as 1 U.

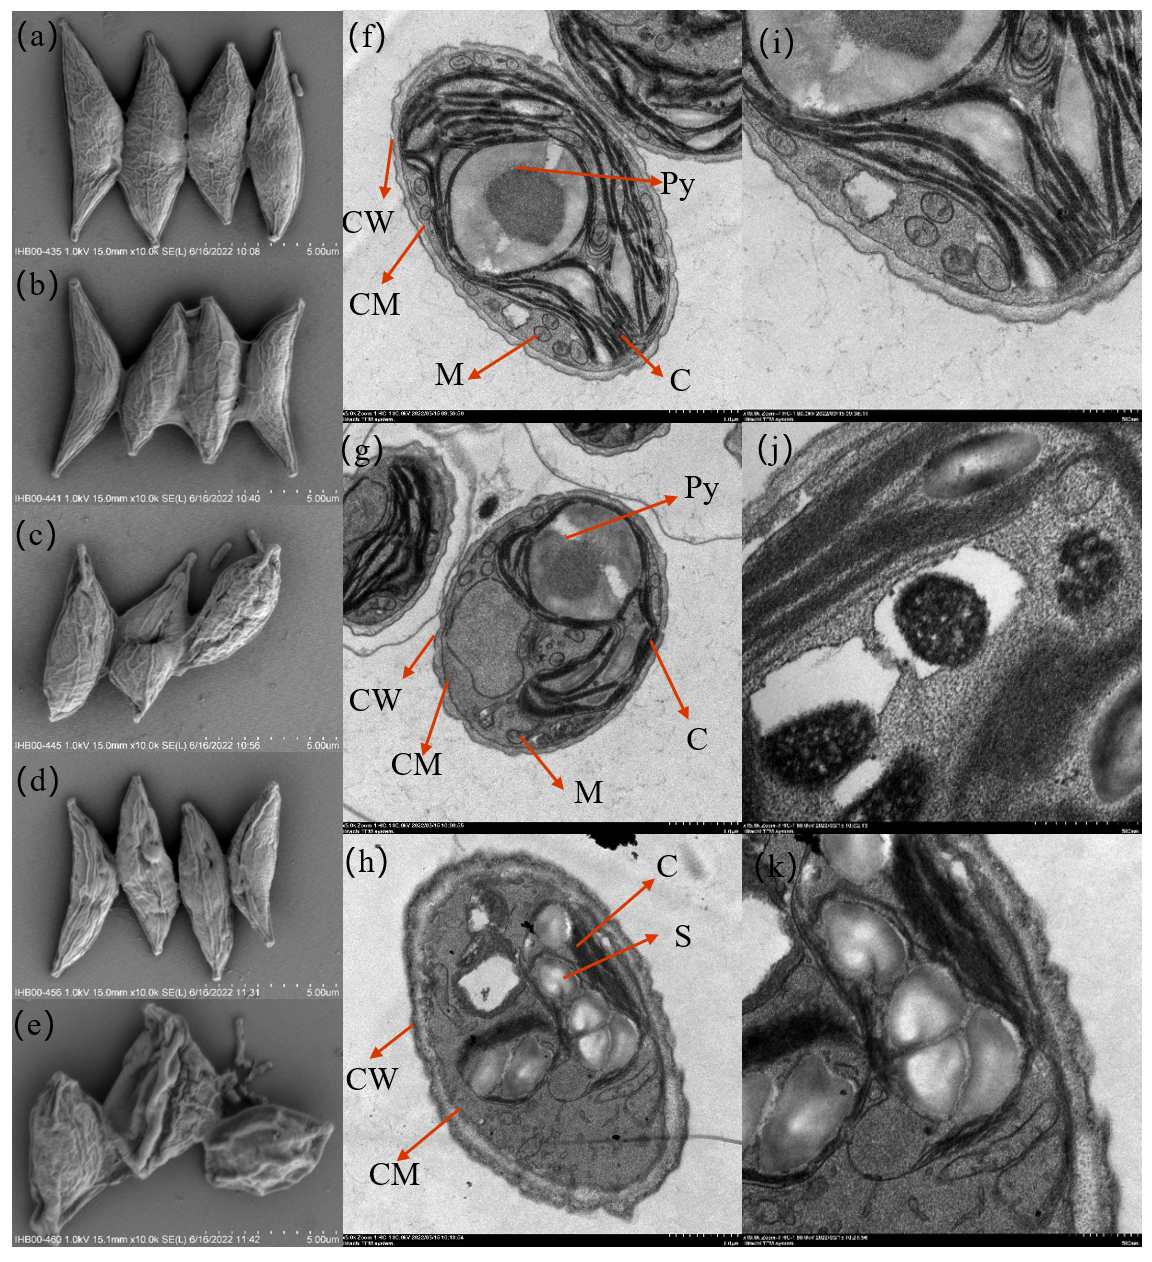
2.10. Cellular Morphology

To further understand the response of S. obliquus to Cd2+ stress, the morphology of microalgal cells was observed by scanning electron microscopy (SEM, Hitachi S-4800, Hitachi, Ltd., Tokyo, Japan) and transmission electron microscopy (TEM, Hitachi HT-770, Ltd. Tokyo, Japan). Microalgae cells were fixed with 2.5% glutaraldehyde at 4 °C for 24 h, then washed with phosphate buffer (0.05 M, pH 7.0), dehydrated with 30%, 50%, 70%, 90%, and 100% ethanol, and finally sputtered with gold before SEM analysis. The morphology of the cells was observed by SEM.
For TEM analysis, cell samples from control and Cd-treated cultures respectively were centrifuged, fixed, dehydrated, sectioned, and stained. The ultrastructural changes of S. obliquus cells were observed by TEM.

2.11. Fourier Transform Infrared Spectroscopy

To analyze the interactions between Cd2+ and the functional groups present in the cell walls of microalgae, a 50 mL sample of thoroughly mixed algal solution was collected at 96 h. This sample was then freeze-dried and ground into a fine powder, which was subsequently mixed evenly with potassium bromide at a 1:100 ratio. The mixture was then compressed into tablets, which were utilized for Fourier Transform Infrared Spectroscopy analysis using a Perkin Elmer Frontier instrument (Perkin Elmer Frontier, Perkin Elmer Inc., Waltham, MA, USA).

2.12. Extraction and Compositional Analysis of EPS

EPS secreted by microalgal cells provides binding sites for heavy metals, thereby increasing the adsorption capacity of heavy metals in aquatic environments. To explore whether cadmium stress induces the secretion of EPS in algae, the supernatant separated from the algal suspension by centrifugation (10,000× g for 15 min) was the EPS, which was then filtered through a 0.22 μm acetate cellulose membrane to remove microalgal cells and other residues [29]. The protein and polysaccharide contents of EPS were determined using the BCA assay [26] and the phenol sulfuric acid digestion [30] method, respectively.

2.13. Cadmium Distribution

Cd2+ added to the flasks were distributed on the cell surface, inside the cells, and in the medium, with the sum of the percentages of Cd2+ in the three fractions being 100%. To determine the Cd2+ distribution and proportions, 1 mL of algal solution was collected at 0, 24, 48, 72, and 96 h. The solution was centrifuged for 3 min at 10,000× g. The cell-free supernatant was filtered through a 0.22 μm Millipore filter and the concentration of Cd2+ in the medium was measured by ICP-MS (Agilent 8900, Tokyo, Japan). The cell pellet was washed with 2 mM EDTA for 10 min and centrifuged at 10,000× g for 3 min to remove Cd2+ adsorbed on the biomass surface. The EDTA-washed cell pellet was initially digested in 2 mL of concentrated HNO3 at 100 °C for 1 h and further digested at 150 °C before the samples were cooled to room temperature. The digested samples were diluted and filtered appropriately and measured intracellular Cd2+ concentration by ICP-MS (Agilent 8900, Tokyo, Japan). Cadmium adsorbed on the cell surface was determined by the difference between the initial and final cadmium concentrations in the culture medium.
Cd accumulation percentage was determined by Equation (3):
Cd   accumulation   % = C α /   C i     ×   100
where Cα is the intracellular Cd2+ concentration (mg L−1) and Ci is the initial concentration (mg L−1) of Cd2+ in the culture medium.
Cd adsorption percentage was determined by Equation (4):
Cd   adsorption   % = ( C i C f C α ) / C i   ×   100
where Cα is the intracellular Cd2+ concentration (mg L−1) and Ci and Cf are the initial and final concentrations (mg L−1) of Cd2+ in the culture medium, respectively.
Cadmium in the medium percentage was determined by Equation (5):
Cd   in   the   medium   % = C f /   C i   ×   100
where Ci and Cf are the initial and final concentrations (mg L−1) of Cd2+ in the culture medium, respectively.

2.14. Statistical Analysis

Statistical analyses were conducted using Origin 2022 (OriginLab Corporation, Northampton, MA, USA) and SPSS 22.0 (IBM SPSS, Chicago, IL, USA) software. Significant differences between the control and treated cultures were analyzed using a one-way ANOVA test followed by the LSD test or the Games-Howell test. Values were considered significant at p < 0.05.

3. Results

3.1. Cellular Morphology

Scanning electron microscopy (SEM) and transmission electron microscopy (TEM) showed significant changes in the morphological structure of S. obliquus before and after Cd stress. The SEM images in Figure 1a depicted the control group of S. obliquus. SEM images showed that cells of S. obliquus were spindle-shaped, being broadest near the middle and tapering toward both ends. These nonmotile cells typically formed coenobia, arranged in rows of 2 or 4 cells. The individual cells were approximately 8–10 μm long and 3–5 μm wide. The TEM image of the control group was shown in Figure 1f,i. Ultrathin sections of untreated cells displayed typical organelles, structures, and inclusions characteristic of this species. The cell wall was thin, smooth, and wavy, with a large protein nucleus surrounded by starch ridges visible. The chloroplast occupied most of the cell volume, with numerous thylakoid membranes parallel to each other, occasionally containing starch granules in the thylakoid space. Many small mitochondria and few vacuoles were observed in the cytoplasm.
Under Cd2+ stress, most of the coenobium gradually became unicellular. The cells shriveled with surface folds deepened (Figure 1b,c,d,e). At high Cd2+ concentration (10 mg L−1), cells lysed and died, and the intracellular materials were released. After 96 h Cd exposure, TEM showed thickened cells, plasmolysis, chloroplast shrinkage, photosynthetic lamella adherence, mitochondrial deformation, or even disappearance (Figure 1g,h,j,k). Furthermore, the starch granules increased in number and volume, with some cells lysing and releasing their contents. In addition, the non-membranous electron-dense inclusions were observed in the vacuoles.

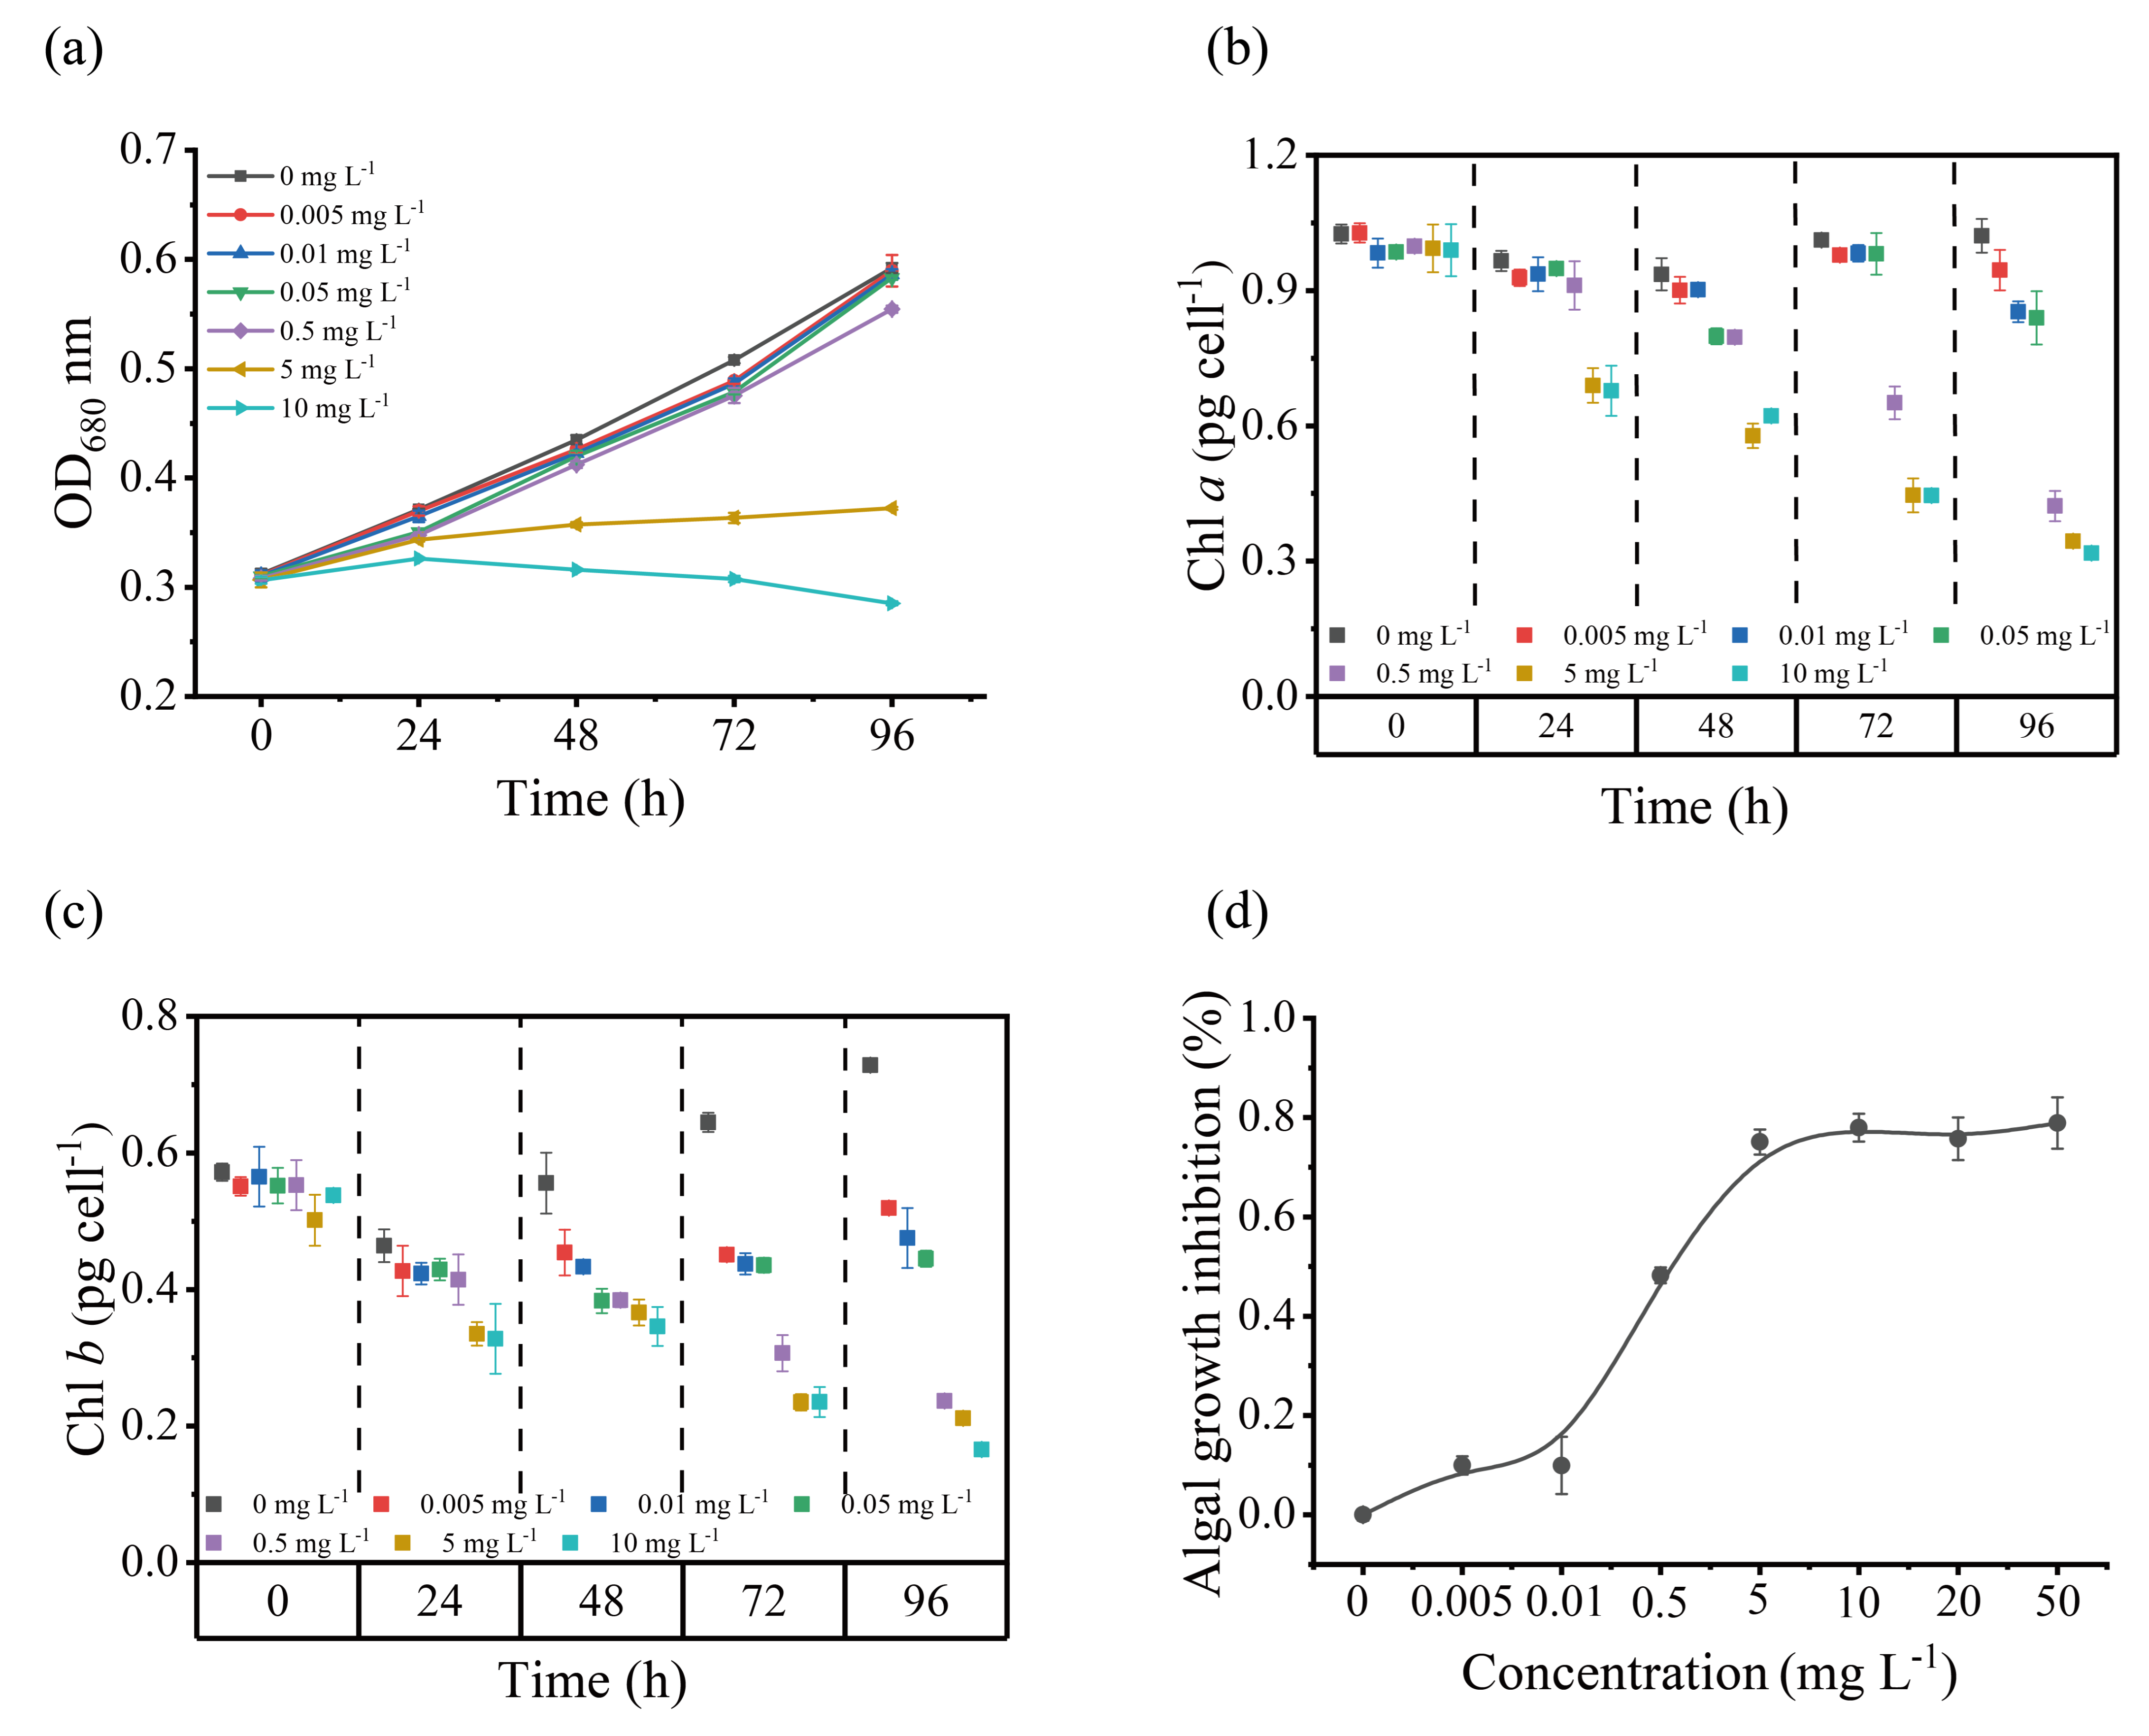
3.2. Growth and Tolerance

To investigate the tolerance of S. obliquus to different Cd2+ concentrations, the growth performance under Cd2+ stress was studied. It was found that when the Cd concentration was lower than EC50, there was no significant effect, and when it was higher than EC50, the optical density and pigment were significantly affected. As shown in Figure 2a, the growth of S. obliquus cells maintained a continuously increasing trend under the low Cd2+ concentration (< 0.05 mg L−1), and while at high Cd2+ concentrations (5 and 10 mg L−1), the growth of S. obliquus cells was significantly inhibited (p < 0.05). As shown in Figure 2b,c, compared to the control group, there was no significant difference in Chlorophyll a (Chl a) at Cd concentrations lower than 0.5 mg L−1; however, the inhibitory effects were significant when the Cd2+ concentration was higher than 0.5 mg L−1 during 72 h. After 96 h of stress, Chl a was significantly decreased in all Cd-treated groups (p < 0.05). Chlorophyll b (Chl b) also decreased significantly from 48 h of Cd stress treatment (p < 0.05). EC50 value was determined by measuring the growth of the algae at various Cd2+ concentrations (0–50 mg L−1). As shown in Figure 1d, the EC50 value was 0.41 ± 0.03 mg L−1 at 96 h.

3.3. Photosynthesis and Respiration

Photosynthesis and respiration are pivotal metabolic activities of photosynthetic organisms, so we explored the effects of cadmium stress on these metabolic activities and found that high levels of cadmium significantly impair both photosynthesis and respiration in algae. These includes a notable reduction in the photosynthetic oxygen evolution rate and disruption of electron transfer during photosynthesis. As shown in Figure 3a, there was a significant inhibition of photosynthetic oxygen evolution of S. obliquus observed with an increasing Cd2+ concentration in the medium (p < 0.05), particularly at Cd2+ concentrations of 0.5, 5, and 10 mg L−1 compared to the control. Simultaneously, the rate of respiratory oxygen consumption exhibited an upward trend with increasing cadmium concentrations (Figure 3b).
The effect of Cd on photosynthesis was further elucidated through rapid chlorophyll fluorescence−induced kinetic analysis. Before Cd2+ treatment, S. obliquus showed a typical fast chlorophyll fluorescence induction kinetic curve with four phases: O, J, I, and P. However, under high Cd2+ stress (5 and 10 mg L−1), as shown in Figure 3c and Figure S2, there was a pronounced increase in the relative variable intensity at the J step (VJ) was enhanced, indicating that electron transfer from QA to QB was inhibited. In addition, the emergence of a new phase (K) signaled a disruption in the oxygen-evolving complexes (OEC) on the electron donor side, highlighting the detrimental effects of high cadmium stress on the photosynthetic apparatus.
To further investigate the effect of cadmium stress on electron transfer on the PSII receptor side of algal cells, we performed a JIP test analysis. As shown in Table S1 and Figure 3d, both the minimum fluorescence intensity (Fo), the maximum fluorescence intensity (Fm), the maximum quantum yield for primary photochemistry (φPo), the probability that a trapped exciton moves an electron into the electron transport chain beyond QAo), the quantum yield for electron transport (φEo), the electron transport flux per reaction center (ETo/RC), and the performance index on absorption basis (PIABS) showed a stepwise decrease between 5 and 10 mg L−1 of culture. Conversely, parameters such as the number of times QA was restored from the time (N), the quantum yield for dissipated energy (φDo), the dissipated energy flux per reaction center (DIo/RC), the absorption flux per reaction center (ABS/RC), the trapped energy flux per reaction center (TRo/RC), and the approximated initial slope of the fluorescence transient (Mo) increased significantly. These findings suggest that Cd2+ concentrations up to 0.5 mg L−1 do not significantly affect photosynthetic activity, whereas higher concentrations may decrease the electron transfer efficiency around PSII and inhibit the electron transfer from QA to QB.
To corroborate these observations, QA reoxidation kinetics were analyzed. As shown in Figure 3e,f, the time constant of the fast phase extended from 22.4 μs in control cells to 27.87 μs in cells exposed to 0.05 mg L−1 of Cd2+ (Table S2), indicating that the concentration of Cd2+ up to 0.5 mg L−1 did not significantly affect photosynthetic activity, higher concentrations adversely affected the electron transfer from QA to QB.

3.4. Antioxidant Enzymes

To elucidate the survival mechanism adopted by the cells under Cd2+ toxicity, we investigated the modulation of protein, reactive oxygen species (ROS), catalase (CAT), and superoxide dismutase (SOD) (Figure 4). It was found that Cd stress induced oxidative stress in algae, prompting the activation of antioxidant defense mechanisms to counteract Cd stress. Notably, the total protein content in algae decreased significantly with the increase of Cd2+ concentration after 96 h of exposure (Figure 4a). In contrast, a significant increase in ROS was observed when concentrations of Cd2+ ≥ 0.05 mg L−1 were present (Figure 4b). Interestingly, the activities of both SOD and CAT first decreased and then increased (Figure 4b,c). Specifically, SOD activity decreased to a minimum at a Cd2+ concentration of 0.005 mg L−1, while CAT activity reached its minimum at a Cd2+ concentration of 0.05 mg L−1, with both enzymes showing increased activity at 5 and 10 mg L−1.

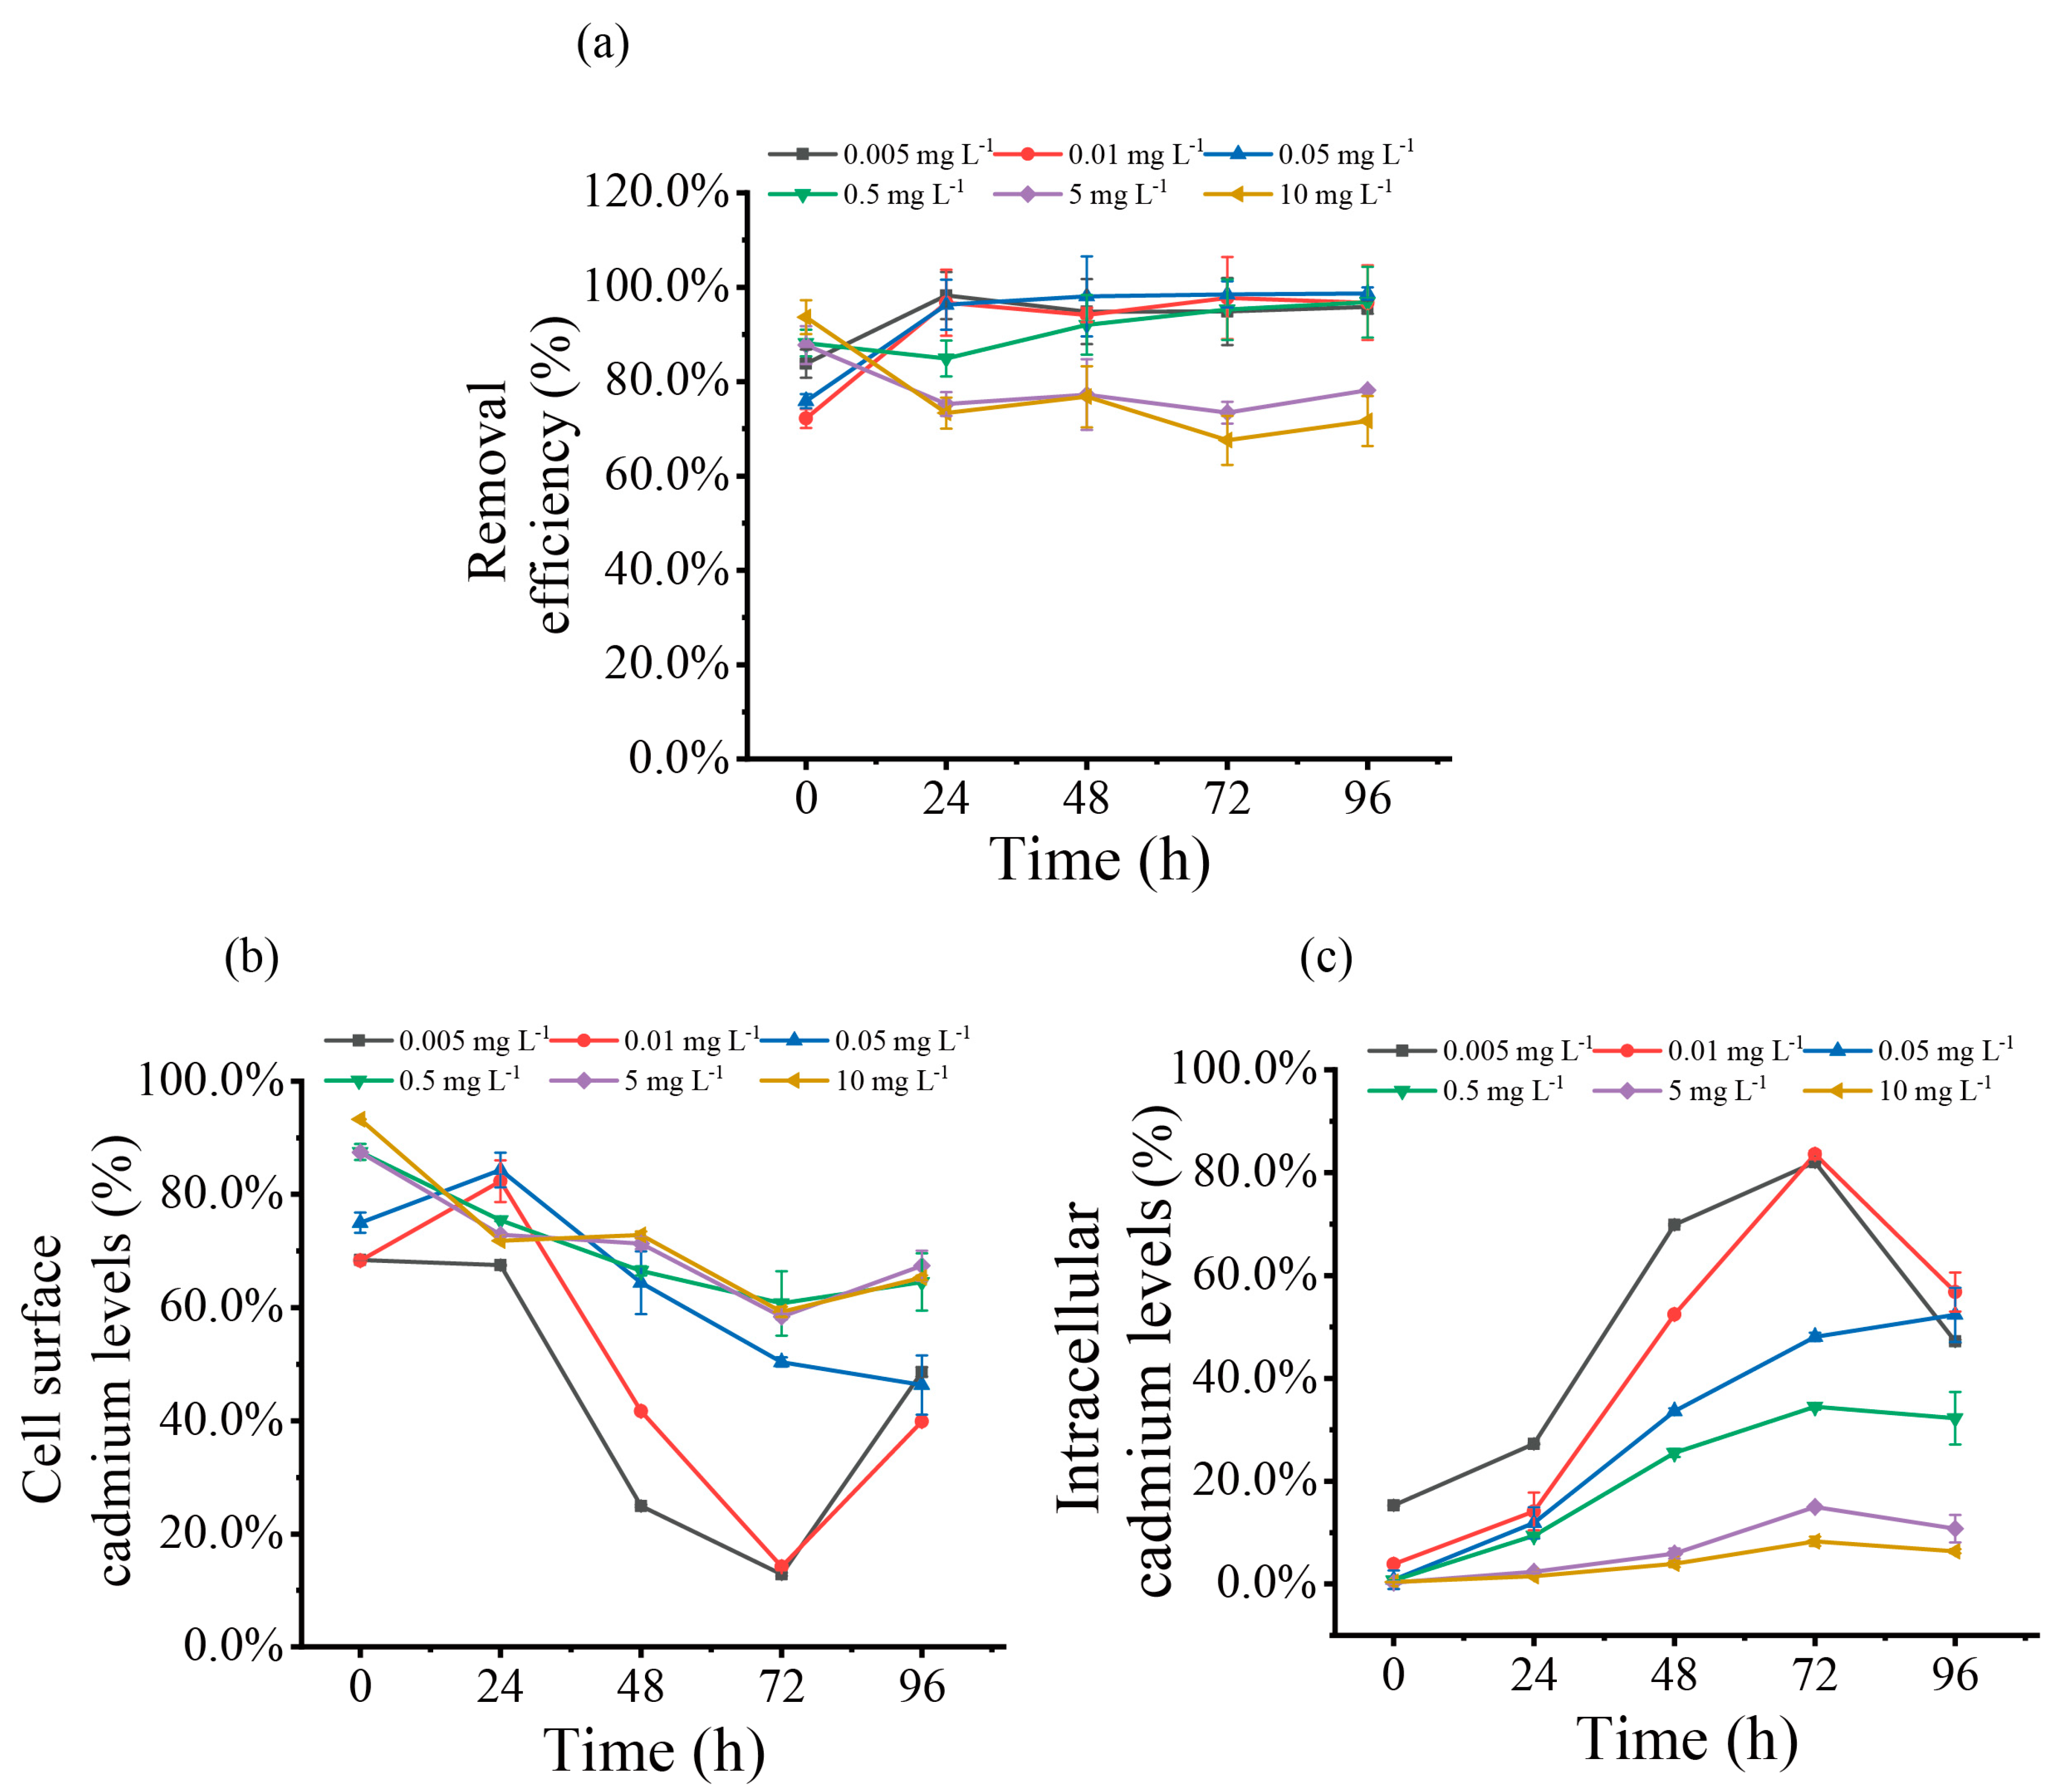
3.5. Biosorption and Accumulation

To elucidate the distribution of cadmium and its ability to remove cadmium, the concentration of Cd2+ on the cell surface, intracellularly, and in the culture medium at different times was determined during the time course experiment described in Figure 2a. The results showed that the adsorption, accumulation, and removal percentage of cadmium by S. obliquus varied depending on the cadmium concentration and duration of exposure. Figure 5a showed the cadmium removal efficiency over time by S. obliquus, demonstrating that the algae efficiently removed Cd2+ from the medium, with removal efficiency ranging between 67.6% and 98.6%. Notably, at cadmium concentrations below 0.5 mg L−1, the removal rate surged within the first 24 hours before stabilizing, whereas at concentrations above 0.5 mg L−1, the trend was reversed.
Figure 5b showed the temporal changes in Cd levels on the cell surface following exposure to varying concentrations of Cd. The data indicated swift adsorption of Cd2+ onto the cell surface, with initially high adsorption percentages that subsequently declined. Generally, the adsorption rate increased with higher Cd2+ concentrations, peaking at the experiment’s outset with a 10 mg L−1 concentration, where it reached 93.2% of the initial concentration.
Concurrently, as shown in Figure 5c, Cd2+ was internalized by the cells, with intracellular accumulation rising over time but diminishing at higher Cd2+ concentrations. Initially, at 0 h, the accumulation percentage of Cd2+ was 15.3% of the initial spiked amount for the lowest concentration group (0.005 mg L−1) and less than 1.0% for concentrations above 0.01 mg L−1. The accumulation percentage gradually increased and then decreased, reaching its peak at 72 h. The highest accumulation, 83.5%, was observed in the 0.01 mg L−1 treatment group.

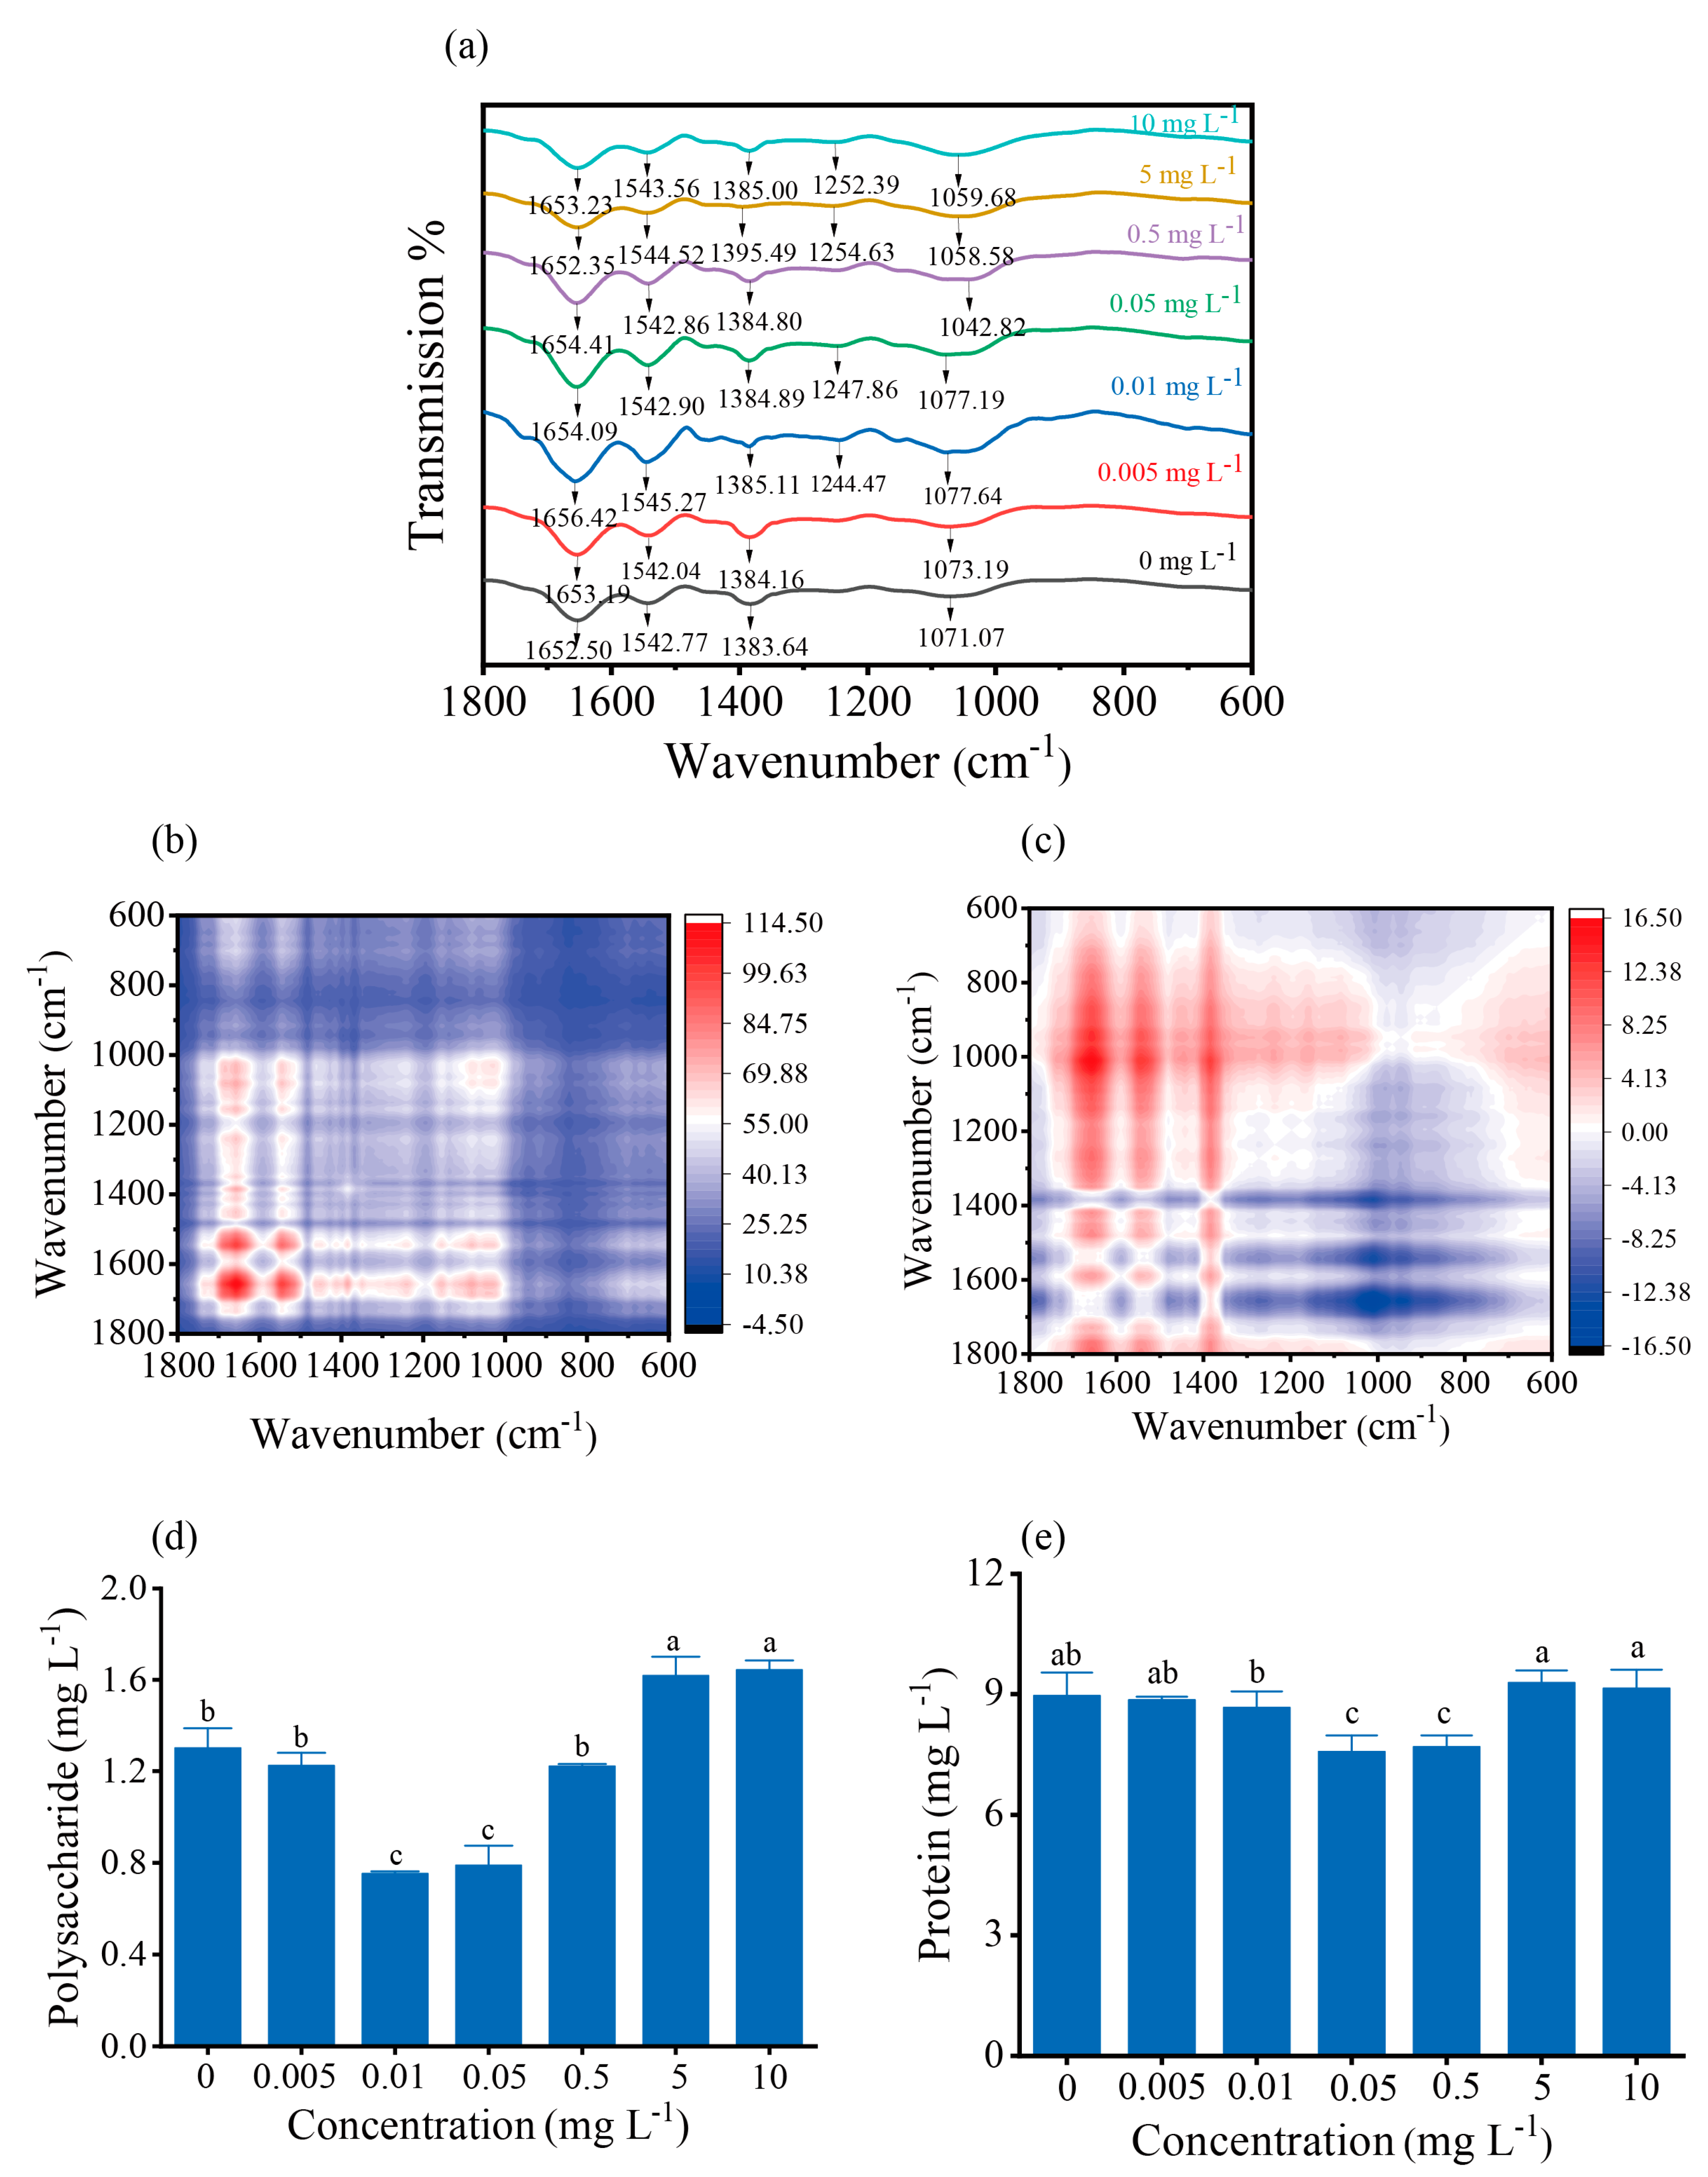
3.6. Composition of Functional Groups

We also explored the biosorption mechanism on the cell surface using Fourier transform infrared spectroscopy (FTIR). It was found that cell surface polysaccharides and proteins play an important role in cadmium binding. As shown in Figure 6a, the peaks at 1652.50, 1542.77, and 1383.64 cm−1 on the algal cell surface were weakened or disappeared, indicating the involvement of proteins and polysaccharides [31] in Cd complexation. 2D−FTIR−COS was employed to distinguish the major functional groups complex with Cd2+. The synchronous map (Figure 6b) showed that Cd2+ mainly affected the four major auto peaks at 1655, 1542, 1074, and 1053 cm−1. The color of two auto peaks of 1655 and 1542 cm−1 was darker than that of 1074 and 1053 cm−1, suggesting that the band intensities of 1655 cm−1 (protein C=O) and 1542 cm−1 (protein N−H) changed more significantly under a given Cd2+ concentration. The asynchronous map can determine the sequence of spectral intensity change with external perturbation. As shown in Figure 3c, 1655 and 1542 cm−1 changed first. In addition, the extracellular proteins were 4 to 8 times more abundant than the exopolysaccharides and both contents gradually increased under the stress of 5 and 10 mg L−1 Cd2+. (Figure 6d,e). The above results suggest that the carboxyl and amino groups of proteins play an important role in the complexation of Cd2+.

4. Discussion

This study explored how S. obliquus reacts to Cd2+ stress, examining morphological alterations, growth suppression, photosynthesis impact, antioxidant mechanisms, and cadmium adsorption and biosorption processes. Findings indicated that while low cadmium levels barely affected the algae, higher concentrations led to notable morphological transformations, decreased growth and photosynthetic rates, and triggered antioxidant defenses. High cadmium removal efficiency was achieved through biosorption and bioaccumulation at lower concentrations (<0.5 mg L−1), with biosorption becoming predominant at higher levels (≥0.5 mg L−1), facilitated by key roles of cell surface proteins and polysaccharides in cadmium binding. This study underscores S. obliquus’s sophisticated response to Cd2+ stress, emphasizing its bioremediation capabilities.
Heavy metal contamination of aquatic environments is a serious environmental problem. Cadmium levels in groundwater are as high as 0.005 mg L−1 [32]. Furthermore, contaminated systems can reach 1–7 mg L−1 [33]. For example, cadmium concentrations in contaminated water bodies in Adamawa State, Nigeria were as high as 1.481 mg L−1 [34]. In different types of industrial wastewater, cadmium concentrations ranged from 0.1 to 100 mg L−1 [35,36]. Therefore, we explored the bioremediation potential of S. obliquus across different cadmium concentrations.
The EC50 value indicates the concentration at which cell growth is 50% inhibited and is widely used as a toxicity index to compare the resistance/tolerance of microalgal species in the presence of specific metals. For example, the EC50 value of Desmodesmus pleiomorphus was 0.058 mg L−1 [37]. The EC50 values for four green algae, Ankistrodesmus fusiformis, Chlorella ellipsoidea, Monoraphidium contortum, and Scenedesmus acuminatus in the contaminated Matanza-Riachuelo River were 0.141 mg L−1, 0.429 mg L−1, 0.191 mg L−1and 0.397 mg L−1, respectively [38]. The EC50 for Planothidium lanceolatum and Parachlorella kessleri Bh-2 were found to be 0.25 mg L−1 [39] and 0.3 mg L−1 [40], respectively. In this study, the EC50 of S. obliquus was 0.41 ± 0.03 mg L−1, which meant that S. obliquus has a high tolerance to Cd2+ stress.
Toxic stress from cadmium decreases growth and PSII activity in phototrophic organisms [41]. Our findings confirmed that lower concentration (≤0.5 mg L−1) of Cd2+ had no significant effect on S. obliquus, but higher concentrations significantly reduced photosynthetic pigments. The replacement of Mg2+ with cadmium in the chlorophyll center disrupts photosynthesis [42,43,44], a mechanism confirmed by studies on cadmium-chlorophyll complexes [45]. At the same time, reactive oxygen species (ROS), a byproduct of chloroplast and mitochondrial metabolism, are produced in large quantities along with altered photosynthetic electron transport activity, indirectly affecting other metabolic activities [46]. Cells respond to this ROS accumulation by activating antioxidant defense mechanisms. Interestingly, low levels of cadmium stress did not induce oxidative stress in cells; however, as cadmium concentration rises, ROS accumulation accelerated, prompting cells to enhance the activity of antioxidant enzymes like SOD (superoxide dismutase) and CAT (catalase) to counteract ROS. Despite this, as cadmium concentration continues to increase, the rate of ROS production within cells escalated, and even with elevated antioxidant enzyme activity, it may not suffice to effectively scavenge the rapidly accumulating ROS. This challenge arises from the diverse nature of ROS, including superoxide anion, hydrogen peroxide, singlet oxygen, and hydroxyl radicals, each requiring specific antioxidant enzymes for neutralization [47]. Because each antioxidant (e.g., vitamin E, SOD, CAT, etc.) is selective for specific types of ROS, it may block one type of ROS but leave another unharmed [48]. In addition, the limited distribution of antioxidant enzymes within cells may hinder their access to ROS–producing sites, particularly within organelles like mitochondria and the chloroplast, which are the primary sites of ROS generation [49]. The total protein content of S. obliquus decreased with increasing Cd2+ concentration, likely due to the algae reallocating carbon fluxes to synthesize storage molecules such as carbohydrates and lipids to survive under stress. This protein decline may also result from a carbon skeleton shortage due to reduced photosynthesis. The reduced protein content further elucidates why enhanced enzyme activity alone may not be adequate to combat oxidative stress, as some antioxidant enzymes rely on the regeneration of small-molecule antioxidants (e.g., glutathione). The diminished protein content limits the regeneration of these antioxidants, meaning that even with increased enzyme activity, efficient and consistent ROS scavenging may not be achieved.
Morphological changes also confirmed the complex response of S. obliquus to Cd2+. Under low cadmium stress, S. obliquus formed coenobia. With increasing cadmium concentration, the cells gradually crumpled, the plasmalemma wall separated, and the cells converted to a unicellular structure and no longer formed coenobia, which may be because the unicellular morphology is more favorable for nutrient utilization and photocompetition [50]. This may also be because single cells provide more binding sites for the complexation of Cd2+ [51]. We also observed the rapid degradation of chloroplasts and mitochondria, the accumulation of electron-dense particles, and the production of starch granules under Cd2+ stress. The accumulation of starch granules is usually considered as a protection for cells under stress conditions [40]. Upon exposure to Cd2+, accumulating starch granules can serve as a cellular energy store following damage to chloroplasts and mitochondria. Therefore, the accumulation of intracellular starch and high electron density particles may be another effective detoxification method.
Due to the high tolerance of S. obliquus to cadmium, we investigated the algae’s capabilities for metal removal, adsorption, and accumulation, finding that S. obliquus exhibits high capacities for cadmium removal, adsorption, and accumulation. At initial exposure concentrations of 0.05 mg L−1, the cadmium removal efficiency reaches up to 98.6%, and even when the initial exposure concentration is increased to 10 mg L−1, the removal efficiency can still reach 67.6%. The study reported that the removal of Cd2+ by Chlorella vulgaris and Scenedesmus sp. at an initial concentration of 1 mg L−1 was 8.07% and 5.13%, respectively [52]. Scenedesmus sp. IITRIND2, under cultivation conditions with initial concentrations of 5, 10, and 25 mg L−1, achieved a Cd removal efficiency of 50–60% within four days [53]. This result suggested that the high removal efficiency of Cd by S. obliquus is a good algal resource for the bioremediation of heavy metals.
Biosorption and bioaccumulation are the two main mechanisms reported for metal removal in algae. At the highest initial cadmium concentration (10 mg L−1), S. obliquus was able to remove about 93.2% (9.32 mg L−1) of Cd2+ by cell surface adsorption within 24 h, Then, as time extended, the level of biosorption gradually decreased. In contrast to extracellular adsorption, the percentage of intracellular accumulation increased with the treatment time, reaching a peak of 83.5% of the initial concentration of 10 mg L−1 at 72 h. This result is higher than that of other algal species; for instance, studies on the removal of cadmium by Chlorella pyrenoidosa and Scenedesmus acutus found their removal efficiency to be 65.5% and 70.13%, respectively, but bioaccumulation only accounted for 3% and 1.5% of the total removal [54]. This study found that when the Cd concentration was below 0.5 mg L−1, S. obliquus removed Cd through a combination of adsorption and bioaccumulation. Conversely, cadmium removal was primarily through biosorption when the Cd2+ concentration was above 0.5 mg L−1.
The biosorption capacity was related to the properties of the EPS [55], with the polysaccharides and proteins in the EPS increased under metal stress, thereby enhancing metal adsorption [56,57]. Studies have shown that the exudates secreted by algae significantly reduce the content of free cadmium, that is, reducing the bioavailability of cadmium, thus affecting the accumulation and toxicity of cadmium in algae and other aquatic organisms [58]. Our study found that the content of proteins in EPS was several times higher than that of polysaccharides and increased under both 5 and 10 mg L−1 Cd2+ stress, indicating that under cadmium stress, algae attempt to secrete more EPS, including proteins and polysaccharides, to adsorb Cd on the cell surface, preventing metal ions from binding and being transported into the cell, thus protecting the cell from cadmium toxicity. FTIR spectra analysis confirmed that the functional groups such as C=O, C=C, and C–O–C on the cell surface of S. obliquus involved in the Cd biosorption and that proteins with C=O and N–H played a dominant role in EPS–Cd complexation. In this way, algae can effectively immobilize Cd2+ on the cell surface, reducing their concentration in the water body, as well as their bioavailability, thus playing an important role in the cadmium detoxification process.

5. Conclusions

Low concentration of Cd2+ (<0.5 mg L−1) had no significant effect on S. obliquus, as biosorption and bioaccumulation synergistically removed Cd2+. Higher concentrations of Cd2+ (≥0.5 mg L−1) inhibited the growth and photosynthetic electron transport of S. obliquus, leading to changes in cell morphology, such as the disappearance of mitochondria and deformation of chloroplasts. S. obliquus counters Cd toxicity through antioxidant defense, starch and high–density particle accumulation, and secretion of EPS, which binds Cd2+ to surface carboxyl and amino groups.

Supplementary Materials

The following supporting information can be downloaded at: https://www.mdpi.com/article/10.3390/toxics12040262/s1, Table S1: JIP parameter changes of S. obliquus treated with different concentrations of Cd2+ for 96 h (percentage relative to control); Table S2: S. obliquus cells were treated with different concentrations of Cd2+ for 96 h and relaxation of the flash-induced fluorescence yield with or without 20 μM DCMU was measured; Figure S1: A simplified Z-scheme of the light reactions of photosynthesis mimicking (Stirbet and Govindjee, 2011); Figure S2: Polyphasic chlorophyll a fluorescence induction kinetics (FI) profile of S. obliquus treated with different concentrations of Cd2+ for 96 h.

Author Contributions

Conceptualization, P.X. and X.T.; methodology, P.X. and X.T.; software, Z.A., P.X. and X.T.; validation, Z.A. and P.X.; formal analysis, P.X.; investigation, X.T. and Z.A.; resources, Y.B.; data curation, Z.A. and P.X.; writing-original draft preparation, P.X.; writing—review and editing, D.W., G.S. and Y.B.; visualization, P.X., X.T. and G.S.; supervision, W.M., G.S. and Y.B.; project administration, W.M. and Y.B.; funding acquisition, Y.B. All authors have read and agreed to the published version of the manuscript.

Funding

This work was funded by National Key Research and Development Project (No: 2020YFA0907402; No:2021YFC3200900) and National Natural Science Foundation of China (No:31971477).

Institutional Review Board Statement

Not applicable.

Informed Consent Statement

Not applicable.

Data Availability Statement

Data are contained within the article and Supplementary Materials.

Acknowledgments

The authors thank the Analysis and Testing Center, institute of hydrobiology for the help in the analysis of SEM and TEM.

Conflicts of Interest

The authors declare no conflict of interest.

References

  1. Chen, D.; Chen, D.; Xue, R.; Long, J.; Lin, X.; Lin, Y.; Jia, L.; Zeng, R.; Song, Y. Effects of boron, silicon and their interactions on cadmium accumulation and toxicity in rice plants. J. Hazard. Mater. 2019, 367, 447–455. [Google Scholar] [CrossRef] [PubMed]
  2. Zhu, H.; Ai, H.; Cao, L.; Sui, R.; Ye, H.; Du, D.; Sun, J.; Yao, J.; Chen, K.; Chen, L. Transcriptome analysis providing novel insights for Cd-resistant tall fescue responses to Cd stress. Ecotoxicol. Environ. Saf. 2018, 160, 349–356. [Google Scholar] [CrossRef] [PubMed]
  3. Tian, Q.; Wang, J.; Cui, L.; Zeng, W.; Qiu, G.; Hu, Q.; Peng, A.; Zhang, D.; Shen, L. Longitudinal physiological and transcriptomic analyses reveal the short term and long term response of Synechocystis sp. PCC6803 to cadmium stress. Chemosphere 2022, 303, 134727. [Google Scholar] [CrossRef]
  4. Shen, L.; Chen, R.; Wang, J.; Fan, L.; Cui, L.; Zhang, Y.; Cheng, J.; Wu, X.; Li, J.; Zeng, W. Biosorption behavior and mechanism of cadmium from aqueous solutions by Synechocystis sp. PCC6803. RSC Adv. 2021, 11, 18637–18650. [Google Scholar] [CrossRef] [PubMed]
  5. Zhu, Q.; Zhang, M.; Bao, J.; Liu, J. Physiological, metabolomic, and transcriptomic analyses reveal the dynamic redox homeostasis upon extended exposure of Dunaliella salina GY-H13 cells to Cd. Ecotoxicol. Environ. Saf. 2021, 223, 112593. [Google Scholar] [CrossRef] [PubMed]
  6. Volgusheva, A.; Todorenko, D.; Baizhumanov, A.; Chivkunova, O.; Solovchenko, A.; Antal, T. Cadmium- and chromium-induced damage and acclimation mechanisms in Scenedesmus quadricauda and Chlorella sorokiniana. J. Appl. Phycol. 2022, 34, 1435–1446. [Google Scholar] [CrossRef]
  7. Kováčik, J.; Babula, P.; Peterková, V.; Hedbavny, J. Long-term impact of cadmium shows little damage in Scenedesmus acutiformis cultures. Algal Res. 2017, 25, 184–190. [Google Scholar] [CrossRef]
  8. Zhu, Q.; Guo, S.; Wen, F.; Zhang, X.; Wang, C.; Si, L.; Zheng, J.; Liu, J. Transcriptional and physiological responses of Dunaliella salina to cadmium reveals time-dependent turnover of ribosome, photosystem, and ROS-scavenging pathways. Aquat. Toxicol. 2019, 207, 153–162. [Google Scholar] [CrossRef] [PubMed]
  9. Wei, L.; Li, J.; Xue, M.; Wang, S.; Li, Q.; Qin, K.; Jiang, J.; Ding, J.; Zhao, Q. Adsorption behaviors of Cu2+, Zn2+ and Cd2+ onto proteins, humic acid, and polysaccharides extracted from sludge EPS: Sorption properties and mechanisms. Bioresour. Technol. 2019, 291, 121868. [Google Scholar] [CrossRef]
  10. Li, M.; Ma, C.; Yin, X.; Zhang, L.; Tian, X.; Chen, Q.; Wang, L. Investigating trivalent chromium biosorption-driven extracellular polymeric substances changes of Synechocystis sp. PCC 7806 by parallel factor analysis (PARAFAC) analysis. Bioresour. Technol. Rep. 2019, 7, 100249. [Google Scholar] [CrossRef]
  11. Lavoie, M.; Le Faucheur, S.; Fortin, C.; Campbell, P.G.C. Cadmium detoxification strategies in two phytoplankton species: Metal binding by newly synthesized thiolated peptides and metal sequestration in granules. Aquat. Toxicol. 2009, 92, 65–75. [Google Scholar] [CrossRef] [PubMed]
  12. Ubando, A.T.; Africa, A.D.M.; Maniquiz-Redillas, M.C.; Culaba, A.B.; Chen, W.; Chang, J. Microalgal biosorption of heavy metals: A comprehensive bibliometric review. J. Hazard. Mater. 2021, 402, 123431. [Google Scholar] [CrossRef] [PubMed]
  13. Mangal, V.; Nguyen, T.Q.; Fiering, Q.; Guéguen, C. An untargeted metabolomic approach for the putative characterization of metabolites from Scenedesmus obliquus in response to cadmium stress. Environ. Pollut. 2020, 266, 115123. [Google Scholar] [CrossRef] [PubMed]
  14. Tu, X.; Xu, P.; Zhu, Y.; Mi, W.; Bi, Y. Molecular complexation properties of Cd2+ by algal organic matter from Scenedesmus obliquus. Ecotoxicol. Environ. Saf. 2023, 263, 115378. [Google Scholar] [CrossRef]
  15. Zhang, Z.; Yan, K.; Zhang, L.; Wang, Q.; Guo, R.; Yan, Z.; Chen, J. A novel cadmium-containing wastewater treatment method: Bio-immobilization by microalgae cell and their mechanism. J. Hazard. Mater. 2019, 374, 420–427. [Google Scholar] [CrossRef] [PubMed]
  16. Chen, B.Y.; Chen, C.Y.; Guo, W.Q.; Chang, H.W.; Chen, W.M.; Lee, D.J.; Huang, C.C.; Ren, N.Q.; Chang, J.S. Fixed-bed biosorption of cadmium using immobilized Scenedesmus obliquus CNW-N cells on loofa (Luffa cylindrica) sponge. Bioresour. Technol. 2014, 160, 175–181. [Google Scholar] [CrossRef] [PubMed]
  17. Tripathi, S.; Arora, N.; Pruthi, V.; Poluri, K.M. Elucidating the bioremediation mechanism of Scenedesmus sp. IITRIND2 under cadmium stress. Chemosphere 2021, 283. [Google Scholar] [CrossRef] [PubMed]
  18. Rippka, R.; Deruelles, J.; Waterbury, J.B.; Herdman, M.; Stanier, R.Y. Generic assignments, strain histories and properties of pure cultures of Cyanobacteria. Microbiology 1979, 111, 1–61. [Google Scholar] [CrossRef]
  19. Wu, G.; Cheng, J.; Wei, J.; Huang, J.; Sun, Y.; Zhang, L.; Huang, Y.; Yang, Z. Growth and photosynthetic responses of Ochromonas gloeopara to cadmium stress and its capacity to remove cadmium. Environ. Pollut. 2021, 273, 116496. [Google Scholar] [CrossRef]
  20. Fan, P.; Xu, P.; Zhu, Y.; Tu, X.; Song, G.; Zuo, Y.; Bi, Y. Addition of humic acid accelerates the growth of Euglena pisciformis AEW501 and the accumulation of lipids. J. Appl. Phycol. 2022, 34, 51–63. [Google Scholar] [CrossRef]
  21. Li, C.; Zheng, C.; Fu, H.; Zhai, S.; Hu, F.; Naveed, S.; Zhang, C.; Ge, Y. Contrasting detoxification mechanisms of Chlamydomonas reinhardtii under Cd and Pb stress. Chemosphere 2021, 274, 129771. [Google Scholar] [CrossRef] [PubMed]
  22. Wilde, A.; Hartel, H.; Hubschmann, T.; Hoffmann, P.; Shestakov, S.V.; Borner, T. Inactivation of a Synechocystis sp. strain PCC-6803 gene with homology to conserved chloroplast open reading frame-184 increases the photosystem-II-to-photosystem-I ratio. Plant Cell 1995, 7, 649–658. [Google Scholar] [CrossRef] [PubMed]
  23. Zhang, X.; Ma, F.; Zhu, X.; Zhu, J.Y.; Rong, J.F.; Zhan, J.; Chen, H.; He, C.L.; Wang, Q. The acceptor side of Photosystem II is the initial target of nitrite stress in Synechocystis sp. strain PCC 6803. Appl. Environ. Microb. 2017, 83. [Google Scholar] [CrossRef] [PubMed]
  24. Stirbet, A.; Govindjee. On the relation between the Kautsky effect (chlorophyll a fluorescence induction) and Photosystem II: Basics and applications of the OJIP fluorescence transient. J. Photochem. Photobiol. B Biol. 2011, 104, 236–257. [Google Scholar] [CrossRef]
  25. Beauchemin, R.; Gauthier, A.; Harnois, J.; Boisvert, S.; Govindachary, S.; Carpentier, R. Spermine and spermidine inhibition of photosystem II: Disassembly of the oxygen evolving complex and consequent perturbation in electron donation from TyrZ to P680+ and the quinone acceptors QA− to QB. Biochim. Biophys. Acta (BBA)-Bioenerg. 2007, 1767, 905–912. [Google Scholar] [CrossRef] [PubMed]
  26. Zhang, S.; Yu, R.; Yu, D.; Chang, P.; Guo, S.; Yang, X.; Liu, X.; Xu, C.; Hu, Y. The calcium signaling module CaM–IQM destabilizes IAA–ARF interaction to regulate callus and lateral root formation. Proc. Natl. Acad. Sci. USA 2022, 119, e2092298177. [Google Scholar] [CrossRef]
  27. Rogatsky, E. Pandora box of BCA assay. Investigation of the accuracy and linearity of the microplate bicinchoninic protein assay: Analytical challenges and method modifications to minimize systematic errors. Anal. Biochem. 2021, 631, 114321. [Google Scholar] [CrossRef]
  28. Aranda, A.; Sequedo, L.; Tolosa, L.; Quintas, G.; Burello, E.; Castell, J.V.; Gombau, L. Dichloro-dihydro-fluorescein diacetate (DCFH-DA) assay: A quantitative method for oxidative stress assessment of nanoparticle-treated cells. Toxicol. Vitr. 2013, 27, 954–963. [Google Scholar] [CrossRef]
  29. Xie, Q.; Liu, N.; Lin, D.; Qu, R.; Zhou, Q.; Ge, F. The complexation with proteins in extracellular polymeric substances alleviates the toxicity of Cd (II) to Chlorella vulgaris. Environ. Pollut. 2020, 263, 114102. [Google Scholar] [CrossRef]
  30. DuBois, M.; Gilles, K.A.; Hamilton, J.K.; Rebers, P.A.; Smith, F. Colorimetric method for setermination of sugars and related substances. Anal. Chem. 1956, 28, 350–356. [Google Scholar] [CrossRef]
  31. Wang, B.; Liu, X.; Chen, J.; Peng, D.; He, F. Composition and functional group characterization of extracellular polymeric substances (EPS) in activated sludge: The impacts of polymerization degree of proteinaceous substrates. Water Res. 2018, 129, 133–142. [Google Scholar] [CrossRef] [PubMed]
  32. Kubier, A.; Wilkin, R.T.; Pichler, T. Cadmium in soils and groundwater: A review. Appl. Geochem. 2019, 108, 104388. [Google Scholar] [CrossRef] [PubMed]
  33. Terry, P.A.; Stone, W. Biosorption of cadmium and copper contaminated water by Scenedesmus abundans. Chemosphere 2002, 47, 249–255. [Google Scholar] [CrossRef] [PubMed]
  34. Seiyaboh, E.; Izah, S.; Oweibi, S. Assessment of water quality from Sagbama Creek, Niger Delta, Nigeria. Biotechnol. Res. 2017, 3, 20–24. [Google Scholar]
  35. Malea, P.; Kevrekidis, T.; Chatzipanagiotou, K.; Mogias, A. Cadmium uptake kinetics in parts of the seagrass Cymodocea nodosa at high exposure concentrations. J. Biol. Res.-Thessal. 2018, 25, 5. [Google Scholar] [CrossRef] [PubMed]
  36. Plöhn, M.; Escudero-Oñate, C.; Funk, C. Biosorption of Cd(II) by Nordic microalgae: Tolerance, kinetics and equilibrium studies. Algal Res. 2021, 59, 102471. [Google Scholar] [CrossRef]
  37. Monteiro, C.M.; Castro, P.; Malcata, F.X. Cadmium removal by two strains of Desmodesmus pleiomorphus cells. Water Air Soil Pollut. 2010, 208, 17–27. [Google Scholar] [CrossRef]
  38. Magdaleno, A.; Vélez, C.G.; Wenzel, M.T.; Tell, G. Effects of cadmium, copper and zinc on growth of four isolated algae from a highly polluted Argentina River. Bull. Environ. Contam. Toxicol. 2014, 92, 202–207. [Google Scholar] [CrossRef] [PubMed]
  39. Perales-Vela, H.V.; Peña-Castro, J.M.; Cañizares-Villanueva, R.O. Heavy metal detoxification in eukaryotic microalgae. Chemosphere 2006, 64, 1–10. [Google Scholar] [CrossRef]
  40. Bauenova, M.O.; Sadvakasova, A.K.; Mustapayeva, Z.O.; Kokociński, M.; Zayadan, B.K.; Wojciechowicz, M.K.; Balouch, H.; Akmukhanova, N.R.; Alwasel, S.; Allakhverdiev, S.I. Potential of microalgae Parachlorella kessleri Bh-2 as bioremediation agent of heavy metals cadmium and chromium. Algal Res. 2021, 59, 102463. [Google Scholar] [CrossRef]
  41. León-Vaz, A.; León, R.; Giráldez, I.; Vega, J.M.; Vigara, J. Impact of heavy metals in the microalga Chlorella sorokiniana and assessment of its potential use in cadmium bioremediation. Aquat. Toxicol. 2021, 239, 105941. [Google Scholar] [CrossRef] [PubMed]
  42. Wang, S.; Wufuer, R.; Duo, J.; Li, W.; Pan, X. Cadmium caused different toxicity to Photosystem I and Photosystem II of freshwater unicellular algae Chlorella pyrenoidosa (Chlorophyta). Toxics 2022, 10, 352. [Google Scholar] [CrossRef] [PubMed]
  43. Küpper, H.; Šetlík, I.; Spiller, M.; Küpper, F.C.; Prášil, O. Heavy metal—Induced inhibition of photosynthesis: Targets of in vivo heavy metal chlorophyll formation1. J. Phycol. 2002, 38, 429–441. [Google Scholar] [CrossRef]
  44. Küpper, H.; Küpper, F.C.; Spiller, M. [Heavy metal]-chlorophylls formed in vivo during heavy metal stress and degradation products formed during digestion, extraction and storage of plant material. In Chlorophylls and Bacteriochlorophylls: Biochemistry, Biophysics, Functions and Applications; Grimm, B., Porra, R.J., Rüdiger, W., Scheer, H., Eds.; Springer: Dordrecht, The Netherlands, 2006; pp. 67–77. [Google Scholar]
  45. Grajek, H.; Rydzyński, D.; Piotrowicz-Cieślak, A.; Herman, A.; Maciejczyk, M.; Wieczorek, Z. Cadmium ion-chlorophyll interaction—Examination of spectral properties and structure of the cadmium-chlorophyll complex and their relevance to photosynthesis inhibition. Chemosphere 2020, 261, 127434. [Google Scholar] [CrossRef] [PubMed]
  46. Ismaiel, M.M.S.; Said, A.A. Tolerance of Pseudochlorella pringsheimii to Cd and Pb stress: Role of antioxidants and biochemical contents in metal detoxification. Ecotoxicol. Environ. Saf. 2018, 164, 704–712. [Google Scholar] [CrossRef] [PubMed]
  47. Lennicke, C.; Cochemé, H.M. Redox metabolism: ROS as specific molecular regulators of cell signaling and function. Mol. Cell 2021, 81, 3691–3707. [Google Scholar] [CrossRef] [PubMed]
  48. Murphy, M.P.; Holmgren, A.; Larsson, N.; Halliwell, B.; Chang, C.J.; Kalyanaraman, B.; Rhee, S.G.; Thornalley, P.J.; Partridge, L.; Gems, D.; et al. Unraveling the Biological Roles of Reactive Oxygen Species. Cell Metab. 2011, 13, 361–366. [Google Scholar] [CrossRef] [PubMed]
  49. Castro, B.; Citterico, M.; Kimura, S.; Stevens, D.M.; Wrzaczek, M.; Coaker, G. Stress-induced reactive oxygen species compartmentalization, perception and signalling. Nat. Plants 2021, 7, 403–412. [Google Scholar] [CrossRef] [PubMed]
  50. Dong, J.; Gao, Y.; Chang, M.; Ma, H.; Han, K.; Tao, X.; Li, Y. Colony formation by the green alga Chlorella vulgaris in response to the competitor Ceratophyllum demersum. Hydrobiologia 2018, 805, 177–187. [Google Scholar] [CrossRef]
  51. Yang, Z.; Liu, Y.; Ge, J.; Wang, W.; Chen, Y.; Montagnes, D. Aggregate formation and polysaccharide content of Chlorella pyrenoidosa Chick (Chlorophyta) in response to simulated nutrient stress. Bioresour. Technol. 2010, 101, 8336–8341. [Google Scholar] [CrossRef]
  52. Duque, D.; Montoya, C.; Botero, L.R. Cadmium (Cd) tolerance evaluation of three strains of microalgae of the genus Ankistrodesmus, Chlorella and Scenedesmus. Rev. Fac. Ing. Univ. Antioq. 2019, 88–95. [Google Scholar] [CrossRef]
  53. Naveed, S.; Yu, Q.; Zhang, C.; Ge, Y. Extracellular polymeric substances alter cell surface properties, toxicity, and accumulation of arsenic in Synechocystis PCC6803. Environ. Pollut. 2020, 261, 114233. [Google Scholar] [CrossRef] [PubMed]
  54. Chandrashekharaiah, P.S.; Sanyal, D.; Dasgupta, S.; Banik, A. Cadmium biosorption and biomass production by two freshwater microalgae Scenedesmus acutus and Chlorella pyrenoidosa: An integrated approach. Chemosphere 2021, 269, 128755. [Google Scholar] [CrossRef] [PubMed]
  55. Baker, M.G.; Lalonde, S.V.; Konhauser, K.O.; Foght, J.M. Role of extracellular polymeric substances in the surface chemical reactivity of Hymenobacter aerophilus, a psychrotolerant bacterium. Appl. Environ. Microb. 2010, 76, 102–109. [Google Scholar] [CrossRef]
  56. Teng, Z.; Shao, W.; Zhang, K.; Huo, Y.; Zhu, J.; Li, M. Pb biosorption by Leclercia adecarboxylata: Protective and immobilized mechanisms of extracellular polymeric substances. Chem. Eng. J. 2019, 375, 122113. [Google Scholar] [CrossRef]
  57. Gao, X.; Deng, R.; Lin, D. Insights into the regulation mechanisms of algal extracellular polymeric substances secretion upon the exposures to anatase and rutile TiO2 nanoparticles. Environ. Pollut. 2020, 263, 114608. [Google Scholar] [CrossRef]
  58. Koukal, B.; Rossé, P.; Reinhardt, A.; Ferrari, B.; Wilkinson, K.J.; Loizeau, J.; Dominik, J. Effect of Pseudokirchneriella subcapitata (Chlorophyceae) exudates on metal toxicity and colloid aggregation. Water Res. 2007, 41, 63–70. [Google Scholar] [CrossRef]
Figure 1. Morphology of S. obliquus treated with different concentrations of Cd2+: (a) SEM images with control, (b) SEM images of 0.05 mg L−1 Cd2+ treatment for 48 h; (c) SEM images of 10 mg L−1 Cd2+ treatment for 48 h; (d) SEM images of 0.05 mg L−1 Cd2+ treatment for 96 h; (e) SEM images of 10 mg L−1 Cd2+ treated 96 h; (f,i) TEM images with control; (g,j): TEM images of 0.05 mg L−1 Cd2+ treated 96 h; (h,k) TEM images of 10 mg L−1 Cd2+ treated 96 h. The alphabets in the image depict CW: cell wall, CM: cell membrane, C: chloroplast, M: mitochondrion, Py: Pyrenoid, and S: starch granules.
Toxics 12 00262 g001
Figure 2. Effects of exposure to different concentrations of Cd2+ for 96 h on the growth and pigments of S. obliquus: (a) growth curves of S. obliquus on media with different Cd2+ concentrations, (b) Chl a content after 0, 24, 48, 72, 96 h incubation, (c) Chl b content after 0, 24, 48, 72, 96 h incubation, (d) The dose–effect curve for 96 h after exposure to different concentrations of Cd2+ in S. obliquus. Each data point is mean ± SE of three replicates.
Toxics 12 00262 g002
Figure 3. Effects of exposure to different concentrations of Cd at 96 h on photosynthesis and respiration of S. obliquus: (a) oxygen evolution rate, (b) respiration consumption rate, (c) relative variable fluorescence curve, (d) JIP test parameters, (e) QA reoxidation kinetic curves: fluorescence decay in the absence of DCMU, (f) fluorescence decay in the presence of 20 μM DCMU. Each data point is mean ± SE of three replicates. Different letters above columns represent statistically significant differences, p < 0.05.
Toxics 12 00262 g003
Figure 4. Effects of exposure to different concentrations of Cd2+ at 96 h on the antioxidant system of S. obliquus: (a) protein content, (b) ROS, (c) superoxide dismutase (SOD) activity, and (d) catalase (CAT) activity. Each data point is mean ± SE of three replicates. Different letters above columns represent statistically significant differences, p < 0.05.
Toxics 12 00262 g004
Figure 5. Effect of exposure to different concentrations of Cd2+ on the distribution of cadmium on the cell surface, intracellular, and in the medium of S. obliquus: (a) total Cd levels removed by cells over time; (b) Cd levels adsorbed on the cell surface over time; and (c) Cd levels accumulated intracellularly over time. Each data point is the mean ± SE of three replicates.
Toxics 12 00262 g005
Figure 6. Effects of exposure to different concentrations of Cd2+ on the functional groups on the cell surface of S. obliquus: (a) Fourier infrared spectroscopy, (b) synchronous 2D–FTIR–COS map, (c) asynchronous 2D–FTIR–COS map, (d) polysaccharide content of EPS polysaccharides, (e) protein content of EPS. The red and blue dots represent positive and negative correlations, respectively. Higher color intensity indicates a stronger positive or negative correlation. Each data point in the histogram is the mean ± SE of three replicate samples. Different letters above columns represent statistically significant differences, p < 0.05.
Toxics 12 00262 g006
Table 1. Formulae and terms used in the analysis of the O–J–I–P fluorescence induction dynamics curve.
Formulae and TermsIllustrations
FoMinimal record fluorescence intensity
FmMaximal recorded fluorescence intensity
Mo = 4   ( F 300 μ s F O )   /   ( Fm Fo ) Approximated initial slope of the fluorescence transient
Sm = ( Area   )   / ( Fm     Fo ) Normalized total complementary area above the O-J-I-P transie (reflecting single-turnover QA reduction events)
NThe number of times QA was restored from the time illumination began until Fm arrived.
φ Po = 1 Fo / Fm Maximum quantum yield for primary photochemistry (at t = 0)
ψ o = 1 Vj The probability that a trapped exciton moves an electron into the electron
transport chain beyond QA (at t = 0)
φ E o = 1 Fo / Fm · ψ o Quantum yield for electron transport (at t = 0)
φ D o = 1 φ P o Quantum yield for dissipated energy (at t = 0)
ABS / RC = Mo · ( 1 / Vj ) · ( 1 / φ P o ) Absorption flux per RC
DIo / RC = ABS / RC TRo / RC Dissipated energy flux per RC (at t = 0)
TRo / RC = Mo · ( 1 / Vj ) Trapped energy flux per RC (at t = 0)
ETo / RC = Mo · ( 1 / Vj ) · ψ o Electron transport flux per RC (at t = 0)
ABS / CSo Fo Absorption flux per CS (at t = 0)
TRo / CSo = φ p o · ( ABS / CSo ) Trapped energy flux per CS (at t = 0)
EToCSo = φ E o · ( ABS / CSo ) Electron transport flux per CS (at t = 0)
DIo / CSo = ABS / CSo TRo / CSo Dissipated energy flux per CS (at t = 0)
RC / CSo = φ P o · ( Vj / Mo ) · ( ABS / CSo ) Density of RCs (QA reducing PSII reaction centers)
PI ABS = ( RC / ABS ) · φ P o / ( 1 φ P o ) · ψ o / 1 ψ o Performance index on absorption basis
Disclaimer/Publisher’s Note: The statements, opinions and data contained in all publications are solely those of the individual author(s) and contributor(s) and not of MDPI and/or the editor(s). MDPI and/or the editor(s) disclaim responsibility for any injury to people or property resulting from any ideas, methods, instructions or products referred to in the content.

