Abstract
Toxic algae in eutrophic lakes produce cyanotoxic microcystins. Prior research on the effect of microcystin-LR in the kidney utilized intraperitoneal injections, which did not reflect natural exposure. Oral microcystin-LR research has focused on renal function and histopathology without examining the molecular mechanisms. The present study aimed to evaluate the mechanism of microcystin-LR in the kidneys via oral administration in WKAH/HkmSlc rats over 7 weeks, alongside stimulation of the proximal tubular cells. Although there were no differences in the concentrations of plasma albumin, blood urea nitrogen, and creatinine, which are parameters of renal function, between the control and microcystin-LR-administrated rats, prorenin expression was significantly increased in the renal cortex of the rats administered microcystin-LR and the microcystin-LR-treated proximal tubular cells. The expression levels of (pro)renin receptor (PRR), transforming growth factor-β1 (TGFβ1), and α-smooth muscle actin (α-SMA) in the renal cortex did not differ significantly between the control and microcystin-LR-administered rats. However, the expression levels of prorenin were significantly positively correlated with those of PRR, TGFβ1, and α-SMA in the renal cortex of rats administered microcystin-LR. Additionally, a significant positive correlation was observed between the expression levels of TGFβ1 and α-SMA. Collectively, increased prorenin expression caused by the long-term consumption of microcystin-LR may initiate a process that influences renal fibrosis and abnormal renal function by regulating the expression levels of PRR, TGFβ1, and α-SMA.
1. Introduction
The development of harmful algal blooms in surface waters is caused by eutrophication [1]. Eutrophication is often associated with cyanobacterial species such as Anabaena, Anabaenopsis, Aphanocapsa, Cichlidium, Fischerella, Gloeotrichia, Microcystis, Nodularia, Nostoc, Oscillatoria, and Planktothrix [2,3,4,5,6]. Additionally, Spirulina, Synechococcus, and Trichodesmium have been identified as marine cyanobacteria [7,8,9,10,11]. The exponential growth in cyanobacteria leads to the production of secondary metabolites, specifically cyanotoxins [4,5,6,12]. Microcystins are a type of cyanotoxin that are found all over the world and have become a major health issue globally. These toxins are produced by cyanobacteria and are the only ones for which the World Health Organization (WHO) has established specific guidelines for safe drinking water levels [5,6]. There are 279 different types of microcystins, of which microcystin-LR is the most studied and the most commonly identified in the environment [4,5,6]. This particular microcystin variant makes up 46–99.8% of the total microcystin concentration in natural waters [13,14].
To evaluate the distribution of microcystin-LR in the body, 125I-microcystin-LR was injected intravenously, intraperitoneally, and orally into mice, and microcystin-LR was mainly distributed in the blood, liver, and kidneys [15]. In addition, Wistar rats intravenously injected with extracted microcystins showed higher levels of microcystins in the kidneys than in the liver [16]. These findings suggested that the kidney, as well as the liver, is a specific target organ for microcystin-LR. Epidemiological studies on nephrotoxicity induced by microcystins have documented a high prevalence of chronic kidney disease (CKD) in the Girandurukotte region of Sri Lanka, possibly because of microcystin contamination of well water [17,18]. A positive correlation between serum microcystins and abnormal renal function indicators among fishermen in Lake Chaohu, China, suggested that microcystins are involved in abnormal renal function [18,19]. A cross-sectional study conducted in Southwest China suggested that consumption of drinking water and aquatic products is one of the significant risk factors for abnormal renal function [18,20]. The above reports suggest that the consumption of drinking water and aquatic products contaminated with microcystin-LR is one of the most significant risk factors for abnormal renal function.
Renal fibrosis, characterized by tubulointerstitial fibrosis, in which the renal tubules undergo fibrosis, and which is recognized as the terminal stage in the development of end-stage kidney disease, is a crucial contributor to the pathogenesis of CKD [21,22,23]. Among the various mediators of renal fibrosis, transforming growth factor-β1 (TGFβ1) is a representative molecule that plays a central role in this process [23,24], particularly by activating the promoter region of α-smooth muscle actin (α-SMA) in renal fibrosis [25], resulting in increased α-SMA expression [25,26]. The induction of TGFβ1 is thought to be mediated by intrarenal activation of the renin–angiotensin system, which consists of angiotensinogen (AGT), the precursor of angiotensin II (Ang II), and the proteases renin and angiotensin-converting enzyme (ACE), along with associated locally produced Ang II [23,27]. However, there is also an alternative Ang II-independent pathway that contributes to renal fibrosis by involving the renin–angiotensin system. Prorenin, a precursor of renin, enhances its activity by binding to the (pro)renin receptor (PRR), and is not only involved in increasing the production of Ang I, a precursor of Ang II [28], but also promotes fibrosis of rat proximal tubular cells without angiotensin II signaling [29]. In addition, transgenic rats overexpressing human PRR show increased activation of mitogen-activated protein kinases (MAPs) and TGFβ1 expression, independent of AngII signaling [30]. This implies that the increased intracellular signaling pathway triggered by prorenin can contribute to renal fibrosis. Therefore, increased renal prorenin expression is considered to upregulate TGFβ1 and α-SMA expression by activating their respective intracellular signaling pathways through Ang II production and binding to PRR. That is, there is a strong possibility that the expression levels of prorenin, TGFβ1, and α-SMA are positively correlated.
Most previous reports on microcystin-LR in the kidney using rodents have relied on data from intraperitoneal injections [18,31,32]. However, an intraperitoneal injection is a route of exposure that is not representative of normal environmental conditions, since exposure to microcystins usually occurs through consuming contaminated drinking water and eating aquatic plants, fish, crops, and vegetables [33,34,35]. One non-intraperitoneal study reported on the oral administration of microcystin-LR to mice for 3 and 6 months. This study focused on renal function indices and histopathological observations of the kidneys, with no discussion of the underlying molecular mechanisms [18,36]. The transition from healthy kidneys to the onset of abnormal renal function is thought to be preceded by changes in gene expression prior to the onset of plasma parameters indicative of abnormal renal function and the emergence of histological modifications in the kidney. For instance, although previous findings have shown that albuminuria precedes the onset of abnormal renal function in patients with diabetes [37], prorenin expression is sometimes elevated before albuminuria is detected [38,39,40,41]. That is, it is possible for renal prorenin expression to increase even in the absence of any abnormalities in the plasma parameters that reflect renal function. Furthermore, increased prorenin expression has been found to be correlated with the development and progression of diabetic nephropathy [38,39,40,41]. Based on the above, rats orally administered microcystin-LR for 7 weeks, approximately half of the previously reported 3-month treatment period [18,36], were expected to show changes that would help to elucidate the molecular mechanisms involved in the progressive decline of renal function.
To explore the potential action mechanism of microcystin-LR in the kidney, the present study aimed to analyze whether rats orally administered microcystin-LR for 7 weeks would show changes in the expression of renal renin–angiotensin system-related and fibrosis-related genes involved in abnormal renal function. The concentrations of plasma albumin, blood urea nitrogen (BUN), and creatinine, indicators of kidney function, were also evaluated.
2. Materials and Methods
2.1. Materials and Reagents
Microcystin-LR, aprotinin, penicillin–streptomycin solution (×100), ITS-G Supplement (×100), and Dulbecco’s modified Eagle’s medium (DMEM)/F12 (Wako Pure Chemical Industries Ltd., Osaka, Japan); Heparin (Nacalai Tesque Inc., Kyoto, Japan); Trypsin-EDTA (Grand Island, NY, USA); Fetal bovine serum (FBS; Biosera, Nuaillé, France).
2.2. Animal Experiments
The Animal Care and Use Committee of Shimane University approved all animal experiments and procedures (protocol codes: MA28-1 and MA31-3), which were executed in accordance with the Institutional Regulations of Shimane University and complied with the Act on Welfare and Management of Animals (Act No. 105) and relevant standards and guidelines in Japan. Since the levels of female hormones in the blood vary among individuals based on their menstrual cycles, it is possible that the levels of other hormones in the blood and the function of organs and tissues may also exhibit individual differences. Therefore, males with no menstrual cycle were used in the present study. Five-week-old male wild-type (WKAH/HkmSlc) rats (Japan SLC, Inc., Hamamatsu, Japan) were housed individually in plastic cages in an air-conditioned room maintained at 22 ± 2 °C with 55 ± 5% humidity under an automated light cycle (lights on at 08:00 and off at 20:00). The rats were fed an AIN-93G diet without t-butylhydroquinone and deionized water ad libitum. After a week of acclimation, the rats were divided into the control and experimental groups, each comprising 11 individuals, and provided with unrestricted access to either deionized water (control group) or microcystin-LR (10 μg/L) in deionized water for 7 weeks [42]. The concentration of microcystin-LR utilized in this study corresponded to the highest level of microcystin detected in the final drinking water at the Celina plant, and in plants grown for consumption that received water sourced from Lake Erie and other locations in Ohio and neighboring states [4]. Following the treatment period, the abdominal aorta blood of rats was collected using a syringe containing heparin (final concentration of 50 U/mL blood) and aprotinin (final concentration of 500 kIU/mL blood) under anesthesia with 5% isoflurane for induction and 2% for maintenance via a nose cone. Plasma was prepared by centrifuging the collected abdominal aorta blood at 2000× g for 10 min at 4 °C. Prepared plasma and collected kidneys were stored at −80 °C until analysis.
2.3. Measurements of Albumin, Blood Urea Nitrogen, and Creatinine
Plasma concentrations of albumin, BUN, and creatinine were measured by Oriental Yeast Co., Ltd. (Tokyo, Japan).
2.4. Cell Culture
HK-2 cells derived from human proximal tubular cells (ATCC, Manassas, VA, USA) were cultured according to previously established protocols [26,43]. Briefly, the HK-2 cells were grown in DMEM/F12 medium supplemented with 10% FBS, ITS-G Supplement, 100 U/mL penicillin, and 100 μg/mL streptomycin at 37 °C in a 5% CO2 atmosphere. The cells were seeded (3 × 10⁵/dish) in 3.5 cm dishes and then incubated in serum-free DMEM/F12 for 24 h prior to all experiments. Dimethyl sulfoxide (DMSO, final concentration of 0.1% v/v) was used as the control and vehicle for microcystin-LR.
2.5. Quantitative Real-Time PCR
Serum-starved HK-2 cells were stimulated with or without microcystin-LR (10 nM) for various durations. Total RNA was extracted from the HK-2 cells and the kidneys were scraped using Sepasol-RNA I Super G (Nacalai Tesque Corporation, Kyoto, Japan) and RNeasy Mini Kits (QIAGEN, Hilden, Germany), respectively. For subsequent manipulations, gene expression levels were quantitatively assessed using established methods [44,45,46]. The oligonucleotide primers that were used are listed in Table 1. Amplicons were quantified based on a calibration curve of known DNA concentrations, and quantitation cycle (Cq) values were plotted against log sample concentrations. The mRNA expression was determined as the ratio of rat or human ribosomal protein lateral stalk subunit P0 (RPLP0) mRNA, which served as an internal standard.

Table 1.
Forward (Fw) and reverse (Rv) primers for target genes.
2.6. Statistical Analysis
The results were reported as the mean ± standard error (SE) because SE allows for interval estimation of the population mean. Data were analyzed for normality, followed by the Mann–Whitney U test if they did not follow a normal distribution (Table 2 [kidney weight and albumin] and Figure 1D). Conversely, when the data followed a normal distribution, the Student’s t-test was used when the variances of the two groups were assumed to be equal (Table 2 [BUN and creatinine], Figure 1B,C, Figures 3A,B, and 6). On the other hand, the Welch’s t-test was employed when the variances of the two groups were assumed to be unequal (Figure 1A). Pearson correlations were used for correlation analysis (Figures 2A–C, 3C, 4, and 5). Statistical analyses were performed using Excel 2011 (Microsoft Corp., Redmond, WA, USA) and Statcel 4 (OMS Publishing Co., Saitama, Japan). Statistical significance was set at p < 0.05.
Table 2.
Kidney weights and plasma parameters in the control and microcystin-LR-administered rats after 7 weeks.
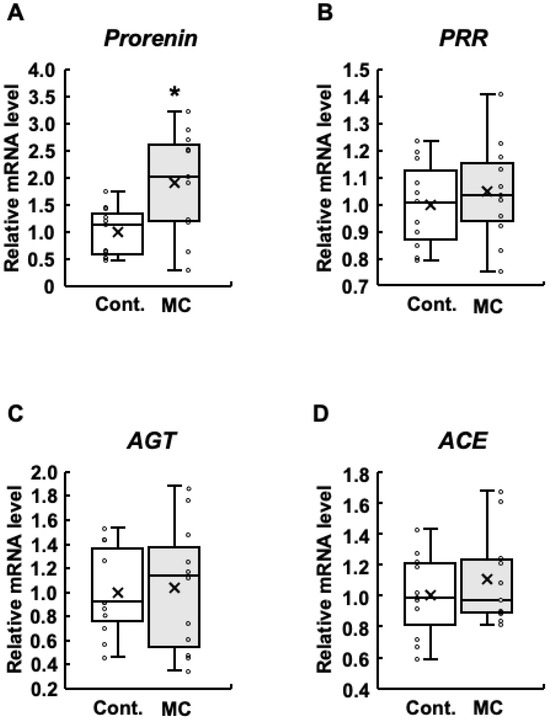
Figure 1.
Expression of renin–angiotensin system-related genes in the renal cortex of rats. The expression of prorenin (A), PRR (B), AGT (C), and ACE (D) in the renal cortex was assessed using real-time PCR. Boxplots, which display the average, median, 25th, and 75th percentiles as boxes and the minimum and maximum values as whiskers, were used to show the results for both the control and microcystin-LR-administered rats. Cont.: control (n = 11); MC: microcystin-LR (n = 11); Circle: individual mRNA level; Cross: mean value. * p < 0.05 vs. control.
3. Results
3.1. The Effect of Administering Microcystin-LR to Rats for 7 Weeks on Renal Function
Using rats that were noninvasively exposed to environmentally relevant concentrations of microcystin-LR (10 µg/L) [4] in ad libitum drinking water for 7 weeks [42], the present study examined the impact on renal status. In addition to the lack of differences in body weight and food intake between the control and microcystin-LR-administered rats [39], there were no differences in the kidney weight and the concentrations of plasma albumin, BUN, and creatinine, which are parameters of renal function, between the two groups (Table 2). These results indicated that prolonged environmental exposure to microcystin-LR for 7 weeks does not induce significantly abnormal renal function.
3.2. The Influence of Administering Microcystin-LR to Rats for 7 Weeks on the Expression Levels of Genes Associated with the Renin–Angiotensin System in the Renal Cortex
In patients with diabetes, increased prorenin expression appears prior to the onset of albuminuria, which is typically observed before a decline in renal function and is positively associated with the development and progression of diabetic nephropathy [38,39,40,41]. In addition, increased expression of renin–angiotensin system-related genes is involved in abnormal renal function [23]. Based on these reports, we examined the expression levels of prorenin, PRR, AGT, and ACE in the renal cortex. The expression levels of prorenin were significantly increased in rats orally administered microcystin-LR compared to those in the control group (Figure 1A). In addition, the maximum, upper quartile, median, lower quartile, and mean values were also higher in the rats orally administered microcystin-LR (Figure 1A). The results for PRR were similar to those for prorenin, although no significant increase in expression levels was observed (Figure 1B). AGT had higher maximum and median values (Figure 1C), and ACE had higher maximum, minimum, and mean values in rats orally administered microcystin-LR (Figure 1D). Taken together, prorenin expression was significantly and markedly increased in the renal cortex of rats orally administered microcystin-LR.
3.3. The Correlation between the Expression Levels of Prorenin and PRR, AGT, or ACE Following Microcystin-LR Administration to Rats for 7 Weeks
Although there was no significant difference in PRR expression between the control and microcystin-LR-administered rats, the pattern of PRR expression was similar to that of prorenin expression (Figure 1). Therefore, we examined the correlation between the expression levels of prorenin and other renin–angiotensin system-related genes, including PRR. Figure 2A shows that the expression levels of prorenin and PRR were significantly and positively correlated in the renal cortex of rats orally administered microcystin-LR (r = 0.56, p = 0.02). In contrast, the expression levels of prorenin and AGT were significantly and inversely correlated in the renal cortex of rats orally administered microcystin-LR (r = −0.62, p = 0.04) (Figure 2B). The expression levels of prorenin and ACE tended to be inversely correlated in the renal cortex of rats orally administered microcystin-LR (r = 0.60, p = 0.05) (Figure 2B). Taken together with the report that prorenin induces increased PRR expression in rat renal proximal tubule cells [29], these results suggested that prolonged environmental exposure to microcystin-LR is involved in changing the regulation of intracellular gene expression by increasing prorenin expression, which may lead to an increase in PRR expression in the future. In addition, elevated prorenin expression and prolonged environmental exposure to microcystin-LR might also affect the expression levels of AGT and ACE in rats orally administered microcystin-LR.
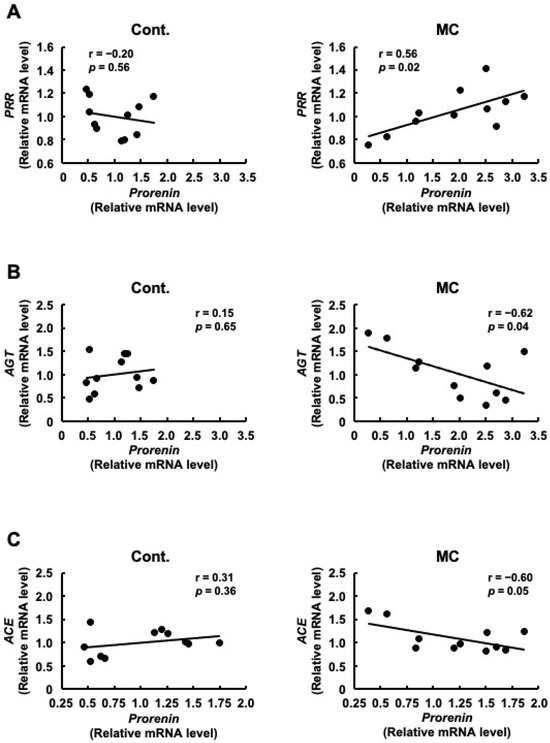
Figure 2.
Correlation between the mRNA expression levels of prorenin and PRR, AGT, or ACE in the renal cortex of rats. The associations between prorenin and PRR (A), AGT (B), or ACE (C) expression were examined using Pearson’s correlation tests. Cont.: control (n = 11), MC: microcystin-LR (n = 11); Black dot: individual mRNA level.
3.4. The Impact of Administering Microcystin-LR to Rats for 7 Weeks on the Expression Levels of Genes Associated with Fibrosis, as Well as the Relationship between the Expression Levels of These Genes in the Renal Cortex
Since renal fibrosis is an important contributor to the progression of abnormal renal function, we examined the expression levels of TGFβ1 and α-SMA, which are both linked to renal fibrosis. Our analysis did not reveal any statistically significant differences in the expression levels of TGFβ1 and α-SMA between the control and microcystin-LR-administered rats (Figure 3A,B). However, the rats orally administered microcystin-LR displayed increased maximum, upper quartile, lower quartile, and minimum values for the expression levels of TGFβ1 (Figure 3A), and increased maximum, upper quartile, median, lower quartile, minimum, and mean values for the expression levels of α-SMA (Figure 3B). Even if the p-value of the t-test was 0.05 or higher, if the maximum, minimum, upper, and lower quartiles, and mean values of the boxplots were all higher in the microcystin-LR-administered rats than in the control rats, as in the present study, it was possible that gene expression in the renal cortex of the rats orally administered microcystin-LR may have begun to change. In particular, TGFβ1 is implicated in the upregulation of α-SMA expression [26]. Based on this finding, if the expression levels of these two genes are correlated, this result suggests that this is a process in which the activation of the TGFβ1/α-SMA signaling pathway begins to increase. The results in Figure 3C show a significant and positive correlation between the expression levels of TGFβ1 and α-SMA in the renal cortex of rats orally administered microcystin-LR (r = 0.87, p = 0.05 × 10⁻²). This was not observed in the control rats. These results suggested that the regulatory mechanisms of gene expression that induce renal fibrosis begin to operate in rats orally administered microcystin-LR.
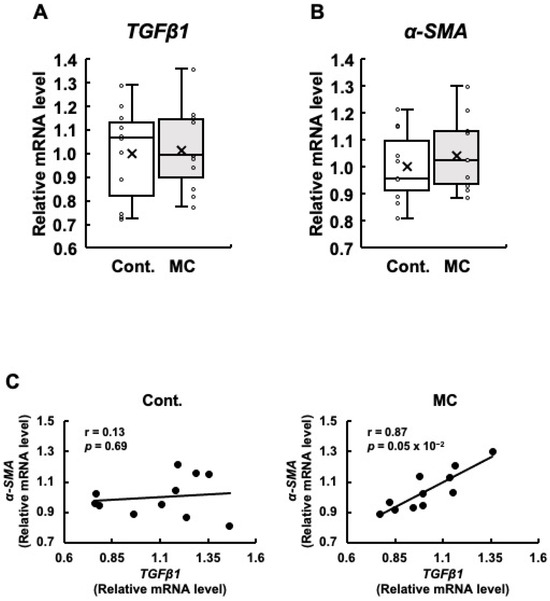
Figure 3.
The expression of TGFβ1 and α-SMA mRNA in the renal cortex of rats, along with the correlation between their mRNA levels. The expression of TGFβ1 (A) and α-SMA (B) in the renal cortex was assessed using real-time PCR. Boxplots, which display the average, median, 25th, and 75th percentiles as boxes and the minimum and maximum values as whiskers, were used to show the results for both the control and microcystin-LR-administered rats. (C) The associations between TGFβ1 and α-SMA expression were examined using Pearson’s correlation tests. Cont.: control (n = 11); MC: microcystin-LR (n = 11); Circle: individual mRNA level; Cross: mean value; Black dot: individual mRNA level.
3.5. Relationship between the Expression Levels of Renin–Angiotensin System-Related Genes and Fibrosis-Related Genes in the Renal Cortex of Rats Following Microcystin-LR Administration for 7 Weeks
Prorenin has been suggested to contribute to the increased expression of fibrosis-related genes in rat and human proximal tubular cells, and in rats with CKD [29,47]. Based on these reports, we predicted that increased prorenin expression due to prolonged environmental exposure to microcystin-LR may alter the regulation of intracellular gene expression and begin to affect the expression levels of renal TGFβ1 and α-SMA. Therefore, we assessed whether there was a correlation between the expression levels of prorenin and those of fibrosis-related genes. The expression levels of prorenin and TGFβ1 were significantly and positively correlated in the renal cortex of rats orally administered microcystin-LR (r = 0.82, p = 0.02 × 10⁻¹) (Figure 4). In addition, the expression levels of prorenin and α-SMA were significantly and positively correlated in the renal cortex of the rats orally administered microcystin-LR (r = 0.73, p = 0.01) (Figure 5). Taken together, the relationship between the expression levels of prorenin and fibrosis-related genes was observed only in the renal cortex of rats orally administered microcystin-LR. Therefore, changes in the regulation of intracellular gene expression due to increased prorenin expression induced by prolonged environmental exposure to microcystin-LR may upregulate the expression of renal fibrosis-related genes.
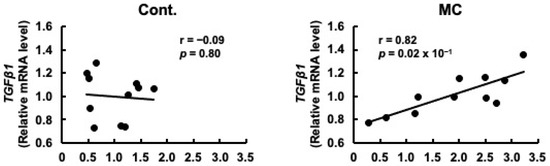
Figure 4.
Correlation between the mRNA expression levels of prorenin and TGFβ1 in the renal cortex of rats. The associations between prorenin and TGFβ1 expression were examined using Pearson’s correlation tests. Cont.: control (n = 11); MC: microcystin-LR (n = 11); Black dot: individual mRNA level.
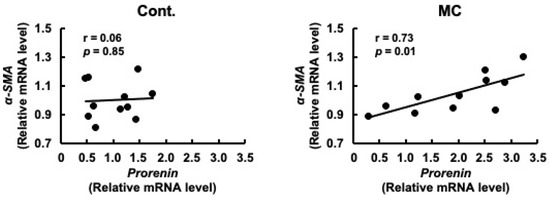
Figure 5.
Correlation between the mRNA expression levels of prorenin and α-SMA in the renal cortex of rats. The associations between prorenin and α-SMA expression were examined using Pearson’s correlation tests. Cont.: control (n = 11); MC: microcystin-LR (n = 11); Black dot: individual mRNA level.
3.6. Effects of Microcystin-LR on the mRNA Expression Levels of Prorenin in Cultured Proximal Tubular Cells
The major cellular components of the renal cortex are the renal tubules, and prorenin expression is upregulated in the renal tubular cells of rats with CKD [43]. In cultured proximal tubular cells, prorenin expression is increased by the accumulation of indoxyl sulfate in the blood of patients with CKD [47]. Therefore, we examined whether microcystin-LR, as well as indoxyl sulfate, would result in increased prorenin expression in proximal tubular cells. Microcystin-LR concentrations in urine collected 24 h after intraperitoneal administration of microcystin-LR at a dose of 10 μg/kg to male mice were reported to be up to approximately 10 ug/L [48]. Since the molecular weight of microcystin-LR is 995.17, a cultured proximal tubular cell line, HK-2 cells, was stimulated with 10 nM microcystin-LR, which is equivalent to 10 μg/mL. As shown in Figure 6, in addition to upregulation of prorenin expression, there was already a significant increase in its expression 3 h after microcystin-LR stimulation. This indicated that prorenin expression may be upregulated by microcystin-LR in the proximal tubular cells of the renal cortex.
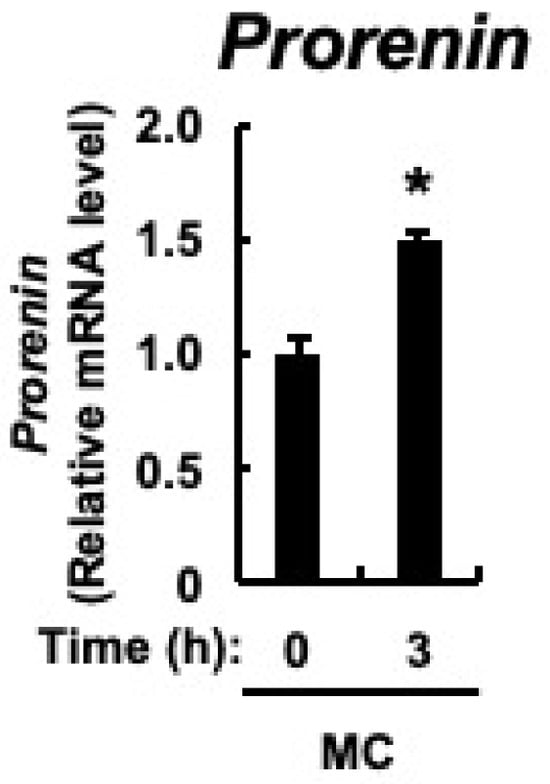
Figure 6.
Expression of prorenin in HK-2 cells. HK-2 cells deprived of serum were cultured for varying periods with or without microcystin-LR (10 nM). Prorenin expression was measured using real-time PCR. The data, expressed as the mean ± SE of n = 3, showed an increase in mRNA expression in the presence of microcystin-LR. MC: microcystin-LR. * p < 0.05 vs. 0 h.
4. Discussion
Although prolonged environmental exposure to microcystin-LR may cause abnormal renal function, the specific sites and genes responsible for this effect are not yet fully understood. Prorenin expression was significantly upregulated in the renal cortex of rats orally administered microcystin-LR and in proximal tubular cells treated with microcystin-LR. Significant positive correlations were observed between the expression levels of prorenin and PRR, TGFβ1, or α-SMA in the renal cortex of rats orally administered microcystin-LR. In addition to prorenin leading to increased expression of PRR and fibrosis-related genes in rat proximal tubular cells [29], prorenin, PRR, TGFβ1, and α-SMA are increased in the renal tubules of rats with CKD [47,49,50]. Based on these reports, prolonged environmental exposure to microcystin-LR could lead to increased prorenin expression in the renal tubules, ultimately resulting in abnormal renal function via renal fibrosis. Furthermore, increased PRR expression, associated with increased prorenin expression, may induce renal fibrosis through amplified activation of Wnt/β-catenin signaling by prorenin-independent PRR [51], in addition to enhanced activation of the renin–angiotensin system and MAPKs [28,30]. Therefore, the present findings provide important mechanistic insights into the development and progression of abnormal renal function due to prolonged environmental exposure to microcystin-LR, with increased prorenin expression representing the first step in this process.
Increased prorenin expression is sometimes observed before the onset of albuminuria and the elevation of plasma parameters indicating abnormal renal function in patients with diabetes [38,39,40,41]. In addition, increased prorenin expression correlates with the onset and progression of diabetic nephropathy [38,39,40,41]. Prolonged environmental exposure to microcystin-LR for 7 weeks did not change the plasma parameters indicating abnormal renal function, but increased prorenin expression was observed. Therefore, prolonged environmental exposure to microcystin-LR over a long period of time may eventually lead to abnormal renal function, similar to in diabetes. Prorenin may therefore be a marker for predicting abnormal renal function due to prolonged environmental exposure to microcystin-LR, as observed in patients with diabetes. However, because prorenin expression is already elevated in patients with diabetes, it is difficult to predict the abnormal renal function induced by prolonged environmental exposure to microcystin-LR using increased prorenin expression as an index in such patients.
Expression levels of prorenin were positively correlated with those of the fibrosis-related genes TGFβ1 and α-SMA in rats orally administered microcystin-LR for 7 weeks. Therefore, the mechanism of early renal fibrosis induced by prolonged environmental exposure to microcystin-LR may be affected not only by the intracellular signaling pathway from Ang II generated from AGT, but also by the activation of the intracellular signaling pathway by increasing prorenin expression. In fact, treatment of rat proximal tubular cells with ARB followed by prorenin stimulation increases the expression of fibrosis-related genes in a dose- and time-dependent manner [29]. In addition, in transgenic rats overexpressing human PRR, in which prorenin signaling is assumed to be enhanced, TGFβ1 expression is increased despite a significant decrease in renal Ang II levels due to ACEI [30]. In addition to the above correlations, in rats orally administered microcystin-LR for 7 weeks, the expression levels of prorenin and PRR were positively correlated, and the expression levels of PRR were positively correlated with those of TGFβ1 and α-SMA (Figure S1). PRR may not only enhance prorenin-dependent activation of the renin–angiotensin system and MAPKs [28,30], but may also induce renal fibrosis through amplified activation of Wnt/β-catenin signaling by a prorenin-independent PRR mechanism [51]. Via mechanisms other than the above, microcystin-LR may enhance activation of the TGFβ1/α-SMA signaling pathway. TGFβ1 causes receptor-mediated serine phosphorylation of Smad2/3, and serine phosphorylated Smad2/3 forms a complex with Smad4, thereby binding to the promoter region of α-SMA [25]. Since microcystin-LR has a specific affinity for and inhibits serine/threonine protein phosphatases 1 and 2A [4,5,6,18], increased expression of α-SMA may be enhanced in rats orally administered microcystin-LR for long periods of time, due to the enhanced serine oxidation of Smad2/3 induced by TGFβ1 stimulation. This effect may occur independently of increased prorenin expression. The primary therapeutic targets for the management of patients with CKD are generally considered to be inhibition of Ang II production with ACE inhibitors (ACEIs) or inhibition of Ang II signaling with angiotensin II type 1 receptor blockers (ARBs) [23]. However, based on the present findings, ACEIs and ARBs may not be effective for early abnormal renal function owing to prolonged environmental exposure to microcystin-LR.
PRO20, the initial 20 amino acid residues of the prorenin prosegment L1PTDTASFGRILLKKMPSVR20, serves as a novel antagonistic peptide that effectively impedes the interaction between prorenin and PRR [52]. Therefore, the binding of prorenin and PRR, blocked by PRO20, is expected to suppress the progression of renal fibrosis and abnormal renal function through inhibiting activation of the renin–angiotensin system to produce Ang II and prorenin/PRR-dependent intracellular signaling pathways. The expression levels of prorenin, PRR, TGFβ1, and α-SMA are all upregulated in rats with CKD [47,49,50]. Administration of PRO20 in similar rats with CKD ameliorated urinary/renal levels of renin activity, AGT, and Ang II, as well as inhibiting Wnt/β-catenin signaling. Finally, administration of PRO20 greatly suppresses renal fibrosis and abnormal renal function in rats with CKD [53]. Pathological lesions have been observed in the kidneys of mice orally administered microcystin-LR for 3 and 6 months [18,36]. In addition, the results obtained in the present study indicated that when microcystin-LR is administered to rats chronically for a long period of time, the expression levels of PRR, TGFβ1, and α-SMA are likely to increase significantly with an increase in prorenin expression compared with control rats. Based on the above findings, PRO20 appears to be highly effective in preventing the progression of renal fibrosis and abnormal renal function caused by prolonged environmental exposure to microcystin-LR. Thus, it will be necessary to analyze in the future whether administration of microcystin-LR with PRO20 for an even longer period would prevent the development and progression of renal fibrosis associated with abnormal renal function via PRR in rats. In addition, since increased prorenin expression is predicted to promote activation of the renin–angiotensin system, an elevation in blood pressure should also be noted.
The present study showed that the expression levels of prorenin were negatively correlated with those of AGT in the renal cortex of rats orally administered microcystin-LR. These results were probably due to the fact that rats orally administered microcystin-LR for 7 weeks did not show any decline in their renal functions, as indicated by the results of the plasma parameters that are indicators of renal function. When CKD is caused by abnormal renal function, indoxyl sulfate accumulates in the blood of both humans and rats with the progression of the disease [54,55,56,57,58], thereby upregulating the expression levels of AGT, as well as prorenin, in the renal cortex [43,59]. Therefore, if the rats were orally administered microcystin-LR for more than 7 weeks, leading to a decrease in renal function, the expression levels of prorenin would be predicted to positively correlate with those of AGT, since indoxyl sulfate is expected to accumulate in the blood, similar to in rats with CKD.
Microcystins have been detected in closed water systems in many parts of the world in recent years. In the summer of 2018, 28 out of the 30 subtropical lakes in eastern China were found to contain microcystins, with Chaohu Lake recording the highest average concentration of microcystins at 26.7 μg/L [60]. In addition, according to a recent survey of 24 drinking water treatment plants in the United States, 75% of samples tested positive for microcystin-LR contamination. Some of these samples contained microcystin-LR concentrations that were not safe for human consumption [4]. In Europe, microcystins constitute approximately 60% of the detectable cyanotoxins present in brackish and freshwater systems [61]. Against this background, it is important to develop methods to detect the dysfunction of organs and tissues induced by microcystins in advance. We believe that the increased prorenin expression observed in the present study can be used as a predictive biomarker for the onset and progression of abnormal renal function induced by microcystins through future studies. However, the current study exclusively used male rats for the analysis. Therefore, future analyses using female rats should be conducted to determine whether increased prorenin expression is observed upon prolonged environmental exposure to microcystin-LR across the sexes.
5. Conclusions
Prolonged environmental exposure to microcystin-LR is considered to cause renal fibrosis and abnormal renal function due to increased prorenin expression in the proximal tubular cells of the renal cortex. Therefore, the identification of dietary components and the development of therapeutic agents that inhibit elevated prorenin expression may be important for suppressing the onset and progression of renal fibrosis and abnormal renal function induced by the continuous consumption of microcystins. Furthermore, since prorenin may serve as a useful biomarker for predicting the onset and progression of renal fibrosis and abnormal renal function induced by the continuous consumption of microcystins in patients other than those with diabetes who already have elevated prorenin expression, using prorenin as an indicator may help prevent the onset and progression of CKD induced by the continuous consumption of microcystins.
Supplementary Materials
The following supporting information can be downloaded at: https://www.mdpi.com/article/10.3390/toxics12080547/s1, Figure S1: Correlation between the mRNA expression levels of PRR and TGFβ1 or α-SMA in the renal cortex of rats.
Author Contributions
Conceptualization, H.M., K.O., N.S., K.S., and H.S.; formal analysis, Y.H., Y.K., and H.S.; investigation, Y.H., Y.K., H.K., K.K., K.Y., and H.S.; writing—original draft preparation, H.S.; writing—review and editing, K.N., A.H., H.M., K.O., N.S., K.S., and H.S.; supervision, H.S.; project administration, Y.H.; funding acquisition, H.S. All authors have read and agreed to the published version of the manuscript.
Funding
This study was supported by a Grant-in-Aid for challenging Exploratory Research (Grant Number JP15K12352 to H.S.) and a Grant-in-Aid for Challenging Research (Exploratory) (Grant Number JP18K19854 to H.S.) from the Ministry of Education, Culture, Sports, Science, and Technology (MEXT) of Japan.
Institutional Review Board Statement
The animal study protocol was approved by the Animal Care and Use Committee of Shimane University (protocol code: MA28-1/date of approval: 6 July 2016; protocol code: MA31-3/date of approval: 14 March 2019).
Informed Consent Statement
Not applicable.
Data Availability Statement
The data presented in this study are available on request from the corresponding author.
Acknowledgments
The authors thank the Faculty of Life and Environmental Sciences at Shimane University for financial support in publishing this article. This study was conducted as an SDGs Research Project of Shimane University.
Conflicts of Interest
The authors declare no conflict of interest.
References
- Hu, X.; Ye, J.; Zhang, R.; Wu, X.; Zhang, Y.; Wu, C. Detection of free microcystins in the liver and muscle of freshwater fish by liquid chromatography-tandem mass spectrometry. J. Environ. Sci. Health B 2017, 52, 770–776. [Google Scholar] [CrossRef] [PubMed]
- Stotts, R.R.; Namikoshi, M.; Haschek, W.M.; Rinehart, K.L.; Carmichael, W.W.; Dahlem, A.M.; Beasley, V.R. Structural modifications imparting reduced toxicity in microcystins from Microcystis spp. Toxicon 1993, 31, 783–789. [Google Scholar] [CrossRef] [PubMed]
- Ibelings, B.W.; Chorus, I. Accumulation of cyanobacterial toxins in freshwater “seafood” and its consequences for public health: A review. Environ. Pollut. 2007, 150, 177–192. [Google Scholar] [CrossRef] [PubMed]
- Miller, T.R.; Beversdorf, L.J.; Weirich, C.A.; Bartlett, S.L. Cyanobacterial Toxins of the Laurentian Great Lakes, Their Toxicological Effects, and Numerical Limits in Drinking Water. Mar. Drugs 2017, 15, 160. [Google Scholar] [CrossRef]
- Bouaïcha, N.; Miles, C.O.; Beach, D.G.; Labidi, Z.; Djabri, A.; Benayache, N.Y.; Nguyen-Quang, T. Structural Diversity, Characterization and Toxicology of Microcystins. Toxins 2019, 11, 714. [Google Scholar] [CrossRef] [PubMed]
- He, Q.; Wang, W.; Xu, Q.; Liu, Z.; Teng, J.; Yan, H.; Liu, X. Microcystins in Water: Detection, Microbial Degradation Strategies, and Mechanisms. Int. J. Environ. Res. Public Health 2022, 19, 13175. [Google Scholar] [CrossRef]
- Du, X.; Liu, H.; Yuan, L.; Wang, Y.; Ma, Y.; Wang, R.; Chen, X.; Losiewicz, M.D.; Guo, H.; Zhang, H. The diversity of cyanobacterial toxins on structural characterization, distribution and identification: A systematic review. Toxins 2019, 11, 530. [Google Scholar] [CrossRef]
- Tamele, I.J.; Silva, M.; Vasconcelos, V. The incidence of marine toxins and the associated seafood poisoning episodes in the African countries of the Indian Ocean and the Red Sea. Toxins 2019, 11, 58. [Google Scholar] [CrossRef] [PubMed]
- Valério, E.; Chaves, S.; Tenreiro, R. Diversity and impact of prokaryotic toxins on aquatic environments: A review. Toxins 2010, 2, 2359–2410. [Google Scholar] [CrossRef]
- Buratti, F.M.; Manganelli, M.; Vichi, S.; Stefanelli, M.; Scardala, S.; Testai, E.; Funari, E. Cyanotoxins: Producing organisms, occurrence, toxicity, mechanism of action and human health toxicological risk evaluation. Arch. Toxicol. 2017, 91, 1049–1130. [Google Scholar] [CrossRef]
- Cirés, S.; Casero, M.C.; Quesada, A. Toxicity at the Edge of Life: A Review on Cyanobacterial Toxins from Extreme Environments. Mar. Drugs 2017, 15, 233. [Google Scholar] [CrossRef]
- Carmichael, W.W. Cyanobacteria secondary metabolites—The cyanotoxins. J. Appl. Bacteriol. 1992, 72, 445–459. [Google Scholar] [CrossRef]
- Vasconcelos, V.M.; Sivonen, K.; Evans, W.R.; Carmichael, W.W.; Namikoshi, M. Hepatotoxic microcystin diversity in cyanobacterial blooms collected in Portuguese freshwaters. Water Res. 1996, 30, 2377–2384. [Google Scholar] [CrossRef]
- Carey, C.C.; Haney, J.F.; Cottingham, K.L. First report of microcystin-LR in the cyanobacterium Gloeotrichia echinulata. Environ. Toxicol. 2007, 22, 337–339. [Google Scholar] [CrossRef]
- Zhang, Z.; Yu, S.; Wei, G.; Chen, W. Study on the whole and cells level distribution of Microcystin LR in mice. J. Toxicol. 2002, 16, 5–8. [Google Scholar]
- Wang, Q.; Xie, P.; Chen, J.; Liang, G. Distribution of microcystins in various organs (heart, liver, intestine, gonad, brain, kidney and lung) of Wistar rat via intravenous injection. Toxicon 2008, 52, 721–727. [Google Scholar] [CrossRef]
- Madhushankha, L.; Dhammika, M.A.; Charitha, P.; Tilak, A.; Lishantha, G. Cyanobacteria and cyanotoxins in well waters of the Girandurukotte, CKDu endemic area in Sri Lanka; do they drink safe water? J. Ecotechnol. Res. 2016, 1, 17–21. [Google Scholar]
- Xu, S.; Yi, X.; Liu, W.; Zhang, C.; Massey, I.Y.; Yang, F.; Tian, L. A Review of Nephrotoxicity of Microcystins. Toxins 2020, 12, 693. [Google Scholar] [CrossRef] [PubMed]
- Chen, J.; Xie, P.; Li, L.; Xu, J. First Identification of the Hepatotoxic Microcystins in the Serum of a Chronically Exposed Human Population Together with Indication of Hepatocellular Damage. Toxicol. Sci. 2009, 108, 81–89. [Google Scholar] [CrossRef] [PubMed]
- Lin, H.; Liu, W.; Zeng, H.; Pu, C.; Zhang, R.; Qiu, Z.; Chen, J.A.; Wang, L.; Tan, Y.; Zheng, C.; et al. Determination of Environmental Exposure to Microcystin and Aflatoxin as a Risk for Renal Function Based on 5493 Rural People in Southwest China. Environ. Sci. Technol. 2016, 50, 5346–5356. [Google Scholar] [CrossRef]
- Cho, M.H. Renal fibrosis. Korean J. Pediatr. 2010, 53, 735–740. [Google Scholar] [CrossRef] [PubMed]
- Miyazawa, H.; Hirai, K.; Ookawara, S.; Ishibashi, K.; Morishita, Y. Nano-sized carriers in gene therapy for renal fibrosis in vivo. Nano Rev. Exp. 2017, 8, 1331099. [Google Scholar] [CrossRef]
- Balakumar, P.; Sambathkumar, R.; Mahadevan, N.; Muhsinah, A.B.; Alsayari, A.; Venkateswaramurthy, N.; Jagadeesh, G. A potential role of the renin-angiotensin-aldosterone system in epithelial-to-mesenchymal transition-induced renal abnormalities: Mechanisms and therapeutic implications. Pharmacol. Res. 2019, 146, 104314. [Google Scholar] [CrossRef] [PubMed]
- Meng, X.M.; Tang, P.M.; Li, J.; Lan, H.Y. TGF-β/Smad signaling in renal fibrosis. Front. Physiol. 2015, 6, 82. [Google Scholar] [CrossRef] [PubMed]
- Duni, A.; Liakopoulos, V.; Roumeliotis, S.; Peschos, D.; Dounousi, E. Oxidative Stress in the Pathogenesis and Evolution of Chronic Kidney Disease: Untangling Ariadne’s Thread. Int. J. Mol. Sci. 2019, 20, 3711. [Google Scholar] [CrossRef] [PubMed]
- Shimizu, H.; Yisireyili, M.; Nishijima, F.; Niwa, T. Indoxyl sulfate enhances p53-TGF-β1-Smad3 pathway in proximal tubular cells. Am. J. Nephrol. 2013, 37, 97–103. [Google Scholar] [CrossRef] [PubMed]
- Burns, W.C.; Thomas, M.C. Angiotensin II and its role in tubular epithelial to mesenchymal transition associated with chronic kidney disease. Cells Tissues Organs 2011, 193, 74–84. [Google Scholar] [CrossRef] [PubMed]
- Nguyen, G.; Delarue, F.; Burcklé, C.; Bouzhir, L.; Giller, T.; Sraer, J.D. Pivotal role of the renin/prorenin receptor in angiotensin II production and cellular responses to renin. J. Clin. Investig. 2002, 109, 1417–1427. [Google Scholar] [CrossRef] [PubMed]
- Liu, Y.; Zuo, S.; Li, X.; Fan, J.; Cao, X.; Yu, X.; Yang, Q. Interaction between V-ATPase B2 and (Pro) renin Receptors in Promoting the progression of Renal Tubulointerstitial Fibrosis. Sci. Rep. 2016, 6, 25035. [Google Scholar] [CrossRef]
- Kaneshiro, Y.; Ichihara, A.; Sakoda, M.; Takemitsu, T.; Nabi, A.H.; Uddin, M.N.; Nakagawa, T.; Nishiyama, A.; Suzuki, F.; Inagami, T.; et al. Slowly progressive, angiotensin II-independent glomerulosclerosis in human (pro)renin receptor-transgenic rats. J. Am. Soc. Nephrol. 2007, 18, 1789–1795. [Google Scholar] [CrossRef]
- Arman, T.; Lynch, K.D.; Goedken, M.; Clarke, J.D. Sub-chronic microcystin-LR renal toxicity in rats fed a high fat/high cholesterol diet. Chemosphere 2021, 269, 128773. [Google Scholar] [CrossRef] [PubMed]
- Yao, X.; Liu, Y.; Yang, Y.; Li, Y.; Hu, N.; Song, F.; Yang, F. Microcystin-LR-Exposure-Induced Kidney Damage by Inhibiting MKK6-Mediated Mitophagy in Mice. Toxins 2023, 15, 404. [Google Scholar] [CrossRef] [PubMed]
- Dietrich, D.; Hoeger, S. Guidance values for microcystins in water and cyanobacterial supplement products (blue-green algal supplements): A reasonable or misguided approach? Toxicol. Appl. Pharmacol. 2005, 203, 273–289. [Google Scholar] [CrossRef] [PubMed]
- Li, T.; Fan, X.; Cai, M.; Jiang, Y.; Wang, Y.; He, P.; Ni, J.; Mo, A.; Peng, C.; Liu, J. Advances in investigating microcystin-induced liver toxicity and underlying mechanisms. Sci. Total Environ. 2023, 905, 167167. [Google Scholar] [CrossRef]
- Schaefer, A.M.; Yrastorza, L.; Stockley, N.; Harvey, K.; Harris, N.; Grady, R.; Sullivan, J.; McFarland, M.; Reif, J.S. Exposure to microcystin among coastal residents during a cyanobacteria bloom in Florida. Harmful Algae 2020, 92, 101769. [Google Scholar] [CrossRef]
- Yi, X.; Xu, S.; Huang, F.; Wen, C.; Zheng, S.; Feng, H.; Guo, J.; Chen, J.; Feng, X.; Yang, A.F. Effects of Chronic Exposure to Microcystin-LR on Kidney in Mice. Int. J. Environ. Res. Public Health 2019, 16, 5030. [Google Scholar] [CrossRef]
- Soltani-Fard, E.; Taghvimi, S.; Karimi, F.; Vahedi, F.; Khatami, S.H.; Behrooj, H.; Deylami Hayati, M.; Movahedpour, A.; Ghasemi, H. Urinary biomarkers in diabetic nephropathy. Clin. Chim. Acta 2024, 561, 119762. [Google Scholar] [CrossRef] [PubMed]
- Luetscher, J.A.; Kraemer, F.B.; Wilson, D.M.; Schwartz, H.C.; Bryer-Ash, M. Increased Plasma Inactive Renin in Diabetes Mellitus. A Marker of Microvascular Complications. N. Engl. J. Med. 1985, 312, 1412–1417. [Google Scholar] [CrossRef]
- Wilson, D.M.; Luetscher, J.A. Plasma Prorenin Activity and Complications in Children with Insulin-Dependent Diabetes Mellitus. N. Engl. J. Med. 1990, 323, 1101–1106. [Google Scholar] [CrossRef]
- Chiarelli, F.; Pomilio, M.; De Luca, F.A.; Vecchiet, J.; Verrotti, A. Plasma Prorenin Levels May Predict Persistent Microalbuminuria in Children with Diabetes. Pediatr. Nephrol. 2001, 16, 116–120. [Google Scholar] [CrossRef]
- Deinum, J.; Rønn, B.; Mathiesen, E.; Derkx, F.H.M.; Hop, W.C.J.; Schalekamp, M.A.D.H. Increase in Serum Prorenin Precedes Onset of Microalbuminuria in Patients with Insulin-Dependent Diabetes Mellitus. Diabetologia 1999, 42, 1006–1010. [Google Scholar] [CrossRef] [PubMed]
- Koto, Y.; Kawahara, H.; Kurata, K.; Yoshikiyo, K.; Hashiguchi, A.; Okano, K.; Sugiura, N.; Shimizu, K.; Shimizu, H. Microcystin-LR incorporated into colonic cells through probenecid-sensitive transporters leads to upregulated MCP-1 expression induced by JNK activation. Toxicol. Rep. 2022, 9, 937–944. [Google Scholar] [CrossRef] [PubMed]
- Shimizu, H.; Saito, S.; Higashiyama, Y.; Nishijima, F.; Niwa, T. CREB, NF-κB, and NADPH oxidase coordinately upregulate indoxyl sulfate-induced angiotensinogen expression in proximal tubular cells. Am. J. Physiol. Cell Physiol. 2013, 304, C685–C692. [Google Scholar] [CrossRef] [PubMed]
- Kurata, K.; Ishii, K.; Koto, Y.; Naito, K.; Yuasa, K.; Shimizu, H. Skatole-induced p38 and JNK activation coordinately upregulates, whereas AhR activation partially attenuates TNFα expression in intestinal epithelial cells. Biosci. Biotechnol. Biochem. 2023, 87, 611–619. [Google Scholar] [CrossRef] [PubMed]
- Tomii, A.; Higa, M.; Naito, K.; Kurata, K.; Kobayashi, J.; Takei, C.; Yuasa, K.; Koto, Y.; Shimizu, H. Activation of the TLR4-JNK but not the TLR4-ERK pathway induced by indole-3-acetic acid exerts anti-proliferative effects on Caco-2 cells. Biosci. Biotechnol. Biochem. 2023, 87, 839–849. [Google Scholar] [CrossRef] [PubMed]
- Ichisaka, Y.; Yano, S.; Nishimura, K.; Niwa, T.; Shimizu, H. Indoxyl sulfate contributes to colorectal cancer cell proliferation and increased EGFR expression by activating AhR and Akt. Biomed. Res. 2024, 45, 57–66. [Google Scholar] [CrossRef] [PubMed]
- Saito, S.; Shimizu, H.; Yisireyili, M.; Nishijima, F.; Enomoto, A.; Niwa, T. Indoxyl sulfate-induced activation of (pro)renin receptor is involved in expression of TGF-β1 and α-smooth muscle actin in proximal tubular cells. Endocrinology 2014, 155, 1899–1907. [Google Scholar] [CrossRef] [PubMed]
- Faustino, L.C.; Almeida, N.A.; Pereira, G.F.; Ramos, R.G.; Soares, R.M.; Morales, M.M.; Pazos-Moura, C.C.; Ortiga-Carvalho, T.M. Thyroid hormone and estradiol have overlapping effects on kidney glutathione S-transferase-α gene expression. Am. J. Physiol. Endocrinol. Metab. 2012, 303, E787–E797. [Google Scholar] [CrossRef][Green Version]
- Shimizu, H.; Bolati, D.; Adijiang, A.; Enomoto, A.; Nishijima, F.; Dateki, M.; Niwa, T. Senescence and dysfunction of proximal tubular cells are associated with activated p53 expression by indoxyl sulfate. Am. J. Physiol. Cell Physiol. 2010, 299, C1110–C1117. [Google Scholar] [CrossRef]
- Shimizu, H.; Bolati, D.; Adijiang, A.; Muteliefu, G.; Enomoto, A.; Nishijima, F.; Dateki, M.; Niwa, T. NF-κB plays an important role in indoxyl sulfate-induced cellular senescence, fibrotic gene expression, and inhibition of proliferation in proximal tubular cells. Am. J. Physiol. Cell Physiol. 2011, 301, C1201–C1212. [Google Scholar] [CrossRef]
- Li, Z.; Zhou, L.; Wang, Y.; Miao, J.; Hong, X.; Hou, F.F.; Liu, Y. (Pro)renin receptor is an amplifier of Wnt/β-catenin signaling in kidney injury and fibrosis. J. Am. Soc. Nephrol. 2017, 28, 2393–2408. [Google Scholar] [CrossRef] [PubMed]
- Li, W.; Sullivan, M.N.; Zhang, S.; Worker, C.J.; Xiong, Z.; Speth, R.C.; Feng, Y. Intracerebroventricular infusion of the (pro)renin receptor antagonist PRO20 attenuates deoxycorticosterone acetate-salt-induced hypertension. Hypertension 2015, 65, 352–361. [Google Scholar] [CrossRef] [PubMed]
- Wang, Y.; Wang, Y.; Xue, K.; Wang, H.; Zhou, J.; Gao, F.; Li, C.; Yang, T.; Fang, H. (Pro)renin receptor antagonist PRO20 attenuates nephrectomy-induced nephropathy in rats via inhibition of intrarenal RAS and Wnt/β-catenin signaling. Physiol. Rep. 2021, 9, e14881. [Google Scholar] [CrossRef] [PubMed]
- Niwa, T.; Yazawa, T.; Ise, M.; Sugano, M.; Kodama, T.; Uehara, Y.; Maeda, K. Inhibitory effect of oral sorbent on accumulation of albumin-bound indoxyl sulfate in serum of experimental uremic rats. Nephron. 1991, 57, 84–88. [Google Scholar] [CrossRef]
- Niwa, T.; Emoto, Y.; Maeda, K.; Uehara, Y.; Yamada, N.; Shibata, M. Oral sorbent suppresses accumulation of albumin-bound indoxyl sulphate in serum of haemodialysis patients. Nephrol. Dial. Transplant. 1991, 6, 105–109. [Google Scholar] [CrossRef]
- Niwa, T.; Miyazaki, T.; Hashimoto, N.; Hayashi, H.; Ise, M.; Uehara, Y.; Maeda, K. Suppressed serum and urine levels of indoxyl sulfate by oral sorbent in experimental uremic rats. Am. J. Nephrol. 1992, 12, 201–206. [Google Scholar] [CrossRef] [PubMed]
- Niwa, T.; Ise, M. Indoxyl sulfate, a circulating uremic toxin, stimulates the progression of glomerular sclerosis. J. Lab. Clin. Med. 1994, 124, 96–104. [Google Scholar] [PubMed]
- Kamiński, T.W.; Pawlak, K.; Karbowska, M.; Myśliwiec, M.; Pawlak, D. Indoxyl sulfate—The uremic toxin linking hemostatic system disturbances with the prevalence of cardiovascular disease in patients with chronic kidney disease. BMC Nephrol. 2017, 18, 35. [Google Scholar] [CrossRef] [PubMed]
- Sun, C.Y.; Chang, S.C.; Wu, M.S. Uremic toxins induce kidney fibrosis by activating intrarenal renin-angiotensin-aldosterone system associated epithelial-to-mesenchymal transition. PLoS ONE 2012, 7, e34026. [Google Scholar] [CrossRef]
- Wan, X.; Steinman, A.D.; Gu, Y.; Zhu, G.; Shu, X.; Xue, Q.; Zou, W.; Xie, L. Occurrence and risk assessment of microcystin and its relationship with environmental factors in lakes of the eastern plain ecoregion, China. Environ. Sci. Pollut. Res. Int. 2020, 27, 45095–45107. [Google Scholar] [CrossRef]
- Greer, B.; McNamee, S.E.; Boots, B.; Cimarelli, L.; Guillebault, D.; Helmi, K.; Marcheggiani, S.; Panaiotov, S.; Breitenbach, U.; Akçaalan, R.; et al. A validated UPLC-MS/MS method for the surveillance of ten aquatic biotoxins in European brackish and freshwater systems. Harmful Algae 2016, 55, 31–40. [Google Scholar] [CrossRef] [PubMed]


Disclaimer/Publisher’s Note: The statements, opinions and data contained in all publications are solely those of the individual author(s) and contributor(s) and not of MDPI and/or the editor(s). MDPI and/or the editor(s) disclaim responsibility for any injury to people or property resulting from any ideas, methods, instructions or products referred to in the content. |
© 2024 by the authors. Licensee MDPI, Basel, Switzerland. This article is an open access article distributed under the terms and conditions of the Creative Commons Attribution (CC BY) license (https://creativecommons.org/licenses/by/4.0/).