Article

Impact of COVID-19 Lockdown on NO2 Pollution and the Associated Health Burden in China: A Comparison of Different Approaches

School of Public Health (Shenzhen), Sun Yat-sen University, Guangzhou 510275, China
Toxics 2024, 12(8), 580; https://doi.org/10.3390/toxics12080580
Submission received: 16 June 2024 / Revised: 31 July 2024 / Accepted: 1 August 2024 / Published: 10 August 2024
(This article belongs to the Special Issue Detection of Air Pollutants)

Abstract

:
So far, a large number of studies have quantified the effect of COVID-19 lockdown measures on air quality in different countries worldwide. However, few studies have compared the influence of different approaches on the estimation results. The present study aimed to utilize a random forest machine learning approach as well as a difference-to-difference approach to explore the effect of lockdown policy on nitrogen dioxide (NO2) concentration during COVID-19 outbreak period in mainland China. Datasets from 2017 to 2019 were adopted to establish the random forest models, which were then applied to predict the NO2 concentrations in 2020, representing a scenario without the lockdown effect. The results showed that random forest models achieved remarkable predictive accuracy for predicting NO2 concentrations, with index of agreement values ranging between 0.34 and 0.76. Compared with the modelled NO2 concentrations, on average, the observed NO2 concentrations decreased by approximately 16 µg/m3 in the lockdown period in 2020. The difference-to-difference approach tended to underestimate the influence of COVID-19 lockdown measures. Due to the improvement of NO2 pollution, around 3722 non-accidental premature deaths were avoided in the studied population. The presented machine learning modelling framework has a great potential to be transferred to other short-term events with abrupt pollutant emission changes.

1. Introduction

Nitrogen dioxide (NO2) is a typical toxic air pollutant and a precursor to ozone (O3) and secondary aerosols [1,2,3]. Exposure to elevated NO2 concentrations can cause a number of adverse health effects, including respiratory diseases, lung cancer, and even premature deaths [2,4]. In urban areas, the main sources of NO2 include fossil fuel combustion and traffic emissions [5,6]. Thus, NO2 is an effective indicator of traffic emissions in cities. The trend of NO2 concentration can be used to examine the effectiveness of air quality management and the influence of abrupt pollutant emission changes [4,7].
The novel coronavirus disease (COVID-19) broke out in the city of Wuhan, Hubei province, China, in late December 2019 [8,9]. By 23 January 2020, the Chinese authorities undertook stringent traffic restrictions and self-quarantine measures to control the spread of COVID-19 [10,11]. This lockdown policy lasted until the end of February in regions outside Hubei province and until the start of April in Hubei province [12]. Scientific results showed that air pollutant concentrations dropped dramatically in China with the implementation of these lockdown measures [5,9,10,13]. For instance, Chu et al. [10] found that the average NO2 concentration decreased by 53%, 50%, and 30% in Wuhan city, Hubei province (Wuhan city excluded), and China (Hubei province excluded), respectively, during the lockdown period of early 2020 compared with levels from the same period in 2019. In addition, Wang et al. [9] reported that the air quality index and concentrations of NO2, fine particulate matter (PM2.5), and carbon monoxide (CO) reduced by 15%, 38%, 22%, and 20% in Northern China, respectively, due to the lockdown measures. Furthermore, Cai et al. [14] estimated that a 25.3%–48.8% drop in the concentrations of NO2 has been observed in the four metropolises (Shanghai, Tianjin, Guangzhou, and Wuhan) during the quarantine period compared with the same period in 2018–2019.
With the spread of COVID-19 around the world, a large number of countries took a series of lockdown measures to prevent the pandemic. These lockdown policies reduced air pollutant concentrations around the world, especially in urban areas where intensive human activities stopped [15,16,17,18,19,20,21,22,23]. For instance, owing to the COVID-19 lockdown, there was a reduction in NO2 concentration by 50% and 62%, respectively, in Madrid and Barcelona, Spain [15]. Moreover, Liu et al. [24] reported that California had a 38%, 49%, and 31% drop in the concentrations of NO2, CO, and PM2.5 during the lockdown period (19 March–7 May) compared to the pre-lockdown period (26 January–18 March) in 2020. In addition, Filonchyk et al. [25] quantified that the NO2 levels in Poland were reduced by −25% and −19%, respectively, as compared to the same period in 2018 and 2019, due to lockdown measures. Several studies documented that there was a slow increase in air pollution with the gradual return of human activities after the lockdown [1,13,14].
The evaluation of the COVID-19 lockdown measures can provide valuable insights into the adjustment for a better policy implementation and for the design of similar policies in the future or in other regions [9,26,27]. The research methods of satellite remote sensing, atmospheric chemical transport models (ACTMs), statistical analysis models, machine learning algorithms, and others were intensively used to conduct evaluations of the COVID-19 lockdown measures and meteorology on changes in air quality [1,5,11,27,28,29,30,31]. Among these research methods, the machine learning approach, which has been reported to have high prediction accuracy and strong non-linear relationship modelling capacity [12,13,26,29], has great potential for understanding the true effect of influencing factors on air quality. Up until now, to the best of our knowledge, there are very few studies utilizing the machine learning approach against other approaches to examine the effect of COVID-19 lockdown policies on air quality in the whole country of China [13,26]. It is therefore essential to reveal the evolution of air pollution and human health due to the lockdown policies using the machine learning approach, as well as other approaches.
The main research objective of the present work is to compare two approaches, namely the machine learning and difference-to-difference approaches, to quantify the effect of the COVID-19 lockdown policies on NO2 pollution during the COVID-19 outbreak period in mainland China. Section 2 presents the NO2 and meteorology measurement data and the methods used for the data analysis. The results and discussion, including the established random forest models, the spatiotemporal variability of the COVID-19 lockdown effect on NO2 pollution, and the health benefits from NO2 reduction, are summarized in Section 3. The conclusion section summarizes the findings and implications gained from the analysis on the effect of the COVID-19 lockdown policy.

2. Materials and Methods

2.1. Data Collection and Processing

In this study, 31 provincial capital cities in mainland China are included, with Hong Kong, Taipei of Taiwan, and Macau not included due to different management policies during the COVID-19 outbreak period. The period of 1 December 2019 to 30 April 2020 is the study period, while the same time periods of the previous three years, i.e., 1 December 2016 to 30 April 2017, 1 December 2017 to 30 April 2018, and 1 December 2018 to 30 April 2019, are the reference periods for the development of random forest machine learning models. The time periods of lockdown policies for the included cities were summarized from the central, provincial, and local government websites. The period before the COVID-19 lockdown period (pre-lockdown) is defined as 1 December 2019 to 22 January 2020, which is the date when the city lockdown started in Wuhan; the COVID-19 lockdown period (lockdown) is defined as the city lockdown period of 23 January to 18 March 2020; and the period after the COVID-19 lockdown period (post-lockdown) is defined as the date when the city re-opened, which is 19 March 2020 to 30 April 2020.
NO2 was selected as the studied pollutant because it is significantly and directly affected by the lockdown activities [1]. The daily mean NO2 measurement data were downloaded from the China National Environmental Monitoring Center (Available online: http://beijingair.sinaapp.com/ (accessed on 15 October 2023)). The meteorological data (wind direction, wind speed, temperature, and relative humidity) measured at the nearest weather stations were collected from the Global Historical Climatology Network Daily (Available online: https://www.ncdc.noaa.gov/ghcn-daily-description (accessed on 15 October 2023)) and used as the meteorological conditions. Following previous studies [2,32], the air quality monitoring stations were matched with the nearest weather stations to gain the related meteorological parameters.

2.2. Evaluation Approaches

2.2.1. Random Forest Models

Daily average values of NO2 concentration at 31 provincial capital cities were the dependent variables. The potential predictor variables were meteorological and environmental variables and time variables. The meteorological conditions affect the accumulation and transport of air pollution, while the time variables served as the major proxy of emissions [9,33,34,35]: the year represents the change in emission factors, day_julian and weekday show the trends of emissions during a year and a week, and day_lunar represents the number of days referring to the first day of the Chinese Lunar New Year holiday (e.g., 27 January was the first day of the holiday in 2017; therefore, day_lunar for 26–28 January in 2017 was −1, 0, 1, respectively) [32,36].
The random forest model [13,37], which is commonly adopted in previous air quality prediction studies, was used in this work. A detailed description of the random forest approach can be found in Grange and Carslaw [34] and Li et al. [38]. A combination of ntree values ranging between 50, 100, 200, 500, and 1000, and mtry values ranging between 2, 3, 4, 5, 6, and 7 were used to evaluate the model performance. After comparison, the ntree value of 500 and mtry value of 4 were selected to develop the final models. For each provincial capital city, one random forest model was established over 2017–2019, and 31 random forest models were established in total. The established random forest model was used to predict the NO2 concentrations for the 2020 COVID-19 lockdown period. For validation, the datasets of two years from the 2017–2019 period were used to establish the model, and the dataset of the remaining year was used to compare with predictions. This process was repeated three times. In addition, the established 2017–2019 random forest model was used to predict NO2 concentrations for the pre-lockdown and post-lockdown period in 2020, and the comparison between predictions and observations of NO2 concentrations was conducted to further validate the models.
The commonly used statistical parameters, including the coefficients of determination (R2), mean bias error (MBE), normalized mean bias error (NMBE), mean absolute error (MAE), normalized mean absolute error (NMAE), root mean squared error (RMSE), and normalized root mean squared error (NRMSE) [13,38,39,40,41] were employed to evaluate the developed random forest models. The statistical analysis was performed using R software, version 4.0.3 (R Foundation for Statistical Computing, Vienna, Austria).

2.2.2. A Difference-to-Difference Approach

For the comparison with the results using the random forest models, we also applied a difference-to-difference approach [42] to quantify the effect of the COVID-19 lockdown on NO2 pollution.
C d , BLP = C ¯ 2020 , BLP C ¯ 2017 2019 , BLP
C d , ALP = C ¯ 2020 , ALP C ¯ 2017 2019 , ALP
C d , DLP = C ¯ 2020 , DLP C ¯ 2017 2019 , DLP
C adj _ d , DLP = C d , DLP   C d , BLP
where C d , BLP , C d , DLP , and C d , ALP represent the pollutant concentration difference of the 2020 concentration against the 2017–2019 mean concentration of the before lockdown period (BLP), during lockdown period (DLP), and after lockdown period (ALP), respectively. C adj _ d , DLP represents the adjusted pollutant concentration difference of the 2020 concentration against the 2017–2019 mean concentration DLP, with the concentration difference of the BLP removed. C ¯ 2020 , BLP C ¯ 2020 , DLP , and C ¯ 2020 , ALP are the mean pollutant concentrations of the BLP, DLP, and ALP in 2020. C ¯ 2017 2019 , BLP C ¯ 2017 2019 , DLP , and C ¯ 2017 2019 , ALP are the 2017–2019 mean pollutant concentrations of the BLP, DLP, and ALP, respectively.

2.3. NO2 Concentration Changes in 2020 Due to the COVID-19 Pandemic

The values of NO2 concentrations of the studied cities over the 2020 lockdown period were compared with the random forest model predicted values (representing no lockdown scenarios). The spatial distribution of changes in NO2 concentrations owing to the lockdown was visualized using ArcGIS software v10.6 (Esri, New York, NY, USA). The time series plots of observations and predictions on NO2 concentrations for five example cities, including Beijing (the capital city, located in Northern China), Shanghai (located in Eastern China), Guangzhou (located in Southern China), Wuhan (located in Central China and the center of COVID-19 outbreak in China), and Xi’an (located in Western China) in 2020, were presented.

2.4. Health Impact Assessment

The health benefits due to the reduction in NO2 concentrations during the COVID-19 lockdown period were estimated using the classic health impact assessment method [43,44].
R R = e x p β Δ c
A F = R R 1 R R = 1 e x p β Δ c
Δ M o r t = y 0 ( 1 e x p β Δ c ) P o p
where Δ Mort is the health benefits in the mortality or morbidity based on NO2 reductions, β is the cause-specific coefficient of the concentration–response functions, y 0 is the mortality rate in the reference scenario, Pop is the population for each studied city, Δc is the NO2 reduction during the COVID-19 lockdown period, RR refers to the relative risk of NO2 pollution, and AF is the fraction of the disease burden attributable to the risk factor. In this work, β values of 0.009, 0.009, and 0.012 were adopted for estimating the avoided health burden from non-accidental diseases, cardiovascular diseases, and respiratory diseases, respectively [45]. AF was multiplied by the daily cause-specific number of deaths and the total number of days during the COVID-19 lockdown period.

3. Results and Discussion

3.1. Development and Validation of Random Forest Models

A summary of statistical metrics for the development, three-year cross-validation, and 2020 predictions of the random forest models is shown in Figure 1. For the development of random forest models, the IOA values ranged between 0.85 and 0.93, with an average value of 0.91. The NME and NRMSE values ranged between 2% and 6%, and between 3% and 7%, respectively (Figure 1a). The overall conclusion is that the established random forest models achieved quite high predictive performance.
In terms of the three-year cross-validation, the IOA, NME, and NRMSE values varied between 0.39 and 0.68, between 8% and 15%, and between 10% and 18%, respectively (Figure 1b). The average values for IOA, NME, and NRMSE were 0.58, 13%, and 14%, respectively, when conducting the cross-validation, which are still within the threshold values for modelling [39,46].
To further evaluate the performance of the established random forest models, the predicted NO2 concentrations and corresponding observations during the pre-lockdown period (i.e., 1 December 2019 to 22 January 2020) were compared. The IOA, NME, and NRMSE values ranged between 0.34 and 0.76, between 8% and 15%, and between 10% and 18%, respectively (Figure 1c). The values of these statistical metrics all met the criteria thresholds recommended in previous studies [2,39,46]. The consistency of NO2 predictions and observations during the pre-lockdown period gives the authors confidence to infer that the differences between NO2 predictions and observations during COVID-19 lockdown period are due to the COVID-19 lockdown measures, such as the shutdown of manufacturing and heavy industry factories, and the restriction of traffic flows.
The statistical metrics of the established random forest models varied among different cities to some extent (Figure 1). In addition, the feature importance of these random forest models differed from one city to another (Table 1). On average, wind speed (with a normalized importance value at 25%) is the most important predictor variable, followed by day_lunar (17%), relative humidity (14%), temperature (12%), year (11%), day_julian (11%), and wind direction (9.6%). The pattern of variable importance is generally consistent with the atmospheric mechanisms [2,34,35]. For example, wind fields (i.e., wind speed and wind direction) are associated with the accumulation, dispersion, and transport of air pollution plumes in the atmosphere [47,48]. Temperature is closely related to NO2 concentrations by affecting atmospheric turbulence and the reaction rate of atmospheric oxidants with NO2 [49]. Relative humidity has an impact on NO2 concentrations through the hydroxyl radical, which is produced by photolytic reactions involving water vapor [50].
The differences in the random forest models for different cities are very likely due to a number of influencing factors including the data characteristics and the urban design [29,34]. For instance, we used the nearest weather station to represent the meteorological conditions at the fixed-site stations, which is a common practice in air quality studies [9,32,34,40,41]. However, there are uncertainties regarding the meteorological conditions and the uncertainties may be quite different in different studied cities. In addition, the urban design (e.g., urban building morphology) also affects the dispersion and transport of NO2 pollution and the observed NO2 concentration at the fixed-site stations [22,51], which may further influence the correlation between observed and predicted NO2 concentrations in the studied cities.

3.2. Comparison between the Machine Learning and Difference-to-Difference Approaches

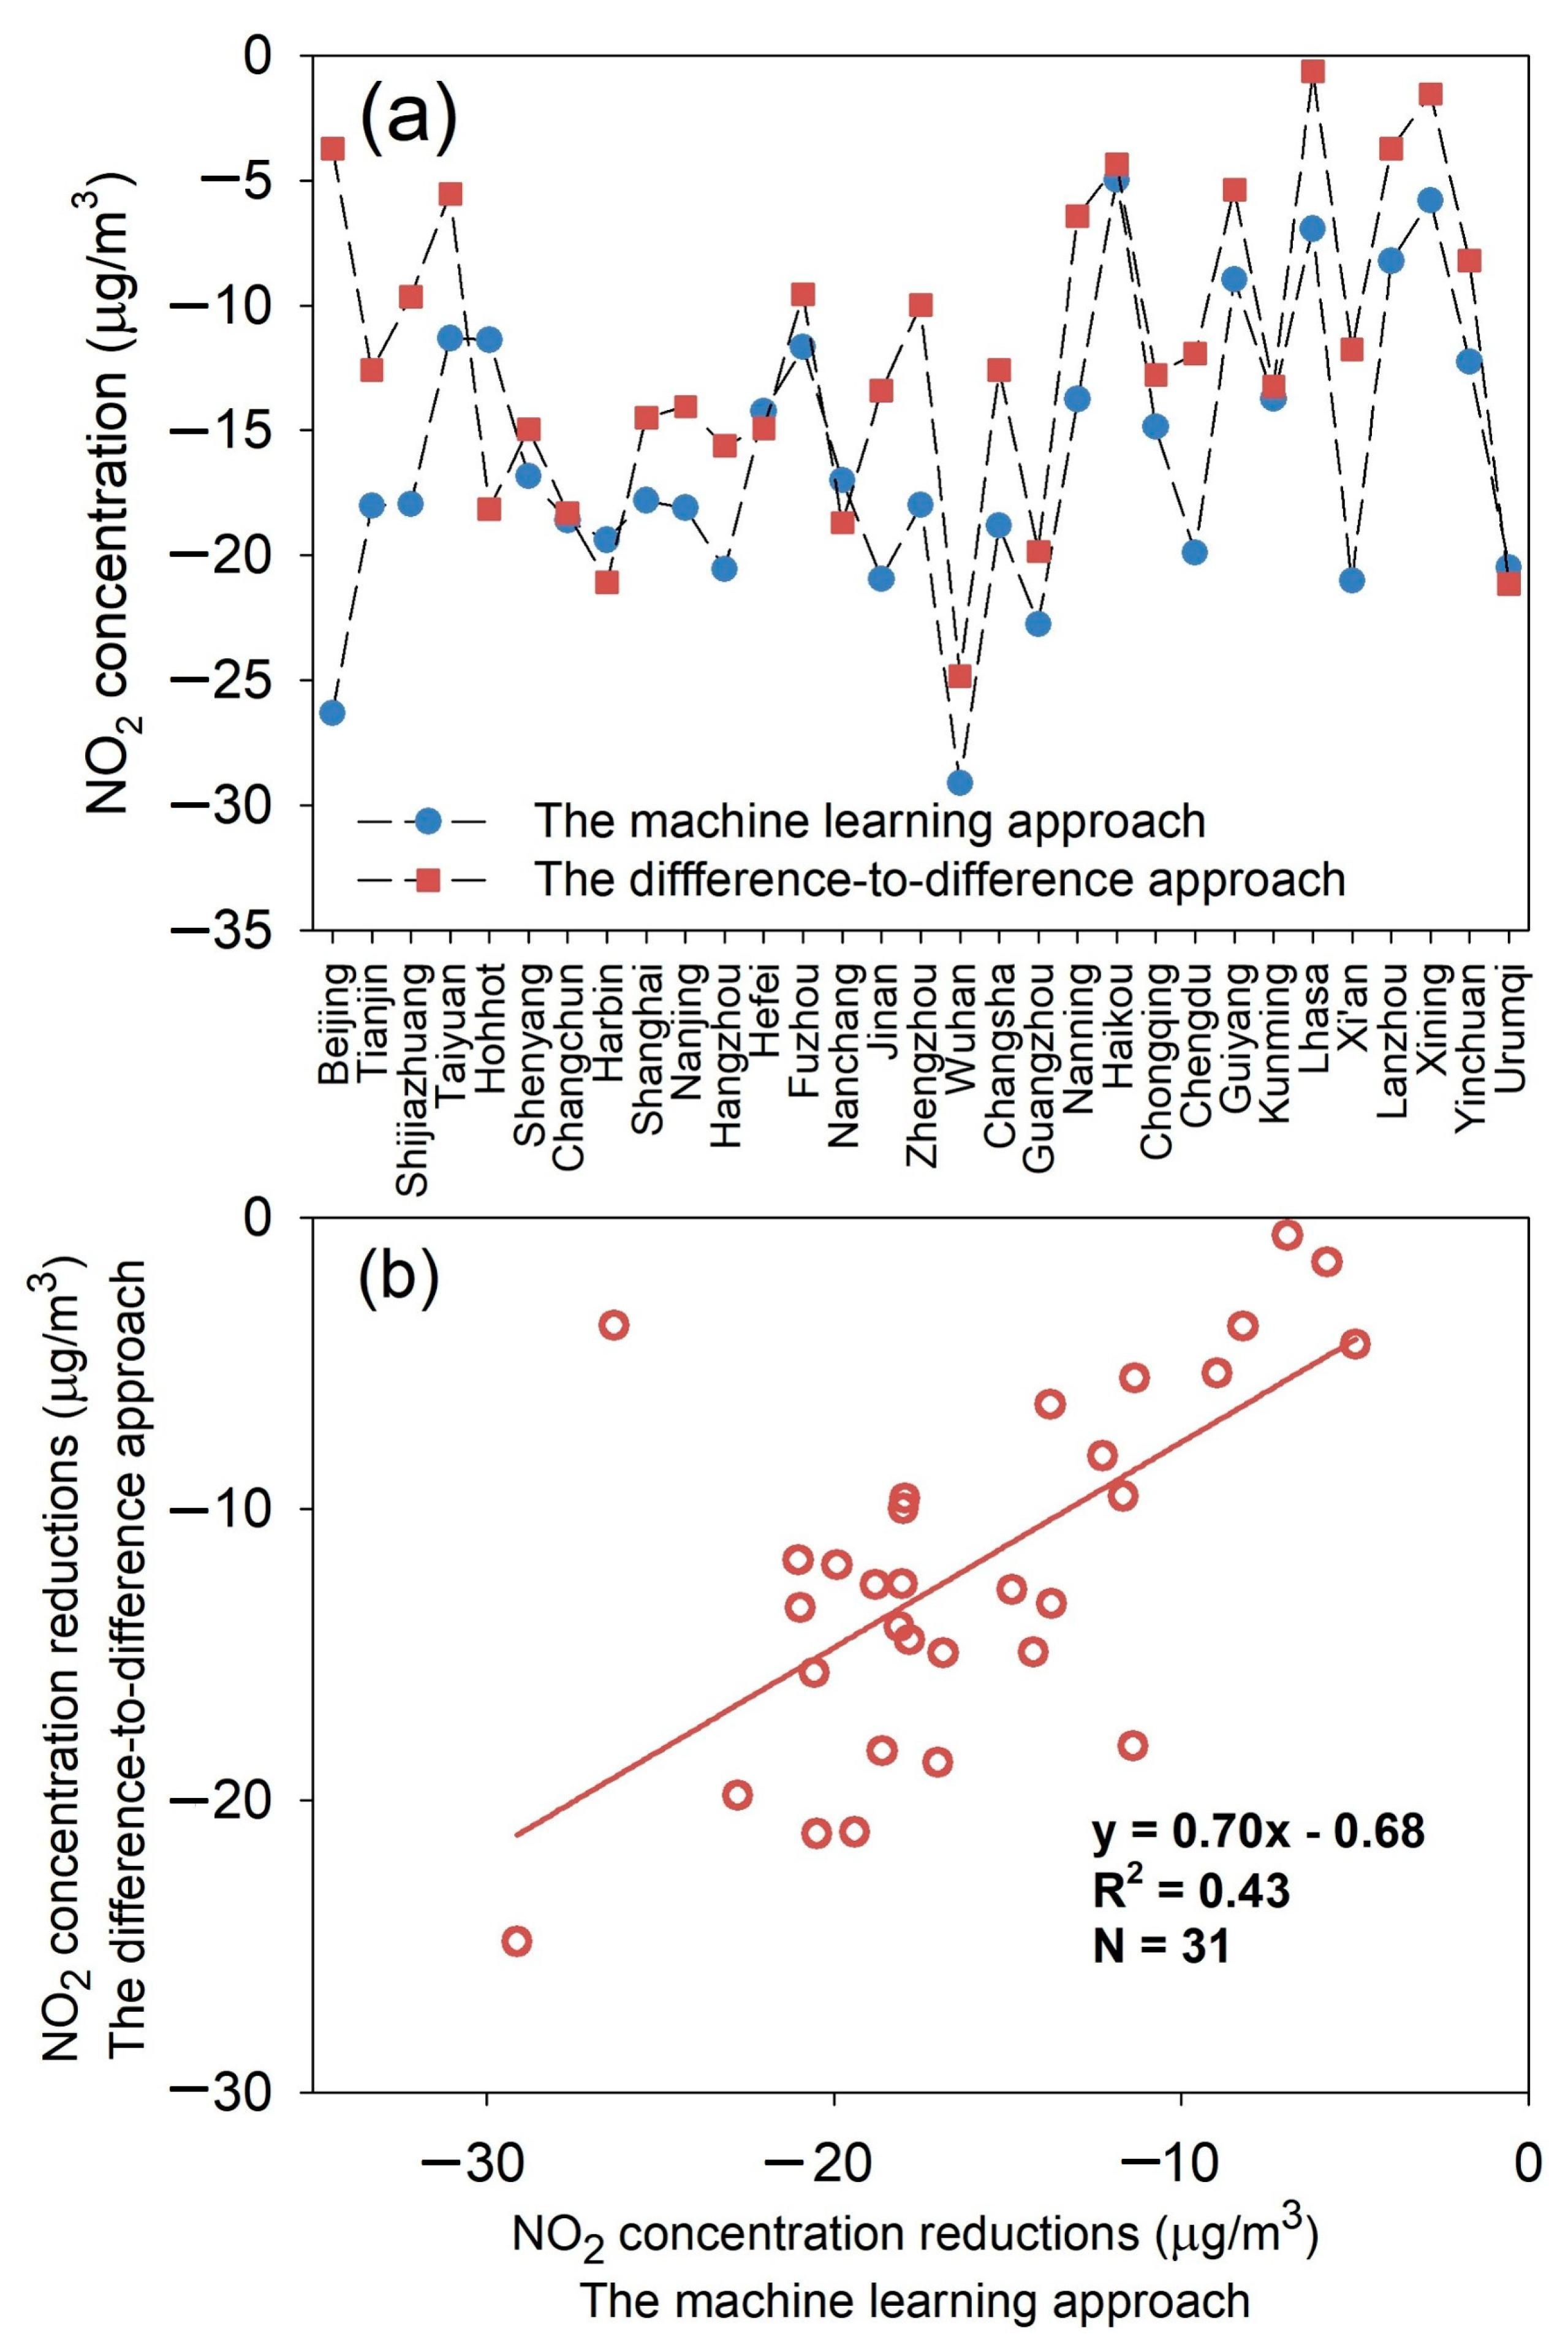
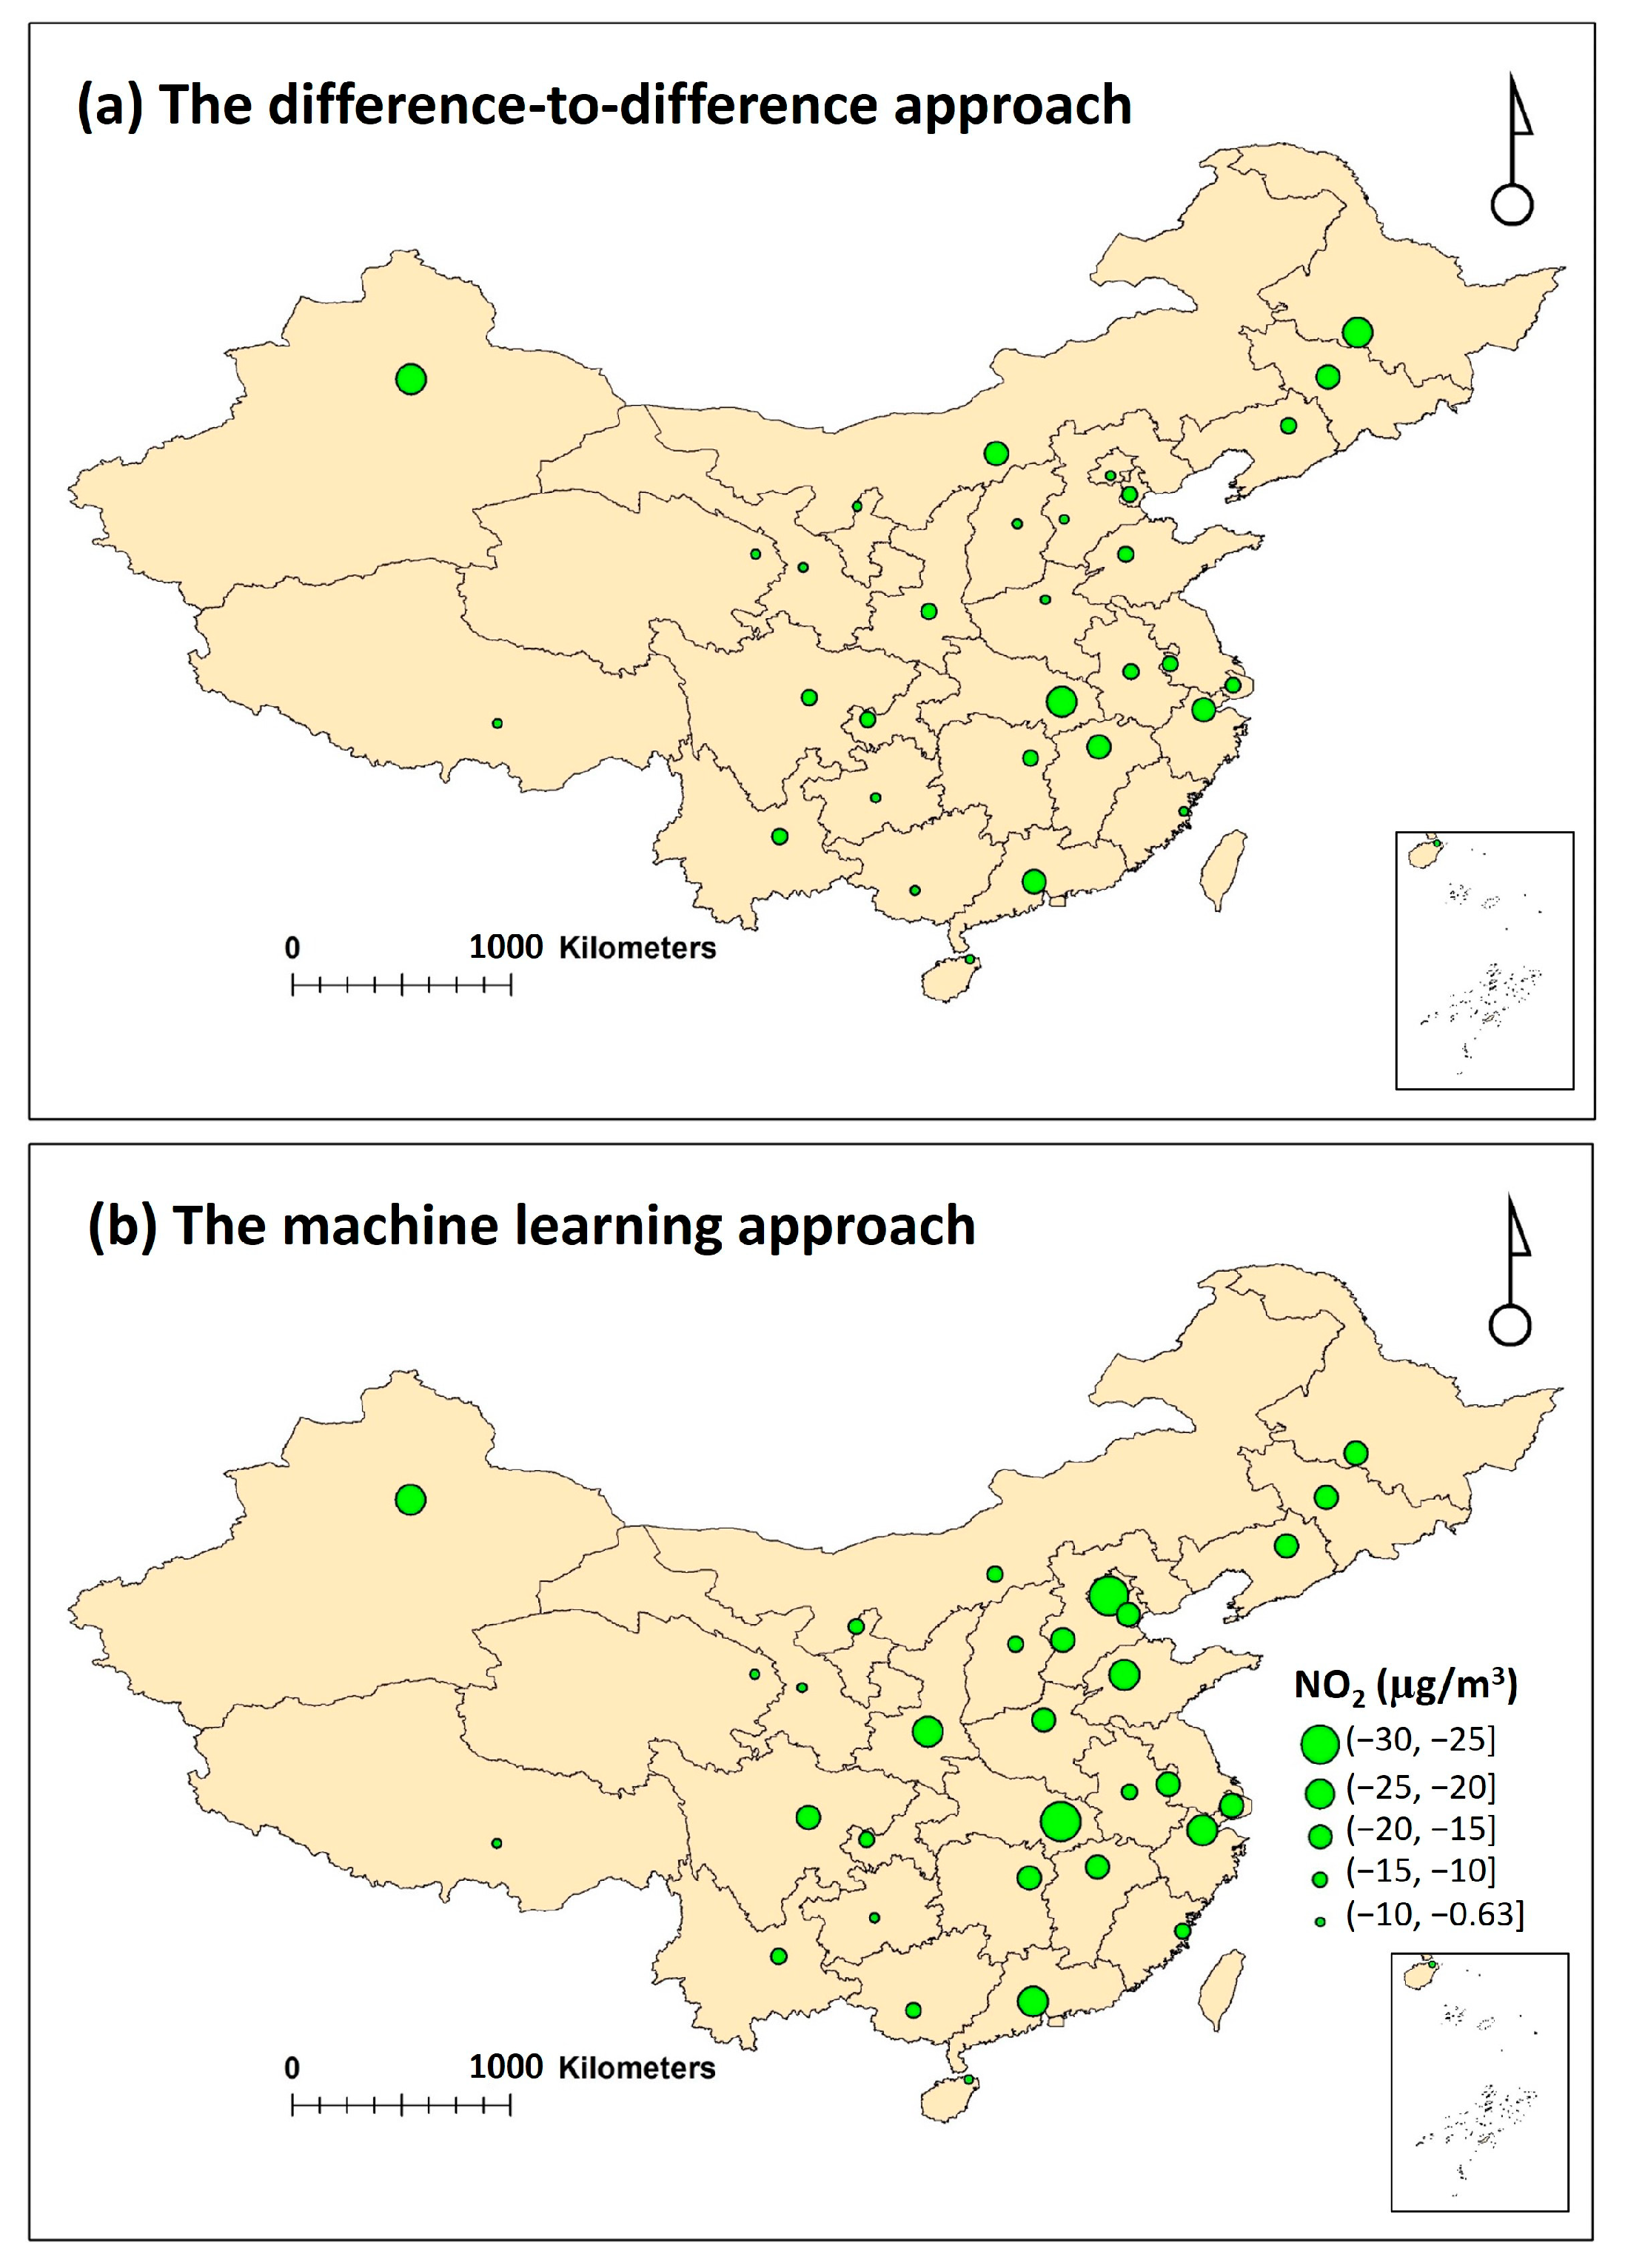
A similar spatial pattern was found between the machine learning and difference-to-difference-derived NO2 concentration reductions, but the exact estimated NO2 concentration reduction values for each city varied between the two approaches (Figure 2 and Figure 3). Compared with the machine learning approach, the difference-to-difference approach tends to underestimate the effect of COVID-19 lockdown measures on NO2 pollution; these two sets of estimates were generally moderately correlated, with the R2 value at 0.43 (Figure 2 and Figure 3, Table 2). The meteorological conditions in the 2020 COVID-19 lockdown period prevented the dispersion of air pollution with persistent low wind speed, frequent temperature inversion, and wind convergence compared with the pre-lockdown period [52,53]. The machine learning approach captured this meteorological variability better than the difference-to-difference approach, thus resulting in the discrepancies of the estimation results. In the following analysis, only the results using the machine learning approach are presented and discussed.

3.3. Spatiotemporal Variability of NO2 Concentration Reductions over China

As shown in Figure 4, during the pre-lockdown period, the random forest model-predicted NO2 concentrations generally captured the trend and most peak values of NO2 observations. For example, the IOA values for the pre-lockdown period was 0.72, 0.38, 0.52, 0.62, and 0.56, respectively, in Beijing, Shanghai, Guangzhou, Wuhan, and Xi’an, indicating the high predictive accuracy of the established random forest models. The time series plots confirmed this finding. There are clear gaps between the NO2 predictions and observations during the COVID-19 lockdown period. These differences can reasonably be inferred as the effect of COVID-19 lockdown measures on the NO2 pollution. During the post-lockdown period, the differences between NO2 predictions and observations are due to both the model uncertainty and the gradual recovery of human activities [13,14,54]. For example, there was still a clear difference between NO2 predictions and observations during the middle of March until the start of April in Wuhan (Figure 4). This is because the COVID-19 lockdown lasted a bit longer in Wuhan than other cities.
Due to the COVID-19 lockdown, the NO2 concentrations were reduced in all of the 31 studied cities, ranging from 5.0 µg/m3 (for Haikou) to 29 µg/m3 (for Wuhan). The reduction percentage varied from 15% (for Lanzhou) to 58% (for Wuhan) (Figure 2 and Figure 3, Table 2). Consistent with previous studies [7,10,24,52,55], a relatively larger reduction in NO2 concentration was observed in central eastern China, i.e., the Beijing–Tianjin–Hebei region, and the Yangtze River delta region. This is likely due to the fact that relatively strict lockdown measures were implemented in these areas. During the lockdown period, the urban traffic intensity and industrial activities were significantly reduced due to the reduction of human mobility [7,9,12,56].

3.4. Mortality Benefits from the Reduction of NO2 Pollution

Few studies have evaluated the human health benefits due to the air quality improvements during the COVID-19 lockdown period [57]. Our study tried to fill this gap by providing insights into the human health benefits of the COVID-19 lockdown with improved air quality. In the present work, we estimated the avoided total non-accidental mortalities, avoided cardiovascular mortalities, and avoided respiratory mortalities due to NO2 reductions during the COVID-19 lockdown period. The total avoided number of deaths for these three categories were 3722, 1861, and 604 (Figure 5). The number of avoided disease-related premature deaths is mainly affected by the NO2 concentration reduction level and the number of residents in the target cities. With the substantial reduction in NO2 concentrations and the larger number of residents, there is a larger number of estimated avoided disease-related premature deaths (Figure 5).

3.5. Atmospheric Implications

Previous studies usually only used the difference between the 2020 pollutant concentration level and the average pollutant concentration level over the previous several years to represent the effect of the COVID-19 lockdown on the air pollution [1,5,10,56,58]. For example, Chu et al. [10] found a significant reduction in NO2 concentrations during the COVID-19 lockdown period in 2020 compared with the 2019 level. Overall, this is a quite useful approach, but it does not take the variability of meteorological conditions into consideration [15,22,29]. The difference-to-difference approach roughly considered the variability in meteorological conditions with the pre-lockdown difference adjusted, but there is still uncertainty. The ACTMs can quantify the effect of meteorology but it is complex and time-consuming to perform these ACTM simulations [7,8,27]. In our study, the proposed random forest machine learning approach can accurately consider the year-to-year variability in the meteorology among the modelling period and it is generally easy and fast to conduct these machine learning simulations to obtain results. The ability of the proposed machine learning approach depends largely on the availability of predictor variables. The machine learning approach can be easily applied to the modelling of changes in multiple air pollutants from abrupt emission changes when the key data inputs are ready.
Our study confirmed that the sharp restrictions on human activities (e.g., reduction of traffic intensity) resulted in a direct reduction in NO2 pollution and associated health benefits. Several studies have reported that severe haze events with high PM2.5 concentrations occurred during the COVID-19 lockdown period [8,52], which is likely due to the unfavorable meteorological conditions (e.g., high humidity), the regional transport of secondary aerosols, and the uninterrupted emissions from some sources (e.g., power plants) [59]. The evolution of O3 during the COVID-19 lockdown period is even more complex because of the influence of meteorology and the discrepancy in its responses to the precursors [7,54]. We have tried to establish random forest machine learning models for PM2.5 and O3, but the statistical performance of the models for some cities was quite low. The possible reasons can be the quality of the datasets and the complex chemical reactions for the formation of these two air pollutants [13,29]. Take O3 as an example; it is formed through the chemical reactions between nitrogen oxides and volatile organic compounds under sunlight, and also affected by meteorology and regional transport [28]. In future studies, more efforts should be paid to work on the simulations of other air pollutants (e.g., PM2.5 and O3) for the design of a balanced control strategy for multiple air pollutants [59,60].
Our study highlights the fact that there should be a balance between the design of short-term vs. long-term air quality management. In the present study, due to the specific event of the COVID-19 lockdown, the short-term reduction in NO2 pollution was observed. However, with the society recovering to a normal status, the NO2 concentrations gradually increased to levels almost comparable with previous years (Figure 4). The rebound of NO2 concentrations during the post-lockdown period could provide useful insights for implementing sustainable long-term environmental policies. In the past two decades, China has implemented a set of control measures to mitigate air pollution. As a result of this, the NO2 concentration has decreased steadily [4]. Also, short-term emission regulations during specific events, like the APEC Blue and Parade Blue in Beijing, were successfully applied [61]. For the sustainable development of cities and society, a precise implementation of long-term air quality policies should be applied [9,62,63]. In the long-term, the air quality management policies of technological advances in vehicles and power generation, the adjustments of industry structures, and the adoption of new energy sources are recommended [1,14].

4. Conclusions

Compared with the difference-to-difference approach, the established random forest machine learning models accurately explained the impact of the drivers (e.g., lockdown policy and meteorology) of NO2 pollution. On average, it was estimated that the city-average NO2 concentration was reduced by 16 µg/m3 during the 2020 COVID-19 lockdown period, with 3722 avoided non-accidental deaths. Simulations on other cities and air pollutants using various analysis approaches should be performed to obtain a better understanding of the evolution of air quality during the COVID-19 lockdown period. The proposed methodology has the potential to be applied in other short-term emission reduction or emission-boosted cases, e.g., wildfire events or volcano eruption incidents, when the major predictor variables are available. Future studies should include datasets of satellite-based remote sensing and ACTM simulations as potential predictor variables to better capture the spatial variability of air pollution. Furthermore, other machine learning or deep learning algorithms should be tested in these types of case studies to further improve the predictive capability and understanding of variables influencing air quality.

Funding

This work was funded by the “100-top-talents Program” Start-up Grant of Sun Yat-sen University, China (220204) and the Fundamental Research Funds for the Central Universities, Sun Yat-sen University, China (23qnpy110).

Institutional Review Board Statement

Not applicable.

Informed Consent Statement

Not applicable.

Data Availability Statement

The data presented in this study are available on request from the corresponding author.

Acknowledgments

We would like to thank the China National Environmental Monitoring Center (http://www.cnemc.cn/ accessed on 15 October 2023) and the Global Historical Climatology Network Daily (https://www.ncdc.noaa.gov/ghcnd-data-access accessed on 15 October 2023) for providing air quality and meteorological data, respectively.

Conflicts of Interest

The author declares no conflicts of interest.

References

  1. Cooper, M.J.; Martin, R.V.; Hammer, M.S.; Levelt, P.F.; Veefkind, P.; Lamsal, L.N.; Krotkov, N.A.; Brook, J.R.; McLinden, C.A. Global fine-scale changes in ambient NO2 during COVID-19 lockdowns. Nature 2022, 601, 380–387. [Google Scholar] [CrossRef] [PubMed]
  2. Li, Z.; Yim, S.H.-L.; Ho, K.-F. High temporal resolution prediction of street-level PM2.5 and NOx concentrations using machine learning approach. J. Clean. Prod. 2020, 268, 121975. [Google Scholar] [CrossRef]
  3. Li, Z.; Che, W.; Hossain, S.; Fung, J.C.; Lau, A.K. Relative contributions of ambient air and internal sources to multiple air pollutants in public transportation modes. Environ. Pollut. 2023, 338, 122642. [Google Scholar] [CrossRef] [PubMed]
  4. Anenberg, S.C.; Mohegh, A.; Goldberg, D.L.; Kerr, G.H.; Brauer, M.; Burkart, K.; Hystad, P.; Larkin, A.; Wozniak, S.; Lamsal, L. Long-term trends in urban NO2 concentrations and associated paediatric asthma incidence: Estimates from global datasets. Lancet Planet. Health 2022, 6, e49–e58. [Google Scholar] [CrossRef] [PubMed]
  5. Bauwens, M.; Compernolle, S.; Stavrakou, T.; Müller, J.-F.; Van Gent, J.; Eskes, H.; Levelt, P.F.; van der A, R.; Veefkind, J.P.; Vlietinck, J.; et al. Impact of coronavirus outbreak on NO2 pollution assessed using TROPOMI and OMI observations. Geophys. Res. Lett. 2020, 47, e2020GL087978. [Google Scholar] [CrossRef] [PubMed]
  6. Liu, F.; Page, A.; Strode, S.A.; Yoshida, Y.; Choi, S.; Zheng, B.; Lamsal, L.N.; Li, C.; Krotkov, N.A.; Eskes, H.; et al. Abrupt decline in tropospheric nitrogen dioxide over China after the outbreak of COVID-19. Sci. Adv. 2020, 6, eabc2992. [Google Scholar] [CrossRef] [PubMed]
  7. Zhao, Y.; Zhang, K.; Xu, X.; Shen, H.; Zhu, X.; Zhang, Y.; Hu, Y.; Shen, G. Substantial changes in nitrogen dioxide and ozone after excluding meteorological impacts during the COVID-19 outbreak in mainland China. Environ. Sci. Technol. Lett. 2020, 7, 402–408. [Google Scholar] [CrossRef] [PubMed]
  8. Chang, Y.; Huang, R.-J.; Ge, X.; Huang, X.; Hu, J.; Duan, Y.; Zou, Z.; Liu, X.; Lehmann, M. Puzzling haze events in China during the coronavirus (COVID-19) shutdown. Geophys. Res. Lett. 2020, 47, e2020GL088533. [Google Scholar] [CrossRef]
  9. Wang, J.; Xu, X.; Wang, S.; He, S.; Li, X.; He, P. Heterogeneous effects of COVID-19 lockdown measures on air quality in Northern China. Appl. Energy 2021, 282, 116179. [Google Scholar] [CrossRef]
  10. Chu, B.; Zhang, S.; Liu, J.; Ma, Q.; He, H. Significant concurrent decrease in PM2.5 and NO2 concentrations in China during COVID-19 epidemic. J. Environ. Sci. 2020, 99, 346–353. [Google Scholar] [CrossRef]
  11. Wu, C.L.; Wang, H.W.; Cai, W.J.; Ni, A.N.; Peng, Z.R. Impact of the COVID-19 lockdown on roadside traffic-related air pollution in Shanghai, China. Build. Environ. 2021, 194, 107718. [Google Scholar] [CrossRef] [PubMed]
  12. Shi, Z.; Song, C.; Liu, B.; Lu, G.; Xu, J.; Van Vu, T.; Elliott, R.J.R.; Li, W.; Bloss, W.J.; Harrison, R.M. Abrupt but smaller than expected changes in surface air quality attributable to COVID-19 lockdowns. Sci. Adv. 2021, 7, eabd6696. [Google Scholar] [CrossRef] [PubMed]
  13. Wang, Y.; Wen, Y.; Wang, Y.; Zhang, S.; Zhang, K.M.; Zheng, H.; Xing, J.; Wu, Y.; Hao, J. Four-Month Changes in Air Quality during and after the COVID-19 Lockdown in Six Megacities in China. Environ. Sci. Technol. Lett. 2020, 7, 802–808. [Google Scholar] [CrossRef] [PubMed]
  14. Cai, W.-J.; Wang, H.-W.; Wu, C.-L.; Lu, K.-F.; Peng, Z.-R.; He, H.-D. Characterizing the interruption-recovery patterns of urban air pollution under the COVID-19 lockdown in China. J. Environ. Sci. 2021, 205, 108231. [Google Scholar] [CrossRef] [PubMed]
  15. Baldasano, J.M. COVID-19 lockdown effects on air quality by NO2 in the cities of Barcelona and Madrid (Spain). Sci. Total Environ. 2020, 741, 140353. [Google Scholar] [CrossRef] [PubMed]
  16. Briz-Redón, Á.; Belenguer-Sapiña, C.; Serrano-Aroca, Á. Changes in air pollution during COVID-19 lockdown in Spain: A multi-city study. J. Environ. Sci. 2020, 101, 16–26. [Google Scholar] [CrossRef] [PubMed]
  17. Kanniah, K.D.; Zaman, N.A.F.K.; Kaskaoutis, D.G.; Latif, M.T. COVID-19’s impact on the atmospheric environment in the Southeast Asia region. Sci. Total Environ. 2020, 736, 139658. [Google Scholar] [CrossRef] [PubMed]
  18. Kovács, K.D.; Haidu, I. Modeling NO2 air pollution variation during and after COVID-19-regulation using principal component analysis of satellite imagery. Environ. Pollut. 2024, 342, 122973. [Google Scholar] [CrossRef] [PubMed]
  19. Kumar, P.; Hama, S.; Omidvarborna, H.; Sharma, A.; Sahani, J.; Abhijith, K.V.; Debele, S.E.; Zavala-Reyes, J.C.; Barwise, Y.; Tiwari, A. Temporary reduction in fine particulate matter due to ‘anthropogenic emissions switch-off’during COVID-19 lockdown in Indian cities. Sustain. Cities Soc. 2020, 62, 102382. [Google Scholar] [CrossRef]
  20. Lee, H.J.; Kuwayama, T.; FitzGibbon, M. Simultaneous decreases in NO2 levels and disparities in California during the COVID-19 pandemic. Atmos. Environ. 2024, 318, 120214. [Google Scholar] [CrossRef]
  21. Lotrecchiano, N.; Trucillo, P.; Barletta, D.; Poletto, M.; Sofia, D. Air pollution analysis during the lockdown on the city of Milan. Processes 2021, 9, 1692. [Google Scholar] [CrossRef]
  22. Petetin, H.; Bowdalo, D.; Soret, A.; Guevara, M.; Jorba, O.; Serradell, K.; Pérez García-Pando, C. Meteorology-normalized impact of the COVID-19 lockdown upon NO2 pollution in Spain. Atmos. Chem. Phys. 2020, 20, 11119–11141. [Google Scholar] [CrossRef]
  23. Pietrogrande, M.C.; Colombi, C.; Cuccia, E.; Dal Santo, U.; Romanato, L. Seasonal and spatial variations of the oxidative properties of ambient PM2.5 in the Po Valley, Italy, before and during COVID-19 Lockdown Restrictions. Int. J. Environ. Res. Public Health 2023, 20, 1797. [Google Scholar] [CrossRef] [PubMed]
  24. Liu, Q.; Harris, J.T.; Chiu, L.S.; Sun, D.; Houser, P.R.; Yu, M.; Duffy, D.Q.; Little, M.M.; Yang, C. Spatiotemporal impacts of COVID-19 on air pollution in California, USA. Sci. Total. Environ. 2020, 750, 141592. [Google Scholar] [CrossRef] [PubMed]
  25. Filonchyk, M.; Hurynovich, V.; Yan, H. Impact of Covid-19 lockdown on air quality in the Poland, Eastern Europe. Environ. Res. 2021, 198, 110454. [Google Scholar] [CrossRef] [PubMed]
  26. Venter, Z.S.; Aunan, K.; Chowdhury, S.; Lelieveld, J. COVID-19 lockdowns cause global air pollution declines. Proc. Natl. Acad. Sci. USA 2020, 117, 18984–18990. [Google Scholar] [CrossRef] [PubMed]
  27. Xing, J.; Li, S.; Jiang, Y.; Wang, S.; Ding, D.; Dong, Z.; Zhu, Y.; Hao, J. Quantifying the emission changes and associated air quality impacts during the COVID-19 pandemic on the North China Plain: A response modeling study. Atmos. Chem. Phys. 2020, 20, 14347–14359. [Google Scholar] [CrossRef]
  28. Keller, C.A.; Evans, M.J.; Knowland, K.E.; Hasenkopf, C.A.; Modekurty, S.; Lucchesi, R.A.; Oda, T.; Franca, B.B.; Mandarino, F.C.; Suárez, M.V.D.; et al. Global impact of COVID-19 restrictions on the surface concentrations of nitrogen dioxide and ozone. Atmos. Chem. Phys. 2021, 21, 3555–3592. [Google Scholar] [CrossRef]
  29. Lovrić, M.; Pavlović, K.; Vuković, M.; Grange, S.K.; Haberl, M.; Kern, R. Understanding the true effects of the COVID-19 lockdown on air pollution by means of machine learning. Environ. Pollut. 2021, 274, 115900. [Google Scholar] [CrossRef]
  30. Pushpawela, B.; Shelton, S.; Liyanage, G.; Jayasekara, S.; Rajapaksha, D.; Jayasundara, A.; Das Jayasuriya, L. Changes of air pollutants in urban cities during the COVID-19 lockdown-Sri Lanka. Aerosol Air Qual. Res. 2023, 23, 220223. [Google Scholar] [CrossRef]
  31. Wyche, K.P.; Nichols, M.; Parfitt, H.; Beckett, P.; Gregg, D.J.; Smallbone, K.L.; Monks, P.S. Changes in ambient air quality and atmospheric composition and reactivity in the South East of the UK as a result of the COVID-19 lockdown. Sci. Total Environ. 2020, 755, 142526. [Google Scholar] [CrossRef] [PubMed]
  32. Ashayeri, M.; Abbasabadi, N.; Heidarinejad, M.; Stephens, B. Predicting intraurban PM2.5 concentrations using enhanced machine learning approaches and incorporating human activity patterns. Environ. Res. 2021, 196, 110423. [Google Scholar] [CrossRef] [PubMed]
  33. Bedi, J.S.; Dhaka, P.; Vijay, D.; Aulakh, R.S.; Gill, J.P.S. Assessment of air quality changes in the four metropolitan cities of India during COVID-19 pandemic lockdown. Aerosol Air Qual. Res. 2020, 20, 2062–2070. [Google Scholar] [CrossRef]
  34. Grange, S.K.; Carslaw, D.C. Using meteorological normalisation to detect interventions in air quality time series. Sci. Total. Environ. 2019, 653, 578–588. [Google Scholar] [CrossRef] [PubMed]
  35. Zhao, S.; Yin, D.; Yu, Y.; Kang, S.; Qin, D.; Dong, L. PM2.5 and O3 pollution during 2015–2019 over 367 Chinese cities: Spatiotemporal variations, meteorological and topographical impacts. Environ. Pollut. 2020, 264, 114694. [Google Scholar] [CrossRef] [PubMed]
  36. Vu, T.V.; Shi, Z.; Cheng, J.; Zhang, Q.; He, K.; Wang, S.; Harrison, R.M. Assessing the impact of clean air action on air quality trends in Beijing using a machine learning technique. Atmos. Chem. Phys. 2019, 19, 11303–11314. [Google Scholar] [CrossRef]
  37. Breiman, L. Random forests. Mach. Learning. 2001, 45, 5–32. [Google Scholar] [CrossRef]
  38. Li, Z.; Tong, X.; Ho, J.M.W.; Kwok, T.C.; Dong, G.; Ho, K.-F.; Yim, S.H.L. A practical framework for predicting residential indoor PM2.5 concentration using land-use regression and machine learning methods. Chemosphere 2021, 265, 129140. [Google Scholar] [CrossRef] [PubMed]
  39. Emery, C.; Liu, Z.; Russell, A.G.; Odman, M.T.; Yarwood, G.; Kumar, N. Recommendations on statistics and benchmarks to assess photochemical model performance. J. Air Waste Manag. Assoc. 2017, 67, 582–598. [Google Scholar] [CrossRef]
  40. Li, Z.; Ho, K.-F.; Lee, H.F.; Yim, S.H.L. Development of an integrated model framework for multi-air-pollutant exposure assessments in high-density cities. Atmos. Chem. Phys. 2024, 24, 649–661. [Google Scholar] [CrossRef]
  41. Li, Z.; Yim, S.H.L.; He, X.; Xia, X.; Ho, K.-F.; Yu, J.Z. High spatial resolution estimates of major PM2.5 components and their associated health risks in Hong Kong using a coupled land use regression and health risk assessment approach. Sci. Total. Environ. 2024, 907, 167932. [Google Scholar] [CrossRef] [PubMed]
  42. Zhang, Y.; Zhao, B.; Jiang, Y.; Xing, J.; Sahu, S.K.; Zheng, H.; Ding, D.; Cao, S.; Han, L.; Yan, C.; et al. Non-negligible contributions to human health from increased household air pollution exposure during the COVID-19 lockdown in China. Environ. Int. 2022, 158, 106918. [Google Scholar] [CrossRef] [PubMed]
  43. Anenberg, S.C.; Horowitz, L.W.; Tong, D.Q.; West, J.J. An estimate of the global burden of anthropogenic ozone and fine particulate matter on premature human mortality using atmospheric modeling. Environ. Health Perspect. 2010, 118, 1189–1195. [Google Scholar] [CrossRef] [PubMed]
  44. Izquierdo, R.; Dos Santos, S.G.; Borge, R.; de la Paz, D.; Sarigiannis, D.; Gotti, A.; Boldo, E. Health impact assessment by the implementation of Madrid City air-quality plan in 2020. Environ. Res. 2020, 183, 109021. [Google Scholar] [CrossRef] [PubMed]
  45. Chen, R.; Yin, P.; Meng, X.; Wang, L.; Liu, C.; Niu, Y.; Lin, Z.; Liu, Y.; Liu, J.; Qi, J.; et al. Associations between ambient nitrogen dioxide and daily cause-specific mortality: Evidence from 272 Chinese cities. Epidemiology 2018, 29, 482–489. [Google Scholar] [CrossRef] [PubMed]
  46. USEPA (United States Environmental Protection Agency). Guidance on the Use of Models and Other Analyses for Demonstrating Attainment of Air Quality Goals for Ozone, PM2.5, and Regional Haze; 2007. Available online: https://nepis.epa.gov/Exe/ZyPDF.cgi/P1009OL1.PDF?Dockey=P1009OL1.PDF (accessed on 15 October 2023).
  47. Latif, M.T.; Dominick, D.; Hawari, N.S.S.L.; Mohtar, A.A.A.; Othman, M. The concentration of major air pollutants during the movement control order due to the COVID-19 pandemic in the Klang Valley, Malaysia. Sustain. Cities Soc. 2020, 66, 102660. [Google Scholar] [CrossRef] [PubMed]
  48. Sathe, Y.; Gupta, P.; Bawase, M.; Lamsal, L.; Patadia, F.; Thipse, S. Surface and satellite observations of air pollution in India during COVID-19 lockdown: Implication to air quality. Sustain. Cities Soc. 2021, 66, 102688. [Google Scholar] [CrossRef] [PubMed]
  49. Shen, Y.; Jiang, F.; Feng, S.; Zheng, Y.; Cai, Z.; Lyu, X. Impact of weather and emission changes on NO2 concentrations in China during 2014–2019. Environ. Pollut. 2021, 269, 116163. [Google Scholar] [CrossRef] [PubMed]
  50. Harkey, M.; Holloway, T.; Oberman, J.; Scotty, E. An evaluation of CMAQ NO2 using observed chemistry-meteorology correlations. J. Geophys. Res. Atmos. 2015, 120, 11–775. [Google Scholar] [CrossRef]
  51. Fu, X.; Xiang, S.; Liu, Y.; Liu, J.; Yu, J.; Mauzerall, D.L.; Tao, S. High-resolution simulation of local traffic-related NOx dispersion and distribution in a complex urban terrain. Environ. Pollut. 2020, 263, 114390. [Google Scholar] [CrossRef]
  52. Le, T.; Wang, Y.; Liu, L.; Yang, J.; Yung, Y.L.; Li, G.; Seinfeld, J.H. Unexpected air pollution with marked emission reductions during the COVID-19 outbreak in China. Science 2020, 369, 702–706. [Google Scholar] [CrossRef] [PubMed]
  53. Li, M.; Wang, T.; Xie, M.; Li, S.; Zhuang, B.; Fu, Q.; Zhao, M.; Wu, H.; Liu, J.; Saikawa, E.; et al. Drivers for the poor air quality conditions in North China Plain during the COVID-19 outbreak. Atmos. Environ. 2021, 246, 118103. [Google Scholar] [CrossRef] [PubMed]
  54. Han, L.; Zhao, J.; Gu, Z. Assessing air quality changes in heavily polluted cities during the COVID-19 pandemic: A case study in Xi’an, China. Sustain. Cities Soc. 2021, 70, 102934. [Google Scholar] [CrossRef]
  55. Huang, G.; Sun, K. Non-negligible impacts of clean air regulations on the reduction of tropospheric NO2 over East China during the COVID-19 pandemic observed by OMI and TROPOMI. Sci. Total. Environ. 2020, 745, 141023. [Google Scholar] [CrossRef] [PubMed]
  56. Wang, Q.; Li, S. Nonlinear impact of COVID-19 on pollutions–Evidence from Wuhan, New York, Milan, Madrid, Bandra, London, Tokyo and Mexico City. Sustain. Cities Soc. 2021, 65, 102629. [Google Scholar] [CrossRef]
  57. Liu, F.; Wang, M.; Zheng, M. Effects of COVID-19 lockdown on global air quality and health. Sci. Total. Environ. 2021, 755, 142533. [Google Scholar] [CrossRef]
  58. Shi, X.; Brasseur, G.P. The Response in Air Quality to the Reduction of Chinese Economic Activities during the COVID-19 Outbreak. Geophys. Res. Lett. 2020, 47, e2020GL088070. [Google Scholar] [CrossRef]
  59. Jiang, Z.; Shi, H.; Zhao, B.; Gu, Y.; Zhu, Y.; Miyazaki, K.; Lu, X.; Zhang, Y.; Bowman, K.W.; Sekiya, T.; et al. Modeling the impact of COVID-19 on air quality in southern California: Implications for future control policies. Atmos. Chem. Phys. 2021, 21, 8693–8708. [Google Scholar] [CrossRef]
  60. Conte, M.; Dinoi, A.; Grasso, F.M.; Merico, E.; Guascito, M.R.; Contini, D. Concentration and size distribution of atmospheric particles in southern Italy during COVID-19 lockdown period. Atmos. Environ. 2023, 295, 119559. [Google Scholar] [CrossRef]
  61. Lin, H.; Liu, T.; Fang, F.; Xiao, J.; Zeng, W.; Li, X.; Guo, L.; Tian, L.; Schootman, M.; Stamatakis, K.A.; et al. Mortality benefits of vigorous air quality improvement interventions during the periods of APEC Blue and Parade Blue in Beijing, China. Environ. Pollut. 2017, 220, 222–227. [Google Scholar] [CrossRef]
  62. Kumari, P.; Toshniwal, D. Impact of lockdown measures during COVID-19 on air quality—A case study of India. Int. J. Environ. Health Res. 2022, 32, 503–510. [Google Scholar] [CrossRef] [PubMed]
  63. Tao, C.; Wheiler, K.; Yu, C.; Cheng, B.; Diao, G. Does the joint prevention and control regulation improve the air quality? A quasi-experiment in the Beijing economic belt during the COVID-19 pandemic. Sustain. Cities Soc. 2021, 75, 103365. [Google Scholar] [CrossRef] [PubMed]
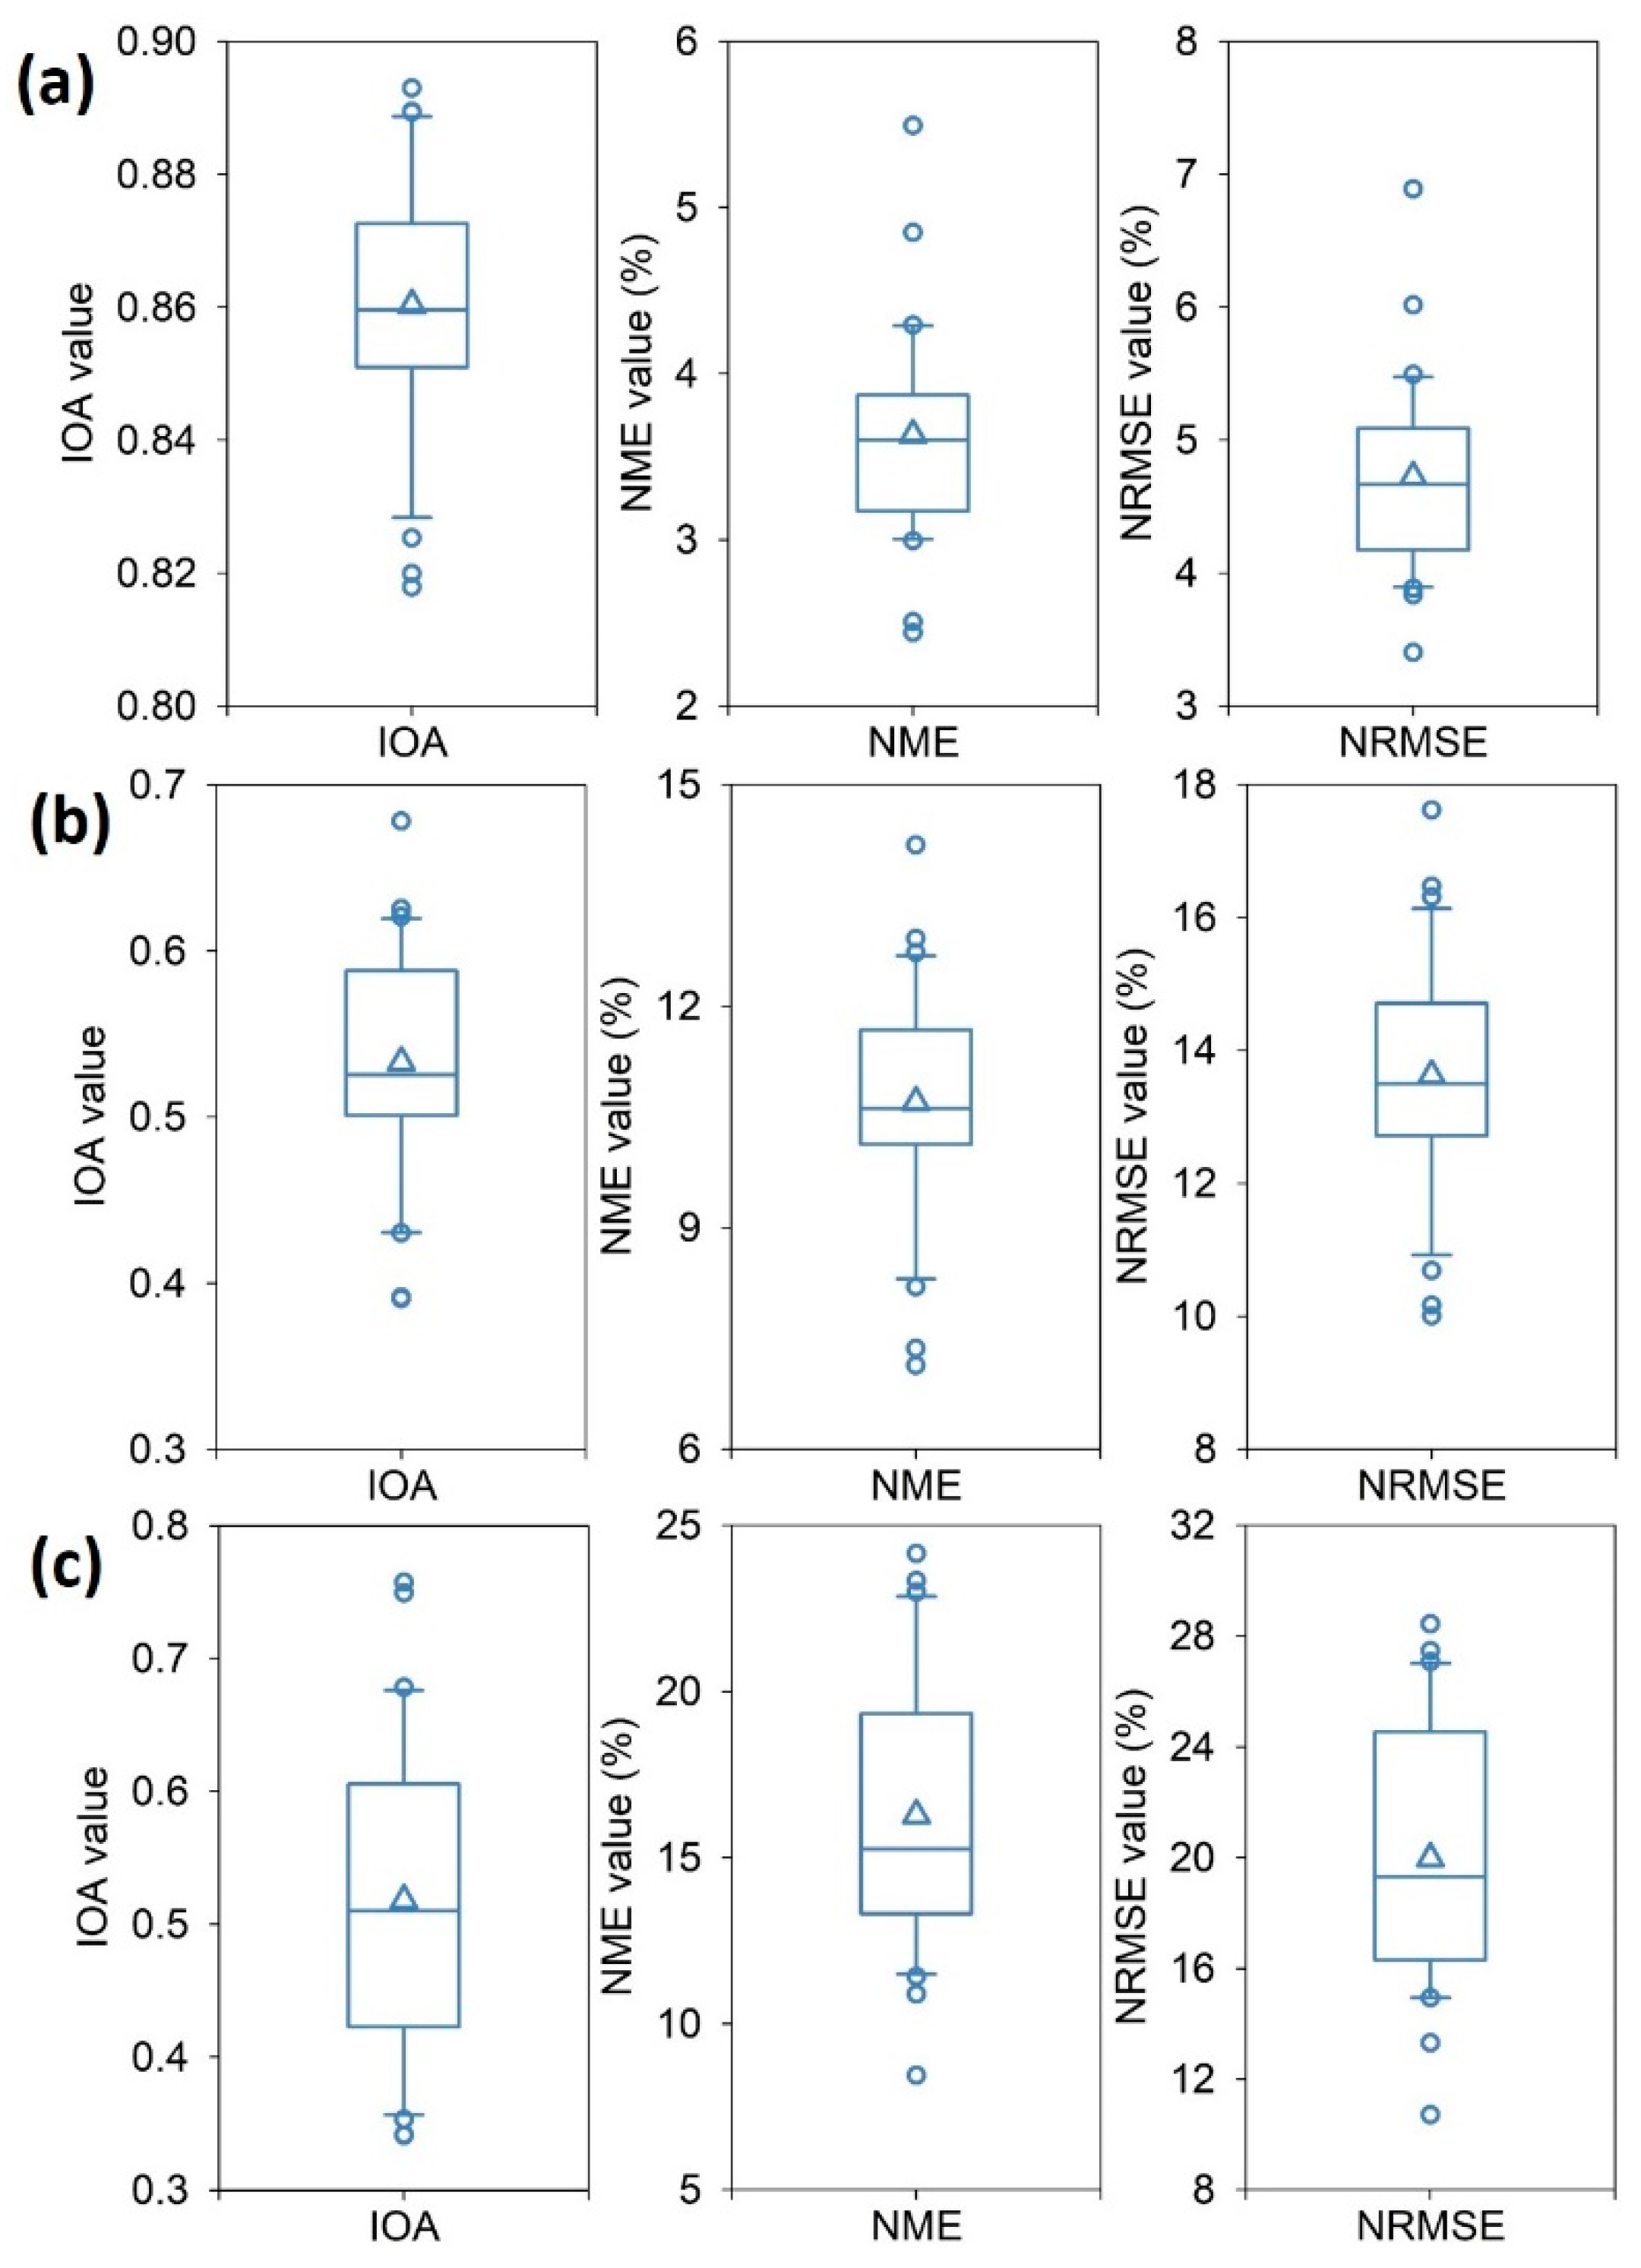
Figure 1. The box plots of IOA, NME, and NRMSE values for the (a) development, (b) three-year cross-validation, and (c) 2020 NO2 concentration predictions. The triangle in each box is the mean value, the solid line is the median value, the box extends from 25th to 75th percentile, the whiskers (error bars) below and above the box are the 10th and 90th percentiles, and the below and upper cycle symbols are the outliers. (For interpretation of the references to color in this figure legend, the reader is referred to the Web version of this article).
Toxics 12 00580 g001
Figure 2. The comparison between the machine learning and difference-to-difference approaches. (a) The NO2 concentration reductions estimated by the two approaches, and (b) the correlations between the NO2 concentration reductions estimated by the two approaches.
Toxics 12 00580 g002
Figure 3. The spatial distribution of NO2 concentration changes due to the COVID-19 lockdown using (a) the machine learning and (b) difference-to-difference approaches. The base map is the distribution of China’s provinces, which was retrieved from the website of Resource and Environmental Science Data Platform (https://www.resdc.cn/DOI/DOI.aspx?DOIID=122 accessed on 15 October 2023).
Toxics 12 00580 g003
Figure 4. Time series of NO2 predictions and observations during 1 December 2019 to 30 April 2020 in five selected cities, including (a) Beijing, (b) Shanghai, (c) Guangzhou, (d) Wuhan, and (e) Xi’an.
Toxics 12 00580 g004
Figure 5. The estimated avoided disease-related deaths, including non-accidental diseases, cardiovascular diseases, and respiratory diseases.
Toxics 12 00580 g005
Table 1. The statistics of normalized variable importance (%) for the random forest models.
Predictor VariablesVariable Importance (%)
MinimumMaximumMean
Year4.42511
Day_julian7.91711
Day_lunar102417
Wind direction4.7169.6
Wind speed5.23625
Temperature7.61612
Relative humidity3.63014
Table 2. The NO2 concentration reductions (µg/m3) due to COVID-19 lockdown estimated by the machine learning and difference-to-difference approaches.
CityNO2 Concentration Reductions
The Machine Learning ApproachThe Difference-to-Difference Approach
Beijing−26−3.7
Tianjin−18−13
Shijiazhuang−18−9.6
Taiyuan−11−5.5
Hohhot−11−18
Shenyang−17−15
Changchun−19−18
Harbin−19−21
Shanghai−18−15
Nanjing−18−14
Hangzhou−21−16
Hefei−14−15
Fuzhou−12−10
Nanchang−17−19
Jinan−21−13
Zhengzhou−18−10
Wuhan−29−25
Changsha−19−13
Guangzhou−23−20
Nanning−14−6.4
Haikou−5−4.4
Chongqing−15−13
Chengdu−20−12
Guiyang−9−5.4
Kunming−14−13
Lhasa−6.9−0.63
Xi’an−21−12
Lanzhou−8.2−3.7
Xining−5.8−1.5
Yinchuan−12−8.2
Urumqi−20−21
Disclaimer/Publisher’s Note: The statements, opinions and data contained in all publications are solely those of the individual author(s) and contributor(s) and not of MDPI and/or the editor(s). MDPI and/or the editor(s) disclaim responsibility for any injury to people or property resulting from any ideas, methods, instructions or products referred to in the content.