
A Review of Potentially Toxic Elements in Sediment, Water, and Aquatic Species from the River Ecosystems

 ,
,  , ,
, ,
Abstract
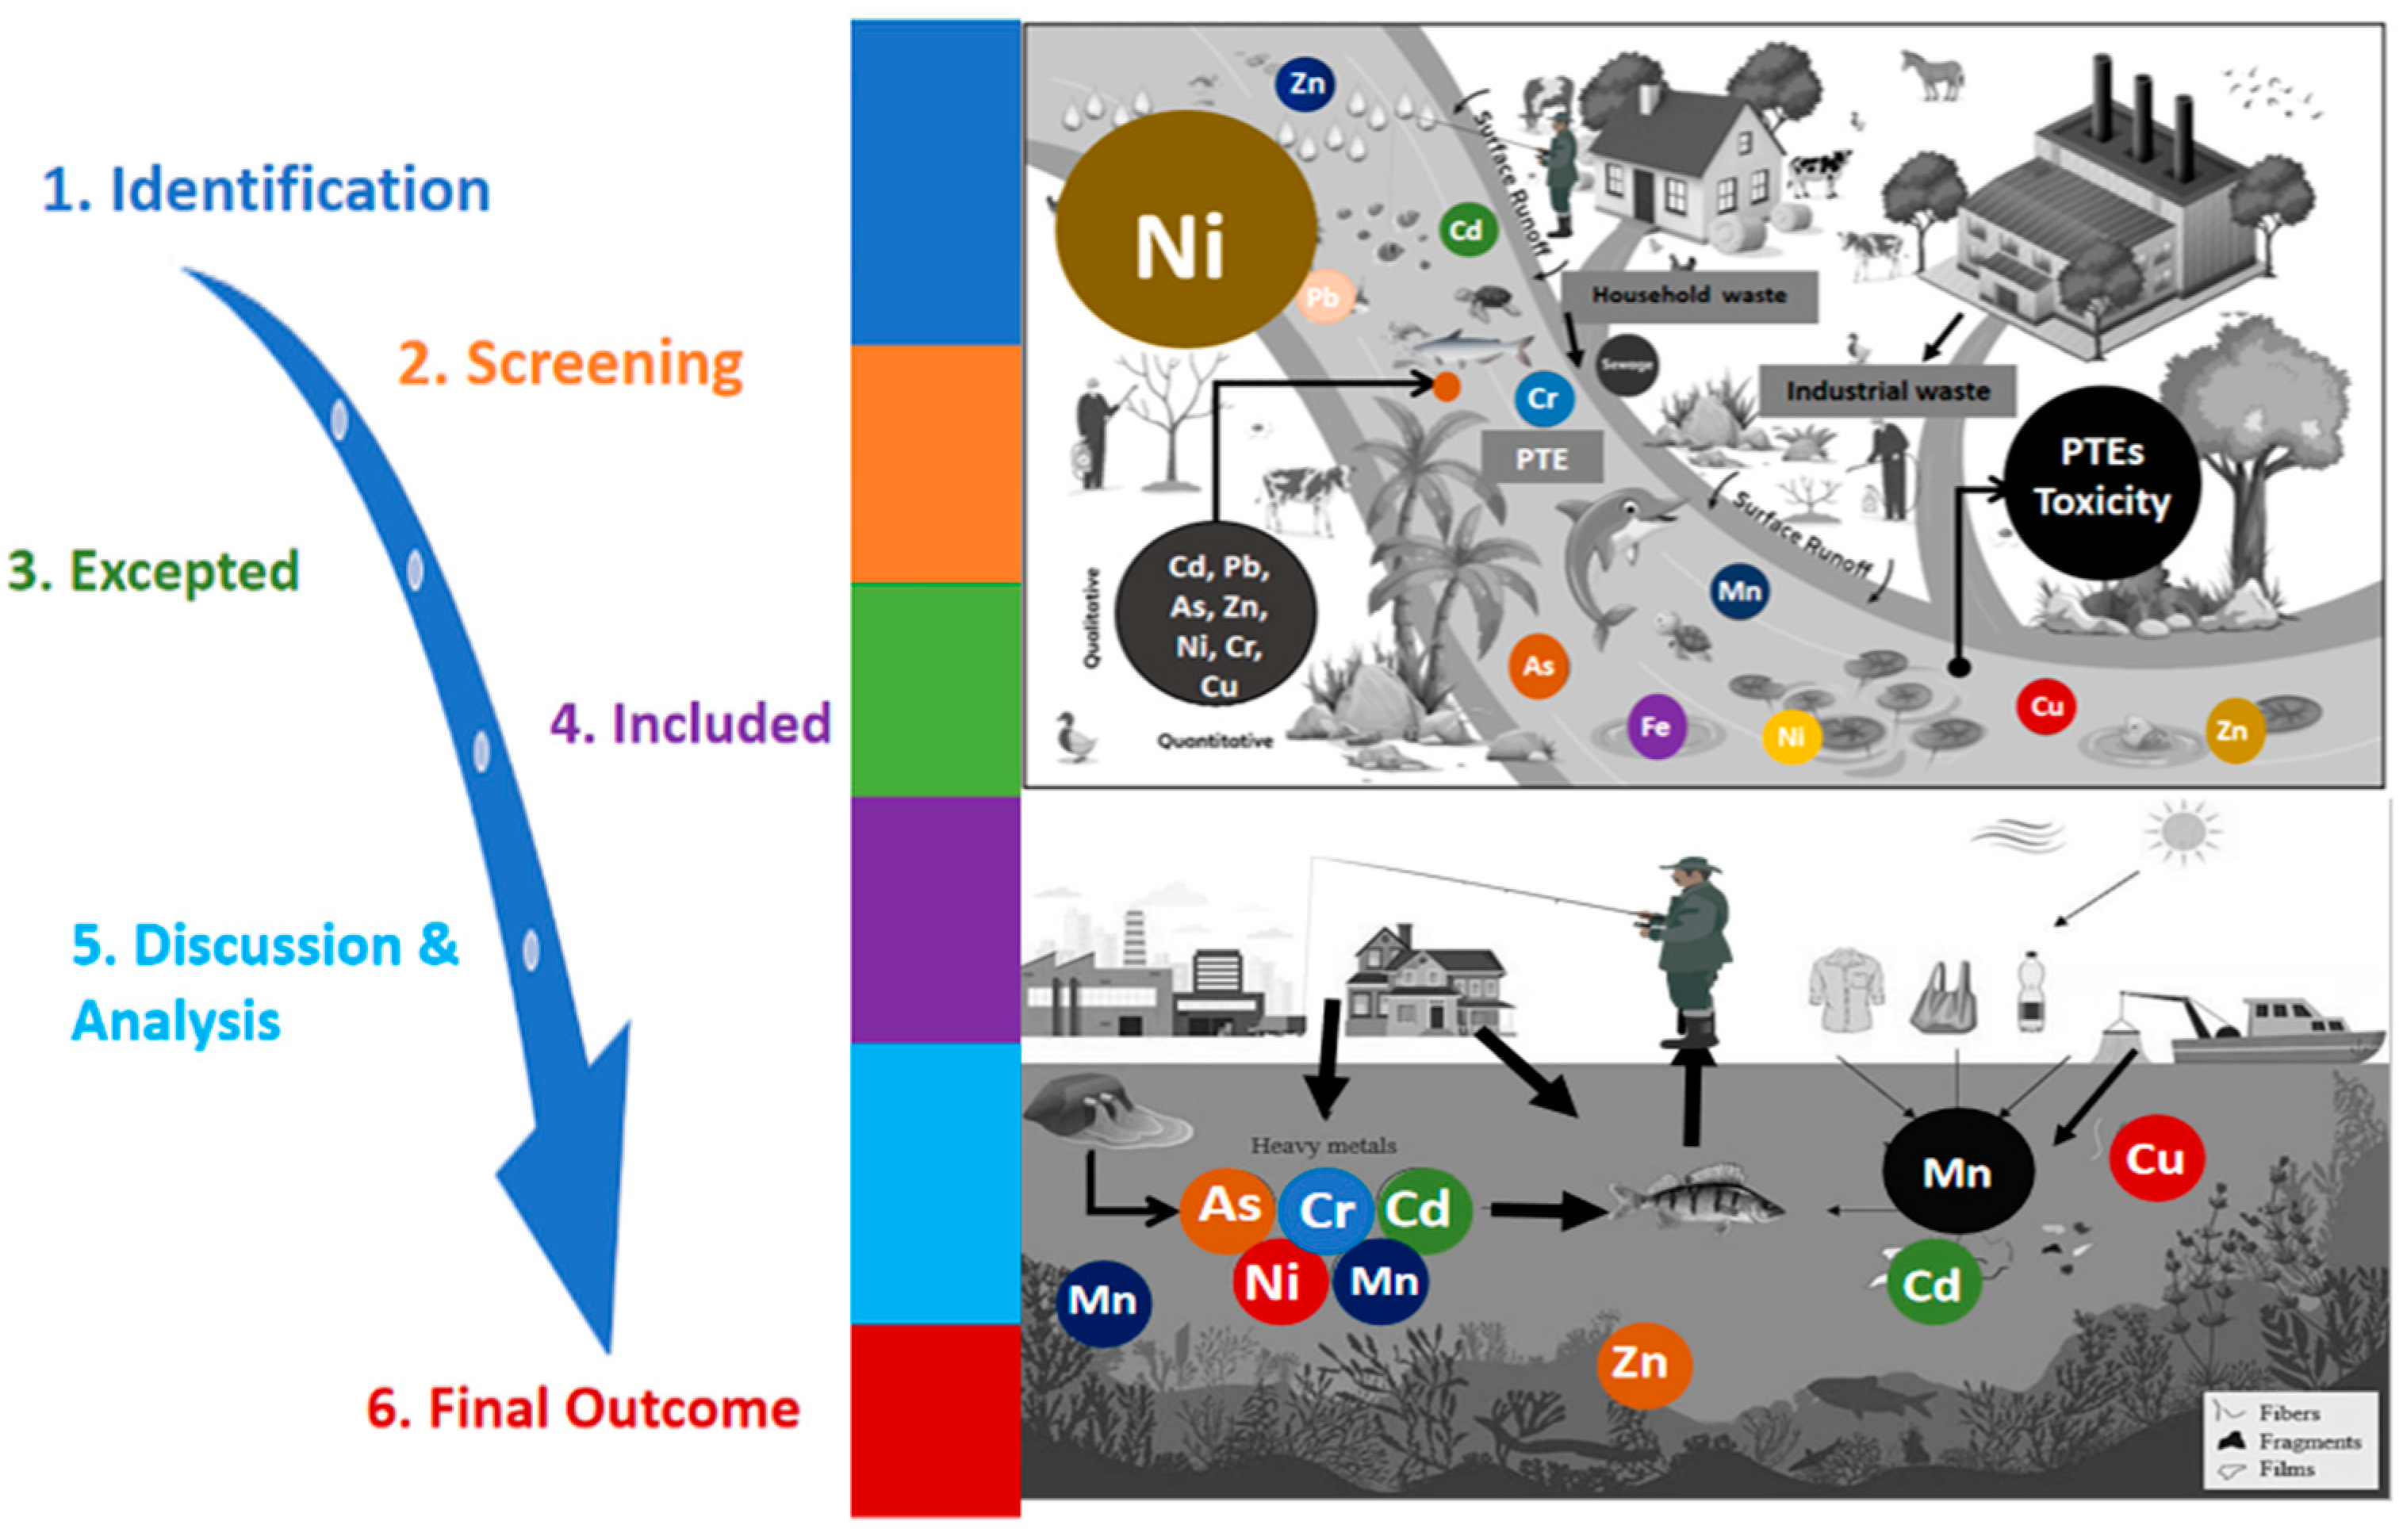
:1. Introduction
Source of Pollution
2. Screening and Systematic Approach

| Principal Indexing Factor | Description and Objectives |
|---|---|
| Cif = Ci/Cin Cd = ∑Cif (n, i = 1) PLI = (Cf1 × Cf2 × Cf3 × Cf n)1/n Igeo = Log2 () Eir = Tir × Cif PER = ∑ Eir ( i = 1) (x) TCR | PTEs is potential toxic elements. In the equation, Cif is a contamination factor; Ci is the quantified value of PTE in sediments; and the elemental reference value for the same metal follows Taylor [36]; and Cin is the background concentration following Hilton et al. [37] and Karadede and Unlu [38]. Cd is the degree of contamination; PLI is the Pollution Load Index, following Suresh et al. [39]. Igeo is the geoaccumulation index following Müller’s [40] technique. Cn is the metal concentration in sediment (n); Bn is the metal (n)’s geochemical background value; and the factor 1.5 is the possible variation in background data to lithogenic impacts, following Rabee et al. [41]. Eir is the potential ecological risk index for an individual element. Tir is the biological toxic factor for individual elements and is 5, 30, 2, 5, 1, and 6 for Pb, Cd, Cr, Cu, Zn, and Ni, respectively, following Hakanson [42]. PER is the potential ecological risk index, follows Guo et al. [43] and Hossain et al.’s [22] technique. Non-carcinogenic and carcinogenic: THQ, Target hazard quotient; HI, Hazard Index; TCR, Target Cancer Risk. |
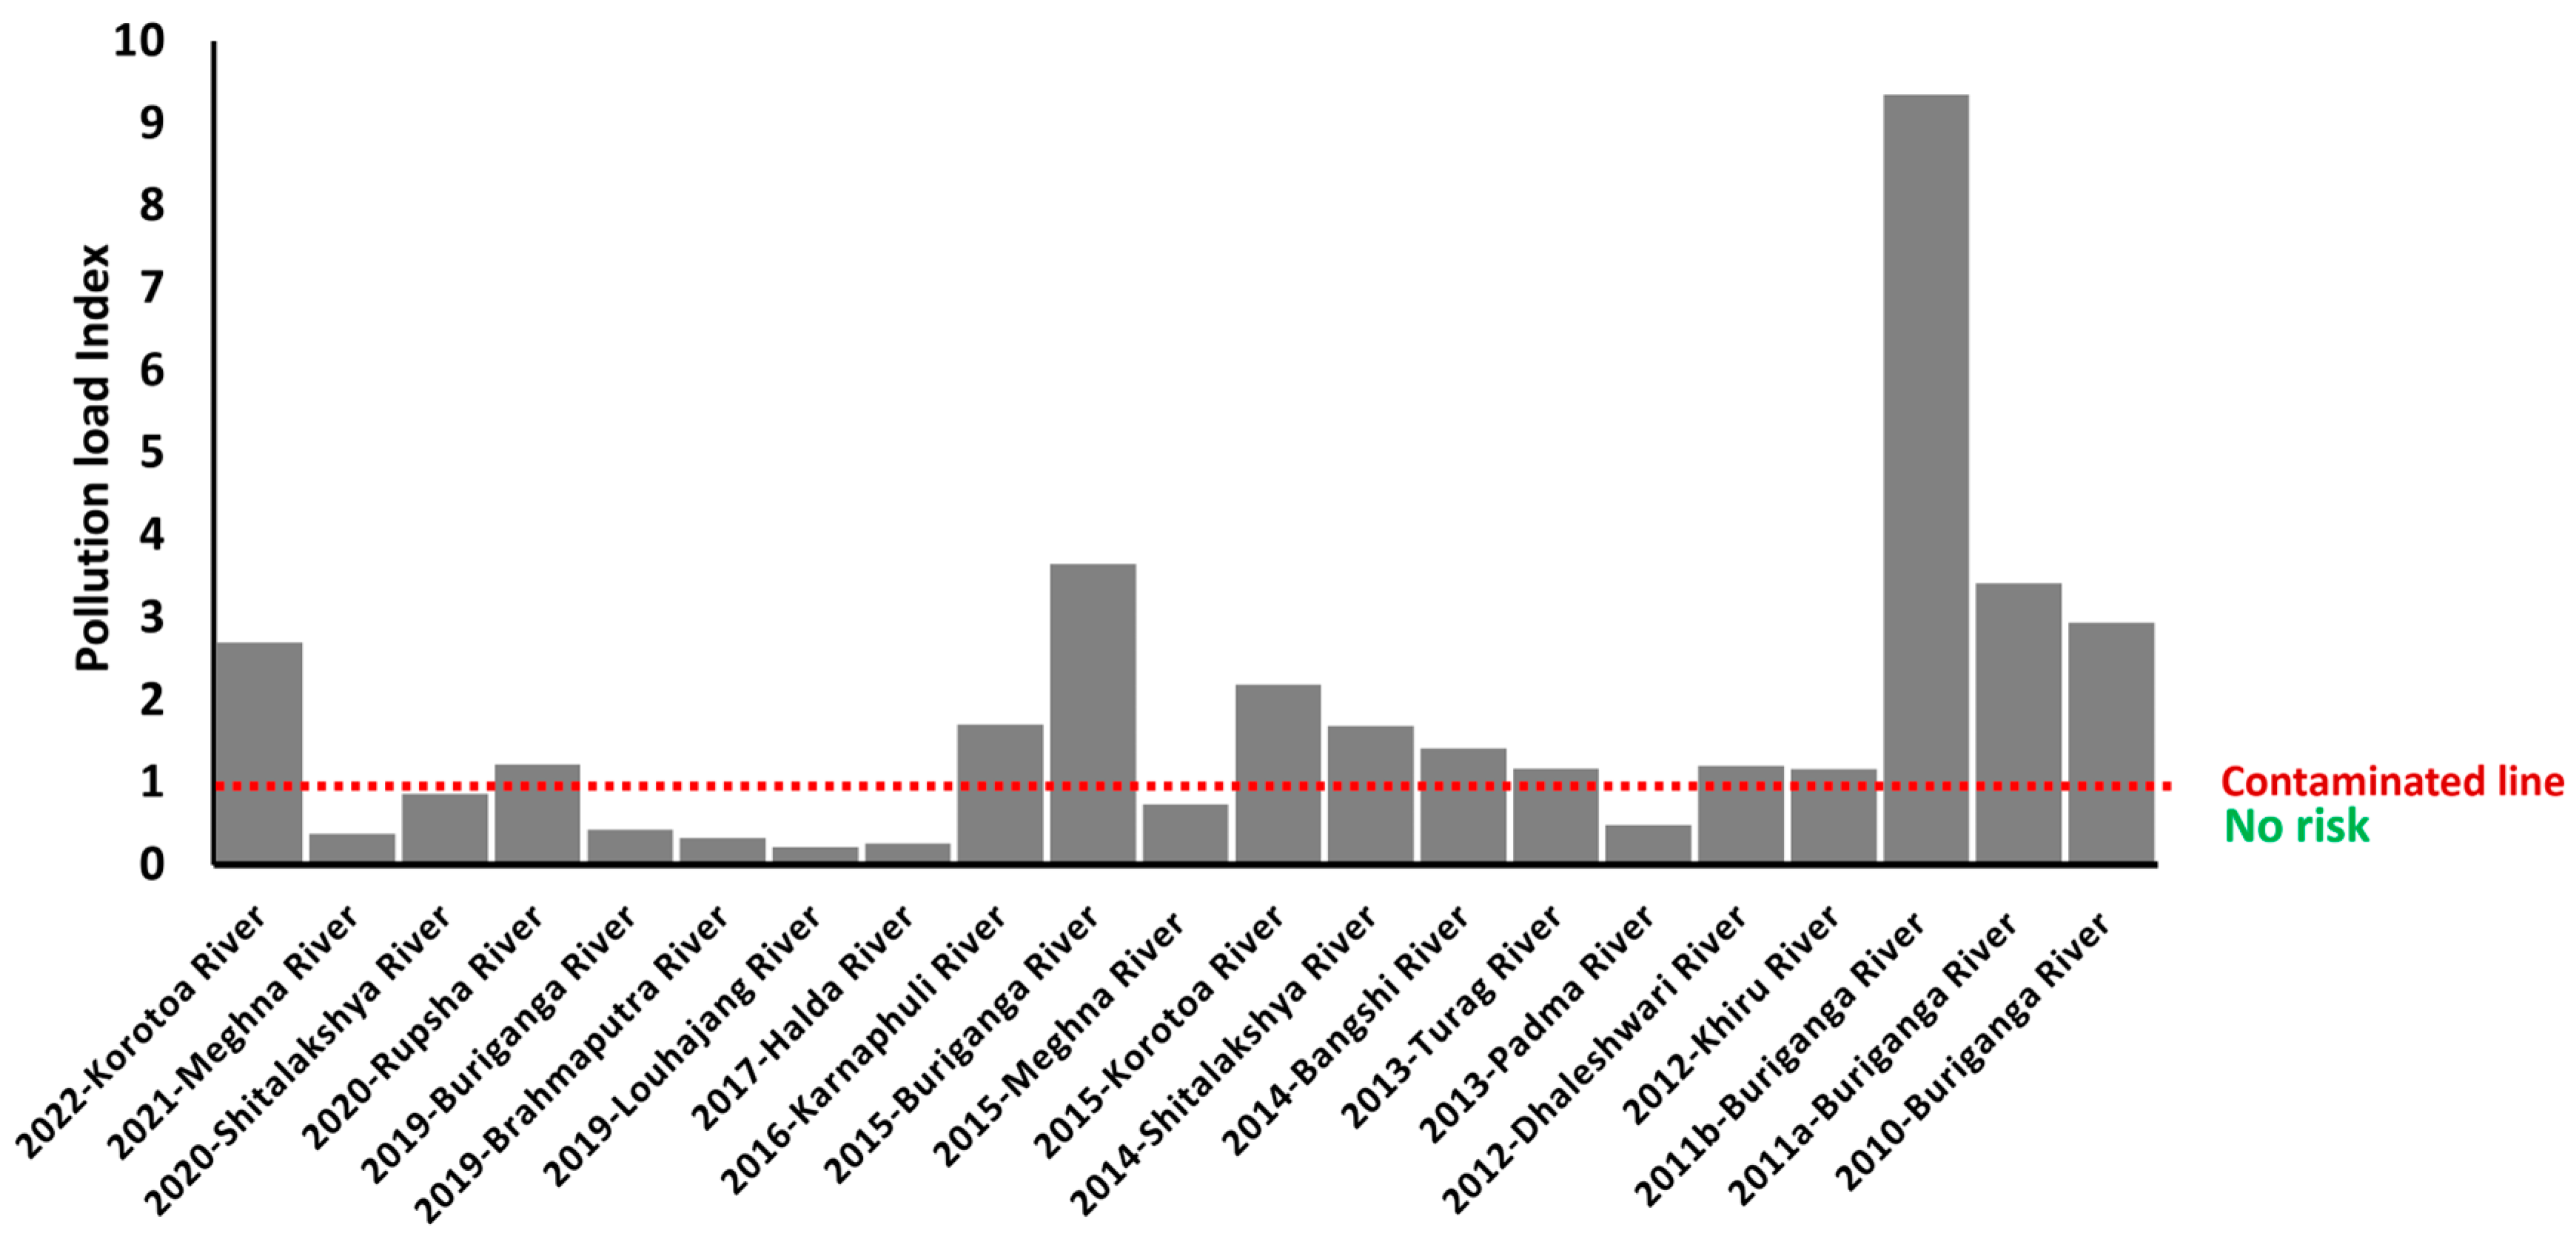
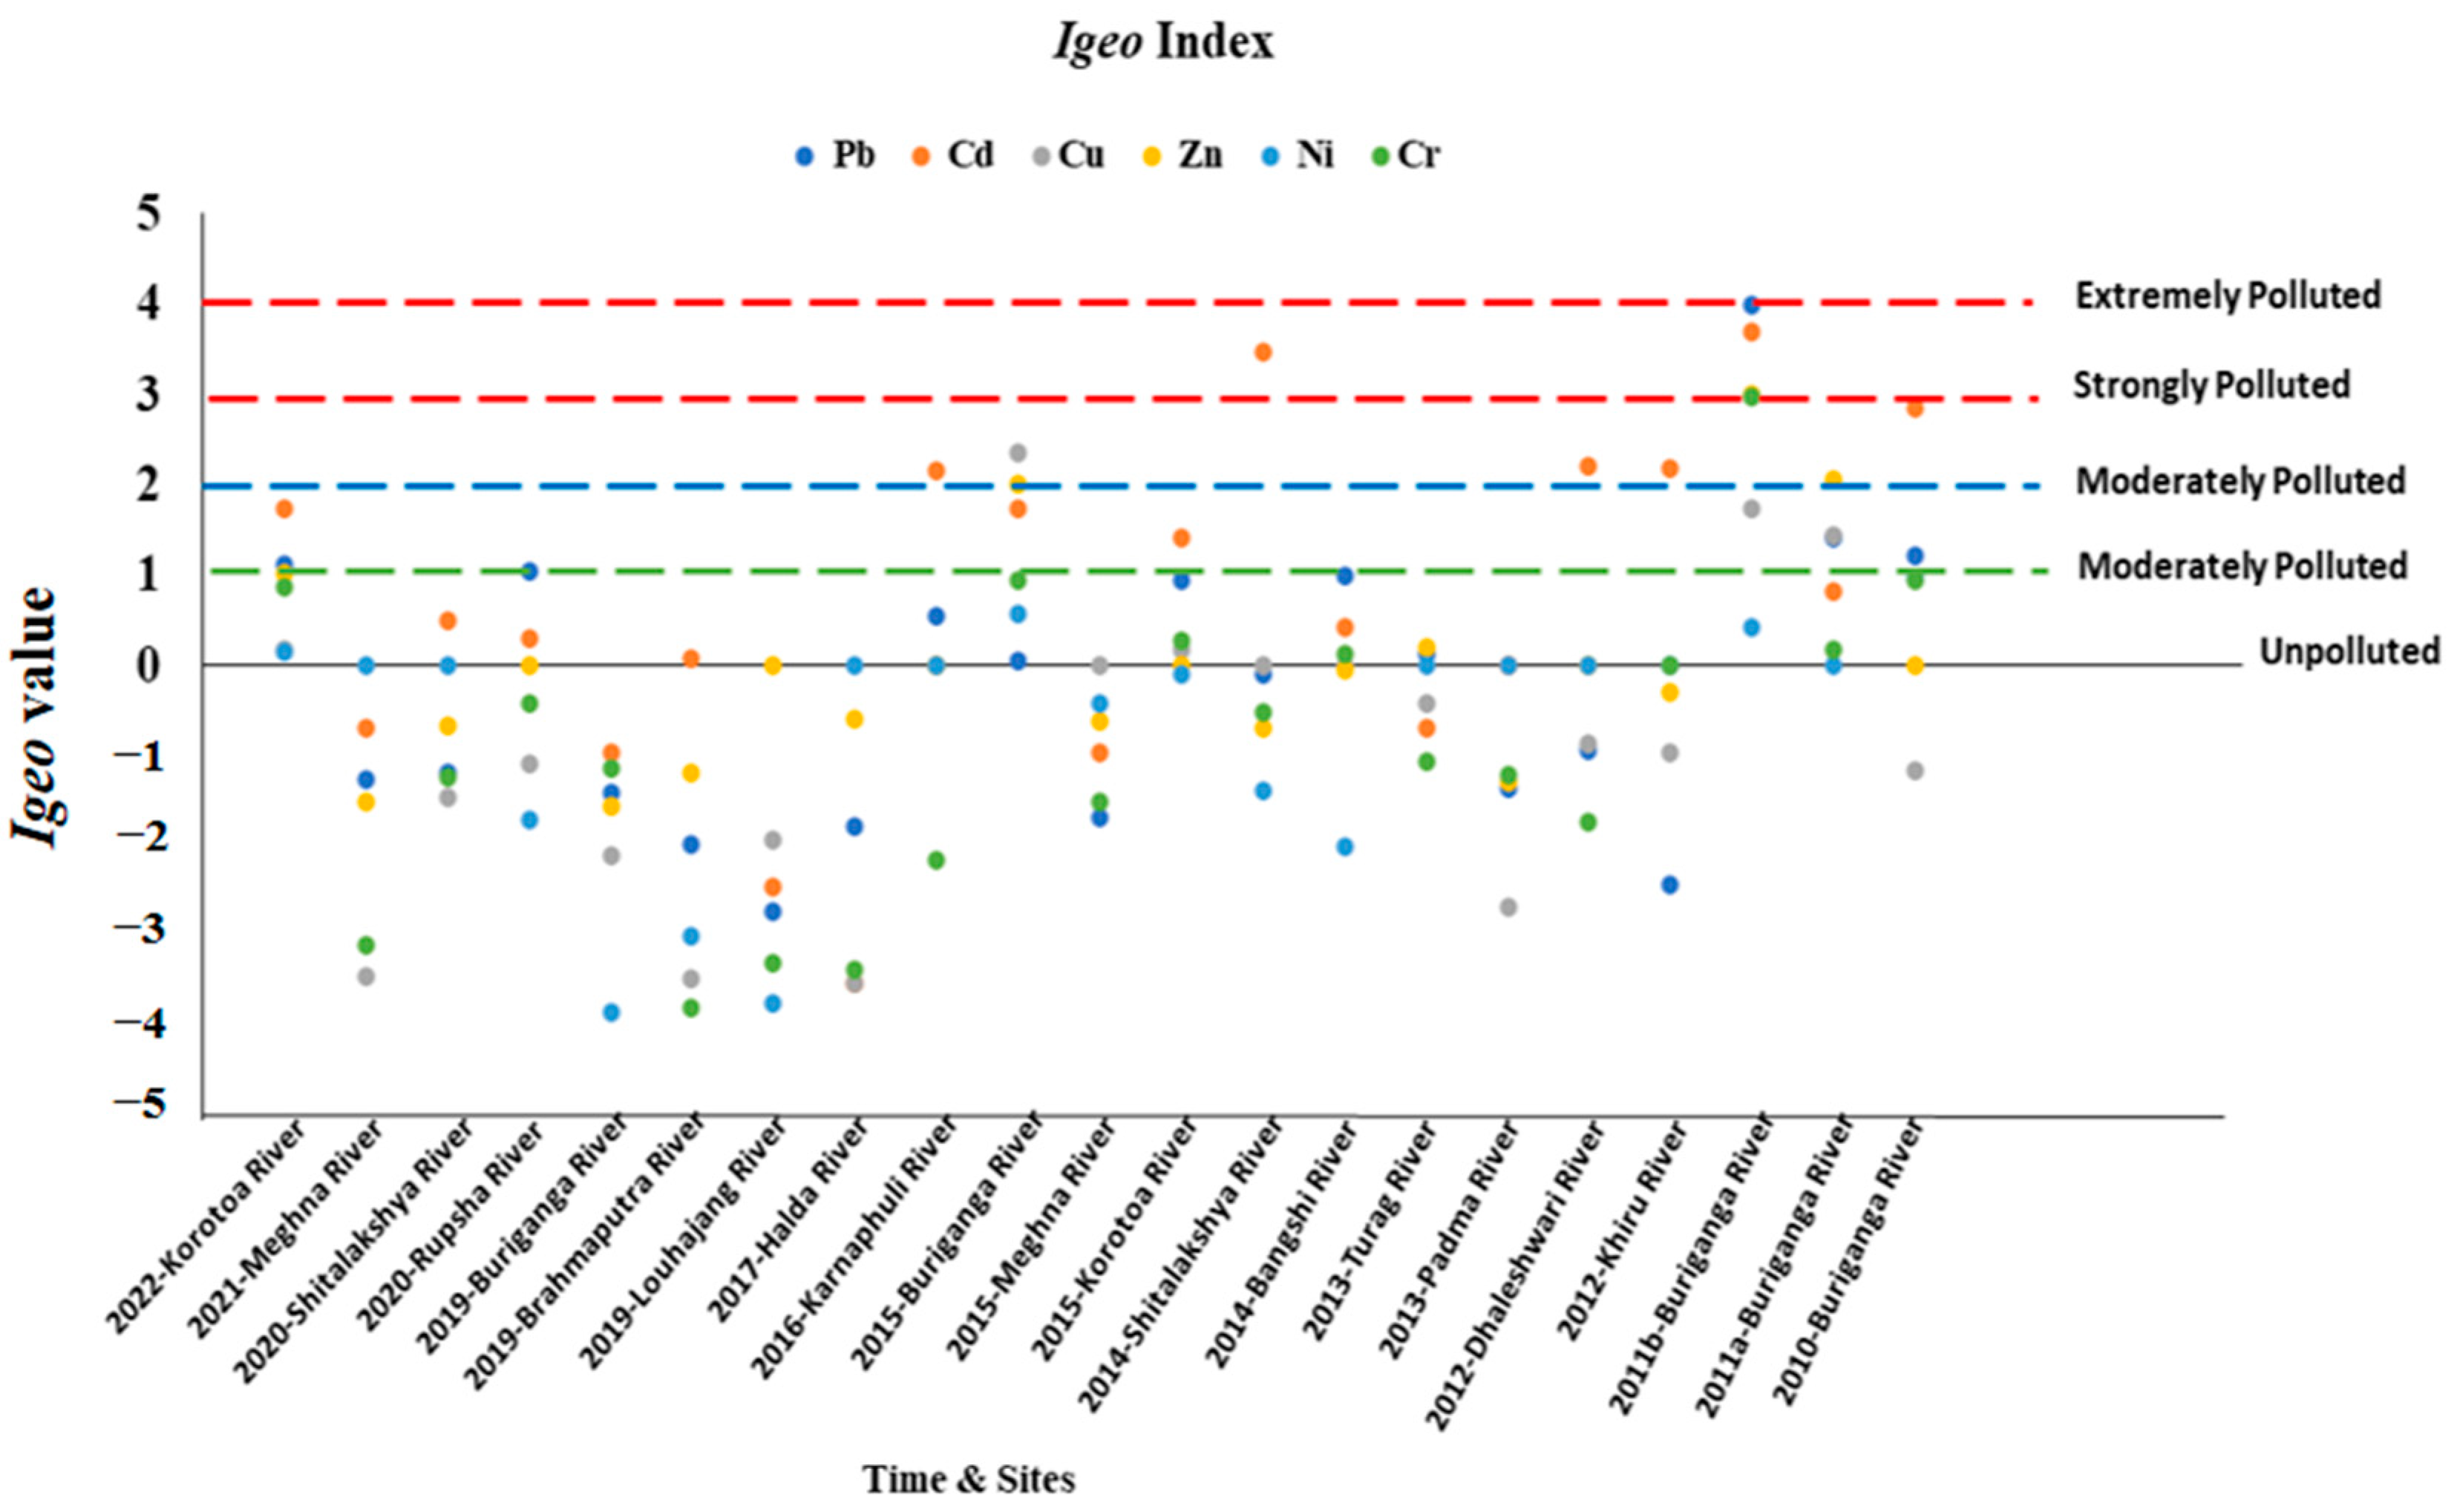
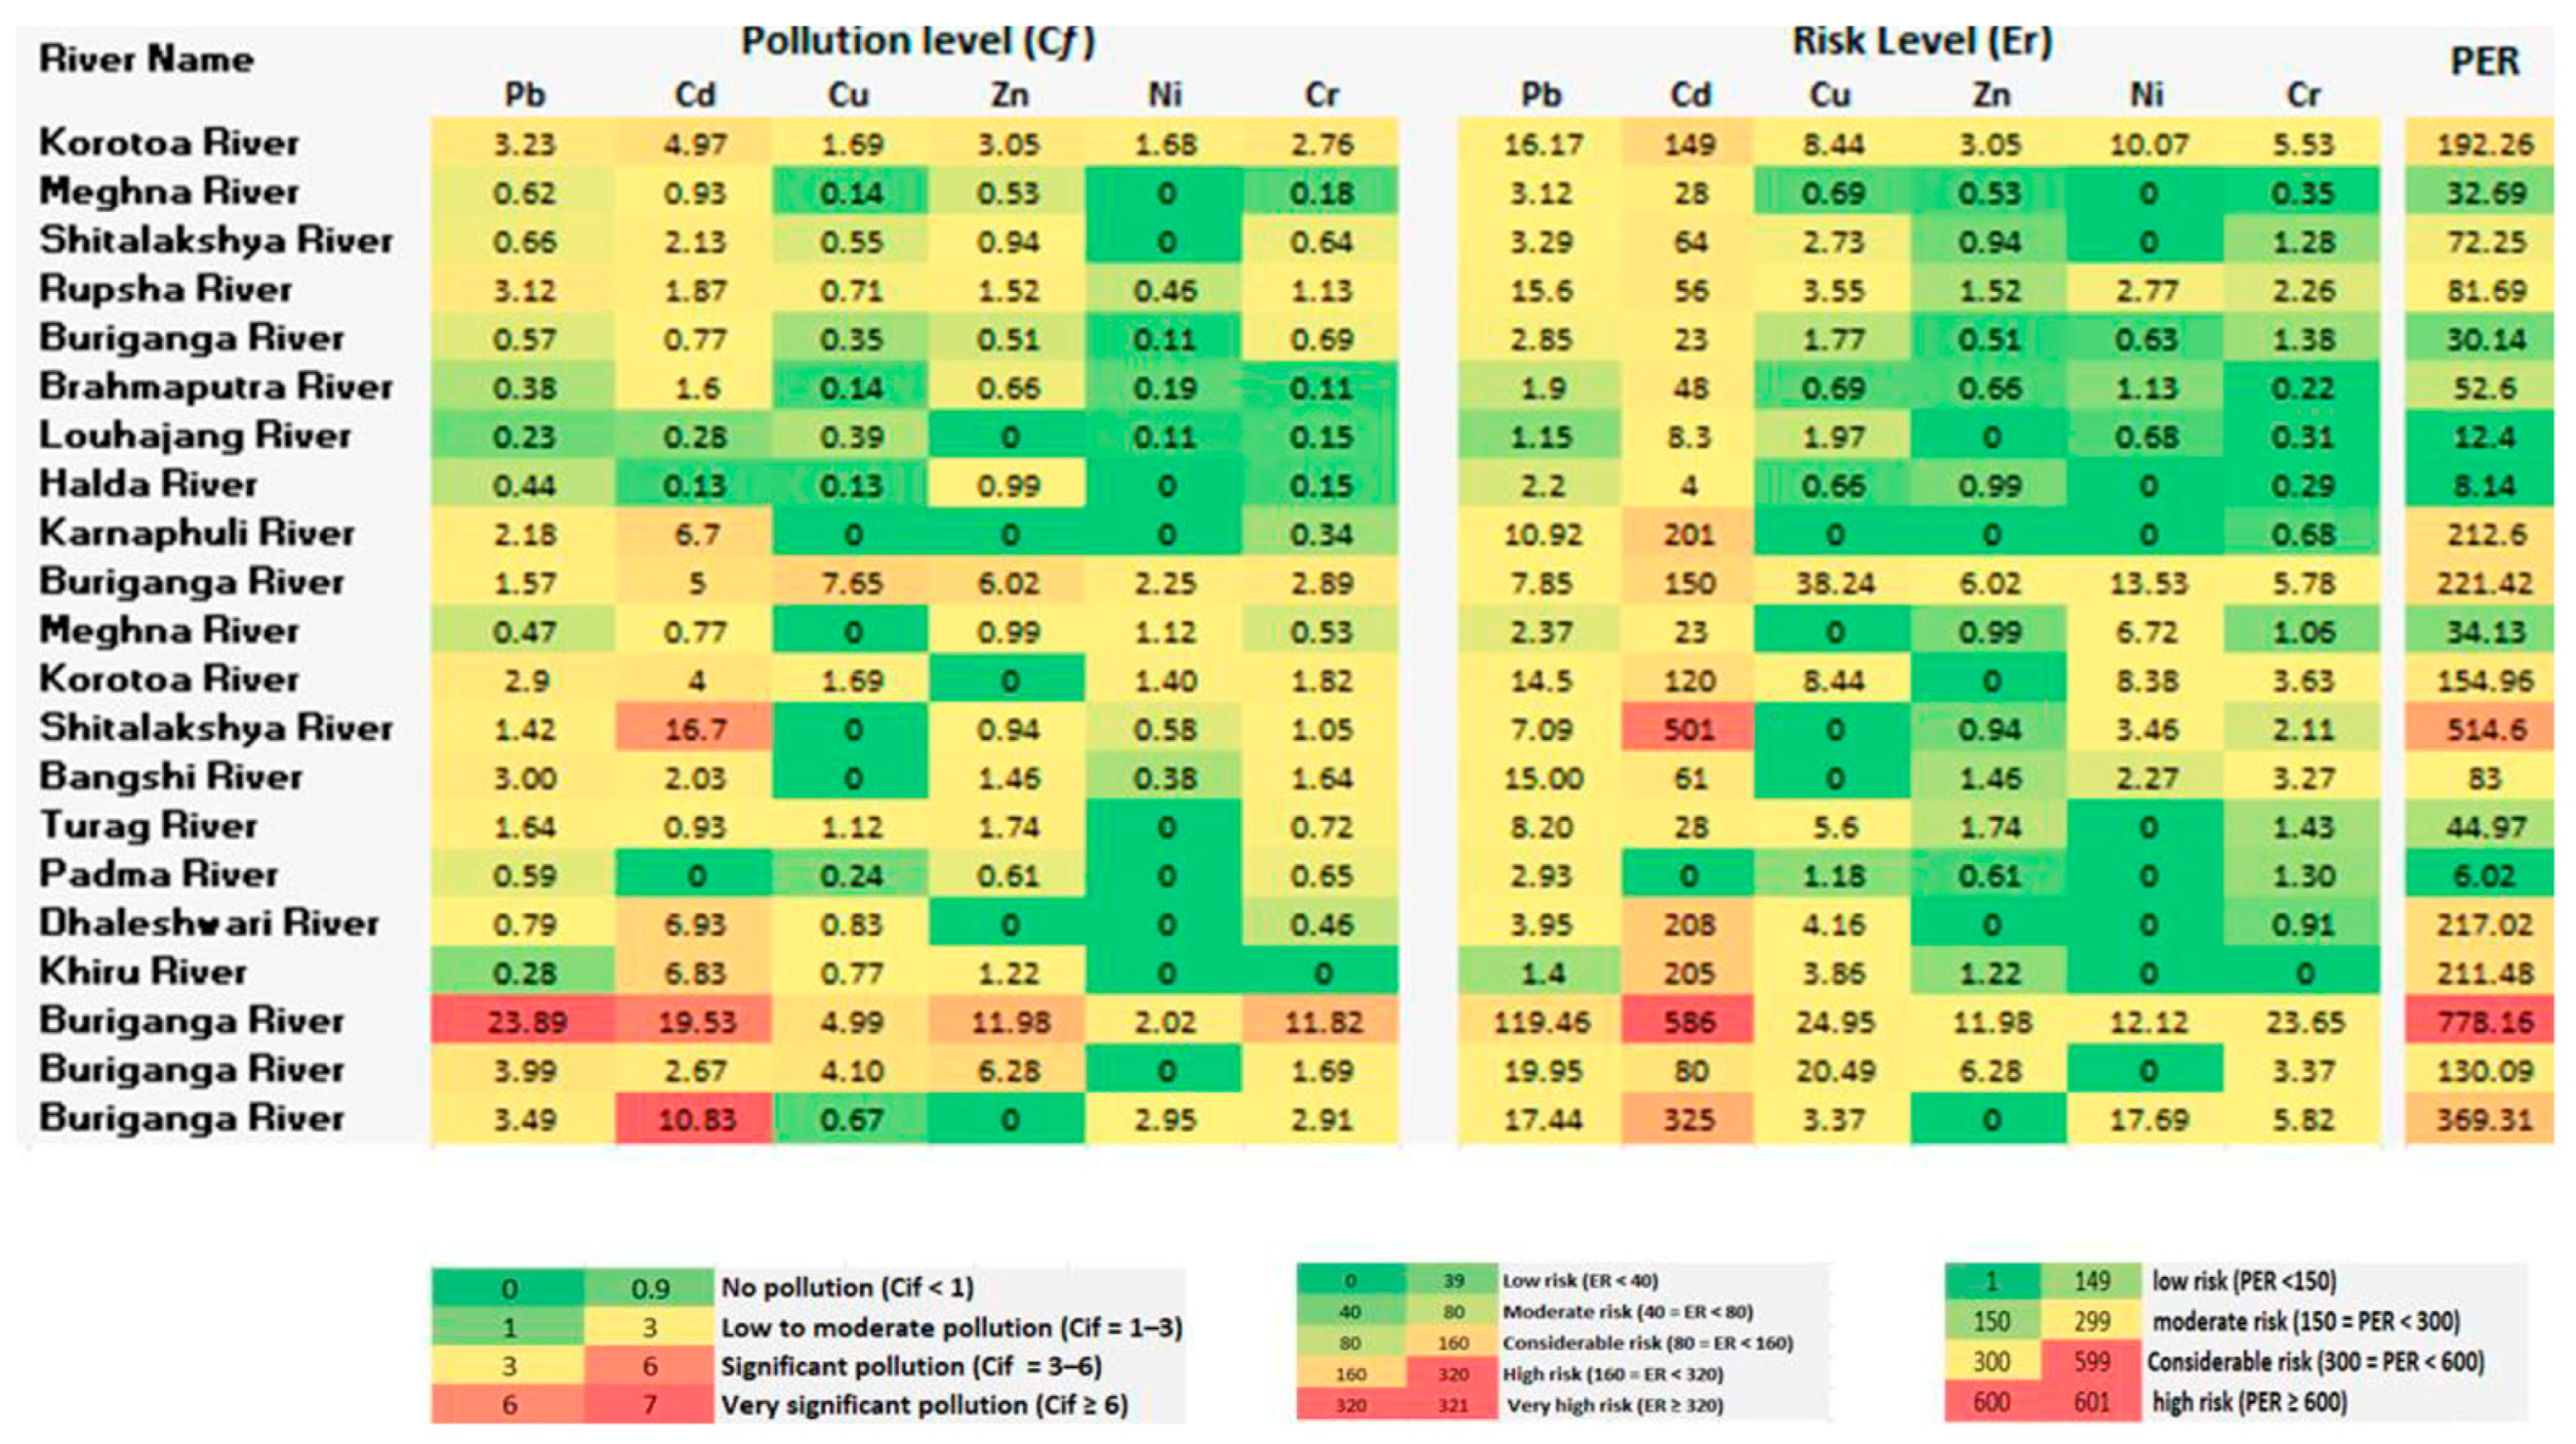
| Contamination status indication for sediment | Recommendation level: Reference value (mg/kg) Contamination as Igeo: Igeo ≤ 0, no contamination; 0 ≤ Igeo ≤ 1, no contamination to moderately contamination; 1 ≤ Igeo ≤ 2, moderately contaminated; 2 ≤ Igeo ≤ 3, moderately to heavily contaminated; 3 ≤ Igeo ≤ 4, heavily contaminated; 4 ≤ Igeo ≤ 5, heavily to extremely contaminated; 5 < Igeo, extremely contaminated. Contamination as CF: CF < 1, low; 1 < CF < 3, moderate; 3 < CF < 6, considerable; CF < 6, very high. Contamination as PLI: PLI = 0, indicates excellence; PLI = 1, this level is contaminated; PLI > 1, the quality is gradually declines. |
| Contamination Status for water and aquatic species | Recommendation level (mg/kg) Reference value (mg/kg) Toxic level (mg/kg) |
3. PTE Concentration and Distribution
3.1. PTEs in Sediments
3.1.1. Lead (Pb)
3.1.2. Cadmium (Cd)
3.1.3. Chromium (Cr)
| Time | River Name | River study Code | City Code | Pollution Source | Analytical Method | Pb | Cd | Cr | Cu | Zn | Ni |
|---|---|---|---|---|---|---|---|---|---|---|---|
| 2022 | Korotoa River | A1 | Bo | AI | ICP-MS | 64.67 | 1.49 | 165.84 | 76 | 243.68 | 114.13 |
| 2021 | Meghna River | A2 | No | AFA | AAS | 12.48 | 0.28 | 10.59 | 6.22 | 42.41 | |
| 2020 | Shitalakshya River | A3 | Na | IA | FAAS and GFAAS | 13.16 | 0.64 | 38.39 | 24.6 | 75.48 | |
| 2020 | Rupsha River | A4 | K | AI | AAS | 62.4 | 0.56 | 67.72 | 31.95 | 121.35 | 31.34 |
| 2019 | Buriganga River | A5 | D | IC | ICP-MS | 11.405 | 0.23 | 41.45 | 15.93 | 40.71 | 7.14 |
| 2019 | Brahmaputra River | A6 | Na | TCDI | FAAS | 7.6 | 0.48 | 6.6 | 6.2 | 52.7 | 12.8 |
| 2019 | Louhajang River | A7 | T | AI | ICP-MS | 4.597 | 0.083 | 9. 21 | 17.727 | 7.676 | |
| 2017 | Halda River | A8 | C | AI | AAS | 8.8 | 0.04 | 8.84 | 5.9 | 79.58 | |
| 2016 | Karnaphuli River | A9 | C | IA | AAS, GF-AAS | 43.69 | 2.01 | 20.3 | |||
| 2015 | Buriganga River | R11 | D | IC | AAS | 31.4 | 1.5 | 173.4 | 344.2 | 481.8 | 153.3 |
| 2015 | Meghna River | A10 | Nar | IA | AAS | 9.47 | 0.23 | 31.74 | 79.02 | 76.12 | |
| 2015 | Korotoa River | R12 | Bo | AI | ICP-MS | 58 | 1.2 | 109 | 76 | 95 | |
| 2014 | Shitalakshya River | A11 | Nar | IA | AAS | 28.36 | 5.01 | 63.22 | 75 | 39.22 | |
| 2014 | Bangshi River | A12 | T | AA | AAS | 59.99 | 0.61 | 98.1 | 117.15 | 25.67 | |
| 2013 | Turag River | A13 | D | AI | AAS | 32.78 | 0.28 | 43.02 | 50.4 | 139.48 | |
| 2013 | Padma River | A14 | D | AI | AAS | 11.7 | 38.91 | 10.64 | 49.16 | ||
| 2012 | Dhaleshwari River | A15 | S | AI | FAAS | 15.79 | 2.08 | 27.39 | 37.45 | ||
| 2012 | Khiru River | A16 | M | AA | AAS | 5.6 | 2.05 | 34.7 | 97.77 | ||
| 2011 | Buriganga River | R13 | D | IC | ICP-MS | 477.85 | 5.86 | 709.41 | 224.55 | 958.15 | 137.35 |
| 2011 | Buriganga River | R14 | D | IC | AAS | 79.8 | 0.8 | 101.2 | 184.4 | 502.3 | |
| 2010 | Buriganga River | R15 | D | IC | ICP-MS | 69.75 | 3.25 | 174.53 | 30.35 | 200.45 | |
| Toxicity Ref. Value (USEPA) | R16 | 21.00 | 1 | 8.10 | 28.00 | 68.00 | |||||
| Background Value (SEPAC) | R17 | 21.90 | 0.08 | 66.80 | 25.50 | 69.60 | 33.80 | ||||
| Average shale Value | R18 | 0.30 | 90.00 | 95.00 |
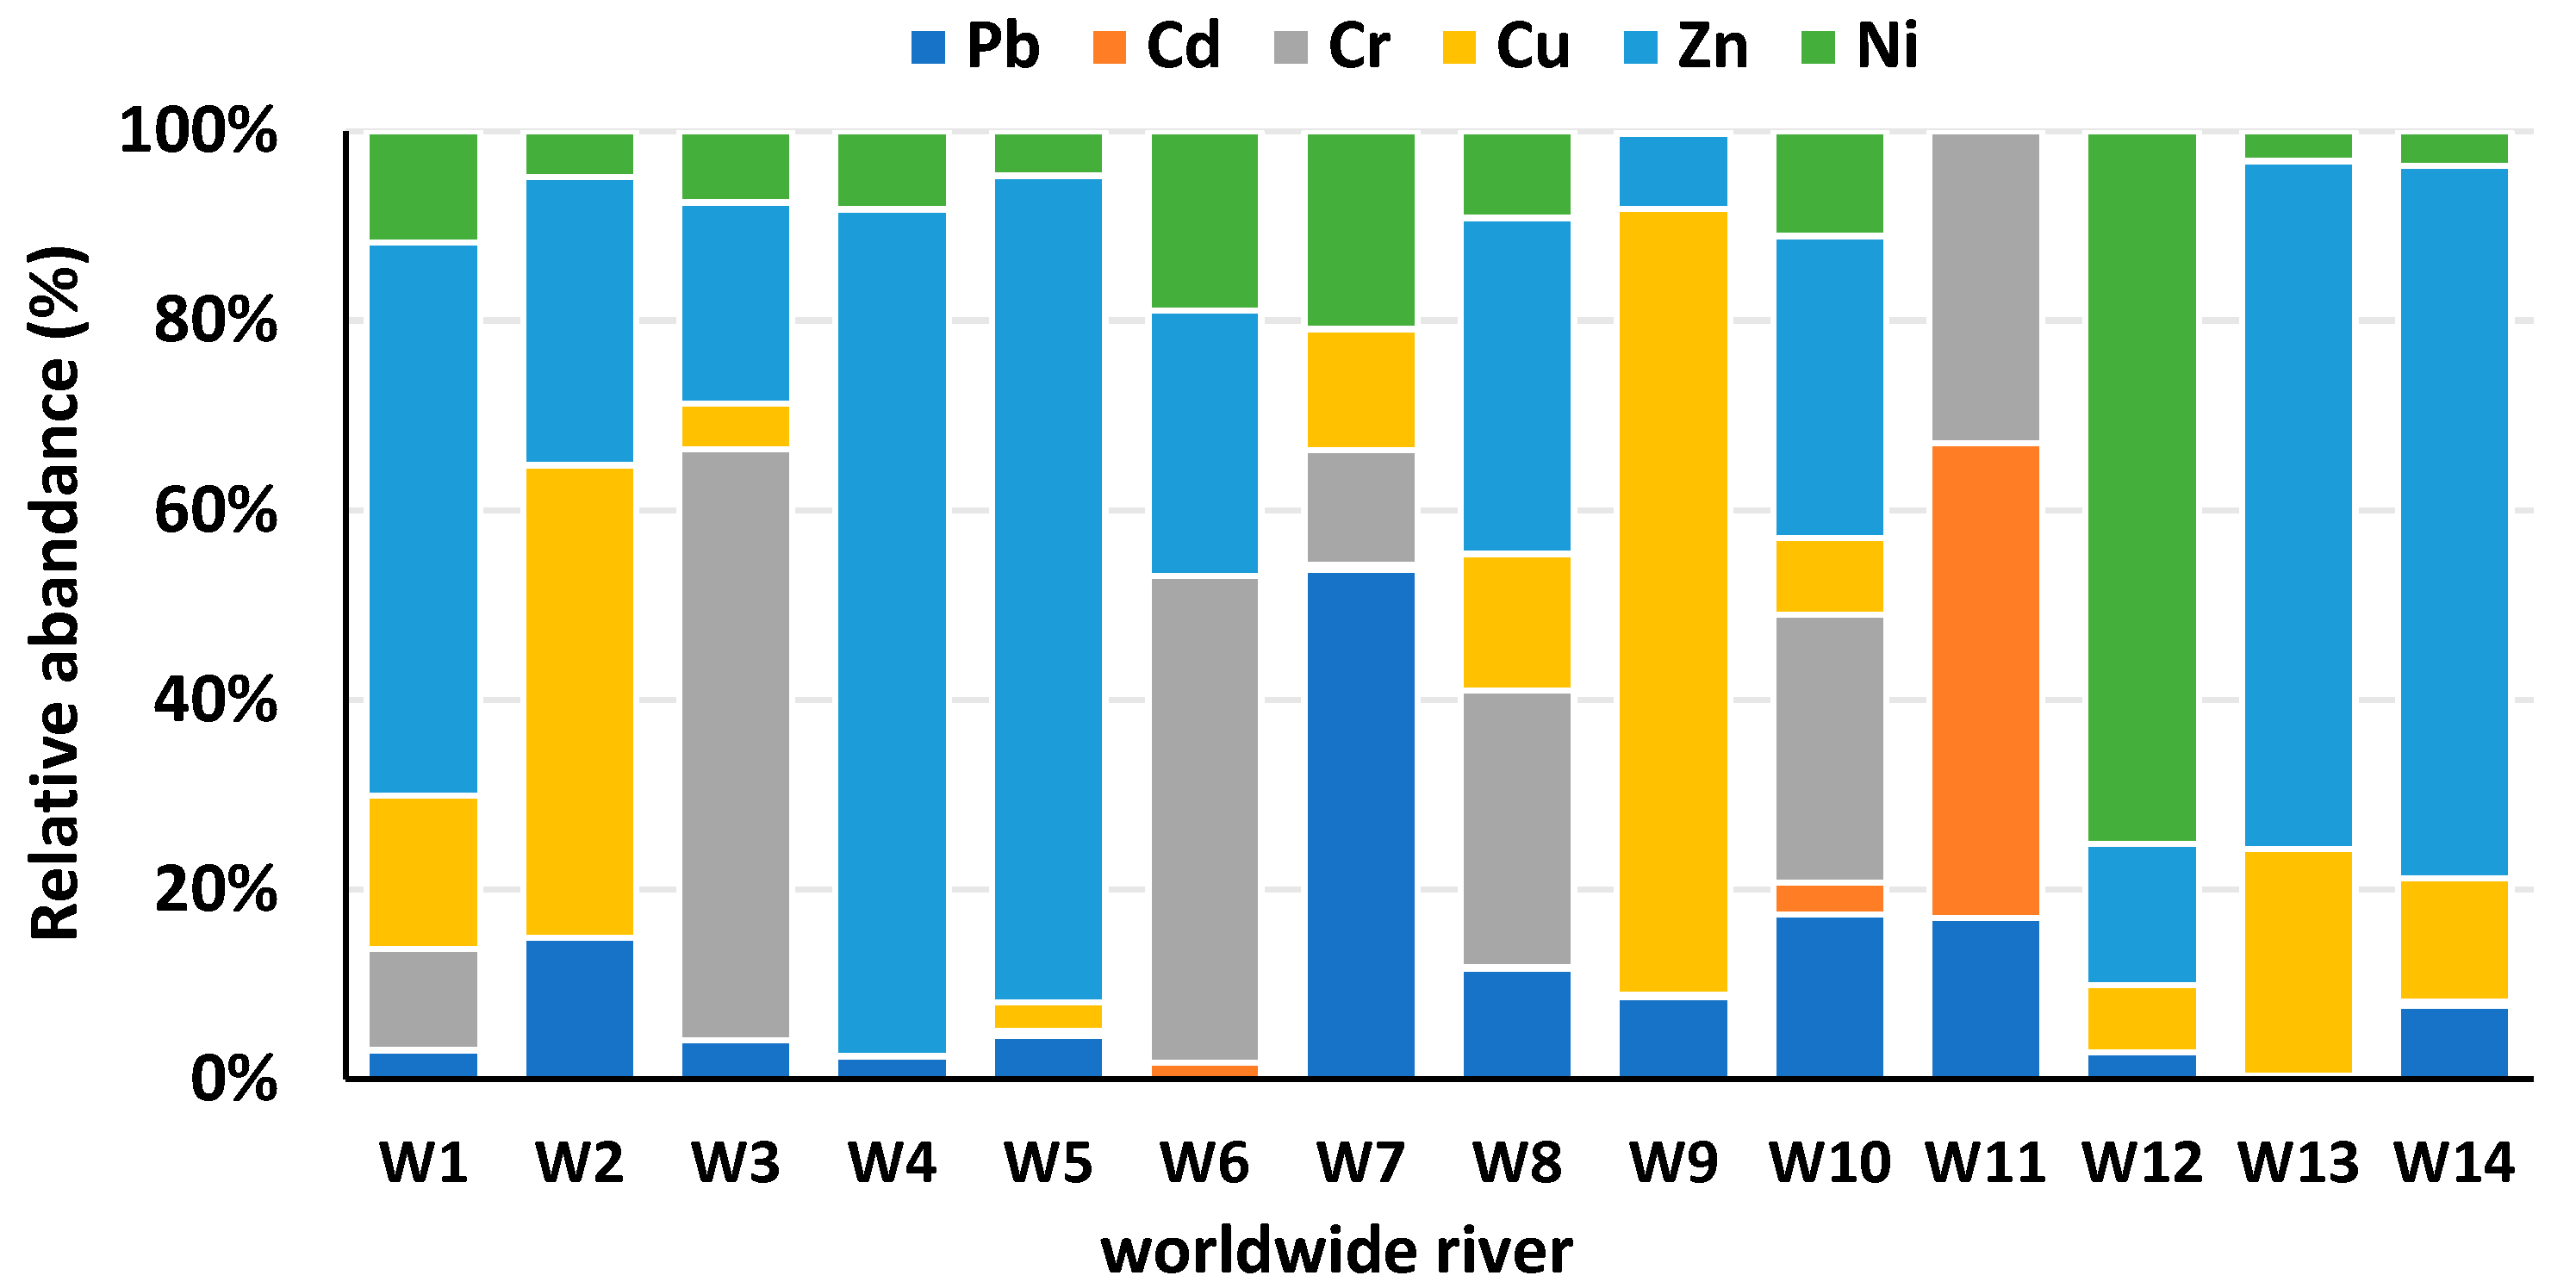
3.1.4. Copper (Cu)
| Sediment (mg/kg) | ||||||||
|---|---|---|---|---|---|---|---|---|
| River Name | Country | Study Code | Pb | Cd | Cr | Cu | Zn | Ni |
| Symsarna River | Poland | W7 | 87.32 | 0.69 | 19.76 | 20.63 | 0.13 | 33.88 |
| Elbe River | Germany | W14 | 122 | 7.3 | 206 | 1190 | 58 | |
| Ganga River | India | W10 | 151.85 | 30.01 | 247.05 | 70.7 | 278.61 | 97.1 |
| Lubumbashi River | Congo | W9 | 1549 | 42.9 | 14,822 | 1415 | 55.4 | |
| Okumeshi River | Nigeria | W11 | 0.45 | 1.32 | 0.87 | |||
| Yellow River | China | W8 | 24.6 | 0.3 | 61.3 | 30.3 | 74.6 | 19.3 |
| Pra River | Ghana | W6 | 7.27 | 216.7 | 118.32 | 79.9 | ||
| Atoyac River | Mexico | W3 | 12 | 182 | 14 | 62 | 22 | |
| SomesuMic River | Romania | W1 | 12.27 | 0.35 | 43.15 | 65.56 | 236.82 | 47.69 |
| Barma River | Malaysia | W2 | 123 | 410 | 250 | 40 | ||
| Saigon River | Vietnam | W4 | 2 | 0.07 | 75 | 6.93 | ||
| Lee River | England | W5 | 50 | 5.64 | 32.6 | 946 | 51.1 | |
| Buyukmelen River | Turkey | W12 | 12.1 | 0.12 | 30.6 | 63.7 | 323 | |
| Liffey River | Ireland | W13 | 3.25 | 220 | 666 | 29 | ||
3.1.5. Zinc (Zn)
3.1.6. Nickel (Ni)
3.2. Pollution Load Index (PLI)
3.3. Geoaccumulation Index (Igeo)
3.4. Potential Ecological Risk (PER)
4. PTE Pollution Status in River Water
5. PTE Pollution Status in Aquatic Species
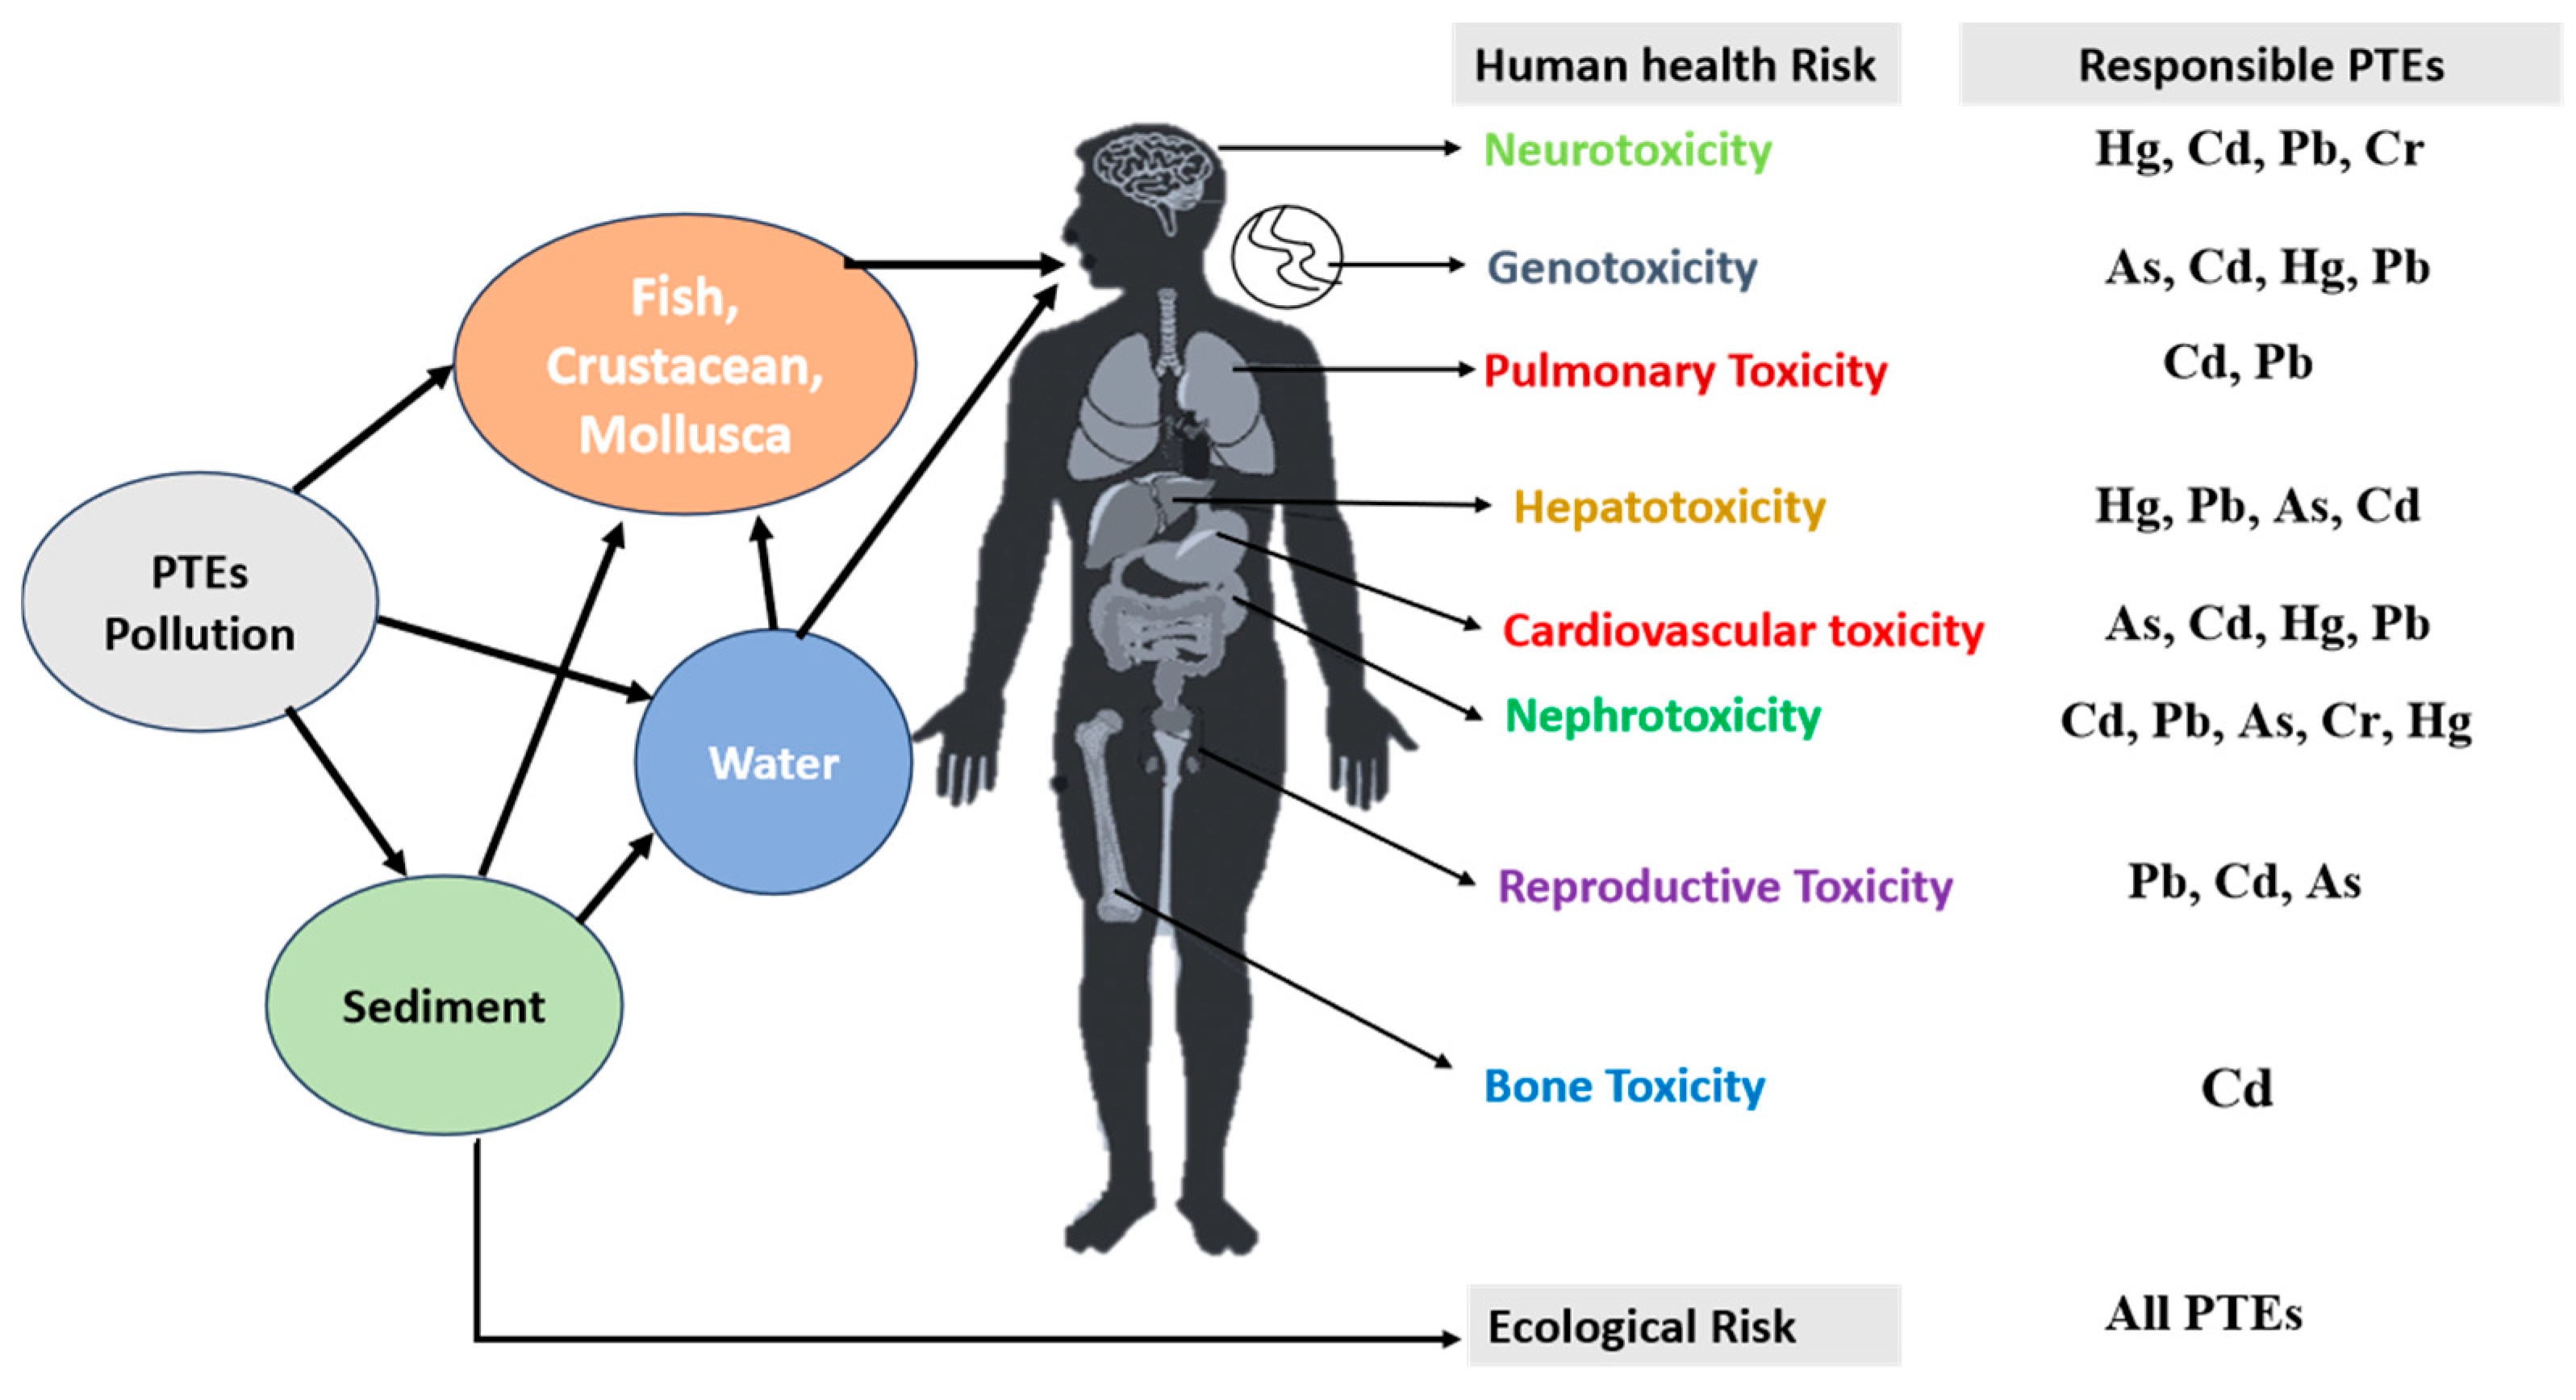
6. Effects on Human Health
| Species | Study Code | Hazard Index (HI) | Country |
|---|---|---|---|
| L. rohita | H1 | 3.78 | Bangladesh |
| C. punctata | H1 | 1.72 | Bangladesh |
| C. batrachus | H1 | 1.17 | Bangladesh |
| H. fossilis | H1 | 1.10 | Bangladesh |
| Cynoglossus sp. | H5 | 23.57 | Nigeria |
| Fish sp. | H6 | 1.69 | China |
| C. fluminea | H7 | 1.67 | Bangladesh |
| C. amnicola | H8 | 8.34 | Nigeria |
| Clam | H9 | 1.148 | China |
| Freshwater fish | H10 | 0.558 | China |
| Freshwater crab | H10 | 0.092 | China |
| Species | Study Code | Potential Toxic Elements (PTEs) | Country | |||
|---|---|---|---|---|---|---|
| As | Pb | Ni | Cd | |||
| L. rohita | A1 | 2.86 × 10⁻⁵ | 1.76 × 10⁻⁶ | 3.00 × 10⁻⁴ | 8.32 × 10⁻⁵ | Bangladesh |
| C. punctata | A1 | 3.08 × 10⁻⁵ | 5.69 × 10⁻⁶ | 9.73 × 10⁻⁵ | 3.00 × 10⁻³ | Bangladesh |
| H. fossilis | A1 | 3.52 × 10⁻⁵ | 5.20 × 10⁻⁶ | 3.00 × 10⁻⁴ | 6.00 × 10⁻⁴ | Bangladesh |
| Cynoglossus sp. | B1 | 4.02 × 10⁻⁸ | 2.35 × 10⁻⁵ | 6.48 × 10⁻⁶ | Nigeria | |
| C. fluminea | C1 | 1.00 × 10⁻⁴ | 1.00 × 10⁻⁶ | 2.00 × 10⁻⁴ | 2.00 × 10⁻³ | Bangladesh |
| C. amnicola | F1 | 1.09 × 10⁻⁷ | 1.66 × 10⁻⁸ | 4.64 × 10⁻⁸ | Nigeria | |
| L. camtschaticum | G1 | 1.60 × 10⁻⁴ | China | |||
| C. farreri | H1 | 7.44 × 10⁻⁸ | 1.93 × 10⁻³ | China | ||
| C. ariakensis | H1 | 5.87 × 10⁻⁸ | 2.38 × 10⁻⁴ | China | ||
| S. constricta | H1 | 7.26 × 10⁻⁸ | 3.94 × 10⁻⁵ | China | ||
| C. gariepinus | K1 | 2.00 × 10⁻³ | 9.90 × 10⁻⁶ | Egypt | ||
| O. niloticus | K1 | 1.40 × 10⁻³ | 1.20 × 10⁻⁵ | Egypt | ||
| O. aureus | K1 | 1.50 × 10⁻³ | 9.80 × 10⁻⁶ | Egypt | ||
| T. zillii | K1 | 1.70 × 10⁻³ | 9.60 × 10⁻⁶ | Egypt | ||
| H. molitrix | P1 | 7.11 × 10⁻⁶ | 2.55 × 10⁻⁵ | China | ||
| C. idellus | P1 | 1.97 × 10⁻⁶ | 1.85 × 10⁻⁴ | China | ||
7. Research Perspective: Implications and Future Directions
8. Conclusions
Author Contributions
Funding
Data Availability Statement
Acknowledgments
Conflicts of Interest
References
- Khalijian, A.; Lorestani, B.; Sobhanardakani, S.; Cheraghi, M.; L Tayebi, L. Ecotoxicological Assessment of Potentially Toxic Elements (as, Cd, Ni and V) Contamination in the Sediments of Southern Part of Caspian Sea, the Case of Khazar Abad, Mazandaran Province, Iran. Bull. Environ. Contam. Toxicol. 2022, 109, 1142–1149. [Google Scholar] [CrossRef]
- Liu, X.; Dadzie, A.A.; Yuan, L.; Xing, S.; Zhou, X.; Xiao, S. Analysis and potential ecological risk assessment of heavy metals in surface sediments of the freshwater ecosystem in Zhenjiang City, China. SN Appl. Sci. 2022, 4, 258. [Google Scholar] [CrossRef]
- Hossain, M.B.; Sultana, J.; Pingki, F.H.; Nur, A.A.U.; Mia, M.S.; Bakar, M.A.; Yu, J.; Paray, B.A.; Arai, T. Accumulation and contamination assessment of heavy metals in sediments of commercial aquaculture farms from a coastal area along the northern Bay of Bengal. Front. Environ. Sci. 2023, 11, 1148360. [Google Scholar] [CrossRef]
- Bangladesh Economic Review. Ministry of Finance of Government of Bangladesh. 2023. Available online: http://mof.gov.bd (accessed on 20 June 2023).
- Mahamat, T.N.; Kidjakebo, S.; Abel, S.K.; Bertrand, N.G. Heavy metals pollution in water, sediments and fish of Léré Lake, Western Mayo Kebbi (Chad). Int. J. Environ. Prot. Pollut. 2017, 5, 1–11. [Google Scholar] [CrossRef]
- Ali, H.; Khan, E.; Ilahi, I. Environmental Chemistry and ecotoxicology of hazardous heavy metals: Environmental persistence, toxicity, and bioaccumulation. Hindawi. J. Chem. 2019, 14, 6730305. [Google Scholar] [CrossRef]
- Reza, R.; Singh, G. Heavy metal contamination and its indexing approach for river water. Int. J. Environ. Sci. Technol. 2010, 7, 785–792. [Google Scholar] [CrossRef]
- Bain, D.J.; Yesilonis, I.D.; Pouyat, R.V. Metal concentrations in urban riparian sediments along an urbanization gradient. Biogeochemistry 2012, 107, 67–79. [Google Scholar] [CrossRef]
- Wang, Z.; Yao, L.; Liu, G.; Liu, W. Heavy metals in water, sediments and submerged macrophytes in ponds around the Dianchi Lake, China. Ecotox. Environ. Safe 2014, 107, 200–206. [Google Scholar] [CrossRef] [PubMed]
- Diagomanolin, V.; Farhanga, M.; Ghazi-Khansaria, M.; Jafarzadehb, N. Heavy metals (Ni, Cr, Cu) in the Karoon waterway river, Iran. Toxicol. Lett. 2004, 151, 63–67. [Google Scholar] [CrossRef]
- Ramessur, R.T.; Parry, S.J.; Ramjeawon, T. The relationship of dissolved Pb to some dissolved trace metals (Al, Cr, Mn and Zn) and to dissolved nitrate and phosphate in a freshwater aquatic system in Mauritius. Environ. Int. 2001, 26, 223–230. [Google Scholar] [CrossRef] [PubMed]
- Shakil, M.S.Z.; Mostafa, M.G. Water quality assessment of paper mills effluent discharge areas. Al Nahrain J. Sci. ANJS 2021, 24, 63–72. [Google Scholar] [CrossRef]
- Shakil, M.S.Z.; Mostafa, M.G. Paper industries concern water pollution: A review. Int. J. Innov. Res. Rev. 2021, 9, 19–31. [Google Scholar]
- Rahim, M.A.; Mostafa, M.G. Impact of Sugar Mills Effluent on Environment around Mills Area. AIMS Environ. Sci. 2021, 8, 86–99. [Google Scholar] [CrossRef]
- Theofanis, Z.U.; Astrid, S.; Lidia, G.; Calmano, W.G. Contaminants in sediments: Remobilisation and demobilization. Sci. Total Environ. 2001, 266, 195–202. [Google Scholar]
- Monira, U.; Sattar, G.S.; Mostafa, M.G. Characterization of tannery effluent of savar tannery estate in Bangladesh. BAUET J. 2022, 3, 67–76. [Google Scholar]
- Islam, M.S.; Mostafa, M.G. Influence of chemical fertilizers on arsenic mobilization in the alluvial Bengal delta plain: A critical review. J. Water Supply Res. Technol. Aqua 2021, 70, 948. [Google Scholar] [CrossRef]
- Monira, U.; Sattar, G.S.; Mostafa, M.G. Characterization and removal efficiency of central effluent treatment plant (CETP). J. Sustain. Environ. Manag. 2023, 2, 42–50. [Google Scholar] [CrossRef]
- Chowdhury, M.; Mostafa, M.G.; Biswas, T.K.; Saha, A.K. Treatment of leather industrial effluents by filtration and coagulation processes. J. Water Resour. Ind. 2013, 3, 11–22. [Google Scholar] [CrossRef]
- Kubra, K.; Mondol, A.H.; Ali, M.M.; Palash, M.A.U.; Islam, M.S.; Ahmed, A.S.S.; Masuda, M.A.; Islam, A.R.M.T.; Bhuyan, M.S.; Rahman, M.Z.; et al. Pollution level of trace metals (As, Pb, Cr and Cd) in the sediment of Rupsha River Bangladesh: Assessment of ecological and human health risks. Front. Environ. Sci. 2022, 10, 778544. [Google Scholar] [CrossRef]
- Bashar, T.; Fung, I.W.H. Water Pollution in a Densely Populated Megapolis, Dhaka. Water 2020, 12, 2124. [Google Scholar] [CrossRef]
- Hossain, M.N.; Rahaman, A.; Hasan, M.J.; Uddin, M.M.; Khatun, N.; Shamsuddin, S.M. Comparative seasonal assessment of pollution and health risks associated with heavy metals in water, sediment and Fish of Buriganga and Turag River in Dhaka City, Bangladesh. Springer. SN Appl. Sci. 2021, 3, 509. [Google Scholar] [CrossRef]
- Rakib, M.R.J.; Jolly, Y.N.; Begum, B.A.; Choudhury, T.R.; Fatema, K.J.; Islam, M.S. Assessment of trace element toxicity in surface water of a fish breeding river in Bangladesh: A novel approach for ecological and health risk evaluation. Toxin Rev. 2021, 41, 420–436. [Google Scholar] [CrossRef]
- Hasan, M.F.; Nur-E-Alam, M.; Salam, M.A.; Rahman, H.; Paul, S.C.; Rak, A.E.; Ambade, B.; Towfiqul Islam, A.R.M. Health risk and water quality assessment of surface water in an urban river of Bangladesh. Sustainability 2021, 13, 6832. [Google Scholar] [CrossRef]
- BBS. Survey of Manufacturing Industries (SMI) 2012, 1st ed.; Bangladesh Bureau of Statistics (BBS): Dhaka, Bangladesh, 2013. [Google Scholar]
- Proshad, R.; Kormoker, T.; Mursheed, N.; Islam, M.M.; Bhuyan, M.I.; Islam, M.S. Heavy metal toxicity in agricultural soil due to rapid industrialization in Bangladesh: A review. Int. J. Adv. Geosci. 2018, 6, 83–88. [Google Scholar] [CrossRef]
- Sakib, S.M.N. Garment Industry in Bangladesh Struggles to Contain Pollution. The Third Pole. 2023. Available online: https://www.thethirdpole.net/en/pollution/garment-industry-bangladesh-struggles-to-contain-pollution/ (accessed on 12 January 2023).
- Kamruzzaman, M.; Sakib, S.M.N. Chemicals, industrial waste contamination turn 6 Bangladesh rivers untreatable, Anadolu Ajansı. Available online: https://www.aa.com.tr/en/asia-pacific/chemicals-industrial-waste-contamination-turn-6-bangladesh-rivers-untreatable/2534527#:~:text=According%20to%20official%20records%20of,greater%20Dhaka%20and%20adjacent%20areas (accessed on 14 March 2022).
- Ruba, U.B.; Chakma, K.; Senthi, J.; Rahman, S. Impact of Industrial Waste on Natural Resources: A Review in the Context of Bangladesh. Curr. World Environ. 2021, 16, 348–361. [Google Scholar] [CrossRef]
- DoE. Department of Environment. Industrial Waste Management in Bangladesh: An Evaluation on Policy Implementation; Annual Report; Ministry of Environment and Forest: Dhaka, Bangladesh, 2016.
- Arikibe, J.E.; Prasad, S. Determination and comparison of selected heavy metal concentrations in seawater and sediment samples in the coastal area of Suva, Fiji. Mar. Pollut. Bull. 2020, 157, 111157. [Google Scholar] [CrossRef] [PubMed]
- USEPA. Methods for Collection, Storage and Manipulation of Sediments for Chemical and Toxicological Analyses: Technical Manual; EPA-823-B-01-002; Office of Water: Washington, DC, USA, 2001.
- Nargis, A.; Sultana, S.; Raihan, M.J.; Haque, M.; Sadique, A.; Sarkar, M.K.; Un-Nabie, M.M.; Zhai, W.; Cai, M.; Habib, A. Multielement analysis in sediments of the River Buriganga (Bangladesh): Potential ecological risk assessment. Int. J. Environ. Sci. Technol. 2019, 16, 1663–1676. [Google Scholar] [CrossRef]
- Kamzati, L.L.J.; Kaonga, C.C.; Mapoma, H.W.T.; Thulu, F.G.; Abdel-dayem, S.M.; Anifowose, A.J.; Chidya, R.C.G.; Chitete-Mawenda, U.; Sakugawa, H. Heavy metals in water, sediment, fish and associated risks from an endorheic lake located in Southern Africa. Int. J. Environ. Sci. Technol. 2020, 17, 253–266. [Google Scholar] [CrossRef]
- Hossain, M.M.; Jahan, I.; Al Nahian, A.; Zhuang, Z.; Maxwell, J.S.; Ali, M.Y.; Sethupathy, S.; Zhu, D. Immediate health risk: Concentration of heavy metals in contaminated freshwater fishes from the river channel of Turag-Tongi-Balu. Environ. Toxicol. 2024, 39, 120–134. [Google Scholar] [CrossRef]
- Taylor, S.R. Abundance of chemical elements in the continental crust: A new table. Geochim. Cosmochim. Acta 1964, 28, 1273–1285. [Google Scholar] [CrossRef]
- Hilton, J.; Davison, W.; Ochsenbein, U. A mathematical model for analysis of sediment coke data. Geology 1985, 48, 281–291. [Google Scholar]
- Karadede, H.; Unlu, E. Concentrations of some heavy metals in water, sediment and fish species from the Atatürk Dam Lake (Euphrates), Turkey. Chemosphere 2000, 41, 1371–1376. [Google Scholar] [CrossRef]
- Suresh, G.; Ramasamy, V.; Meenakshisundaram, V.; Venkatachalapathy, R.; Ponnusamy, V. Influence of mineralogical and heavy metal composition on natural radionuclide concentrations in the river sediments. Appl. Radiat. Isot. 2011, 69, 1466–1474. [Google Scholar] [CrossRef] [PubMed]
- Müller, G. Index of geoaccumulation in sediments of the Rhine River. Geo J. 1969, 2, 108–118. [Google Scholar]
- Rabee, A.M.; Al-Fatlawy, Y.F.; Nameer, M. Using pollution load index (PLI) and geo accumulation index (Igeo) for the assessment of heavy metals pollution in Tigris river sediment in Baghdad Region. J. Al Nahrain Univ. 2011, 14, 108–114. [Google Scholar] [CrossRef]
- Hakanson, L. An ecological risk index for aquatic pollution control a sedimentological approach. Water Res. 1980, 14, 975–1001. [Google Scholar] [CrossRef]
- Guo, W.; Liu, X.; Liu, Z.; Li, G. Pollution and potential ecological risk evaluation of heavy metals in the sediments around Dongjiang Harbor, Tianjin. Procedia Environ. Sci. 2010, 2, 729–736. [Google Scholar] [CrossRef]
- Liu, C.; Xu, J.; Liu, C.; Zhang, P.; Dai, M. Heavy metals in the surface sediments in Lanzhou Reach of Yellow River, China. Bull. Environ. Contam. Toxicol. 2009, 82, 26–30. [Google Scholar] [CrossRef] [PubMed]
- Huang, Z.; Liu, C.; Zhao, X.; Dong, J.; Zheng, B. Risk assessment of heavy metals in the surface sediment at the drinking water source of the Xiangjiang River in South China. Environ. Sci. Eur. 2020, 32, 23. [Google Scholar] [CrossRef]
- Chai, L.; Li, H.; Yang, Z.; Min, X.; Liao, Q.; Liu, Y.; Men, S.; Yan, Y.; Xu, J. Heavy metals and metalloids in the surface sediments of the Xiangjiang River, Hunan, China: Distribution, contamination, and ecological risk assessment. Environ. Sci. Pollut. Res. 2017, 24, 874–885. [Google Scholar] [CrossRef] [PubMed]
- Singh, K.P.; Malik, A.; Sinha, S.; Singh, V.K.; Murthy, R.C. Estimation of source of heavy metal contamination in sediments of Gomti river (India) using principal component analysis. Water Air Soil Pollut. 2005, 166, 321–341. [Google Scholar] [CrossRef]
- Alyazichi, Y.M.; Jones, B.G.; Mclean, E.; Pease, J.; Brown, H. Geochemical assessment of trace element pollution in surface sediments from the Georges River, Southern Sydney, Australia. Arch. Environ. Contam. Toxicol. 2016, 72, 247–259. [Google Scholar] [CrossRef]
- Filgueiras, A.V.; Lavilla, I.; Bendicho, C. Evaluation of distribution, mobility and binding behaviour of heavy metals in surficial sediments of Louro River (Galicia, Spain) using chemometric analysis: A case study. Sci. Total. Environ. 2004, 330, 115–129. [Google Scholar] [CrossRef] [PubMed]
- Kuriata-Potasznik, A.; Szymczyk, S.; Skwierawski, A.; Glinska-Lewczuk, K.; Cymes, I. Heavy metal contamination in the surface layer of bottom sediments in a flowthrough lake: A case study of Lake Symsar in Northern Poland. Water 2016, 8, 358. [Google Scholar] [CrossRef]
- Brügmann, L. Metals in sediments and suspended matter of the river Elbe. Sci. Total Environ. 1995, 159, 53–65. [Google Scholar] [CrossRef]
- Proshad, R.; Kormoker, T.; Abdullah Al, M.; Islam, M.S.; Khadka, S.; Idris, A.M. Receptor model-based source apportionment and ecological risk of metals in sediments of an urban river in Bangladesh. J. Hazard. Mater. 2022, 423, 127030. [Google Scholar] [CrossRef] [PubMed]
- MacDonald, D.D.; Ingersoll, C.G.; Berger, T.A. Development and evaluation of consensus-based sediment quality guidelines for freshwater ecosystems. Arch. Environ. Contam. Toxicol. 2000, 39, 20–31. [Google Scholar] [CrossRef] [PubMed]
- Pandey, M.; Kumar, A.; Mishra, A.; Tripathi, B.D. Application of chemometric analysis and self-Organizing Map-Artificial Neural Network as source receptor modeling for metal speciation in river sediment. Environ. Pollut. 2015, 204, 64–73. [Google Scholar] [CrossRef] [PubMed]
- El-Saadani, Z.; Mingqi, W.; He, Z.; Hamukwaya, S.L.; Abdel Wahed, M.S.M.; Abu Khatita, A. Environmental Geochemistry and Fractionation of Cadmium Metal in Surficial Bottom Sediments and Water of the Nile River, Egypt. Toxics 2022, 10, 221. [Google Scholar] [CrossRef] [PubMed]
- Resongles, E.; Casiot, C.; Freydier, R.; Dezileau, L.; Viers, J.; Elbaz-Poulichet, F. Persisting impact of historical mining activity to metal (Pb, Zn, Cd, Tl, Hg) and metalloid (As, Sb) enrichment in sediments of the Gardon River, Southern France. Sci. Total Environ. 2014, 481, 509–521. [Google Scholar] [CrossRef]
- Atibu, E.K.; Devarajan, N.; Laffite, A.; Giuliani, G.; Salumu, J.A.; Muteb, R.C.; Mulaji, C.K.; Otamonga, J.-P.; Elongo, V.; Mpiana, P.T.; et al. Assessment of trace metal and rare earth elements contamination in rivers around abandoned and active mine areas. The case of Lubumbashi River and Tshamilemba Canal, Katanga, Democratic Republic of the Congo. Geochemistry 2016, 76, 353–362. [Google Scholar] [CrossRef]
- USEPA. Environmental Protection Agency. Screening Level Ecological Risk Assessment Protocol for Hazardous Waste Combustion Facilities; USEPA. Environmental Protection Agency: Washington, DC, USA, 1999; Volume 3. Available online: https://www.epa.gov/chemical-research (accessed on 9 October 2021).
- Ali, M.M.; Ali, M.L.; Islam, M.S.; Rahman, M.Z. Preliminary assessment of heavy metals in water and sediment of Karnaphuli River, Bangladesh. Environ. Nanotechnol. Moni. Mang. 2016, 5, 27–35. [Google Scholar] [CrossRef]
- Raphael, E.C.; Augustina, O.C.; Frank, E.O. Trace metals distribution in fish tissues, bottom sediments and water from Okumeshi River in Delta State, Nigeria. Environ. Res. J. 2011, 5, 6–10. [Google Scholar] [CrossRef]
- Mohiuddin, K.M.; Alam, M.M.; Ahmed, I.; Chowdhury, A.K. Heavy metal pollution load in sediment samples of the Buriganga river in Bangladesh. J. Bangladesh Agril. Univ. 2015, 13, 229–238. [Google Scholar] [CrossRef]
- Ma, X.; Zuo, H.; Tian, M.; Zhang, L.; Meng, J.; Zhou, X.; Liu, Y. Assessment of heavy metals contamination in sediments from three adjacent regions of the Yellow River using metal chemical fractions and multivariate analysis techniques. Chemosphere 2016, 144, 264–272. [Google Scholar] [CrossRef] [PubMed]
- Huffman, A.M.; Sikder, A.M. Assessment OF heavy metal pollution IN the sediments OF the roanoke river. Water Air Soil Pollut. 2017, 229. [Google Scholar] [CrossRef]
- Rodríguez-Espinosa, P.F.; Shruti, V.C.; Jonathan, M.P.; Martinez-Tavera, E. Metal concentrations and their potential ecological risks in fluvial sediments of Atoyac River basin, Central Mexico: Volcanic and anthropogenic influences. Ecotoxicol. Environ. Saf. 2018, 148, 1020–1033. [Google Scholar] [CrossRef]
- SEPAC (State Environmental Protection Administration of China). The Background Values of Soil Elements of China; Chinese Environmental Science Press: Beijing, China, 1990. (In Chinese) [Google Scholar]
- Turekian, K.K.; Wedepohl, K.H. Distribution of the elements in some major units of the earth’s crust. Geol. Soc. Am. Bulletin 1961, 72, 175–192. [Google Scholar] [CrossRef]
- Siddique, M.A.M.; Rahman, M.; Rahman, S.M.A.; Hassan, M.R.; Fardous, Z.; Chowdhury, M.A.Z.; Hossain, M.B. Assessment of heavy metal contamination in the surficial sediments from the lower Meghna River estuary, Noakhali coast, Bangladesh. Int. J. Sediment Res. 2021, 36, 384–391. [Google Scholar] [CrossRef]
- Kabir, M.H.; Islam, M.S.; Hoq, M.E.; Tusher, T.R.; Islam, M.S. Appraisal of heavy metal contamination in sediments of the Shitalakhya River in Bangladesh using pollution indices, geo-spatial, and multivariate statistical analysis. Arab. J. Geosci. 2020, 13, 1135. [Google Scholar] [CrossRef]
- Rahman, M.M.; Hassan, M.M. The Amount of Selected Heavy Metals in Water, Sediments and Fish Species from the Rupsha River, Khulna, Bangladesh. AJFAR 2020, 6, 1–9. [Google Scholar] [CrossRef]
- Bhuyan, M.S.; Bakar, M.A.; Nabi, M.R.U.; Senapathi, V.; Chung, S.Y.; Islam, M.S. Monitoring and assessment of heavy metal contamination in surface water and sediment of the Old Brahmaputra River, Bangladesh. Appl. Water Sci. 2019, 9, 125. [Google Scholar] [CrossRef]
- Kormoker, T.; Proshad, R.; Islam, M.S. Ecological Risk Assessment of Heavy Metals in Sediment of the Louhajang River, Bangladesh. SF J. Environ. Earth Sci. 2019, 2, 1030. [Google Scholar]
- Bhuyan, M.S.; Bakar, M.A. Seasonal variation of heavy metals in water and sediments in the Halda River, Chittagong, Bangladesh. Environ. Sci. Pollut. Res. 2017, 24, 27587–27600. [Google Scholar] [CrossRef]
- Hassan, M.; Mirza, A.T.M.; Rahman, T.; Saha, B.; Kamal, A.K.I. Status of heavy metals in water and sediment of the Meghna River, Bangladesh. Am. J. Environ. Sci. 2015, 11, 427–439. [Google Scholar] [CrossRef]
- Islam, M.S.; Ahmed, M.K.; Raknuzzaman, M.; Mamun, M.H.A.; Islam, M.K. Heavy metal pollution in surface water and sediment: A preliminary assessment of an urban river in a developing country. Ecol. Indic. 2015, 48, 282–291. [Google Scholar] [CrossRef]
- Islam, M.M.; Rahman, S.L.; Ahmed, S.U.; Haque, M.K.I. Biochemical characteristics and accumulation of heavy metals in fishes, water and sediments of the river Buriganga and Shitalakhya of Bangladesh. J. Asian Sci. Res. 2014, 4, 270–279. [Google Scholar]
- Rahman, M.S.; Saha, N.; Molla, A.H. Potential ecological risk assessment of heavy metal contamination in sediment and water body around Dhaka export processing zone, Bangladesh. Environ. Earth Sci. 2014, 71, 2293–2308. [Google Scholar] [CrossRef]
- Banu, Z.; Chowdhury, M.S.A.; Hossain, M.D.; Nakagami, K. Contamination and ecological risk assessment of heavy metal in the sediment of Turag River, Bangladesh: An index analysis approach. J. Water Resour. Prot. 2013, 5, 239–248. [Google Scholar] [CrossRef]
- Jolly, Y.N.; Akter, S.; Kabir, J.; Islam, A.; Akbar, S. Trace elements contamination in the river Padma. Bangladesh J. Phys. 2013, 13, 95–102. [Google Scholar]
- Ahmed, A.T.A.; Mandal, S.; Chowdhury, D.A.; Tareq, A.R.M.; Rahman, M.M. Bioaccumulation of some heavy metals in Ayre fish (Sperata Aor Hamilton 1822), sediment and water of Dhaleshwari River in dry season. Bangladesh J. Zool. 2012, 40, 147–153. [Google Scholar] [CrossRef]
- Rashid, H.; Hasan, M.N.; Tanu, M.B.; Parveen, R.; Sukhan, Z.P.; Rahman, M.S.; Mahmud, Y. Heavy metal pollution and chemical profile of Khiru River, Bangladesh. Int. J. Environ. 2012, 2, 57–63. [Google Scholar]
- Mohiuddin, K.M.; Ogawa, Y.; Zakir, H.M.; Otomo, K.; Shikazono, N. Heavy metals contamination in water and sediments of an urban river in a developing country. Int. J. Environ. Sci. Technol. 2011, 8, 723–736. [Google Scholar] [CrossRef]
- Saha, P.K.; Hossain, M.D. Assessment of heavy metal contamination and sediment quality in the Buriganga river, Bangladesh. In Proceedings of the 2nd International Conference on Environmental Science and Technology, Singapore, 26–28 February, 2011; (EST’ 11); IACSIT Press: Singapore, 2011; pp. 384–388. [Google Scholar]
- Ahmed, M.K.; Islam, S.; Rahman, S.; Haque, M.R.; Islam, M.M. Heavy metals in water, sediment and some fishes of Buriganga River, Bangladesh. Int. J. Environ. Res. 2010, 4, 321–332. [Google Scholar]
- Barhoumi, B.; Beldean-Galea, M.S.; Al-Rawabdeh, A.M.; Roba, C.; Martonos, I.M.; Balc, R.; Kahlaoui, M.; Touil, S.; Tedetti, M.; Driss, M.R.; et al. Occurrence, distribution and ecological risk of trace metals and organic pollutants in surface sediments from a Southeastern European river (Somes¸u Mic River, Romania). Sci. Total Environ. 2019, 660, 660–676. [Google Scholar] [CrossRef] [PubMed]
- Prabakaran, K.; Nagarajan, R.; Eswaramoorthi, S.; Anandkumar, A.; Franco, F.M. Environmental significance and geochemical speciation of trace elements in Lower Baram River sediments. Chemosphere 2019, 219, 933–953. [Google Scholar] [CrossRef]
- Nguyen, B.T.; Do, D.D.; Nguyen, T.X.; Nguyen, V.N.; Nguyen, D.T.P.; Nguyes, M.H.; Truong, H.T.T.; Dong, H.P.; Le, A.H.; Bach, Q.-V. Seasonal, spatial variation, and pollution sources of heavy metals in the sediment of the Saigon River, Vietnam. Environ. Pollut. 2020, 256, 113412. [Google Scholar] [CrossRef] [PubMed]
- Lundy, L.; Alves, L.; Revitt, M.; Wildeboer, D. Metalwater-sediment interactions and impacts on an urban ecosystem. Int. J. Environ. Res. Publ. Health 2017, 14, 722. [Google Scholar] [CrossRef] [PubMed]
- Pehlivan, R. The effect of weathering in the Buyukmelen river basin on the geochemistry of suspended and bed sediments and the hydrogeochemical characteristics of river water, Duzce. Turkey. J. Asian Earth Sci. 2010, 39, 62–75. [Google Scholar] [CrossRef]
- Jones, G.; Jordan, M. The distribution of organic material and trace metals in sediments from the river Liffey estuary, Dublin. Estuar. Coast. Mar. Sci. 1979, 8, 37–47. [Google Scholar] [CrossRef]
- Haque, M.A.; Jewel, M.A.S.; Hasan, J.; Islam, M.M.; Ahmed, S.; Alam, L. Seasonal variation and ecological risk assessment of heavy metal contamination in surface waters of the Ganges River (northwestern Bangladesh). Malay. J. Analyt. Sci. 2019, 23, 300–311. [Google Scholar] [CrossRef]
- Yi, Y.; Yang, Z.; Zhang, S. Ecological risk assessment of heavy metals in sediment and human health risk assessment of heavy metals in fi shes in the middle and lower reaches of the Yangtze River basin. Environ. Pollut. 2011, 159, 2575–2585. [Google Scholar] [CrossRef]
- Proshad, R.; Zhang, D.; Idris, A.M.; Islam, M.S.; Kormoker, T.; Sarker, M.N.I.; Khadka, S.; Islam, A.S.M. Comprehensive evaluation of chemical properties and toxic metals in the surface water of Louhajang River, Bangladesh. Springer. Environ. Sci. Pollut. Res. 2021, 28, 49191–49205. [Google Scholar] [CrossRef]
- Sarkar, M.; Islam, J.B.; Akter, S. Pollution and ecological risk assessment for the environmentally impacted Turag River. Bangladesh. J. Mater. Environ. Sci. 2016, 7, 2295–2304. [Google Scholar]
- Irin, A.; Islam, M.S.; Kabir, M.H.; Hoq, M.E. Heavy metal contamination in water and fishes from the Shitalakhya river at Narayanganj, Bangladesh. Bangladesh J. Zool. 2016, 44, 267–273. [Google Scholar] [CrossRef]
- Islam, M.A.S.; Hossain, M.E.; Majed, N. Assessment of physicochemical properties and comparative pollution status of the Dhaleshwari River in Bangladesh. Earth 2021, 2, 696–714. [Google Scholar] [CrossRef]
- Rahman, M.S.; Ahmed, A.S.S.; Rahman, M.M.; Babu, S.M.O.F.; Sultana, S.; Sarker, S.I.; Awual, R.; Rahman, M.M.; Rahman, M. Temporal assessment of heavy metal concentration and surface water quality representing the public health evaluation from the Meghna River estuary, Bangladesh. Springer. Appl. Water Sci. 2021, 11, 121. [Google Scholar] [CrossRef]
- Choudhury, T.R.; Acter, T.; Uddin, N.; Kamal, M.; Chowdhury, A.M.S.; Rahman, M.S. Heavy metals contamination of river water and sediments in the mangrove forest ecosystems in Bangladesh: A consequence of oil spill incident. Environ. Nanotechnol. Monit. Manag. 2021, 16, 100484. [Google Scholar] [CrossRef]
- Haque, M.M.; Niloy, N.M.; Nayna, O.K.; Fatema, K.J.; Quraishi, S.B.; Park, J.-H.; Kim, K.-W.; Tareq, S.M. Variability of water quality and metal pollution index in the Ganges River, Bangladesh. Springer. Environ. Sci. Pollut. Res. 2020, 27, 42582–42599. [Google Scholar] [CrossRef]
- Proshad, R.; Islam, M.S.; Kormoker, T.; Masud, M.E.M.; Ali, M.M. Assessment of toxic metals contamination with ecological risk of surface water and sediment of Korotoa river in Bangladesh. Int. J. Adv. Geosci. 2018, 6, 214–221. [Google Scholar] [CrossRef]
- Islam, J.B.; Akter, S.; Bhowmick, A.C.; Uddin, M.N.; Sarkar, M. Hydroenvironmental pollution of Turag River in Bangladesh. Bangladesh J. Sci. Ind. Res. 2018, 53, 161–168. [Google Scholar] [CrossRef]
- Shil, S.C.; Islam, M.S.; Irin, A.; Tusher, T.R.; Hoq, M.E. Heavy metal contamination in water and sediments of Passur River near the Sundarbans Mangrove of Bangladesh. J. Environ. Sci. Nat. Resour. 2017, 10, 15–19. [Google Scholar] [CrossRef]
- Bhuiyan, M.A.H.; Samuel Dampare, B.; Islam, M.A.; Suzuki, S. Source apportionment and pollution evaluation of heavy metals in water and sediments of Buriganga River, Bangladesh, using multivariate analysis and pollution evaluation indices. Environ. Monit. Assess. 2015, 187, 4075. [Google Scholar] [CrossRef] [PubMed]
- Hasan, S.J.; Tanu, M.B.; Haidar, M.I.; Ahmed, T.; Rubel, A.K.M.S.A. Physicochemical characteristics and accumulation of heavy metals in water and sediments of the river Dakatia. Bangladesh. Int. J. Fisher. Aquat. Stud. 2015, 2, 300–304. [Google Scholar]
- Rahman, M.M.; Asaduzzaman, M.; Naidu, R. Consumption of arsenic and other elements from vegetables and drinking water from an arsenic-contaminated area of Bangladesh. J. Hazard. Mater. 2013, 262, 1056–1063. [Google Scholar] [CrossRef]
- Hossen, M.A.; Mostafa, M.G. Assessment of heavy metal pollution in surface water of Bangladesh. Environ. Chall. 2023, 13, 100783. [Google Scholar] [CrossRef]
- WHO (World Health Organization). Guidelines for Drinking Water Quality, 3rd ed.; World Health Organization: Geneva, Switzerland, 2004; p. 515. [Google Scholar]
- Hashim, R.; Song, T.H.; Muslim, N.Z.M.; Yen, T.P. Determination of Heavy Metal Levels in Fishes from the Lower Reach of the Kelantan River, Kelantan, Malaysia. Trop. Life Sci. Res. 2014, 25, 21–39. [Google Scholar] [PubMed]
- Khan, K.; Zeb, M.; Younas, M.; Sharif, H.M.A.; Yaseen, M.; Al-Sehemi, A.G.; Kavil, Y.N.; Shah, N.S.; Cao, X.; Maryam, A.; et al. Heavy metals in five commonly consumed fish species from River Swat, Pakistan, and their implications for human health using multiple risk assessment approaches. Mar. Pollut. Bulletin. 2023, 195, 115460. [Google Scholar] [CrossRef] [PubMed]
- Wahiduzzaman, M.; Islam, M.M.; Sikder, A.H.F.; Parveen, Z. Bioaccumulation and Heavy Metal Contamination in Fish Species of the Dhaleswari River of Bangladesh and Related Human Health Implications. Biol. Trace Elem. Res. 2022, 200, 3854–3866. [Google Scholar] [CrossRef] [PubMed]
- Ahmed, A.S.S.; Rahman, M.; Sultana, S.; Babu, S.M.O.F.; Sarker, M.S.I. Bioaccumulation and heavy metal concentration in tissues of some commercial fishes from the Meghna River estuary in Bangladesh and human health implications. Mar. Pollut. Bull. 2019, 145, 436–447. [Google Scholar] [CrossRef]
- Ahmed, M.K.; Shaheen, N.; Islam, M.S.; Al-Mamun, M.H.; Islam, S.; Islam, M.M.; Kundu, G.K.; Bhattacharjee, L. A comprehensive assessment of arsenic in commonly consumed foodstuffs to evaluate the potential health risk in Bangladesh. Sci. Total Environ. 2016, 544, 125–133. [Google Scholar] [CrossRef] [PubMed]
- Ahmed, M.K.; Baki, M.A.; Islam, M.S.; Kundu, G.K.; Al-Mamun, M.H.; Sarkar, S.K.; Hossain, M.M. Human health risk assessment of heavy metals in tropical fish and shellfish collected from the river Buriganga, Bangladesh. Environ. Sci. Pollut. Res. 2015, 22, 15880–15890. [Google Scholar] [CrossRef]
- Rahman, M.S.; Molla, A.H.; Saha, N.; Rahman, A. Study on heavy metals levels and its risk assessment in some edible fishes from Bangshi River, Savar, Dhaka, Bangladesh. Food Chem. 2012, 134, 1847–1854. [Google Scholar] [CrossRef]
- USFDA. Food and Drug Administration. Guidance Document for Nickel in Shellfish; DHHS/PHS/FDA/CFSAN/; Office of Seafood: Washington, DC, USA, 1993. Available online: http://www.cfsan.fda.gov/%7Efrf/guid-as.html (accessed on 17 March 2016).
- FAO. Compilation of legal limits for hazardous substances in fish and fishery products. FAO Fish Circular 1983, 464, 5–100. [Google Scholar]
- WHO. Environmental Health Criteria No 165: Inorganic Lead. World Health Organization (WHO); 1995. Available online: http://www.inchem.org/documents/ehc/ehc/ehc165.htm (accessed on 26 December 2024).
- FAO/WHO. (FAO/World Health Organization). Codex Alimentarius—General Standards for Contaminants and Toxins in Food; Schedule 1 maximum and guideline levels for contaminants and toxins in food. Reference CX/FAC 02/16; Joint FAO/WHO Food Standards Programme, Codex Committee: Rotterdam, The Netherlands, 2002. [Google Scholar]
- IOM. Institute of Medicine Dietary Reference Intakes. Applications in Dietary Planning. Subcommittee on Interpretation and Uses of Dietary Reference Intakes and the Standing Committee on the Scientific Evaluation of Dietary Reference Intakes; Institute of Medicine of the National Academies, The National Academies Press: Washington, DC, USA, 2003; p. 248. [Google Scholar]
- EC. European Commission of the European Communities. Commission regulation (EC) n. 221/2002 of the 6 February 2002 amending regulation (EC) n. 466/2002 setting maximum levels for certain contaminants in foodstuffs. Off. J. Eur. Commun. 2002, 7, 37. [Google Scholar]
- Lee, H.J.; Park, M.K.; Seo, Y.R. Pathogenic mechanisms of heavy metal-induced Alzheimer’s disease. Toxicol. Environ. Health Sci. 2018, 10, 1–10. [Google Scholar] [CrossRef]
- Wise, J.P., Jr.; Young, J.L.; Cai, J.; Cai, L. Current understanding of hexavalent chromium [Cr (VI)] neurotoxicity and new perspectives. Environ. Int. 2022, 158, 106877. [Google Scholar] [CrossRef] [PubMed]
- Chen, A.; Kim, S.S.; Chung, E.; Dietrich, K.N. Thyroid hormones in relation to lead, mercury, and cadmium exposure in the National Health and Nutrition Examination Survey, 2007–2008. Environ. Health Perspect. 2013, 121, 181–186. [Google Scholar] [CrossRef]
- Yang, A.-M.; Lo, K.; Zheng, T.-Z.; Yang, J.-L.; Bai, Y.-N.; Feng, Y.-Q.; Cheng, N.; Liu, S.-M. Environmental heavy metals and cardiovascular diseases: Status and future direction. Chronic Dis. Transl. Med. 2020, 6, 251–259. [Google Scholar] [CrossRef]
- Patwa, J.; Flora, S.J.S. Heavy metal-induced cerebral small vessel disease: Insights into molecular mechanisms and possible reversal strategies. Int. J. Mol. Sci. 2020, 21, 3862. [Google Scholar] [CrossRef]
- Capitão, C.; Martins, R.; Santos, O.; Bicho, M.; Szigeti, T.; Katsonouri, A.; Bocca, B.; Ruggieri, F.; Wasowicz, W.; Tolonen, H.; et al. Exposure to heavy metals and red blood cell parameters in children: A systematic review of observational studies. Front. Pediatr. 2022, 10, 921239. [Google Scholar] [CrossRef] [PubMed]
- Wilbur, S.; Abadin, H.; Fay, M.; Yu, D.; Tencza, B.; Ingerman, L.; Klotzbach, J.; James, S. Toxicological Profile for Chromium; Agency for Toxic Substances and Disease Registry: Atlanta, GA, USA, 2012. [Google Scholar]
- Hu, X.; Fernandes, J.; Jones, D.P.; Go, Y.M. Cadmium stimulates myofibroblast differentiation and mouse lung fibrosis. Toxicology 2017, 383, 50–56. [Google Scholar] [CrossRef] [PubMed]
- Ma, Y.; Ran, D.; Shi, X.; Zhao, H.; Liu, Z. Cadmium toxicity: A role in bone cell function and teeth development. Sci. Total Environ. 2021, 769, 144646. [Google Scholar] [CrossRef]
- Kim, D.-W.; Ock, J.; Moon, K.-W.; Park, C.-H. Association between Pb, Cd, and Hg exposure and liver injury among Korean adults. Int. J. Environ. Res. Pub. 2021, 18, 6783. [Google Scholar] [CrossRef] [PubMed]
- Balali-Mood, M.; Naseri, K.; Tahergorabi, Z.; Khazdair, M.R.; Sadeghi, M. Toxic mechanisms of five heavy metals: Mercury, lead, chromium, cadmium, and arsenic. Front. Pharmacol. 2021, 12, 643972. [Google Scholar] [CrossRef]
- Mandal, B.K.; Suzuki, K.T. Arsenic round the world: A review. Talanta 2002, 58, 201. [Google Scholar] [CrossRef]
- Lei, H.-L.; Wei, H.-J.; Ho, H.-Y.; Liao, K.-W.; Chien, L.-C. Relationship between risk factors for infertility in women and lead, cadmium, and arsenic blood levels: A cross-sectional study from Taiwan. BMC Public Health 2015, 15, 1220–1311. [Google Scholar] [CrossRef] [PubMed]
- Lin, J.; Lin, X.; Qiu, J.; You, X.; Xu, J. Association between heavy metals exposure and infertility among American women aged 20–44 years: A cross-sectional analysis from 2013 to 2018 NHANES data. Front. Public Health 2023, 11, 1122183. [Google Scholar] [CrossRef] [PubMed]
- NYSDOH. Hopewell Precision Area Contamination: Appendix C-NYS DOH. In Procedure for Evaluating Potential Health Risks for Contaminants of Concern; New York State Department of Health: New York, NY, USA, 2007. [Google Scholar]
- Adebiyi, F.M.; Ore, O.T.; Owolafe, O.S. Human health risk assessment of potentially toxic metals in fish (Cynoglossus sp.) commonly consumed in Nigeria. Discov. Toxicol. 2024, 1, 7. [Google Scholar] [CrossRef]
- Yi, Y.; Tang, C.; Yi, T.; Yang, Z.; Zhang, S. Health risk assessment of heavy metals in fish and accumulation patterns in food web in the upper Yangtze River, China. Ecotoxicol. Environ. Saf. 2017, 145, 295–302. [Google Scholar] [CrossRef]
- Hossain, M.M.; Wang, S.; Liang, Z.; Geng, A.; Jahan, I.; Tripty, S.J.; Maxwell, S.J.; Hossain, I.; Sethupathy, S.; Zhu, D. Potentially toxic elements (PTEs) in the invasive Asian clam (Corbicula fluminea) from polluted urban river areas of Bangladesh and evaluation of human health risk. Environ. Monit. Assess. 2024, 196, 1178. [Google Scholar] [CrossRef] [PubMed]
- Anyanwu, B.O.; Chris, D.I. Human health hazard implications of heavy metals concentration in swimming crab (Callinectes amnicola) from polluted creeks in Rivers State, Nigeria. Case Stud. Chem. Environ. Eng. 2023, 7, 100325. [Google Scholar] [CrossRef]
- Li, P.; Huang, Y.-Y.; Zeng, J.; Lin, Z.Z.; Huang, Z.-Y. Health risk assessment of heavy metals in shellfish collected from Fujian, China. Hum. Ecol. Risk Assess. Int. J. 2020, 26, 621–635. [Google Scholar] [CrossRef]
- Yu, B.; Wang, X.; Dong, K.F.; Xiao, G.; Ma, D. Heavy metal concentrations in aquatic organisms (fishes, shrimp and crabs) and health risk assessment in China. Mar. Pollut. Bull. 2020, 159, 1115. [Google Scholar] [CrossRef] [PubMed]
- Jiang, H.; Qin, D.; Chen, Z.; Tang, S.; Bai, S.; Mou, Z. Heavy Metal Levels in Fish from Heilongjiang River and Potential Health Risk Assessment. Bull. Environ. Contam. Toxicol. 2016, 97, 536–542. [Google Scholar] [CrossRef]
- Chai, M.; Li, R.; Gong, Y. Bioaccessibility-corrected health risk of heavy metal exposure via shellfish consumption in coastal region of China. Environ. Pollut. 2021, 273, 116529. [Google Scholar] [CrossRef]
- Hasanein, S.S.; Mourad, M.H.; Haredi, A.M.M. The health risk assessment of heavy metals to human health through the consumption of Tilapia spp and catfish caught from Lake Mariut, Egypt. Heliyon 2022, 8, e09807. [Google Scholar] [CrossRef] [PubMed]
- Kaba, P.; Shushi, S.; Gyimah, E.; Husein, M.; Abomohra, A. Multivariate Analysis of Heavy Metals and Human Health Risk Implications Associated with Fish Consumption from the Yangtze River in Zhenjiang City, China. Water 2023, 15, 1999. [Google Scholar] [CrossRef]

| Time | Water Body Name | River Water Study Code | Country/City Code | Pollution Source | Cr | Mn | Fe | Ni | Cu | Zn | As | Pb | Cd | Unit |
|---|---|---|---|---|---|---|---|---|---|---|---|---|---|---|
| 2021 | Buriganga River | E1 | B/D | TDIMW | 1.99 | - | 12.31 | 1.05 | 0.685 | 1.065 | - | 0.27 | - | mg/L |
| 2021 | Turag River | E2 | B/D | TDIMW | 0.61 | - | 6.995 | 0.965 | 0.75 | 1.6 | - | 0.32 | - | mg/L |
| 2021 | Halda River | E3 | B/C | IESG | 0.032 | 0.08 | 0.48 | - | 1.751 | 0.2275 | 1.205 | 0.067 | 0.036 | mg/L |
| 2021 | Karnaphuli River | E4 | B/C | WBWMS | 0.006 | 1.53 | 4.34 | 0.018 | 0.007 | 0.059 | - | 0.022 | 0.017 | mg/L |
| 2021 | Louhajang River | E9 | B/D | IMHA | 0.0052 | - | - | 0.0041 | 0.0062 | - | 0.0059 | 0.0051 | 0.0004 | mg/L |
| 2021 | Dhaleshwari River | E10 | B/D | IMDW | 0.71 | - | - | 0.62 | - | 0.18 | - | - | 0.19 | mg/L |
| 2021 | Meghna River | E11 | B/C | IMDW | 0.045 | - | - | - | - | 0.024 | 0.009 | 0.018 | mg/L | |
| 2021 | Sela River | E12 | B/K | OSAF | 0.0346 | 0.035 | 0.0734 | 0.1481 | 0.0236 | 0.028 | - | 0.0837 | 0.0307 | mg/L |
| 2020 | Ganges River | E13 | B/K | Geogenic | 0.0007 | 0.0002 | 0.08 | 0.005 | 0.0067 | 0.089 | 0.0021 | 0.0026 | 0.0001 | mg/L |
| 2019 | Old Brahmaputra | E6 | B/D | IDID | 0.01 | 1.44 | - | 0.44 | 0.12 | 0.01 | - | 0.11 | 0.001 | mg/L |
| 2019 | Ganges River | E8 | B/R | IMA | 0.038 | 0.004 | 0.012 | 0.03 | 0.003 | 0.009 | mg/L | |||
| 2018 | Korotoa River | E14 | B/R | MIEAR | 1.13 | - | - | 1.33 | 3.02 | 2.62 | 0.81 | 0.75 | mg/L | |
| 2018 | Balu River | E15 | B/D | IMDW | 0.0044 | 0.0132 | - | 0.0186 | 0.003 | mg/L | ||||
| 2017 | Passur River | E16 | B/K | GS | 0.02 | 0.27 | 0.02 | 0.01 | mg/L | |||||
| 2016 | Turag River | E17 | B/D | IMDW | 0.0558 | 0.7085 | 2.606 | 0.1309 | 0.2308 | 0.2952 | 0.0034 | 0.0146 | 0.0143 | mg/L |
| 2016 | Shitalakhya River | E18 | B/D | IMDW | 0.0242 | 0.023 | 0.0073 | mg/L | ||||||
| 2016 | Karnaphuli River | E5 | B/C | WBWMS | 69.56 | 23.36 | 9.85 | 6.46 | µg/L | |||||
| 2015 | Buriganga River | E19 | B/D | TDIMW | 0.114 | 0.157 | 0.612 | 0.15 | 0.239 | 0.332 | 0.134 | 0.119 | 0.059 | mg/L |
| 2015 | Dakatia River | E20 | B/C | USF | 0.003 | 0.334 | 0.218 | 0.033 | 0.114 | 0.006 | 0.001 | mg/L | ||
| 2013 | Bangshi River | E21 | B/D | TDAD | 0.093 | 0.088 | 0.035 | 1.05 | 3.32 | 0.024 | 0.108 | 0.007 | mg/L | |
| 2012 | Khiru River | E7 | B/M | IMDW | 0.167 | 0.0043 | 0.007 | 0.0221 | 0.128 | mg/L | ||||
| Ganga River | W10 | India/ | 70.16 | 61.11 | 43.72 | 71.37 | 80.55 | 11.41 | µg/L | |||||
| Lee River | W5 | England/ | 55.1 | 46.7 | 62.7 | 13.3 | 0.44 | µg/L | ||||||
| Yangtze River | W15 | China/ | 1.3 | 2.8 | 31 | 2 | 0.4 | µg/L | ||||||
| BDSW | E22 | 0.05 | 0.1 | 0.3 | 0.1 | 1 | 5 | 0.05 | 0.05 | 0.005 | mg/L | |||
| WHO | E23 | 5 | 10 | 10 | 3 | µg/L | ||||||||
| TRV | 11 | 150 | 3 | 2 | µg/L |
| Time | Name | Country (City Code) | Study Code | Aquatic Species | Analytical Method | Cr | Mn | Fe | Ni | Cu | Zn | As | Pb | Cd |
|---|---|---|---|---|---|---|---|---|---|---|---|---|---|---|
| 2024 | Turag-Tongi-Balu | Bangladesh (D) | S1 | H. fossilis | ICP-MS and FAAS | 1.74 | 26.32 | 19 | 1.34 | 0.2 | 6.39 | 0.16 | 4.17 | 0.67 |
| 2023 | Swat River | Pakistan | S2 | fish | ICP-MS | 14.59 | 11.80 | 8.59 | 116.83 | 1.95 | 0.29 | |||
| 2022 | Dhaleswari River | Bangladesh(D) | S3 | H. fossilis | AAS | 22.6 | 5.55 | 98.19 | 7 | |||||
| 2021 | Buriganga River | Bangladesh (D) | S4 | H. fossilis | AAS | 187.07 | 39.07 | 3.01 | 3.51 | 35.12 | 5.07 | |||
| 2021 | Turag River | Bangladesh (D) | S5 | H. fossilis | AAS | 70.18 | 45.1 | 12.18 | 6.03 | 68.25 | 6.22 | |||
| 2019 | Karnaphuli River | Bangladesh(C) | S6 | P. chinensis | ICP-MS | 3.59 | 13.1 | 5.03 | 14 | 0.44 | ||||
| 2019 | Karnaphuli River | Bangladesh (C) | S7 | T. ilisha | GF-AAS and AAS | 0.65 | 1.22 | 0.67 | 0.15 | |||||
| 2016 | Buriganga River | Bangladesh(D) | S8 | L. rohita | ICP-MS | 18.84 | 125.81 | 6.64 | 18.77 | 251.69 | 0.73 | 6.98 | 0.04 | |
| 2015 | Buriganga River | Bangladesh(D) | S9 | M. pancalus | ICP-MS | 7.18 | 25.65 | 1.6 | 11.66 | 165.1 | 0.22 | 3.17 | 0.01 | |
| 2015 | Buriganga River | Bangladesh(D) | S9 | M. rosenbergii * | ICP-MS | 1.59 | 35.25 | 0.44 | 575.34 | 187.04 | 1.19 | 0.51 | 1.51 | |
| 2015 | Buriganga River | Bangladesh(D) | S9 | I. exustus ** | ICP-MS | 16.05 | 319.66 | 5.75 | 16.47 | 58.56 | 1.02 | 4.55 | 0.05 | |
| 2014 | Kelantan River | Malaysia | S12 | fish | GF-AAS | 0.072 | 0.05 | |||||||
| 2012 | Bangshi River | Bangladesh(D) | S13 | H. fossilis | AAS | 0.71 | 26.11 | 4.11 | 14.17 | 203.19 | 6.24 | 7.71 | 0.31 | |
| USFDA (FSG) | S14 | 13 | 80 | |||||||||||
| FAO | S15 | 1 | 1 | 10 | 30 | 1 | 2.5 | 0.2 | ||||||
| WHO | S16 | 30 | 2 | |||||||||||
| FAO/WHO | S17 | 1 | ||||||||||||
| IOM | S18 | 40–45 | ||||||||||||
| EC (EU) | S19 | 1 | 3 | 0.1 | 0.05 |
Disclaimer/Publisher’s Note: The statements, opinions and data contained in all publications are solely those of the individual author(s) and contributor(s) and not of MDPI and/or the editor(s). MDPI and/or the editor(s) disclaim responsibility for any injury to people or property resulting from any ideas, methods, instructions or products referred to in the content. |
© 2024 by the authors. Licensee MDPI, Basel, Switzerland. This article is an open access article distributed under the terms and conditions of the Creative Commons Attribution (CC BY) license (https://creativecommons.org/licenses/by/4.0/).
Share and Cite
Hossain, M.M.; Jahan, I.; Dar, M.A.; Dhanavade, M.J.; Mamtaz, A.F.B.; Maxwell, S.J.; Han, S.; Zhu, D. A Review of Potentially Toxic Elements in Sediment, Water, and Aquatic Species from the River Ecosystems. Toxics 2025, 13, 26. https://doi.org/10.3390/toxics13010026
Hossain MM, Jahan I, Dar MA, Dhanavade MJ, Mamtaz AFB, Maxwell SJ, Han S, Zhu D. A Review of Potentially Toxic Elements in Sediment, Water, and Aquatic Species from the River Ecosystems. Toxics. 2025; 13(1):26. https://doi.org/10.3390/toxics13010026
Chicago/Turabian StyleHossain, Md Muzammel, Iffat Jahan, Mudasir A. Dar, Maruti J. Dhanavade, Al Fattah Bin Mamtaz, Stephen J. Maxwell, Song Han, and Daochen Zhu. 2025. "A Review of Potentially Toxic Elements in Sediment, Water, and Aquatic Species from the River Ecosystems" Toxics 13, no. 1: 26. https://doi.org/10.3390/toxics13010026
APA StyleHossain, M. M., Jahan, I., Dar, M. A., Dhanavade, M. J., Mamtaz, A. F. B., Maxwell, S. J., Han, S., & Zhu, D. (2025). A Review of Potentially Toxic Elements in Sediment, Water, and Aquatic Species from the River Ecosystems. Toxics, 13(1), 26. https://doi.org/10.3390/toxics13010026