

Volatile Organic Compounds in Indoor Air: Sampling, Determination, Sources, Health Risk, and Regulatory Insights


Abstract
:1. Introduction
2. An Overview of VOC Determination: From Definition to Measurement Methodology
2.1. Definition and Sources of VOCs
2.2. Methodologies for Measuring VOCs in Indoor Air
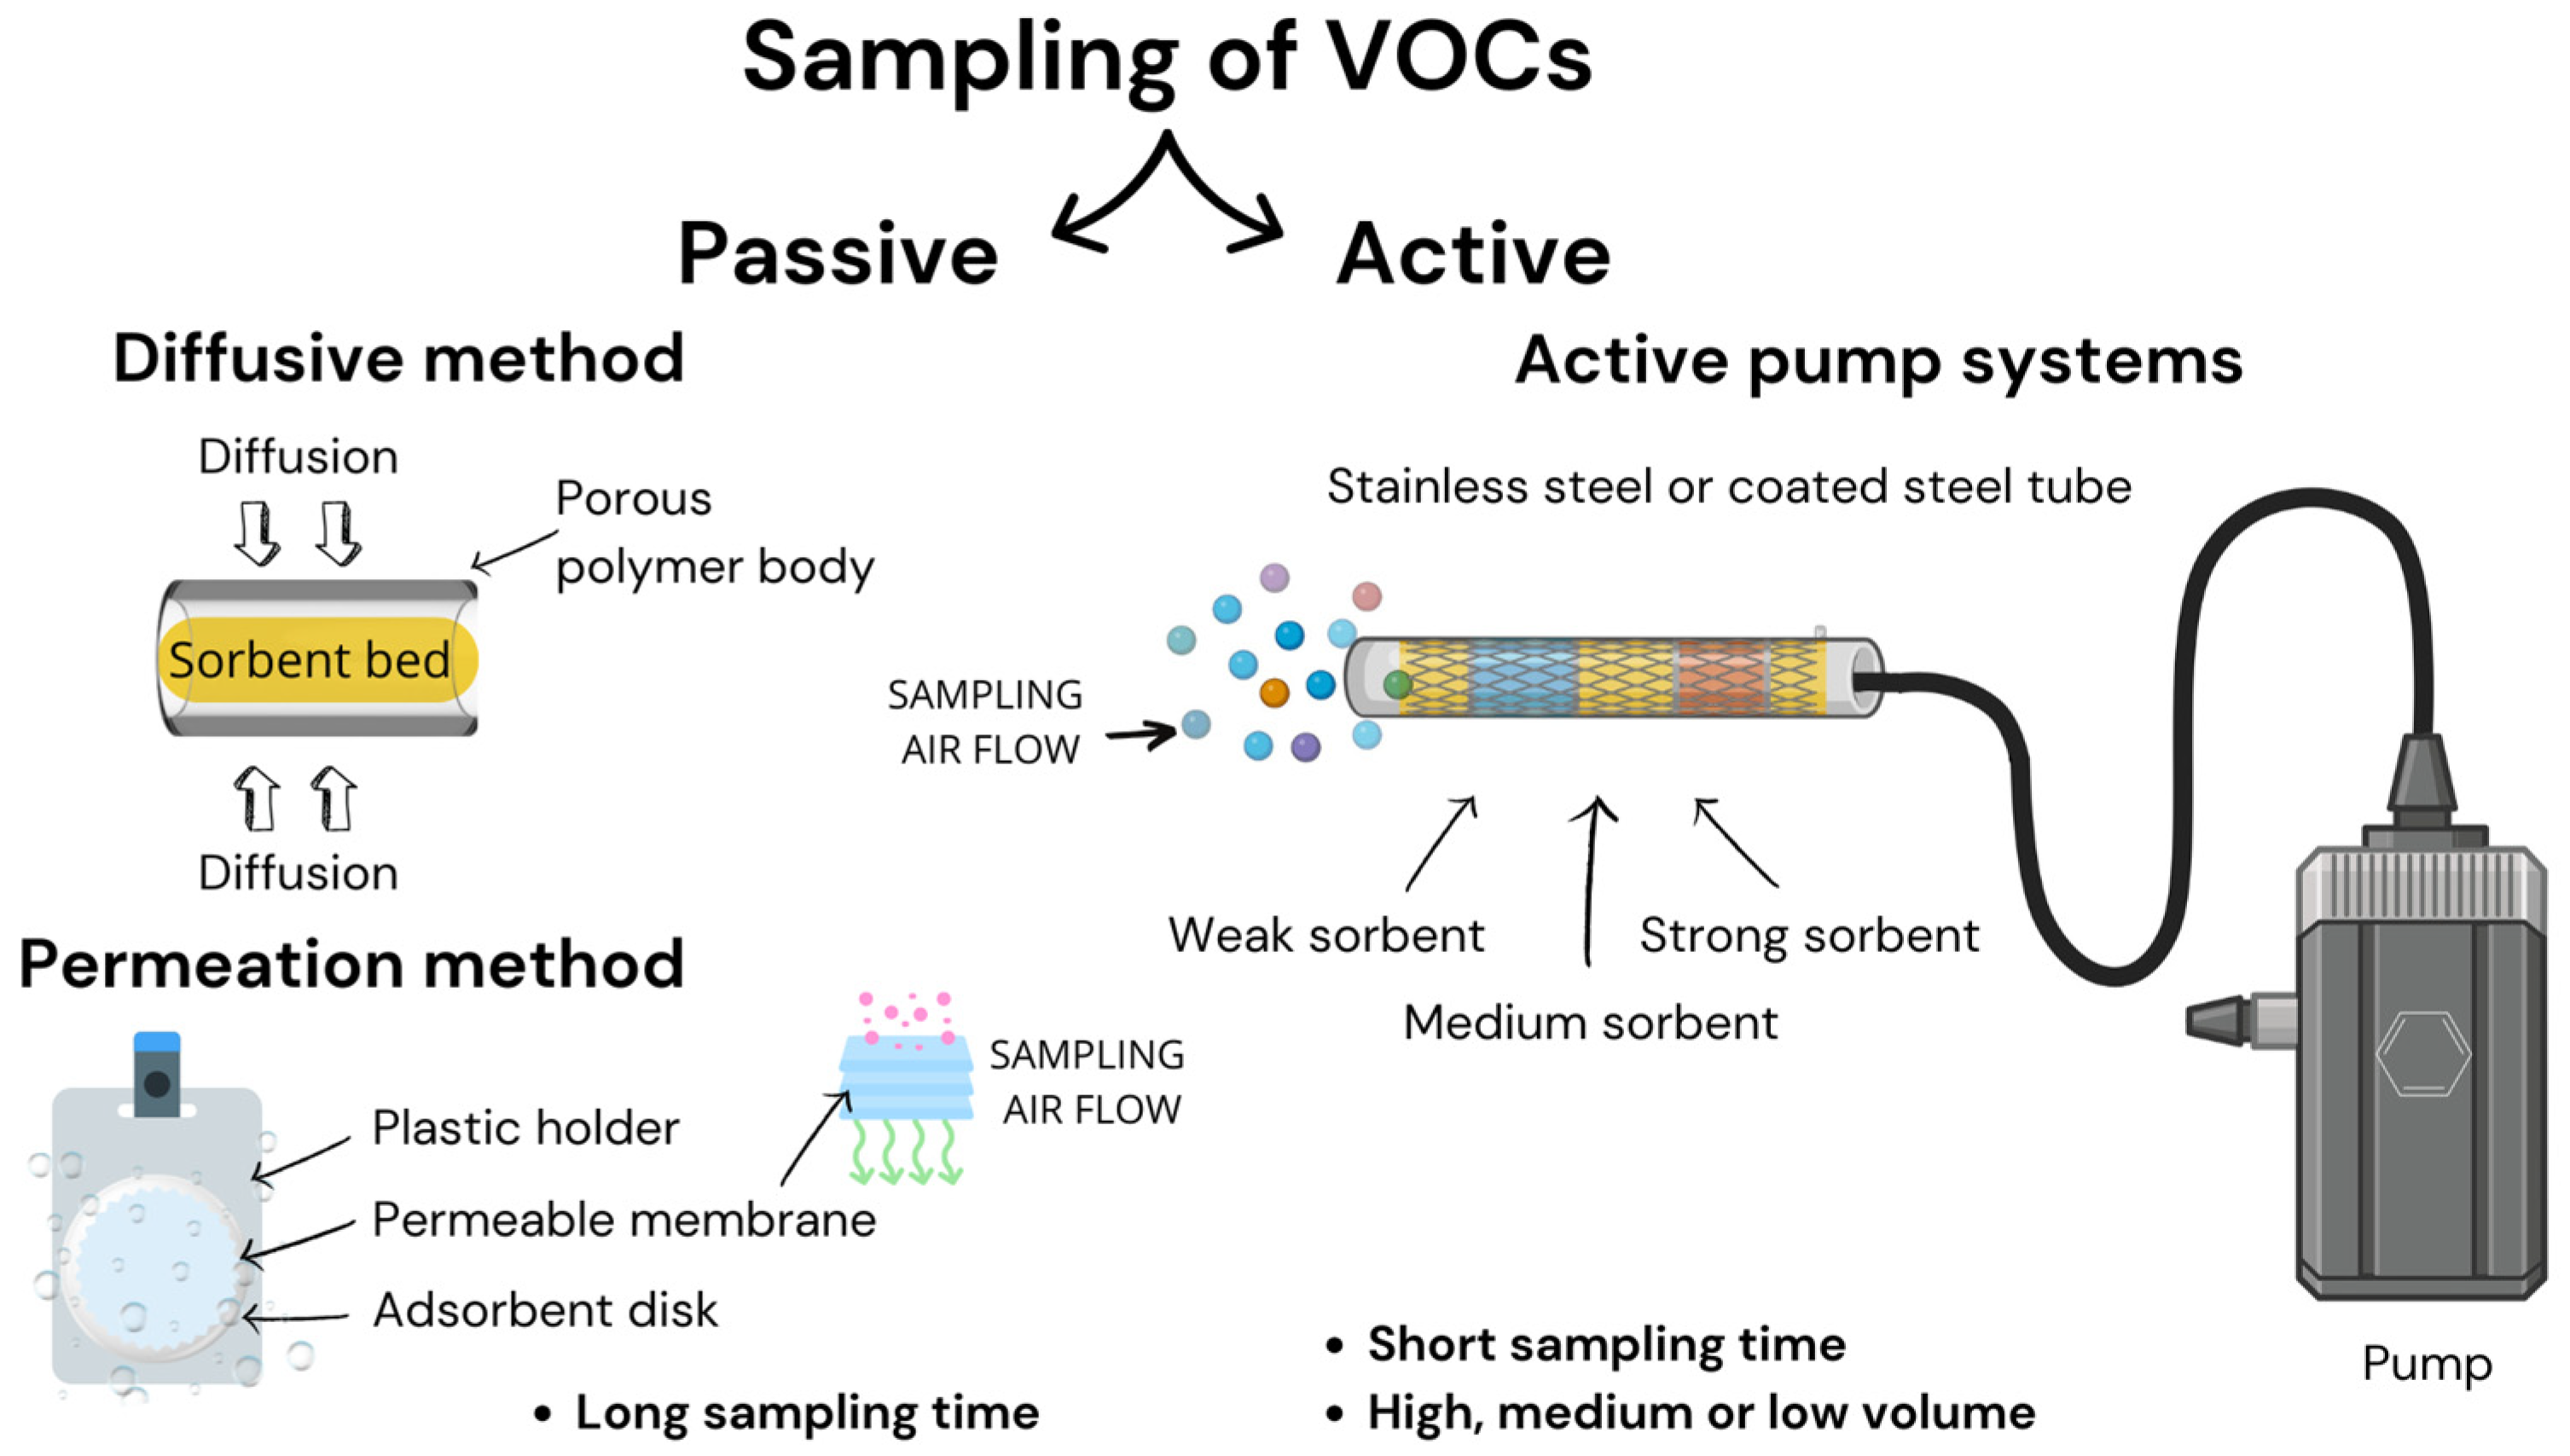
2.2.1. Familiar Techniques for Sampling VOCs
Active Sampling
Passive Sampling
Automatic Devices
Sensor
2.2.2. Types of Sorbents Used for Sampling VOCs
2.2.3. Analytical Method for VOC Determination
2.3. Human Exposure Assessment

| VOC | IARC Group | IUR |
|---|---|---|
| Benzene | 1 | 2.9 × 10⁻⁵ |
| Toluene | 3 | n.a. |
| Xylenes | 3 | n.a. |
| Acetaldehyde | 2B | 2.7 × 10⁻⁶ |
| 1,4-dichlorobenzene | 2B | 1.1 × 10⁻⁵ |
| 1,3-Butadiene | 2A | 1.7 × 10⁻⁴ |
| Trichloroethylene | 2A | 2.0 × 10⁻⁶ |
| Tetrachloroethylene | 2A | 6.1 × 10⁻⁶ |
| Methylene chloride | 2B | 1.0 × 10⁻⁶ |
| Chloroform | 2B | 5.3 × 10⁻⁶ |
| Ethylbenzene | 2B | 2.5 × 10⁻⁶ |
| Naphthalene | 2B | 3.4 × 10⁻⁵ |
| Formaldehyde | 2A | 6.0 × 10⁻⁶ |
| VOCs | Possible Source | Health Impact | Ref. |
|---|---|---|---|
| ethanol, methanol, 2-propanol, acetone | Nail polish remover, cleaning products, hair sprays, perfumes | Headache, giddiness, insomnia, irreversible visual impairment or blindness, stomach disturbances, vomiting | [132,133] |
| formaldehyde, hexanal | Plywoods, carpets, furniture | Eyes irritation, cancer, leukaemia, coughing | [134,135] |
| ethylene, isobutylene | Rubber items | Headache, dizziness | [135] |
| benzene, toluene, ethylbenzene, xylene, dichlorobenzene, naphthalene, styrene | Deodorisers, tobacco smoke, air fresheners, foam products, furniture | Acute myeloid leukaemia, speech difficulties, headaches, dizziness, sleep disturbances, nausea | [136,137] |
| methyl-tert-butyl ether | Plasticisers, medical solvent | Nose irritation, headache, eye irritation, inability to coordinate | [137] |
| n-butane, n-hexane, n-heptane, n-octane, cyclohexane | Furniture, leather, cosmetics | Skin rash, muscular weakness, confusion, dizziness | [138,139] |
| methylene chloride, 1,1,1 trichloroethane, difluoromethane, tetrachloroethylene | Freezers, refrigerators, air conditioners | Headache, vomiting, convulsions, death | [140] |
| acetone, methyl ethyl ketone, methyl isobutyl ketone | PVC cement and primer, adhesives | Brain fog, headache, fatigue | [141] |
| α-pinene, D-limonene | Wood, citrus oil cleaners, cosmetics | Kidney damage, cancer, liver damage | [28,142] |
2.4. Concentrations of VOCs Measured in Households Throughout Europe and Around the World
| Author | City, Country | Sampling Time | Description | Compounds, μg m−3 | Ref. |
|---|---|---|---|---|---|
| Thiam et al., 2025 a | Senegal | July–September 2020; October–December 2021; | bedroom (n = 15), living room (n = 21), hall room (n = 22) | Benzene 7.2 (b), 6.9 (l), 12.6 (h) Toluene 10.2 (b), 18.3 (l), 80.6 (h) | [171] |
| Gabriel et al., 2024 a | Northern Portugal | July 2018–June 2019 | bedroom, living room n = 30 | Benzene 1.2, ethylbenzene 1.8, m/p/o-xylenes 15.4, styrene 1.0, tetrachloroethylene 0.3, toluene 15.5, 1,2,4-trimethylbenzene 2.0, 3-carene 1.7, α,β-pinenes 8.6, limonene 18.2, TVOC 269.3 | [158] |
| Otgonvbyamba et al., 2023 b | Ulaanbaatar, Mongolia | November 2019–July 2020 | new buildings n = 380 old apartments n = 144 | Benzene 15.2, m/p-xylenes 82.9, toluene 68.1, formaldehyde 5.2 for new buildings Benzene 24.2, m/p-xylenes 71.8, toluene 74.9, formaldehyde 20.4 for old apartment | [162] |
| Caron-Beaudoin et al., 2022 c | Peace River Valley, Canada | May–September 2019 | family room or bedroom | Benzene 0.80, ethylbenzene 0.80, chloroform 0.80, cyclohexane 0.20, heptane 1.10, m/p-xylenes 3.00, o-xylene 0.90, styrene 0.90, tetrachloroethylene 0.20, toluene 4.10, 1,2,4-trimethylbenzene 0.60, limonene 28.2 | [164] |
| Alvarez-Vaca et al., 2022 b | Grand Duchy, Luxembourg | 2014–2019 | living room, kitchen, office | <p75: benzene 2.7 (n = 369), formaldehyde 11.9 (n = 345), β-pinene 3.5 (n = 370), limonene 10.3 (n = 370) <p90: ethylbenzene 2.1 (n = 370), heptane 2.7 (n = 370), m-xylene 3.8 (n = 370), o-xylene 2.2 (n = 370), tetrachloroethylene 0.2 (n = 370), toluene 8.7 (n = 370), 1,2,3-trimethylbenzene 0.9 (n = 370), 1,2,4-trimethylbenzene 2.9 (n = 370), 1,3,5-trimethylbenzene 0.8 (n = 370), 1,4-dichlorobenzene 0.3 (n = 370) Maximum value: p-xylene 1.8 (n = 370), styrene 1.7 (n = 370), trichloroethylene 0.3 (n = 370), 3-carene 1.7 (n = 370), α-pinene 4.9 (n = 370) | [165] |
| Heeley-Hill et al., 2021 c | Ashford, United Kingdom | February–April July–September 2019 | winter–summer n = 60 | Benzene 0.50, ethylbenzene 0.80, n-heptane 0.30, 2-methylpentane 0.40, m/p-xylenes 1.50, o-xylene 1.20, tetrachloroethylene 0.03, toluene 1.50, dichloromethane 0.20, 1,3,5-trimethylbenzene 0.20, α-pinene 8.00, β-pinene 0.1 limonene 3.80 | [159] |
| Alves et al., 2020 a | Aveiro, Portugal | October–November 2017 | kitchen | Benzene 1.6, ethylbenzene 2.4, m/p-xylenes 7.6, o-xylene 3.1, styrene 1.0, tetrachloroethylene 0.96, trichloroethylene <0.10, toluene 9.4, 1,4-dichlorobenzene <0.10, α-pinene 9.5 | [154] |
| Kozielska et al., 2020 | Upper Silesia, Poland | February–May 2017 | residential building and flats, weekend | Benzene 3.59, ethylbenzene 5.41, m/p-xylenes 3.88, o-xylene 0.78, styrene 5.20, toluene 15.70, 1,3,5-trimethylbenzene 4.52 r. buildings Benzene 1.07, ethylbenzene 1.35, m/p-xylenes 0.68, o-xylene 1.72, styrene 2.61, toluene 16.45, 1,3,5-trimethylbenzene 3.10 flats | [160] |
| Mečiarova et al., 2017 d | Slovakia | May 2017 | living room | 519.7 | [155] |
| Rodrigues Dos Santos et al., 2020 a,c | Lisabon, Portugal | October 2015–March 2016 | bedroom | TVOC 0.2 c TVOC 3.1 a | [161] |
| Yang et al., 2020 a | Switzerland | September 2015 | bedroom | Benzene 4.1, n-heptane 9.0, xylenes 22, toluene 51, formaldehyde 14, α-pinene 4.5, d-limonene 14, TVOC 384 | [156] |
| Rovelli et al., 2019 a | Como, Italy | during a dishwasher washing cycle, n = 9 | Benzene 4.0, ethylbenzene 4.8, m-xylene 13.8, p-xylene 4.3, o-xylene 4.9, styrene 0.9, toluene 23.4, α-pinene 6.2, d-limonene 231.5 | [170] | |
| Cheng et al., 2018 a | Chongqing, China | November 2014–February 2015 | bedroom, living room, kitchen | Benzene 6.6 (b), 9.1 (l), 11.6 (k) Xylene 14.3 (b), 14.2 (l), 15.2 (k) Toluene 24.4 (b), 23.6 (l), 21.4 (k) Formaldehyde 23.2 (b), 21.3 (l), 15.6 (k) | [146] |
| Cheng et al., 2016 a | Melbourne, Australia | August 28 to December 2008 Januray 12 to May 4 2009 | living room | Methylcyclopentane 0.8, cyclohexane 1.3, n-heptane 1.8, methlycyclohexane 1.1, benzene 1.3, toluene 10.7, ethlybenzene 1.2, p-xylene 2.9, m-xylene 1.2, styrene 0.5, o-xylene 2.2, 1,3,5-trimethylbenzene 0.8, 1,4-dichlorobenzene 0.2, α-pinene 5.8, β-pinene 3.9, d-limonene 11.3 | [173] |
| Villanueva et al., 2015 a | Puertollano, Spain | May–June 2011 | living room | Benzene 1.9, ethylbenzene 3.4, n-heptane 3.2, m/p-xylenes 7.0, o-xylene 0.8, styrene 2.1, toluene 12.0, 1,2,4-trimethylbenzene 2.9, formaldehyde 54.6, α-pinene 18.5, d-limonene 17.1 | [150] |
| Uchiyama et al., 2015 a | Japan | winter/summer January–March July–September 2012, 2013, 2014 | residential buildings n = 602 | Benzene 2.3/1.3, ethylbenzene 5.6/4.4, m+p-xylenes 8.3/5.8, o-xylene 3.4/2.6, toluene 11.0/12.0, 1,3,5-trimethylbenzene 2.0/1.2 | [166] |
| Kumar et al., 2014 a | New Delhi, India | March–May 2011 | residential homes, kitchen, living room, bedroom | Benzene 7.9 (k), 8.2 (l), 7.3 (b) m+p-xylenes 4.2 (k), 5.4 (l), 4.7 (b) o-xylene 1.8 (k), 2.3 (l), 1.9 (b) toluene 30.7 (k), 32.9 (l), 28.8 (b) | [145] |
| Rösch et al., 2014 a | Leipizig, Germany | May 2006–December 2008 | n = 662 | Benzene 1.5., cyclohexane 1.60, chlorobenzene 2.93, ethylbenzene 1.51, heptane 4.20, methylcyclopentane 1.31, m/p-xylenes 3.27, o-xylene 0.97, styrene 0.83, trichloroethylene 0.17, toluene 13.18, 1,3,5-trimethylbenzene 0.41, 1,2,4-trimethylbenzene 1.35, 1,2,3-trimethylbenzene 0.40, α-pinene 31.69, β-pinene 3.69, σ-3-carene 15.54, limonene 28.31 | [163] |
| Du et al., 2014 c | Guangzhou, China | December 2014 | newly renovated homes | Benzene 18.8, m+p-xylenes 46.0, o-xylene 33.9, toluene 181.0 | [157] |
3. Discussion
3.1. Impact of Human Activities on Indoor VOC Levels
3.1.1. Cooking’s Impact on VOC Levels
3.1.2. Renovation’s Impact on VOC Levels
3.1.3. Impact of Cleaning Products on VOC Levels
3.2. Concentration of VOCs in Different Types of Rooms and Ventilation Systems
3.3. Indoor vs. Outdoor VOC Levels
3.4. Spatial Distribution
4. Conclusions
Author Contributions
Funding
Institutional Review Board Statement
Informed Consent Statement
Data Availability Statement
Acknowledgments
Conflicts of Interest
Appendix A
| VOCs | Levels | Environment | Time Measuring | Country | Guidelines Name |
|---|---|---|---|---|---|
| Benzene | No safe level | All building | WHO guidelines for indoor air quality: selected pollutants | ||
| No safe level | Residential | South Africa | Guideline for the management of domestic indoor air quality | ||
| ≤0.03 mg m−3 No safe level 27 µg m−3 10 µg m−3 30 µg m−3 | Residential | 1 h acute exposure 1 year 14 days | China Canada California France | Standards for Indoor Air Quality Guidance for Benzene in Residential Indoor Air Office of Environmental Health Hazard Assessment California Environmental Protection Agency The French Agency for Food EaOHS. ANSES’s list of indoor air quality guideline values | |
| Tetrachloroethylene | 0.25 mg m−3 | All building | 1 year | WHO guidelines for indoor air quality: selected pollutants | |
| ≤0.12 mg m−3 | 8 h | China | Standards for Indoor Air Quality | ||
| 0.25 mg m−3 | Residential | 1 year | South Africa | Guideline for the management of domestic indoor air quality | |
| Trichloroethylene | Unit risk 4.3 × 10⁻⁷ per μg m−3 | All building | South Africa | Guideline for the management of domestic indoor air quality | |
| ≤0.006 mg m−3 | 8 h | China | Standards for Indoor Air Quality | ||
| Formaldehyde | 0.1 mg m−3 | All building | 30 min | WHO guidelines for indoor air quality: selected pollutants | |
| 120 µ m−3 | Residential | 8 h | Nigeria | National Environmental (Air Quality Control) Regulations, 2021 | |
| ≤0.08 mg m−3 | 1 h | China | Standards for Indoor Air Quality | ||
| 100 µg m−3 | Public buildings | 24 h | Thailand | Notification of indoor air quality for public buildings B.E 2565 (2022) | |
| 100 µg m−3 | All buildings | 30 min | Japan | Committee on Sick House Syndrome: Indoor Air Pollution Progress Report No. 4—Summary of the discussions at the 8th and 9th meetings | |
| Xylenes | ≤0.20 mg m−3 | 1 h | China | Standards for Indoor Air Quality | |
| Toluene | ≤0.20 mg m−3 | 1 h | China | Standards for Indoor Air Quality | |
| 260 µg m−3 | All buildings | Japan | Committee on Sick House Syndrome: Indoor Air Pollution Progress Report No. 4—Summary of the discussions at the 8th and 9th meetings | ||
| Styrene | 220 µg m−3 | All buildings | Japan | Committee on Sick House Syndrome: Indoor Air Pollution Progress Report No. 4—Summary of the discussions at the 8th and 9th meetings |
References
- Vardoulakis, S.; Giagloglou, E.; Steinle, S.; Davis, A.; Sleeuwenhoek, A.; Galea, K.S.; Dixon, K.; Crawford, J.O. Indoor Exposure to Selected Air Pollutants in the Home Environment: A Systematic Review. Int. J. Environ. Res. Public Health 2020, 17, 8972. [Google Scholar] [CrossRef] [PubMed]
- Szulczyński, B.; Gębicki, J. Currently Commercially Available Chemical Sensors Employed for Detection of Volatile Organic Compounds in Outdoor and Indoor Air. Environments 2017, 4, 21. [Google Scholar] [CrossRef]
- World Health Organization. WHO Global Air Quality Guidelines: Particulate Matter (PM2.5 and PM10), Ozone, Nitrogen Dioxide, Sulfur Oxide and Carbon Monoxide; World Health Organization: Geneva, Switzerland, 2021. [Google Scholar]
- Sarigiannis, D.A.; Karakitsios, S.P.; Gotti, A.; Liakos, I.L.; Katsoyiannis, A. Exposure to Major Volatile Organic Compounds and Carbonyls in European Indoor Environments and Associated Health Risk. Environ. Int. 2011, 37, 743–765. [Google Scholar] [CrossRef]
- Tang, R.; Sahu, R.; Su, Y.; Milsom, A.; Mishra, A.; Berkemeier, T.; Pfrang, C. Impact of Cooking Methods on Indoor Air Quality: A Comparative Study of Particulate Matter (PM) and Volatile Organic Compound (VOC) Emissions. Indoor Air 2024, 2024, 6355613. [Google Scholar] [CrossRef]
- Han, D.; Wang, Z.; Cheng, J.; Wang, Q.; Chen, X.; Wang, H. Volatile Organic Compounds (VOCs) during Non-Haze and Haze Days in Shanghai: Characterization and Secondary Organic Aerosol (SOA) Formation. Environ. Sci. Pollut. Res. 2017, 24, 18619–18629. [Google Scholar] [CrossRef] [PubMed]
- Li, Y.; He, L.; Xie, D.; Zhao, A.; Wang, L.; Kreisberg, N.M.; Jayne, J.; Liu, Y. Strong Temperature Influence and Indiscernible Ventilation Effect on Dynamics of Some Semivolatile Organic Compounds in the Indoor Air of an Office. Environ. Int. 2022, 165, 107305. [Google Scholar] [CrossRef]
- World Health Organization. WHO Guidelines for Indoor Air Quality: Selected Pollutants; World Health Organization: Copenhagen, Denmark, 2010. [Google Scholar]
- Vardoulakis, S.; Fisher, B.E.A.; Pericleous, K.; Gonzalez-Flesca, N. Modelling Air Quality in Street Canyons: A Review. Atmos. Environ. 2003, 37, 155–182. [Google Scholar] [CrossRef]
- Stranger, M.; Potgieter-Vermaak, S.S.; Van Grieken, R. Comparative Overview of Indoor Air Quality in Antwerp, Belgium. Environ. Int. 2007, 33, 789–797. [Google Scholar] [CrossRef]
- Urban Air, Indoor Environment and Human Exposure Environment and Quality of Life Harmonisation of Indoor Material Emissions Labelling Systems in the EU Inventory of Existing Schemes; European Commission: Brussels, Belgium, 2005.
- Committee on the Medical Effects of Air Pollutants Guidance on the Effects on Health of Indoor Air Pollutants; UK Department of Health: London, UK, 2004.
- De, E.; Fernandes, O.; Jantunen, M.; Carrer, P.; Seppanen, O. ENVIE Co-Ordination Action on Indoor Air Quality and Health Effects WP4 Final Report Policies on Indoor Air Quality: Assessment and Needs. 2013. Available online: https://www.researchgate.net/publication/323018517_ENVIE_Co-ordination_Action_on_Indoor_Air_Quality_and_Health_Effects_WP4_Final_Report_Policies_on_Indoor_Air_Quality_Assessment_and_Needs?channel=doi&linkId=5a7c923faca272669a2f01b6&showFulltext=true#fullTextFileContent (accessed on 20 April 2025).
- Liu, N.; Bu, Z.; Liu, W.; Kan, H.; Zhao, Z.; Deng, F.; Huang, C.; Zhao, B.; Zeng, X.; Sun, Y.; et al. Indoor Exposure Levels and Risk Assessment of Volatile Organic Compounds in Residences, Schools, and Offices in China from 2000 to 2021: A Systematic Review. Indoor Air 2022, 32, e13091. [Google Scholar] [CrossRef]
- GB/T 18883–2002; Indoor Air Quality Standard, Administration of Quality Supervision Inspection and Quarantine. China Standards Press: Beijing, China, 2002. (In Chinese)
- GB/T 18883–2020; Indoor Air Quality Standard (Exposure Draft), Administration of Quality Supervision Inspection and Quarantine. China Standards Press: Beijing, China, 2020. (In Chinese)
- Pei, J.; Qu, M.; Sun, L.; Wang, X.; Yin, Y. The Relationship between Indoor Air Quality (IAQ) and Perceived Air Quality (PAQ)—A Review and Case Analysis of Chinese Residential Environment. Energy Built Environ. 2024, 5, 230–243. [Google Scholar] [CrossRef]
- European Union. Communication from the European Commission on the European Environment and Health Strategy. 2003. Available online: https://eur-lex.europa.eu/legal-content/EN/TXT/?uri=legissum:l28133 (accessed on 20 April 2025).
- European Union. Communication from the European Commission on the European Environment and Health Action Plan 2004–2010. 2004. Available online: https://eur-lex.europa.eu/EN/legal-content/summary/environment-and-health-action-plan-2004-2010.html?fromSummary=29 (accessed on 20 April 2025).
- European Union. Communication from the European Commission on a Health and Consumer Protection Strategy. Proposal for a Decision of the European Parliament and of the Council Establishing a Programme of Community Action in the Field of Health and Consumer Protection 2007–2013. 2005. Available online: https://eur-lex.europa.eu/legal-content/EN/TXT/?uri=CELEX:52005PC0115 (accessed on 20 April 2025).
- Kotzias, D. Built Environment and Indoor Air Quality: The Case of Volatile Organic Compounds. AIMS Environ. Sci. 2021, 8, 135–147. [Google Scholar] [CrossRef]
- Matsunaga, S.N.; Kato, S.; Yoshino, A.; Greenberg, J.P.; Kajii, Y.; Guenther, A.B. Gas-Aerosol Partitioning of Semi Volatile Carbonyls in Polluted Atmosphere in Hachioji, Tokyo. Geophys. Res. Lett. 2005, 32, 1–4. [Google Scholar] [CrossRef]
- Rao, G.; Vejerano, E.P. Partitioning of Volatile Organic Compounds to Aerosols: A Review. Chemosphere 2018, 212, 282–296. [Google Scholar] [CrossRef]
- Epping, R.; Koch, M. On-Site Detection of Volatile Organic Compounds (VOCs). Molecules 2023, 28, 1598. [Google Scholar] [CrossRef]
- Schneider, P.; Gebefugi, I.; Richter, K.; Wolke, G.; Schnelle, J.; Wichmann, H.-E.; Heinrich, J.; INGA Study Group. Indoor and Outdoor BTX Levels in German Cities. Sci. Total Environ. 2001, 267, 41–51. [Google Scholar] [CrossRef]
- Silva, L.I.B.; Rocha-Santos, T.A.P.; Duarte, A.C. Remote Optical Fibre Microsensor for Monitoring BTEX in Confined Industrial Atmospheres. Talanta 2009, 78, 548–552. [Google Scholar] [CrossRef] [PubMed]
- Phuc, N.H.; Kim Oanh, N.T. Determining Factors for Levels of Volatile Organic Compounds Measured in Different Microenvironments of a Heavy Traffic Urban Area. Sci. Total Environ. 2018, 627, 290–303. [Google Scholar] [CrossRef]
- Wolkoff, P. Indoor Air Chemistry: Terpene Reaction Products and Airway Effects. Int. J. Hyg. Environ. Health 2020, 225, 113439. [Google Scholar] [CrossRef]
- Abbatt, J.P.D.; Wang, C. The Atmospheric Chemistry of Indoor Environments. Environ. Sci. Process. Impacts 2020, 22, 25–48. [Google Scholar]
- Lelieveld, J.; Butler, T.M.; Crowley, J.N.; Dillon, T.J.; Fischer, H.; Ganzeveld, L.; Harder, H.; Lawrence, M.G.; Martinez, M.; Taraborrelli, D.; et al. Atmospheric Oxidation Capacity Sustained by a Tropical Forest. Nature 2008, 452, 737–740. [Google Scholar] [CrossRef]
- Lu, H.; Lyu, X.; Cheng, H.; Ling, Z.; Guo, H. Overview on the Spatial-Temporal Characteristics of the Ozone Formation Regime in China. Environ. Sci. Process. Impacts 2019, 21, 916–929. [Google Scholar] [CrossRef] [PubMed]
- Wu, K.; Yang, X.; Chen, D.; Gu, S.; Lu, Y.; Jiang, Q.; Wang, K.; Ou, Y.; Qian, Y.; Shao, P.; et al. Estimation of Biogenic VOC Emissions and Their Corresponding Impact on Ozone and Secondary Organic Aerosol Formation in China. Atmos. Res. 2020, 231, 104656. [Google Scholar] [CrossRef]
- Karl, T.; Guenther, A.; Yokelson, R.J.; Greenberg, J.; Potosnak, M.; Blake, D.R.; Artaxo, P. The Tropical Forest and Fire Emissions Experiment: Emission, Chemistry, and Transport of Biogenic Volatile Organic Compounds in the Lower Atmosphere over Amazonia. J. Geophys. Res. Atmos. 2007, 112, D18302. [Google Scholar] [CrossRef]
- Tang, X.; Misztal, P.K.; Nazaroff, W.W.; Goldstein, A.H. Volatile Organic Compound Emissions from Humans Indoors. Environ. Sci. Technol. 2016, 50, 12686–12694. [Google Scholar] [CrossRef]
- Duan, C.; Liao, H.; Wang, K.; Ren, Y. The Research Hotspots and Trends of Volatile Organic Compound Emissions from Anthropogenic and Natural Sources: A Systematic Quantitative Review. Environ. Res. 2023, 216, 114386. [Google Scholar] [CrossRef] [PubMed]
- Cai, M.; An, C.; Guy, C. A Scientometric Analysis and Review of Biogenic Volatile Organic Compound Emissions: Research Hotspots, New Frontiers, and Environmental Implications. Renew. Sustain. Energy Rev. 2021, 149, 111317. [Google Scholar] [CrossRef]
- Akherati, A.; He, Y.; Coggon, M.M.; Koss, A.R.; Hodshire, A.L.; Sekimoto, K.; Warneke, C.; De Gouw, J.; Yee, L.; Seinfeld, J.H.; et al. Oxygenated Aromatic Compounds Are Important Precursors of Secondary Organic Aerosol in Biomass-Burning Emissions. Environ. Sci. Technol. 2020, 54, 8568–8579. [Google Scholar] [CrossRef]
- Gao, M.; Teng, W.; Du, Z.; Nie, L.; An, X.; Liu, W.; Sun, X.; Shen, Z.; Shi, A. Source Profiles and Emission Factors of VOCs from Solvent-Based Architectural Coatings and Their Contributions to Ozone and Secondary Organic Aerosol Formation in China. Chemosphere 2021, 275, 129815. [Google Scholar] [CrossRef]
- Zhan, J.; Feng, Z.; Liu, P.; He, X.; He, Z.; Chen, T.; Wang, Y.; He, H.; Mu, Y.; Liu, Y. Ozone and SOA Formation Potential Based on Photochemical Loss of VOCs during the Beijing Summer. Environ. Pollut. 2021, 285, 117444. [Google Scholar] [CrossRef]
- National Research Council. Rethinking the Ozone Problem in Urban and Regional Air Pollution; National Academies Press: Cambridge, MA, USA, 1991.
- Mohd Hanif, N.; Limi Hawari, N.S.S.; Othman, M.; Abd Hamid, H.H.; Ahamad, F.; Uning, R.; Ooi, M.C.G.; Wahab, M.I.A.; Sahani, M.; Latif, M.T. Ambient Volatile Organic Compounds in Tropical Environments: Potential Sources, Composition and Impacts—A Review. Chemosphere 2021, 285, 131355. [Google Scholar] [CrossRef]
- Montzka, S.A.; Atlas, E.; Reimann, S.; Bernath, P.; Blumenstock, T.; Butler, J.H.; Engel, A.; Butz, A.; Krüger, K.; Connor, B.; et al. Ozone-Depleting Substances (ODSs) and Related Chemicals Coordinating Lead Authors: Contributors: Lead Authors: Coauthors: OzOne-Depleting SubStanceS (ODSs) and Related Chemicals Contents. 2010. Available online: https://csl.noaa.gov/assessments/ozone/2010/chapters/chapter1.pdf (accessed on 20 April 2025).
- Li, Q.; Su, G.; Li, C.; Liu, P.; Zhao, X.; Zhang, C.; Sun, X.; Mu, Y.; Wu, M.; Wang, Q.; et al. An Investigation into the Role of VOCs in SOA and Ozone Production in Beijing, China. Sci. Total Environ. 2020, 720, 137536. [Google Scholar] [CrossRef] [PubMed]
- Deng, Y.; Li, J.; Li, Y.; Wu, R.; Xie, S. Characteristics of Volatile Organic Compounds, NO2, and Effects on Ozone Formation at a Site with High Ozone Level in Chengdu. J. Environ. Sci. 2019, 75, 334–345. [Google Scholar] [CrossRef]
- Vera, T.; Villanueva, F.; Wimmerová, L.; Tolis, E.I. An Overview of Methodologies for the Determination of Volatile Organic Compounds in Indoor Air. Appl. Spectrosc. Rev. 2022, 57, 625–674. [Google Scholar] [CrossRef]
- ISO 16000-1:2004; Indoor Air—Part 1: General Aspects of Sampling Strategy. ISO: Geneva, Switzerland, 2004.
- ISO 16000-2:2004; Indoor Air—Part 2: Sampling Strategy for Formaldehyde. ISO: Geneva, Switzerland, 2004.
- ISO 16000-3:2022; Indoor Air—Part 3: Determination of Formaldehyde and Other Carbonyl Compounds in Indoor Air and Test Chamber Air—Active Sampling Method. ISO: Geneva, Switzerland, 2022.
- ISO 16000-4:2011; Indoor Air—Part 4: Determination of Formaldehyde—Diffusive Sampling Method. ISO: Geneva, Switzerland, 2011.
- ISO 16000-5:2007; Indoor Air—Part 5: Sampling Strategy for Volatile Organic Compounds. ISO: Geneva, Switzerland, 2007.
- ISO 16000-6:2021; Indoor Air—Part 6: Determination of Organic Compounds (VVOC, VOC, SVOC) in Indoor and Test Chamber Air by Active Sampling on Sorbent Tubes, Thermal Desorption and Gas Chromatography Using MS or MS FID. ISO: Geneva, Switzerland, 2021.
- ISO 16000-9:2024; Indoor Air—Part 9: Determination of the Emission of Volatile Organic Compounds from Building Products and Furnishing—Emission Test Chamber Method. ISO: Geneva, Switzerland, 2024.
- ISO 16000-11:2024; Indoor Air—Part 11: Determination of the Emission of Volatile Organic Compounds from Building Products and Fur-Nishing—Sampling Storage of Samples and Preparation of Test Specimens. ISO: Geneva, Switzerland, 2024.
- ISO 16000-29:2014; Indoor Air—Part 29: Test Methods for VOC Detectors. ISO: Geneva, Switzerland, 2014.
- ISO 16000-32:2014; Indoor Air—Part 32: Investigation Buildings for the Occurrence of Pollutants. ISO: Geneva, Switzerland, 2014.
- ISO 16000-33:2024; Indoor Air—Part 33: Determination of Phthalates with Gas Chromatography/Mass Spectrometry (GC/MS). ISO: Geneva, Switzerland, 2024.
- ISO 16000-41:2023; Indoor Air—Part 41: Assessment and Classification. ISO: Geneva, Switzerland, 2023.
- ISO 16017-1:2000; Indoor, Ambient and Work-Place Air—Sampling and Analysis of Volatile Organic Compounds by Sorbent Tube/Thermal Desorption/Capillary Gas Chromatography—Part 1: Pumped Sampling. ISO: Geneva, Switzerland, 2000.
- ISO 16017-2:2003; Indoor, Ambient and Work-Place Air—Sampling and Analysis of Volatile Organic Compounds by Sorbent Tube/Thermal Desorption/Capillary Gas Chromatography—Part 2: Diffusive Sampling. ISO: Geneva, Switzerland, 2003.
- Morris, M.A.; Pagonis, D.; Day, D.A.; De Gouw, J.A.; Ziemann, P.J.; Jimenez, J.L. Absorption of Volatile Organic Compounds (VOCs) by Polymer Tubing: Implications for Indoor Air and Use as a Simple Gas-Phase Volatility Separation Technique. Atmos. Meas. Tech. 2024, 17, 1545–1559. [Google Scholar] [CrossRef]
- Krechmer, J.E.; Pagonis, D.; Ziemann, P.J.; Jimenez, J.L. Quantification of Gas-Wall Partitioning in Teflon Environmental Chambers Using Rapid Bursts of Low-Volatility Oxidized Species Generated in Situ. Environ. Sci. Technol. 2016, 50, 5757–5765. [Google Scholar] [CrossRef] [PubMed]
- Pagonis, D.; Krechmer, J.E.; De Gouw, J.; Jimenez, J.L.; Ziemann, P.J. Effects of Gas-Wall Partitioning in Teflon Tubing and Instrumentation on Time-Resolved Measurements of Gas-Phase Organic Compounds. Atmos. Meas. Tech. 2017, 10, 4687–4696. [Google Scholar] [CrossRef]
- Woolfenden, E. Sorbent-Based Sampling Methods for Volatile and Semi-Volatile Organic Compounds in Air. Part 1: Sorbent-Based Air Monitoring Options. J. Chromatogr. A 2010, 1217, 2674–2684. [Google Scholar] [CrossRef]
- Orecchio, S.; Fiore, M.; Barreca, S.; Vara, G. Volatile Profiles of Emissions from Different Activities Analyzed Using Canister Samplers and Gas Chromatography-Mass Spectrometry (GC/MS) Analysis: A Case Study. Int. J. Environ. Res. Public Health 2017, 14, 195. [Google Scholar] [CrossRef]
- Chen, J.; Scircle, A.; Black, O.; Cizdziel, J.V.; Watson, N.; Wevill, D.; Zhou, Y. On the Use of Multicopters for Sampling and Analysis of Volatile Organic Compounds in the Air by Adsorption/Thermal Desorption GC-MS. Air Qual. Atmos. Health 2018, 11, 835–842. [Google Scholar] [CrossRef]
- Górecki, T.; Namieśnik, J. Passive Sampling. TrAC Trends Anal. Chem. 2002, 21, 276–291. [Google Scholar] [CrossRef]
- Walgraeve, C.; Demeestere, K.; Dewulf, J.; Van Huffel, K.; Van Langenhove, H. Diffusive Sampling of 25 Volatile Organic Compounds in Indoor Air: Uptake Rate Determination and Application in Flemish Homes for the Elderly. Atmos. Environ. 2011, 45, 5828–5836. [Google Scholar] [CrossRef]
- Vallecillos, L.; Espallargas, E.; Allo, R.; Marcé, R.M.; Borrull, F. Passive Sampling of Volatile Organic Compounds in Industrial Atmospheres: Uptake Rate Determinations and Application. Sci. Total Environ. 2019, 666, 235–244. [Google Scholar] [CrossRef]
- Jia, C.; Fu, X. Diffusive Uptake Rates of Volatile Organic Compounds on Standard Atd Tubes for Environmental and Workplace Applications. Environments 2017, 4, 87. [Google Scholar] [CrossRef]
- Oury, B.; Lhuillier, F.; Protois, J.C.; Moréle, Y. Behavior of the GABIE, 3M 3500, PerkinElmer Tenax TA, and RADIELLO 145 Diffusive Samplers Exposed over a Long Time to a Low Concentration of VOCs. J. Occup. Environ. Hyg. 2006, 3, 547–557. [Google Scholar] [CrossRef]
- Brown, R.H. Review Monitoring the Ambient Environment with Diffusive Samplers: Theory and Practical Considerations. J. Environ. Monit. 2000, 2, 1–9. [Google Scholar] [CrossRef] [PubMed]
- Seethapathy, S.; Górecki, T.; Li, X. Passive Sampling in Environmental Analysis. J. Chromatogr. A 2008, 1184, 234–253. [Google Scholar] [CrossRef]
- Zabiegała, B.; Sǎrbu, C.; Urbanowicz, M.; Namieśnik, J. A Comparative Study of the Performance of Passive Samplers. J. Air Waste Manage. Assoc. 2011, 61, 260–268. [Google Scholar] [CrossRef]
- Settimo, G.; Indinnimeo, L.; Inglessis, M.; De Felice, M.; Morlino, R.; Di Coste, A.; Fratianni, A.; Avino, P. Indoor Air Quality Levels in Schools: Role of Student Activities and No Activities. Int. J. Environ. Res. Public Health 2020, 17, 6695. [Google Scholar] [CrossRef]
- Nasreddine, R.; Person, V.; Serra, C.A.; Le Calvé, S. Development of a Novel Portable Miniaturized GC for near Real-Time Low Level Detection of BTEX. Sens. Actuators B Chem. 2016, 224, 159–169. [Google Scholar] [CrossRef]
- Wales, D.J.; Parker, R.M.; Quainoo, P.; Cooper, P.A.; Gates, J.C.; Grossel, M.C.; Smith, P.G.R. An Integrated Optical Bragg Grating Refractometer for Volatile Organic Compound Detection. Sens. Actuators B Chem. 2016, 232, 595–604. [Google Scholar] [CrossRef]
- Viespe, C.; Grigoriu, C. Surface Acoustic Wave Sensors with Carbon Nanotubes and SiO2/Si Nanoparticles Based Nanocomposites for VOC Detection. Sens. Actuators B Chem. 2010, 147, 43–47. [Google Scholar] [CrossRef]
- Wang, F.; Yang, Y.; Swager, T.M. Molecular Recognition for High Selectivity in Carbon Nanotube/Polythiophene Chemiresistors. Angew. Chem. 2008, 120, 8522–8524. [Google Scholar] [CrossRef]
- Zito, C.A.; Perfecto, T.M.; Volanti, D.P. Impact of Reduced Graphene Oxide on the Ethanol Sensing Performance of Hollow SnO2 Nanoparticles under Humid Atmosphere. Sens. Actuators B Chem. 2017, 244, 466–474. [Google Scholar] [CrossRef]
- Khot, L.R.; Panigrahi, S.; Lin, D. Development and Evaluation of Piezoelectric-Polymer Thin Film Sensors for Low Concentration Detection of Volatile Organic Compounds Related to Food Safety Applications. Sens. Actuators B Chem. 2011, 153, 1–10. [Google Scholar] [CrossRef]
- Si, P.; Mortensen, J.; Komolov, A.; Denborg, J.; Møller, P.J. Polymer Coated Quartz Crystal Microbalance Sensors for Detection of Volatile Organic Compounds in Gas Mixtures. Anal. Chim. Acta 2007, 597, 223–230. [Google Scholar] [CrossRef] [PubMed]
- Bur, C.; Bastuck, M.; Puglisi, D.; Schütze, A.; Lloyd Spetz, A.; Andersson, M. Discrimination and Quantification of Volatile Organic Compounds in the Ppb-Range with Gas Sensitive SiC-FETs Using Multivariate Statistics. Sens. Actuators B Chem. 2015, 214, 225–233. [Google Scholar] [CrossRef]
- Andersson, M.; Bastuck, M.; Huotari, J.; Spetz, A.L.; Lappalainen, J.; Schütze, A.; Puglisi, D. SiC-FET Sensors for Selective and Quantitative Detection of VOCs Down to Ppb Level. Procedia Eng. 2016, 168, 216–220. [Google Scholar] [CrossRef]
- Tan, X.; Zhang, H.; Li, J.; Wan, H.; Guo, Q.; Zhu, H.; Liu, H.; Yi, F. Non-Dispersive Infrared Multi-Gas Sensing via Nanoantenna Integrated Narrowband Detectors. Nat. Commun. 2020, 11, 5245. [Google Scholar] [CrossRef]
- Armenta, S.; De La Guardia, M.; Esteve-Turrillas, F.A. Environmental Applications (Air). In Solid-Phase Extraction; Elsevier: Amsterdam, The Netherlands, 2019; pp. 647–671. ISBN 9780128169063. [Google Scholar]
- United States Environmental Protection Agency. Method TO-2 Revision 1.0 April, 1984 Method for the Determination of Volatile Organic Compounds in Ambient Air by Carbon Molecular Sieve Adsorption and Gas Chromatography/Mass Spectrometry (GC/MS). 1984. Available online: https://www3.epa.gov/ttnamti1/files/ambient/airtox/to-2.pdf (accessed on 20 April 2025).
- United States Environmental Protection Agency. Compendium of Methods for the Determination of Toxic Organic Compounds in Ambient Air Second Edition Compendium Method TO-15 Determination of Volatile Organic Compounds (VOCs) in Air Collected in Specially-Prepared Canisters and Analyzed by Gas Chromatography/Mass Spectrometry (GC/MS). 1999. Available online: https://www.epa.gov/sites/default/files/2019-11/documents/to-15r.pdf (accessed on 20 April 2025).
- United States Environmental Protection Agency. Compendium of Methods for the Determination of Toxic Organic Compounds in Ambient Air Second Edition Compendium Method TO-17 Determination of Volatile Organic Compounds in Ambient Air Using Active Sampling Onto Sorbent Tubes. 1999. Available online: https://www.epa.gov/sites/default/files/2019-11/documents/to-17r.pdf (accessed on 20 April 2025).
- Even, M.; Juritsch, E.; Richter, M. Measurement of Very Volatile Organic Compounds (VVOCs) in Indoor Air by Sorbent-Based Active Sampling: Identifying the Gaps towards Standardisation. TrAC Trends Anal. Chem. 2021, 140, 116265. [Google Scholar] [CrossRef]
- Dettmer, K.; Knobloch, T.; Engewald, W. Stability of Reactive Low Boiling Hydrocarbons on Carbon Based Adsorbents Typically Used for Adsorptive Enrichment and Thermal Desorption. Fresenius. J. Anal. Chem. 2000, 366, 70–78. [Google Scholar] [CrossRef]
- Even, M.; Juritsch, E.; Richter, M. Selection of Gas Standards, Gas Chromatography Column and Adsorbents for the Measurement of Very Volatile Organic Compounds (C1–C6) in Indoor Air. Anal. Chim. Acta 2023, 1238, 340561. [Google Scholar] [CrossRef] [PubMed]
- Richter, M.; Juritsch, E.; Jann, O. Determination of Recovery Rates of Adsorbents for Sampling Very Volatile Organic Compounds (C1[Sbnd]C6) in Dry and Humid Air in the Sub-Ppb Range by Use of Thermal Desorption Gas Chromatography-Mass Spectrometry. J. Chromatogr. A 2020, 1626, 461389. [Google Scholar] [CrossRef]
- Matković, K.; Jurič, A.; Jakovljević, I.; Kazensky, L.; Milić, M.; Kašuba, V.; Davila, S.; Pehnec, G.; Brčić Karačonji, I.; Cvitković, A.; et al. Evaluating Air Pollution and BTEX Exposure Effects on DNA Damage: A Human Biomonitoring Study in Zagreb, Croatia. Atmos. Environ. 2025, 343, 121004. [Google Scholar] [CrossRef]
- Varona-Torres, E.; Carlton, D.D.; Payne, B.; Hildenbrand, Z.L.; Schug, K.A. The Characterization of BTEX in Variable Soil Compositions Near Unconventional Oil and Gas Development. In Advances in Chemical Pollution, Environmental Management and Protection; Elsevier B.V.: Amsterdam, The Netherlands, 2017; Volume 1, pp. 321–351. [Google Scholar]
- Asejeje, G.I.; Ipeaiyeda, A.R.; Onianwa, P.C. Health Risk Assessment of Ubeji Creek Residents’ Exposure to BTEX from Consumption of Locally Sourced Foods. Environ. Pollut. Bioavailab. 2021, 33, 449–459. [Google Scholar] [CrossRef]
- Ridgway, K.; Lalljie, S.P.D.; Smith, R.M. Use of In-Tube Sorptive Extraction Techniques for Determination of Benzene, Toluene, Ethylbenzene and Xylenes in Soft Drinks. J. Chromatogr. A 2007, 1174, 20–26. [Google Scholar] [CrossRef]
- Rahimpoor, R.; Firoozichahak, A.; Nematollahi, D.; Alizadeh, S.; Alizadeh, P.M.; Langari, A.A.A. Bio-Monitoring of Non-Metabolized BTEX Compounds in Urine by Dynamic Headspace-Needle Trap Device Packed with 3D Ni/Co-BTC Bimetallic Metal-Organic Framework as an Efficient Absorbent. Microchem. J. 2021, 166, 106229. [Google Scholar] [CrossRef]
- Lee, J.H.; Hwang, S.M.; Lee, D.W.; Heo, G.S. Determination of Volatile Organic Compounds (VOCs) Using Tedlar Bag/Solid-Phase Microextraction/Gas Chromatography/Mass Spectrometry (SPME/GC/MS) in Ambient and Workplace Air. Bull. Korean Chem. Soc. 2002, 23, 488–496. [Google Scholar] [CrossRef]
- Chiba, M.; Oizumi, S.; Onuki, A.; Saito, I.; Tanaka, R.; Yamanouchi, T.; Yokoyama, Y.; Wakayama, T.; Ohno, H.; Tahara, M.; et al. Validation Study for Establishing a Standard Test Method for Volatile Organic Compounds in Indoor Air in Japan using Solvent Extraction. BPB Rep. 2024, 7, 39–43. [Google Scholar] [CrossRef]
- Hippelein, M. Analysing Selected VVOCs in Indoor Air with Solid Phase Microextraction (SPME): A Case Study. Chemosphere 2006, 65, 271–277. [Google Scholar] [CrossRef]
- Horvat, T.; Jakovljević, I.; Smoljo, I.; Pehnec, G.; Gajski, G. Re-Analysis of Volatile Organic Compounds in Air Samples Using Thermal Desorption Units. In Proceedings of the 20 Ružička Days: Today Science–Tomorrow Industry, Vukovar, Croatia, 18–20 September 2024; p. 117. [Google Scholar]
- Sekar, A.; Varghese, G.K.; Ravi Varma, M.K. Analysis of Benzene Air Quality Standards, Monitoring Methods and Concentrations in Indoor and Outdoor Environment. Heliyon 2019, 5, e02918. [Google Scholar]
- Batterman, S.; Metts, T.; Kalliokoski, P.; Barnett, E. Low-Flow Active and Passive Sampling of VOCs Using Thermal Desorption Tubes: Theory and Application at an Offset Printing Facility. J. Environ. Monit. 2002, 4, 361–370. [Google Scholar] [CrossRef] [PubMed]
- Farhadi, K.; Mamaghanian, M.; Maleki, R. A Sol-Gel Based Solid Phase Microextraction Fiber for Analysis of Aromatic Hydrocarbons. J. Hazard. Mater. 2008, 152, 677–682. [Google Scholar] [CrossRef] [PubMed]
- Baimatova, N.; Koziel, J.A.; Kenessov, B. Quantification of Benzene, Toluene, Ethylbenzene and o-Xylene in Internal Combustion Engine Exhaust with Time-Weighted Average Solid Phase Microextraction and Gas Chromatography Mass Spectrometry. Anal. Chim. Acta 2015, 873, 38–50. [Google Scholar] [CrossRef]
- Gallego-Díez, M.L.; Correa-Ochoa, M.A.; Saldarriaga-Molina, J.C. Validation of a Methodology to Determine Benzene, Toluene, Ethylbenzene, and Xylenes Concentration Present in the Air and Adsorbed in Activated Charcoal Passive Samplers by GC/FID Chromatography. Rev. Fac. Ingenieria. Univ. Antioquia 2016, 2016, 138–149. [Google Scholar] [CrossRef]
- Bergomi, A.; Mangia, C.; Fermo, P.; Genga, A.; Comite, V.; Guadagnini, S.; Ielpo, P. Outdoor Trends and Indoor Investigations of Volatile Organic Compounds in Two High Schools of Southern Italy. Air Qual. Atmos. Health 2024, 17, 1325–1340. [Google Scholar] [CrossRef]
- Baysal, E.; Uzun, U.C.; Ertaş, F.N.; Goksel, O.; Pelit, L. Development of a New Needle Trap-Based Method for the Determination of Some Volatile Organic Compounds in the Indoor Environment. Chemosphere 2021, 277, 130251. [Google Scholar] [CrossRef]
- Kozielska, B.; Kaleta, D. Assessment of Indoor Benzene and Its Alkyl Derivatives Concentrations in Offices Belonging to University of Technology (Poland). Atmosphere 2021, 12, 51. [Google Scholar] [CrossRef]
- Vu, D.C.; Ho, T.L.; Vo, P.H.; Carlo, G.; McElroy, J.A.; Davis, A.N.; Nagel, S.C.; Lin, C.H. Determination of Volatile Organic Compounds in Child Care Centers by Thermal Desorption Gas Chromatography-Mass Spectrometry. Anal. Methods 2018, 10, 730–742. [Google Scholar] [CrossRef]
- Gonçalves, A.D.; Martins, T.G.; Cassella, R.J. Passive Sampling of Toluene (and Benzene) in Indoor Air Using a Semipermeable Membrane Device. Ecotoxicol. Environ. Saf. 2021, 208, 111707. [Google Scholar] [CrossRef]
- Campos-Candel, A.; Llobat-Estellés, M.; Mauri-Aucejo, A. Comparative Evaluation of Liquid Chromatography versus Gas Chromatography Using a β-Cyclodextrin Stationary Phase for the Determination of BTEX in Occupational Environments. Talanta 2009, 78, 1286–1292. [Google Scholar] [CrossRef]
- Cabarcos, P.; Herbello-Hermelo, P.; Álvarez-Freire, I.; Moreda-Piñeiro, A.; Tabernero, M.J.; Bermejo, A.M.; Bermejo-Barrera, P. Solid Phase Microextraction and Gas Chromatography–Mass Spectrometry Methods for Residual Solvent Assessment in Seized Cocaine and Heroin. Anal. Bioanal. Chem. 2016, 408, 6393–6402. [Google Scholar] [CrossRef]
- Liaud, C.; Nguyen, N.T.; Nasreddine, R.; Le Calvé, S. Experimental Performances Study of a Transportable GC-PID and Two Thermo-Desorption Based Methods Coupled to FID and MS Detection to Assess BTEX Exposure at Sub-Ppb Level in Air. Talanta 2014, 127, 33–42. [Google Scholar] [CrossRef] [PubMed]
- Veenaas, C.; Ripszam, M.; Haglund, P. Analysis of Volatile Organic Compounds in Indoor Environments Using Thermal Desorption with Comprehensive Two-Dimensional Gas Chromatography and High-Resolution Time-of-Flight Mass Spectrometry. J. Sep. Sci. 2020, 43, 1489–1498. [Google Scholar] [CrossRef]
- United States Environmental Protection Agency. Initial List of Hazardous Air Pollutants with Modifications. Available online: https://www.epa.gov/haps/initial-list-hazardous-air-pollutants-modifications (accessed on 20 April 2025).
- Elliott, E.G.; Trinh, P.; Ma, X.; Leaderer, B.P.; Ward, M.H.; Deziel, N.C. Unconventional Oil and Gas Development and Risk of Childhood Leukemia: Assessing the Evidence. Sci. Total Environ. 2017, 576, 138–147. [Google Scholar] [CrossRef] [PubMed]
- Lamm, S.H.; Engel, A.; Joshi, K.P.; Byrd, D.M.; Chen, R. Chronic Myelogenous Leukemia and Benzene Exposure: A Systematic Review and Meta-Analysis of the Case-Control Literature. Chem. Biol. Interact. 2009, 182, 93–97. [Google Scholar] [CrossRef]
- Caron-Beaudoin, É.; Valter, N.; Chevrier, J.; Ayotte, P.; Frohlich, K.; Verner, M.A. Gestational Exposure to Volatile Organic Compounds (VOCs) in Northeastern British Columbia, Canada: A Pilot Study. Environ. Int. 2018, 110, 131–138. [Google Scholar] [CrossRef] [PubMed]
- Allen, J.G.; MacNaughton, P.; Satish, U.; Santanam, S.; Vallarino, J.; Spengler, J.D. Associations of Cognitive Function Scores with Carbon Dioxide, Ventilation, and Volatile Organic Compound Exposures in Office Workers: A Controlled Exposure Study of Green and Conventional Office Environments. Environ. Health Perspect. 2016, 124, 805–812. [Google Scholar] [CrossRef]
- Aguilera, I.; Pedersen, M.; Garcia-Esteban, R.; Ballester, F.; Basterrechea, M.; Esplugues, A.; Fernández-Somoano, A.; Lertxundi, A.; Tardón, A.; Sunyer, J. Early-Life Exposure to Outdoor Air Pollution and Respiratory Health, Ear Infections, and Eczema in Infants from the INMA Study. Environ. Health Perspect. 2013, 121, 387–392. [Google Scholar] [CrossRef]
- Talibov, M.; Sormunen, J.; Hansen, J.; Kjaerheim, K.; Martinsen, J.I.; Sparen, P.; Tryggvadottir, L.; Weiderpass, E.; Pukkala, E. Benzene Exposure at Workplace and Risk of Colorectal Cancer in Four Nordic Countries. Cancer Epidemiol. 2018, 55, 156–161. [Google Scholar] [CrossRef]
- Lamplugh, A.; Harries, M.; Xiang, F.; Trinh, J.; Hecobian, A.; Montoya, L.D. Occupational Exposure to Volatile Organic Compounds and Health Risks in Colorado Nail Salons. Environ. Pollut. 2019, 249, 518–526. [Google Scholar] [CrossRef]
- Ruenz, M.; Bakuradze, T.; Eisenbrand, G.; Richling, E. Monitoring Urinary Mercapturic Acids as Biomarkers of Human Dietary Exposure to Acrylamide in Combination with Acrylamide Uptake Assessment Based on Duplicate Diets. Arch. Toxicol. 2016, 90, 873–881. [Google Scholar] [CrossRef] [PubMed]
- Creta, M.; Poels, K.; Thoelen, L.; Vranckx, K.; Collaerts, P.; Jansen, F.; Vangeel, M.; Godderis, L.; Duca, R.C.; Vanoirbeek, J.A.J. A Method to Quantitatively Assess Dermal Exposure to Volatile Organic Compounds. Ann. Work Expo. Health 2017, 61, 975–985. [Google Scholar] [CrossRef] [PubMed]
- Maung, T.Z.; Bishop, J.E.; Holt, E.; Turner, A.M.; Pfrang, C. Indoor Air Pollution and the Health of Vulnerable Groups: A Systematic Review Focused on Particulate Matter (PM), Volatile Organic Compounds (VOCs) and Their Effects on Children and People with Pre-Existing Lung Disease. Int. J. Environ. Res. Public Health 2022, 19, 8752. [Google Scholar] [CrossRef]
- United States Environmental Protection Agency. Risk Assessment Guidance for Superfund Volume I: Human Health Evaluation Manual (Part F, Supplemental Guidance for Inhalation Risk Assessment); United States Environmental Protection Agency: Washington, DC, USA, 2009.
- Office of Environmental Health Hazard Assessment of California. Appendix A: Hot Spots Unit Risk and Cancer Potency Values; Office of Environmental Health Hazard Assessment of California: Sacramento, CA, USA, 2020.
- Król, S.; Namieśnik, J.; Zabiegała, B. α-Pinene, 3-Carene and d-Limonene in Indoor Air of Polish Apartments: The Impact on Air Quality and Human Exposure. Sci. Total Environ. 2014, 468, 985–995. [Google Scholar] [CrossRef] [PubMed]
- Pio, C.A.; Nunes, T.V.; Castro, L.M.; Lopes, D.A. Volatile and Particulate Organic Compounds in the Ambient Air of a Eucalyptus Forest in Portugal during the FIELDVOC’94 Campaign. Chemosphere-Glob. Change Sci. 2001, 3, 283–293. [Google Scholar] [CrossRef]
- Lun, X.; Lin, Y.; Chai, F.; Fan, C.; Li, H.; Liu, J. Reviews of Emission of Biogenic Volatile Organic Compounds (BVOCs) in Asia. J. Environ. Sci. 2020, 95, 266–277. [Google Scholar] [CrossRef]
- Lachenmeier, D.W. Safety Evaluation of Topical Applications of Ethanol on the Skin and inside the Oral Cavity. J. Occup. Med. Toxicol. 2008, 3, 26. [Google Scholar] [CrossRef]
- Liberski, S.; Kaluzny, B.J.; Kocięcki, J. Methanol-Induced Optic Neuropathy: A Still-Present Problem. Arch. Toxicol. 2022, 96, 431–451. [Google Scholar] [CrossRef]
- Lopachin, R.M.; Gavin, T. Molecular Mechanisms of Aldehyde Toxicity: A Chemical Perspective. Chem. Res. Toxicol. 2014, 27, 1081–1091. [Google Scholar] [CrossRef]
- Alam, M.S.; Crilley, L.R.; Lee, J.D.; Kramer, L.J.; Pfrang, C.; Vázquez-Moreno, M.; Ródenas, M.; Muñoz, A.; Bloss, W.J. Interference from Alkenes in Chemiluminescent NOx Measurements. Atmos. Meas. Tech. 2020, 13, 5977–5991. [Google Scholar] [CrossRef]
- Li, A.J.; Pal, V.K.; Kannan, K. A Review of Environmental Occurrence, Toxicity, Biotransformation and Biomonitoring of Volatile Organic Compounds. Environ. Chem. Ecotoxicol. 2021, 3, 91–116. [Google Scholar]
- Lim, S.K.; Shin, H.S.; Yoon, K.S.; Kwack, S.J.; Um, Y.M.; Hyeon, J.H.; Kwak, H.M.; Kim, J.Y.; Kim, T.Y.; Kim, Y.J.; et al. Risk Assessment of Volatile Organic Compounds Benzene, Toluene, Ethylbenzene, and Xylene (BTEX) in Consumer Products. J. Toxicol. Environ. Health-Part A Curr. Issues 2014, 77, 1502–1521. [Google Scholar] [CrossRef] [PubMed]
- Ye, D.; Klein, M.; Chang, H.H.; Sarnat, J.A.; Mulholland, J.A.; Edgerton, E.S.; Winquist, A.; Tolbert, P.E.; Sarnat, S.E. Estimating Acute Cardiorespiratory Effects of Ambient Volatile Organic Compounds. Epidemiology 2017, 28, 197–206. [Google Scholar] [CrossRef]
- Caumo, S.; Bruns, R.E.; Vasconcellos, P.C. Variation of the Distribution of Atmospheric N-Alkanes Emitted by Different Fuels’ Combustion. Atmosphere 2020, 11, 643. [Google Scholar] [CrossRef]
- ATSDR. Public Health Statement Methylene Chloride. 2000. Available online: https://www.atsdr.cdc.gov/toxprofiles/tp14-c1-b.pdf (accessed on 20 April 2025).
- Southon, B.; Riley, G.; Matatiele, P.; Kgarebe, B. Simultaneous Analysis of Acetone, Methyl Ethyl Ketone (MEK), and Methyl Isobutyl Ketone (MIBK) in Urine by Headspace Gas Chromatography-Flame Ionisation Detection (HS GC-FID). Results Chem. 2020, 2, 100084. [Google Scholar] [CrossRef]
- Cho, K.S.; Lim, Y.R.; Lee, K.; Lee, J.; Lee, J.H.; Lee, I.S. Terpenes from Forests and Human Health. Toxicol. Res. 2017, 33, 97–106. [Google Scholar] [CrossRef]
- Bentayeb, M.; Billionnet, C.; Baiz, N.; Derbez, M.; Kirchner, S.; Annesi-Maesano, I. Higher Prevalence of Breathlessness in Elderly Exposed to Indoor Aldehydes and VOCs in a Representative Sample of French Dwellings. Respir. Med. 2013, 107, 1598–1607. [Google Scholar] [CrossRef] [PubMed]
- Paciência, I.; Cavaleiro Rufo, J.; Silva, D.; Martins, C.; Mendes, F.; Farraia, M.; Delgado, L.; de Oliveira Fernandes, E.; Padrão, P.; Moreira, P.; et al. Exposure to Indoor Endocrine-Disrupting Chemicals and Childhood Asthma and Obesity. Allergy Eur. J. Allergy Clin. Immunol. 2019, 74, 1277–1291. [Google Scholar] [CrossRef]
- Kumar, A.; Singh, B.P.; Punia, M.; Singh, D.; Kumar, K.; Jain, V.K. Determination of Volatile Organic Compounds and Associated Health Risk Assessment in Residential Homes and Hostels within an Academic Institute, New Delhi. Indoor Air 2014, 24, 474–483. [Google Scholar] [CrossRef]
- Cheng, Z.; Li, B.; Yu, W.; Wang, H.; Zhang, T.; Xiong, J.; Bu, Z. Risk Assessment of Inhalation Exposure to VOCs in Dwellings in Chongqing, China. Toxicol. Res. 2018, 7, 59–72. [Google Scholar] [CrossRef]
- Massolo, L.; Rehwagen, M.; Porta, A.; Ronco, A.; Herbarth, O.; Mueller, A. Indoor-Outdoor Distribution and Risk Assessment of Volatile Organic Compounds in the Atmosphere of Industrial and Urban Areas. Environ. Toxicol. 2010, 25, 339–349. [Google Scholar] [CrossRef]
- Guo, H.; Lee, S.C.; Chan, L.Y.; Li, W.M. Risk Assessment of Exposure to Volatile Organic Compounds in Different Indoor Environments. Environ. Res. 2004, 94, 57–66. [Google Scholar] [CrossRef] [PubMed]
- Lin, W.T.; Tsai, R.Y.; Chen, H.L.; Tsay, Y.S.; Lee, C.C. Probabilistic Prediction Models and Influence Factors of Indoor Formaldehyde and VOC Levels in Newly Renovated Houses. Atmosphere 2022, 13, 675. [Google Scholar] [CrossRef]
- Villanueva, F.; Tapia, A.; Amo-Salas, M.; Notario, A.; Cabañas, B.; Martínez, E. Levels and Sources of Volatile Organic Compounds Including Carbonyls in Indoor Air of Homes of Puertollano, the Most Industrialized City in Central Iberian Peninsula. Estimation of Health Risk. Int. J. Hyg. Environ. Health 2015, 218, 522–534. [Google Scholar] [CrossRef]
- Şahin, Ü.A.; Oğur, N.E.; Ayvaz, C.; Dumanoğlu, Y.; Onat, B.; Uzun, B.; Özkaya, F.; Akın, Ö. Volatile Organic Compound Concentrations under Two Different Ventilation Structures and Their Health Risks in the Adhesive Tape Manufacturing Workplace. Air Qual. Atmos. Health 2023, 16, 2177–2191. [Google Scholar] [CrossRef]
- Hu, J.; Li, N.; Lv, Y.; Liu, J.; Xie, J.; Zhang, H. Investigation on Indoor Air Pollution and Childhood Allergies in Households in Six Chinese Cities by Subjective Survey and Field Measurements. Int. J. Environ. Res. Public Health 2017, 14, 979. [Google Scholar] [CrossRef] [PubMed]
- Chin, J.Y.; Godwin, C.; Parker, E.; Robins, T.; Lewis, T.; Harbin, P.; Batterman, S. Levels and Sources of Volatile Organic Compounds in Homes of Children with Asthma. Indoor Air 2014, 24, 403–415. [Google Scholar] [CrossRef]
- Alves, C.; Vicente, A.; Oliveira, A.R.; Candeias, C.; Vicente, E.; Nunes, T.; Cerqueira, M.; Evtyugina, M.; Rocha, F.; Almeida, S.M. Fine Particulate Matter and Gaseous Compounds in Kitchens and Outdoor Air of Different Dwellings. Int. J. Environ. Res. Public Health 2020, 17, 5256. [Google Scholar] [CrossRef]
- Mečiarová, L.; Vilčeková, S.; Burdová, E.K.; Kiselák, J. Factors Effecting the Total Volatile Organic Compound (TVOC) Concentrations in Slovak Households. Int. J. Environ. Res. Public Health 2017, 14, 1443. [Google Scholar] [CrossRef]
- Yang, S.; Perret, V.; Hager Jörin, C.; Niculita-Hirzel, H.; Goyette Pernot, J.; Licina, D. Volatile Organic Compounds in 169 Energy-Efficient dwellings in Switzerland. Indoor Air 2020, 30, 481–491. [Google Scholar] [CrossRef]
- Du, Z.; Mo, J.; Zhang, Y.; Xu, Q. Benzene, Toluene and Xylenes in Newly Renovated Homes and Associated Health Risk in Guangzhou, China. Build. Environ. 2014, 72, 75–81. [Google Scholar] [CrossRef]
- Gabriel, M.F.; Felgueiras, F.; Feliciano, M. Children’s Exposure to Volatile Organic Compounds: A Comparative Analysis of Assessments in Households, Schools, and Indoor Swimming Pools. Atmosphere 2024, 15, 1471. [Google Scholar] [CrossRef]
- Heeley-Hill, A.C.; Grange, S.K.; Ward, M.W.; Lewis, A.C.; Owen, N.; Jordan, C.; Hodgson, G.; Adamson, G. Frequency of Use of Household Products Containing VOCs and Indoor Atmospheric Concentrations in Homes. Environ. Sci. Process. Impacts 2021, 23, 699–713. [Google Scholar] [CrossRef] [PubMed]
- Kozielska, B.; Brągoszewska, E.; Kaleta, D. Investigation of Indoor Air Quality in Offices and Residential Homes in an Urban Area of Poland. Air Qual. Atmos. Health 2020, 13, 131–141. [Google Scholar] [CrossRef]
- Dos Santos, R.R.; Gregório, J.; Castanheira, L.; Fernandes, A.S. Exploring Volatile Organic Compound Exposure and Its Association with Wheezing in Children under 36 Months: A Cross-Sectional Study in South Lisbon, Portugal. Int. J. Environ. Res. Public Health 2020, 17, 6929. [Google Scholar] [CrossRef]
- Otgonbyamba, O.E.; Ganbat, G.; Khuyag, S.O.; Altangerel, E.; Ganbold, B.; Bayanjargal, A.; Bat-Erdene, A.; Chuluunbaatar, B.; Badrakh, B.; Batbaatar, S. Health Risk Assessment of Volatile Organic Compounds for Children in Indoor Air, Ulaanbaatar, Mongolia. Aerosol. Air Qual. Res. 2023, 23, 230028. [Google Scholar] [CrossRef]
- Rösch, C.; Kohajda, T.; Röder, S.; von Bergen, M.; Schlink, U. Relationship between Sources and Patterns of VOCs in Indoor Air. Atmos. Pollut. Res. 2014, 5, 129–137. [Google Scholar] [CrossRef]
- Caron-Beaudoin, É.; Whyte, K.P.; Bouchard, M.F.; Chevrier, J.; Haddad, S.; Copes, R.; Frohlich, K.L.; Dokkie, D.; Juul, S.; Bouchard, M.; et al. Volatile Organic Compounds (VOCs) in Indoor Air and Tap Water Samples in Residences of Pregnant Women Living in an Area of Unconventional Natural Gas Operations: Findings from the EXPERIVA Study. Sci. Total Environ. 2022, 805, 150242. [Google Scholar] [CrossRef]
- Alvarez-Vaca, D.; Duca, R.C.; Borras-Santos, A.; Hardy, E.; Creta, M.; Eicher, C.; Wurth, L.; Vergison, A.; Nieuwenhuyse, A. Van Surveillance of Indoor Air Concentration of Volatile Organic Compounds in Luxembourgish Households. Int. J. Environ. Res. Public Health 2022, 19, 5467. [Google Scholar] [CrossRef]
- Uchiyama, S.; Tomizawa, T.; Tokoro, A.; Aoki, M.; Hishiki, M.; Yamada, T.; Tanaka, R.; Sakamoto, H.; Yoshida, T.; Bekki, K.; et al. Gaseous Chemical Compounds in Indoor and Outdoor Air of 602 Houses throughout Japan in Winter and Summer. Environ. Res. 2015, 137, 364–372. [Google Scholar] [CrossRef]
- Lee, K.; Choi, J.H.; Lee, S.; Park, H.J.; Oh, Y.J.; Kim, G.B.; Lee, W.S.; Son, B.S. Indoor Levels of Volatile Organic Compounds and Formaldehyde from Emission Sources at Elderly Care Centers in Korea. PLoS ONE 2018, 13, e0197495. [Google Scholar] [CrossRef] [PubMed]
- United States Environmental Protection Agency. Hydraulic Fracturing for Oil and Gas: Impacts from the Hydraulic Fracturing Water Cycle on Drinking Water Resources in the United States—Executive Summary; United States Environmental Protection Agency: Washington, DC, USA, 2016.
- Hodgson, A.T.; Levin, H. Lawrence Berkeley National Laboratory Recent Work Volatile Organic Compounds in Indoor Air: A Review of Concentrations Measured in North America Since 1990. Available online: https://escholarship.org/uc/item/0hj3n87n (accessed on 20 April 2025).
- Rovelli, S.; Cattaneo, A.; Fazio, A.; Spinazzè, A.; Borghi, F.; Campagnolo, D.; Dossi, C.; Cavallo, D.M. VOCs Measurements in Residential Buildings: Quantification via Thermal Desorption and Assessment of Indoor Concentrations in a Case-Study. Atmosphere 2019, 10, 57. [Google Scholar] [CrossRef]
- Thiam, S.; Daffe, M.L.; Cazier, F.; Ndong Ba, A.; Verdin, A.; Genevray, P.; Dewaele, D.; Courcot, D.; Fall, M. Volatile Organic Compounds (VOCs): Senegalese Residential Exposure and Health Risk Assessment. Air 2025, 3, 6. [Google Scholar] [CrossRef]
- Wallenius, K.; Hovi, H.; Remes, J.; Mahiout, S.; Liukkonen, T. Volatile Organic Compounds in Finnish Office Environments in 2010–2019 and Their Relevance to Adverse Health Effects. Int. J. Environ. Res. Public Health 2022, 19, 4411. [Google Scholar] [CrossRef] [PubMed]
- Cheng, M.; Galbally, I.E.; Molloy, S.B.; Selleck, P.W.; Keywood, M.D.; Lawson, S.J.; Powell, J.C.; Gillett, R.W.; Dunne, E. Factors Controlling Volatile Organic Compounds in Dwellings in Melbourne, Australia. Indoor Air 2016, 26, 219–230. [Google Scholar] [CrossRef]
- Guo, H.; Kwok, N.H.; Cheng, H.R.; Lee, S.C.; Hung, W.T.; Li, Y.S. Formaldehyde and Volatile Organic Compounds in Hong Kong Homes: Concentrations and Impact Factors. Indoor Air 2009, 19, 206–217. [Google Scholar] [CrossRef]
- Lee, S.C.; Li, W.-M.; Ao, C.-H. Investigation of Indoor Air Quality at Residential Homes in Hong Kong—Case Study. Atmos. Environ. 2002, 36, 225–237. [Google Scholar] [CrossRef]
- Gallon, V.; Le Cann, P.; Sanchez, M.; Dematteo, C.; Le Bot, B. Emissions of VOCs, SVOCs, and Mold during the Construction Process: Contribution to Indoor Air Quality and Future Occupants’ Exposure. Indoor Air 2020, 30, 691–710. [Google Scholar] [CrossRef]
- Tran, T.D.; Nguyen, T.X.; Nguyen, H.T.T.; Vo, H.T.L.; Nghiem, D.T.; Le, T.H.; Dao, D.S.; Van Nguyen, N. Seasonal Variation, Sources, and Health Risk Assessment of Indoor/Outdoor BTEX at Nursery Schools in Hanoi, Vietnam. Water Air Soil Pollut. 2020, 231, 273. [Google Scholar] [CrossRef]
- Vu, D.C.; Ho, T.L.; Vo, P.H.; Bayati, M.; Davis, A.N.; Gulseven, Z.; Carlo, G.; Palermo, F.; McElroy, J.A.; Nagel, S.C.; et al. Assessment of Indoor Volatile Organic Compounds in Head Start Child Care Facilities. Atmos. Environ. 2019, 215, 116900. [Google Scholar] [CrossRef]
- Tran, T.N.; Nguyen, D.K.T.; Tran, T.T.T.; Hauglustaine, J.-M.; Michel, O.; Bouland, C. Indoor Environmental Parameters Are Related to House Typology in the South of Vietnam. 2023. Available online: https://www.researchgate.net/publication/369216406_Indoor_environmental_parameters_are_related_to_house_typology_in_the_South_of_Vietnam (accessed on 20 April 2025).
- Fang, L.; Clausen, G.; Fanger, P.O. Impact of Temperature and Humidity on Chemical and Sensory Emissions from Building Materials. Indoor Air 1999, 9, 193–201. [Google Scholar] [CrossRef]
- Lorentzen, J.C.; Juran, S.A.; Nilsson, M.; Nordin, S.; Johanson, G. Chloroanisoles May Explain Mold Odor and Represent a Major Indoor Environment Problem in Sweden. Indoor Air 2016, 26, 207–218. [Google Scholar] [CrossRef]
- Liang, W.; Wang, C.; Yang, C.; Yang, X. Volatile Organic Compounds in Different Interior Construction Stages of an Apartment. Build. Environ. 2014, 81, 380–387. [Google Scholar] [CrossRef]
- Brown, S.K. INDOOR AIR Volatile Organic Pollutants in New and Established Buildings in Melbourne, Australia. Indoor Air 2002, 12, 55–63. [Google Scholar] [CrossRef]
- Hodgson, A.T.; Rudd, A.F.; Beal, D.; Chandra, S. INDOOR AIR Volatile Organic Compound Concentrations and Emission Rates in New Manufactured and Site-Built Houses. Indoor Air 2000, 10, 178–192. [Google Scholar] [CrossRef] [PubMed]
- Fan, Z.; Lioy, P.; Weschler, C.; Fiedler, N.; Kipen, H.; Zhang, J. Ozone-Initiated Reactions with Mixtures of Volatile Organic Compounds under Simulated Indoor Conditions. Environ. Sci. Technol. 2003, 37, 1811–1821. [Google Scholar] [CrossRef]
- Li, T.H.; Turpin, B.J.; Shields, H.C.; Weschler, C.J. Indoor Hydrogen Peroxide Derived from Ozone/d-Limonene Reactions. Environ. Sci. Technol. 2002, 36, 3295–3302. [Google Scholar] [CrossRef] [PubMed]
- Liu, X.; Mason, M.; Krebs, K.; Sparks, L. Full-Scale Chamber Investigation and Simulation of Air Freshener Emissions in the Presence of Ozone. Environ. Sci. Technol. 2004, 38, 2802–2812. [Google Scholar] [CrossRef]
- Bello, A.; Quinn, M.M.; Perry, M.J.; Milton, D.K. Quantitative Assessment of Airborne Exposures Generated during Common Cleaning Tasks: A Pilot Study. Environ. Health 2010, 9, 76. [Google Scholar] [CrossRef]
- Singer, B.C.; Destaillats, H.; Hodgson, A.T.; Nazaroff, W.W. Cleaning Products and Air Fresheners: Emissions and Resulting Concentrations of Glycol Ethers and Terpenoids. Indoor Air 2006, 16, 179–191. [Google Scholar] [CrossRef]
- Ilgen, E.; Levsen, K.; Rgen Angerer, J.K.; Schneider, P.; Heinrich, J.; Wichmann, H.-E. Aromatic Hydrocarbons in the Atmospheric Environment—Part II: Univariate and Multivariate Analysis and Case Studies of Indoor Concentrations. Atmos. Environ. 2001, 35, 1253–1264. [Google Scholar] [CrossRef]
- Chiara Pietrogrande, M.; Casari, L.; Demaria, G.; Russo, M. Indoor Air Quality in Domestic Environments during Periods Close to Italian COVID-19 Lockdown. Int. J. Environ. Res. Public Health 2021, 18, 4060. [Google Scholar] [CrossRef] [PubMed]
- Akteruzzaman, M.; Rahman, M.A.; Rabbi, F.M.; Asharof, S.; Rofi, M.M.; Hasan, M.K.; Muktadir Islam, M.A.; Khan, M.A.R.; Rahman, M.M.; Rahaman, M.H. The Impacts of Cooking and Indoor Air Quality Assessment in the Southwestern Region of Bangladesh. Heliyon 2023, 9, e12852. [Google Scholar] [CrossRef] [PubMed]
- Su, F.C.; Mukherjee, B.; Batterman, S. Determinants of Personal, Indoor and Outdoor VOC Concentrations: An Analysis of the RIOPA Data. Environ. Res. 2013, 126, 192–203. [Google Scholar] [CrossRef] [PubMed]
- Ruiz-Jimenez, J.; Heiskanen, I.; Tanskanen, V.; Hartonen, K.; Riekkola, M.L. Analysis of Indoor Air Emissions: From Building Materials to Biogenic and Anthropogenic Activities. J. Chromatogr. Open 2022, 2, 100041. [Google Scholar] [CrossRef]
- Fuentes-Ferragud, E.; López, A.; Piera, J.M.; Yusà, V.; Garrigues, S.; de la Guardia, M.; López Labrador, F.X.; Camaró, M.; Ibáñez, M.; Coscollà, C. Indoor Air Quality and Bioaerosols in Spanish University Classrooms. Toxics 2024, 12, 227. [Google Scholar] [CrossRef]
- Madureira, J.; Paciência, I.; Rufo, J.; Severo, M.; Ramos, E.; Barros, H.; de Oliveira Fernandes, E. Source Apportionment of CO2, PM10 and VOCs Levels and Health Risk Assessment in Naturally Ventilated Primary Schools in Porto, Portugal. Build. Environ. 2016, 96, 198–205. [Google Scholar] [CrossRef]
- Vornanen-Winqvist, C.; Salonen, H.; Järvi, K.; Andersson, M.A.; Mikkola, R.; Marik, T.; Kredics, L.; Kurnitski, J. Effects of Ventilation Improvement on Measured and Perceived Indoor Air Quality in a School Building with a Hybrid Ventilation System. Int. J. Environ. Res. Public Health 2018, 15, 1414. [Google Scholar] [CrossRef]
- Langer, S.; Bekö, G. Indoor Air Quality in the Swedish Housing Stock and Its Dependence on Building Characteristics. Build. Environ. 2013, 69, 44–54. [Google Scholar] [CrossRef]
- Langer, S.; Ramalho, O.; Derbez, M.; Ribéron, J.; Kirchner, S.; Mandin, C. Indoor Environmental Quality in French Dwellings and Building Characteristics. Atmos. Environ. 2016, 128, 82–91. [Google Scholar] [CrossRef]
- Yang, S.; Pernot, J.G.; Jörin, C.H.; Niculita-Hirzel, H.; Perret, V.; Licina, D. Energy, Indoor Air Quality, Occupant Behavior, Self-Reported Symptoms and Satisfaction in Energy-Efficient Dwellings in Switzerland. Build. Environ. 2020, 171, 106618. [Google Scholar] [CrossRef]
- Sarkhosh, M.; Mahvi, A.H.; Zare, M.R.; Fakhri, Y.; Shamsolahi, H.R. Indoor Contaminants from Hardcopy Devices: Characteristics of VOCs in Photocopy Centers. Atmos. Environ. 2012, 63, 307–312. [Google Scholar] [CrossRef]
- Wickliffe, J.K.; Stock, T.H.; Howard, J.L.; Frahm, E.; Simon-Friedt, B.R.; Montgomery, K.; Wilson, M.J.; Lichtveld, M.Y.; Harville, E. Increased Long-Term Health Risks Attributable to Select Volatile Organic Compounds in Residential Indoor Air in Southeast Louisiana. Sci. Rep. 2020, 10, 21649. [Google Scholar] [CrossRef]
- Harčárová, K.; Vilčeková, S.; Bálintová, M. Building Materials as Potential Emission Sources of Voc in the Indoor Environment of Buildings. Key Eng. Mater. 2020, 838, 74–80. [Google Scholar] [CrossRef]
- Won, D.; Corsi, R.L.; Rynes, M. Sorptive Interactions between VOCs and Indoor Materials. Indoor Air 2001, 11, 246–256. [Google Scholar] [CrossRef] [PubMed]
- Besis, A.; Margaritis, D.; Samara, C.; Bekiaris, E. Volatile Organic Compounds on Rhodes Island, Greece: Implications for Outdoor and Indoor Human Exposure. Toxics 2024, 12, 486. [Google Scholar] [CrossRef]
- Mandin, C.; Trantallidi, M.; Cattaneo, A.; Canha, N.; Mihucz, V.G.; Szigeti, T.; Mabilia, R.; Perreca, E.; Spinazzè, A.; Fossati, S.; et al. Assessment of Indoor Air Quality in Office Buildings across Europe—The OFFICAIR Study. Sci. Total Environ. 2017, 579, 169–178. [Google Scholar] [CrossRef]
- Kumari, P.; Garg, G.; Soni, D.; Aggarwal, S.G. Measurement of Benzene and Other Volatile Organic Compounds: Implications for Its Inhalation Health Risk Associated with the Workers at a Fuel Station in Delhi. Asian J. Atmos. Environ. 2023, 17, 7. [Google Scholar] [CrossRef]
- Rattanajongjitrakorn, P.; Prueksasit, T. Temporal Variation of BTEX at the Area of Petrol Station in Bangkok, Thailand. APCBEE Procedia 2014, 10, 37–41. [Google Scholar] [CrossRef]
- Claramunt, A.V.; Sadaunykas, A.; Balčiūnas, S.; Knašienė, B.; Zolumskis, A.; Naujalis, E. Profiling of Volatile Organic Compounds for Environment Discrimination in Vilnius City. Chemija 2022, 33, 17–25. [Google Scholar] [CrossRef]
- Xiong, Y.; Zhou, J.; Xing, Z.; Du, K. Cancer Risk Assessment for Exposure to Hazardous Volatile Organic Compounds in Calgary, Canada. Chemosphere 2021, 272, 129650. [Google Scholar] [CrossRef]
- Jin, S.; Zhong, L.; Zhang, X.; Li, X.; Li, B.; Fang, X. Indoor Volatile Organic Compounds: Concentration Characteristics and Health Risk Analysis on a University Campus. Int. J. Environ. Res. Public Health 2023, 20, 5829. [Google Scholar] [CrossRef] [PubMed]
- Ramadan, A.; Yassin, M.F.; Alshammari, B.Z. Health Risk Assessment Associated with Volatile Organic Compounds in a Parking Garage. Int. J. Environ. Sci. Technol. 2019, 16, 2549–2564. [Google Scholar] [CrossRef]
- Parra, M.A.; Elustondo, D.; Bermejo, R.; Santamaría, J.M. Ambient Air Levels of Volatile Organic Compounds (VOC) and Nitrogen Dioxide (NO2) in a Medium Size City in Northern Spain. Sci. Total Environ. 2009, 407, 999–1009. [Google Scholar] [CrossRef] [PubMed]
- Vallecillos, L.; Borrull, A.; Marcé, R.M.; Borrull, F. Passive Sampling to Control Air Quality in Schools: Uptake Rate Determination and Application. Indoor Air 2020, 30, 1005–1017. [Google Scholar] [CrossRef]
- Natarajan, S.; Mukhopadhyay, K.; Thangaswamy, D.; Natarajan, A.; Chakraborty, D. Influence of Indoor Volatile Organic Compounds and Its Relative Respiratory Effects among Children Living in Rural Biomass Cooking Households of Tamil Nadu and Andhra Pradesh. Int. Arch. Occup. Environ. Health 2023, 96, 1183–1201. [Google Scholar] [CrossRef]
- Salameh, T.; Sauvage, S.; Locoge, N.; Gauduin, J.; Perrussel, O.; Borbon, A. Spatial and Temporal Variability of BTEX in Paris Megacity: Two-Wheelers as a Major Driver. Atmos. Environ. X 2019, 1, 100003. [Google Scholar] [CrossRef]
- Mokalled, T.; Gérard, J.A.; Abboud, M.; Liaud, C.; Nasreddine, R.; Calvé, S. Le An Assessment of Indoor Air Quality in the Arrivals Hall of Beirut–Rafic Hariri International Airport: Monitoring of Vocs and No2. Atmosphere 2021, 12, 400. [Google Scholar] [CrossRef]
- de Gennaro, G.; Farella, G.; Marzocca, A.; Mazzone, A.; Tutino, M. Indoor and Outdoor Monitoring of Volatile Organic Compounds in School Buildings: Indicators Based on Health Risk Assessment to Single out Critical Issues. Int. J. Environ. Res. Public Health 2013, 10, 6273–6291. [Google Scholar] [CrossRef]
- Junaidi, E.S.; Jalaludin, J.; Tualeka, A.R. A Review on the Exposure to Benzene among Children in Schools, Preschools and Daycare Centres. Asian J. Atmos. Environ. 2019, 13, 151–160. [Google Scholar] [CrossRef]
- Zabiegała, B. Organic Compounds in Indoor Environments. Pol. J. Environ. Stud. 2006, 15, 383–393. [Google Scholar]
- Villanueva, F.; Tapia, A.; Lara, S.; Amo-Salas, M. Indoor and Outdoor Air Concentrations of Volatile Organic Compounds and NO2 in Schools of Urban, Industrial and Rural Areas in Central-Southern Spain. Sci. Total Environ. 2018, 622–623, 222–235. [Google Scholar] [CrossRef] [PubMed]
- Lai, H.K.; Jantunen, M.J.; Künzli, N.; Kulinskaya, E.; Colvile, R.; Nieuwenhuijsen, M.J. Determinants of Indoor Benzene in Europe. Atmos. Environ. 2007, 41, 9128–9135. [Google Scholar] [CrossRef]
- Fuselli, S.; de Felice, M.; Morlino, R.; Turrio-Baldassarri, L. A Three Year Study on 14 VOCs at One Site in Rome: Levels, Seasonal Variations, Indoor/Outdoor Ratio and Temporal Trends. Int. J. Environ. Res. Public Health 2010, 7, 3792–3803. [Google Scholar] [CrossRef] [PubMed]

| Description | Boiling Point Range (°C) | Example Compounds |
|---|---|---|
| Very volatile organic compounds (VVOCs) | <0 to 50–100 | Butane, propane, methyl chloride |
| Volatile organic compounds (VOCs) | 50–100 to 240–260 | Formaldehyde, terpenes, BTEX |
| Semi-volatile organic compounds (SVOCs) | 240–260 to 380–400 | Pesticides (DDT, phthalates), fire retardants (PCBs, PBB, PAH) |
| ISO Standard | Scope | Ref. |
|---|---|---|
| ISO 16000-1:2004. Indoor air—Part 1: General aspects of sampling strategy | The sampling strategy for indoor air monitoring offers suggestions on the purpose, when, where, how often, and for how long monitoring is to be performed to develop suitable sampling. | [46] |
| ISO 16000-2:2004. Indoor air—Part 2: Sampling strategy for formaldehyde | The sampling strategy for accurately planning measurements of indoor formaldehyde pollution. | [47] |
| ISO 16000-3:2022. Indoor air—Part 3: Determination of formaldehyde and other carbonyl compounds in indoor air and test chamber air—Active sampling method | The document specifies the determination of formaldehyde (HCHO) and other carbonyl compounds in the approximate concentration range of 1 μg/m3 to 1 mg/m3. The document also outlines the subsequent analysis of the hydrazones formed by high-performance liquid chromatography (HPLC) with detection by ultraviolet absorption. | [48] |
| ISO 16000-4:2011. Indoor air—Part 4: Determination of formaldehyde—Diffusive sampling method | This part of ISO 16000 specifies the determination of formaldehyde in indoor air using a diffusive sampler with solvent desorption and HPLC. It indicates a range from 0.001 mg/m3 to 1.0 mg/m3 for a sampling period of between 24 h and 72 h. | [49] |
| ISO 16000-5:2007. Indoor air—Part 5: Sampling strategy for volatile organic compounds | This document aims to assist in planning measurements of indoor pollution from VOCs. | [50] |
| ISO 16000-6:2021. Indoor air—Part 6: Determination of organic compounds (VVOC, VOC, SVOC) in indoor and test chamber air by active sampling on sorbent tubes, thermal desorption and gas chromatography using MS or MS FID | This document outlines a method for determining the emissions of VOCs from products or materials used in indoor environments using test chambers and test cells. It applies to measurements at concentrations ranging from micrograms to several milligrams per cubic metre. | [51] |
| ISO 16000-9:2024. Indoor air—Part 9: Determination of the emission of volatile organic compounds from building products and furnishing—Emission test chamber method | This document specifies a general laboratory test method for determining the area-specific emission rate of VOCs from samples of newly produced building products or furnishings under defined climatic conditions. | [52] |
| ISO 16000-11:2024. Indoor air—Part 11: Determination of the emission of volatile organic compounds from building products and furnishing—Sampling storage of samples and preparation of test specimens | This document specifies the sampling procedures, transport conditions, storage, and substrates that can influence the emissions of volatile organic compounds for three types of building products or furnishings: solid, liquid, and combined. | [53] |
| ISO 16000-29:2014. Indoor air—Part 29: Test methods for VOC detectors | This part defines performance test procedures for VOC detectors referred to for monitoring indoor and living atmosphere VOC concentrations and controlling indoor air quality in portable, mobile, and remote applications. | [54] |
| ISO 16000-32:2014. Indoor air—Part 32: Investigation of buildings for the occurrence of pollutants | This part of ISO 16000 serves as a foundation for subsequent sampling of suspect areas and the determination of the type and quantity of pollutants, which are detailed in other sections of ISO 16000. | [55] |
| ISO 16000-33:2024. Indoor air—Part 33: Determination of phthalates with gas chromatography/mass spectrometry (GC/MS) | The document provides details on the sampling and analysis of phthalates in indoor air, dust, and solvent wipe samples from the surface, utilising GC-MS. | [56] |
| ISO 16000-41:2023. Indoor air—Part 41: Assessment and classification | The document specifies a procedure for assessing indoor air quality that is applicable to all interior spaces in both residential and non-residential buildings with natural or mechanical ventilation, where people occupy these spaces for more than a temporary period. | [57] |
| ISO 16017-1:2000. Indoor, ambient and workplace air—Sampling and analysis of volatile organic compounds by sorbent tube/thermal desorption/capillary gas chromatography—Part 1: Pumped sampling | This part of ISO 16017 provides general guidance for the sampling and analysis of VOCs in air. It applies to ambient, indoor, and workplace environments and the assessment of emissions for materials in both small and full-scale test chambers. The measurement of airborne vapours of VOCs is applicable within a concentration range of approximately 0.5 mg/m3 to 100 mg/m3 for individual compounds. | [58] |
| ISO 16017-2:2003. Indoor, ambient and workplace air—Sampling and analysis of volatile organic compounds by sorbent tube/thermal desorption/capillary gas chromatography—Part 2: Diffusive sampling | Part 2 of the ISO 16017 standard also provides guidance like part 1 for the sampling and analysis of VOCs in the air. However, it is also intended for measuring airborne vapours of VOCs within a mass concentration range of approximately 0.002 mg/m3 to 100 mg/m3 for individual organics with an exposure time of 8 h, or 0.3 µg/m3 to 300 µg/m3 for individual organics over an exposure time of four weeks. | [59] |
| Sensor | Measuring Technique | VOCs | Ref. |
|---|---|---|---|
| Optical | change in light parameters | benzene, butane, chlorobenzene, chloroform, dichloromethane, ethanol, ethyl acetate, formaldehyde, hexane, isopropanol, methane, methanol, propane, tetrahydrofuran, toluene, xylene | [76] |
| Surface Acoustic Wave | Frequency | ethanol, octane, toluene | [77] |
| Chemoresistors—Polymers | Conductivity | acetone, acetonitrile, benzene, butylamine, cyclohexane, ethanol, hexane, isopropanol, methanol, methylene chloride, toluene, xylenes | [78] |
| Chemoresistors—Graphene | Conductivity | acetone, benzene, chloroform, ethanol, hexane, isopropanol, methanol, propanol, trichloroethylene, toluene, m-xylene | [79] |
| Quartz Microbalance | Mass change | acetone, acetonitrile, ethanol, 3-methyl-1-butanol, 1-octanol, toluene, p-xylene | [80,81] |
| Field Effect Transistor (FET) | Voltage change | hexane, hexanol, hexylamine, naphthalene, trimethylamine | [82,83] |
| Nondispersive Infrared | Infrared-radiation absorption | infrared absorbing VOC’s (methane) | [84] |
| Analysis Method | Column | Sampling Method | Duration | Sorbent Type | Ref. |
|---|---|---|---|---|---|
| SPME-GC-FID | CP-WAX 52CB (50 m × 0.32 mm, 1.2 µm) (Agilent Technologies, Santa Clara, CA, USA) | Passive | 24 h | SPME fibre coating with mixture of Tetra-nbuthylorthototitanat and graphite | [104] |
| SPME-GC-MS | BP-20 (30 m × 0.53 mm, 0.50 µm) (SGE Analytical Science, Ringwood, VIC, Australia) | Passive | 30 min | Carboxen Polydimethylsiloxane | [105] |
| GC-FID | HP-INNOWAX (30 m × 0.5 mm, 0.25 µm) (Agilent Technologies, Santa Clara, CA, USA) | Passive | 28 days | Activated Charcoal | [106] |
| GC-MS | DB-624 (60 m × 0.25 mm, 1.4 µm) (Agilent Technologies, Santa Clara, CA, USA) | Passive | 22 days | Activated carbon | [107] |
| NTD-GC-FID | Rt-TCEP (60 m, 0.25 mm, 0.4 mm) (Restek, Bellefonte, PA, USA) | Active | 5 min | Polydimethylsiloxane Carbopack-X Carboxen-1000 | [108] |
| TD-GC-FID | RTX-5 (30 m × 0.32 mm, 3.00 μm) (Restek, Bellefonte, PA, USA) | Passive | 30 days | Tenax GR | [109] |
| TD-GC-MS | DB-5MS (30 m × 0.25 mm I.D.) (Agilent Technologies, Santa Clara, CA, USA) | Active | 6 h | Tenax-TA Carboxen 1000 Carbosieve | [110] |
| HPLC-DAD | Synergi 4 μ Hydro-RP (15 cm length, 5 μm, 4.6 mm i.d.) (Phenomenex, Torrance, CA, USA) | Passive | 25 h | - | [111] |
| HPLC-FLD | CYCLOBOND I 2000 (25 cm × 4.6 mm I.D., 5 µm) (Supelco, Bellefonte, PA, USA) | Active/Passive | 8 h | Activated charcoal | [112] |
| HPLC | GC | |
|---|---|---|
| VOCs | polar and semi-volatile | non-polar and volatile |
| Sample Type | Liquid | gas, air |
| Sensitivity | lower | higher |
| Detectors | UV-Vis, FLD, DAD, MS | FID, ECD, MS |
| Sample Prep | requires derivatisation | headspace, purge and trap, thermal desorption, or direct injection |
| VOC | Country | LCR | Description | Ref. |
|---|---|---|---|---|
| Tetrachloroethylene Benzene 1,3-butadiene | China | 9.35 × 10⁻⁷ (adults) 4.54 × 10⁻⁴ (adults) 1.68 × 10⁻⁴ (adults) | residence | [14] |
| 1,1—dichloroethane Methylene chloride Benzene Trichloroethene Tetrachloroethene | Hong Kong | 5.16 × 10⁻⁶ (adults) 5.14 × 10⁻⁶ (adults) 1.81 × 10⁻⁵ (adults) 1.32 × 10⁻⁶ (adults) 1.03 × 10⁻⁶ (adults) | non-smoker’s home | [148] |
| Benzene | Argentine | 3.57 × 10⁻⁵ (children) | room | [147] |
| Benzene Formaldehyde | China | 1.64 × 10⁻⁵ (female); 1.49 × 10⁻⁵ (male) 7.16 × 10⁻⁶ (female); 6.56 × 10⁻⁶ (male) | bedroom | [146] |
| Benzene Trichloroethylene Tetrachloroethene | India | 2 × 10⁻⁵ (male); 4 × 10⁻⁵ (female) 1 × 10⁻⁶ (male); 3 × 10⁻⁶ (female) 5 × 10⁻⁷ (male); 1 × 10⁻⁶ (female) | home | [145] |
| Formaldehyde Acetaldehyde Benzene | Spain | 7.8 × 10⁻⁵–4.1 × 10⁻⁴ (adults) 8.6 × 10⁻⁶–3.5 × 10⁻⁵ (adults) 2 × 10⁻⁶–1.5 × 10⁻⁵ (adults) | living rooms | [150] |
| Formaldehyde | Taiwan | 1.41 × 10⁻⁵ (male); 1.21 × 10⁻⁵ (female) | renovated houses | [149] |
| Benzene | Turkey | 5.4 × 10⁻¹³ (adults) | tape production facility | [151] |
Disclaimer/Publisher’s Note: The statements, opinions and data contained in all publications are solely those of the individual author(s) and contributor(s) and not of MDPI and/or the editor(s). MDPI and/or the editor(s) disclaim responsibility for any injury to people or property resulting from any ideas, methods, instructions or products referred to in the content. |
© 2025 by the authors. Licensee MDPI, Basel, Switzerland. This article is an open access article distributed under the terms and conditions of the Creative Commons Attribution (CC BY) license (https://creativecommons.org/licenses/by/4.0/).
Share and Cite
Horvat, T.; Pehnec, G.; Jakovljević, I. Volatile Organic Compounds in Indoor Air: Sampling, Determination, Sources, Health Risk, and Regulatory Insights. Toxics 2025, 13, 344. https://doi.org/10.3390/toxics13050344
Horvat T, Pehnec G, Jakovljević I. Volatile Organic Compounds in Indoor Air: Sampling, Determination, Sources, Health Risk, and Regulatory Insights. Toxics. 2025; 13(5):344. https://doi.org/10.3390/toxics13050344
Chicago/Turabian StyleHorvat, Tajana, Gordana Pehnec, and Ivana Jakovljević. 2025. "Volatile Organic Compounds in Indoor Air: Sampling, Determination, Sources, Health Risk, and Regulatory Insights" Toxics 13, no. 5: 344. https://doi.org/10.3390/toxics13050344
APA StyleHorvat, T., Pehnec, G., & Jakovljević, I. (2025). Volatile Organic Compounds in Indoor Air: Sampling, Determination, Sources, Health Risk, and Regulatory Insights. Toxics, 13(5), 344. https://doi.org/10.3390/toxics13050344