Abstract
To maximize the performances of heterogeneous catalytic reactors, it is necessary to consider many parameters. Catalytic particle morphology (dimension, shape, active phase distribution) is generally previously established and seldom considered in the optimization of the catalyst to be specific for a given process. In this work, the influence of active phase distribution within spherical catalytic particles (egg-shell, egg-yolk and egg-white), on the yield and selectivity of a product is shown for a consecutive reaction network; here, the intermediate component is the main product of interest. Intraparticle mass and energy balances under non-steady conditions were implemented. Sensitivity studies lead to the identification of the optimal conditions, thus maximizing the yield of the intermediate for each active phase distribution. It was demonstrated that the egg-shell catalyst can maximize the intermediate yield, with a lower active-phase usage.
1. Introduction
The chemical industry has developed a growing interest in the enhancement of heterogeneously catalyzed processes. A heterogeneous catalysis offers several advantages compared to technologies in which the reagents and catalytic species co-exist in the same phase; easy catalyst separation and regeneration flexibility are two typical examples.
It is necessary to consider many variables to maximize the performance of a heterogeneous catalytic reactor in terms of yield and selectivity. As is generally known, the catalyst modifies the reaction pathway, leading to a desired increase in the overall reaction rates, improving the selectivity toward the desired product in complex reaction network systems.
The catalytically active component is often dispersed on a thermostable support stabilizing itself and increasing the specific contact area. Conventional heterogeneous catalyst particles have a uniform distribution of the active species, e.g., metals. Nevertheless, a uniform active phase distribution could be undesirable if the catalyst cost is high [1] or the system is limited by internal mass transfer [2]. Thus, designing the active phase distribution correctly is an attractive opportunity and a great challenge.
Four main active phase profiles are reported in the literature. Figure 1 depicts the specific cases for a spherical particle:
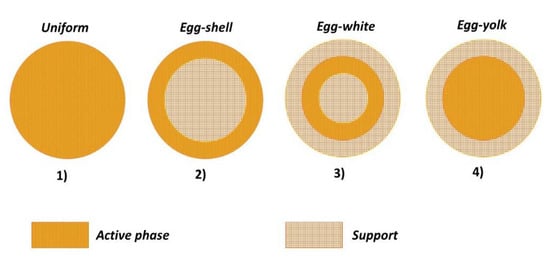
Figure 1.
Active phase distributions for a spherical catalyst particle.
- (1)
- Uniform: the active phase is homogeneously distributed in the support;
- (2)
- Egg-shell: the active phase is located in the outer surface of the support;
- (3)
- Egg-white: the active phase is included in a region between the outer-shell and the inner-core;
- (4)
- Egg-yolk: the active phase is present in the inner-core of the support.
Different catalyst preparation methods are well-known, and the specific choice influences the properties of the final catalyst [3]. The most common techniques are listed here: (i) support and active phases are simultaneously precipitated from a supersaturated solution in coprecipitation; (ii) gaseous components are fixed on the support in adsorption; (iii) the catalytically active metal is precipitated from the solution to the support powder, suspended in it, with the addition of a strong base (e.g., NaOH) in the deposition–precipitation technique. Non-traditional preparation methods are based on microemulsions, atomic-layer epitaxy, plasma and electro-spinning [4]. The solid support is in contact with a precursor solution in impregnation techniques: it is either dipped in the metal salt solution for a certain time (wet impregnation) or sprinkled by sprayers (dry impregnation or incipient wetness impregnation IWI).
As is pointed out above, during catalyst preparation, the active phase distribution is strongly influenced by intraparticle mass transfer limitations. Egg-shell catalysts are well obtained by modulating the immersion time of the support in the precursor solution [5], as lower impregnation times prevent the migration of the active phase toward the inner core of the support. Nevertheless, some research groups preserve the advantages of the IWI approach [5,6], leading to easy control of the active phase loading. Viscosity, active phase solubility in the precursor solution, concentration, impregnation time and temperature are the operating parameters that optimize the final active phase distribution.
The prediction of the right active phase profile within the support material is still a great challenge to be faced by both industrial and academic researchers [7], as it is known that this aspect strongly influences the catalytic performance and, ultimately, the chemical reactor design. Uniform distribution is surely the best choice when studying a simple irreversible reaction under isothermal conditions. The choice of the best possible distribution becomes crucial either when multiple reactions, for example series and parallel reactions, comprise the overall network or if mass and heat transfer limitations are remarkable, which is a very common feature in the field of heterogeneously catalyzed reactions. For the latter cases, it is necessary to distribute the active phase only where the reaction really occurs, meaning the outer shell of the solid material. Thus, egg-shell catalysts are often the best choice; the exceptions are well represented by processes in which the catalyst could be shell-poisoned.
Several case studies are reported in the literature which reflect the importance of non-uniform active phase profiles. Some industrially interesting cases are listed below.
Ethylene oxide (EO) is synthesized using an Ag-based catalyst, for which the cost is rather high, thus it is dispersed on a support to maximize the specific contact area. EO worldwide production capacity exceeds 34 million of tons/year [8], hence optimizing the process has a huge economic impact [9]. Gravidiliis and Varma [10] compared a catalyst with different active-layer positions, concluding that both yield and selectivity toward EO can be optimized by locating Ag on the support surface. Non-uniform distribution avoids thermal runaways in the reactor [11]. Catalytic configuration studies have been used in the optimization of temperature reactor profiles [9] and in modern microreactor technologies [12].
Intraparticle diffusion is relevant in Fisher–Tropsch synthesis, which converts syngas into liquid hydrocarbon. The optimal position of the active phase layer in the particle is related to the desired product yield maximization [13]. Several approaches can be used to minimize transport limitations: egg-shell catalyst with a specific thickness of the active layer [14,15], wash-coated monoliths [16], solid foams, and micro- and millireactors. Mazdidi et al. have demonstrated that, by using a tubular fixed bed reactor, it is convenient to use different catalyst distributions along the bed length, as the diffusion limitations strongly depend on the reactant conversion [17].
In the catalytic aromatization of methyl cyclopentane an increase in the conversion was observed when the metallic sites are distributed on the external surface of the particle [18]; egg-shell catalysts are also widely used in the hydrogenation of pyrolysis gasoline [19], ammonia decomposition [5], and the purification of automobile exhaust gases [20,21]. Recently, core-shell and core-double-shell catalysts have been compared in terms of amide production in reactors heated under radiofrequencies (RF), demonstrating that the reaction rates are increased by using an intermediate non-magnetic support layer [22].
It is evident that the active phase distribution optimization for a given reaction is a key aspect to be faced both experimentally and theoretically. The development of a reliable mathematical model would allow the a priori design of the best catalyst to optimize the reactor performances. Many studies have reported on the implementation of specific mathematical models [23]. Despite the academic and industrial interest, the models reported on in the literature are based on a simplified approach. Boukezoula and Bencheikh [17] developed a steady-state modelling approach for the aromatization of methyl cyclopentane. Thus, all the dynamic aspects are neglected; that is an essential issue to be considered within the start-up operation of a chemical plant. Hwang et al. [9] published an interesting modelling approach dealing with ethylene oxide synthesis, writing mass, and energy balance equations for both the bulk and particle phase. Therefore, even in the most advanced till to date, the authors included fluid–solid mass and heat transfer resistance only in the bulk phase equations, and not in the particle boundary condition, leading to a certain approximation of the results.
Thus, there is a real need to develop more robust mathematical models which could be used to optimize the catalyst performance. Besides, an intraparticle sensitivity study, allowing the catalytic performance optimization, is needed. In this work, the influence of active phase distribution on both yield and selectivity is shown for a consecutive reaction network (A→B→C), selected as a reference study, where B is the main product of interest. Mass and energy balances have been developed in dynamic conditions for a single spherical particle and sensitivity studies identify the optimal conditions to maximize the yield of B. The reference particle is egg-shell type; comparisons with other active phase distributions have been carried out.
2. Mathematical Model
The main assumption of the present model is to consider a single catalyst particle in contact with a gaseous bulk phase characterized by a volume high enough to neglect any variations in its composition and temperature. Therefore, fluid–solid mass and heat transfer resistance were included in the model, specifically in the boundary conditions, to establish the opportune mass and energy fluxes between the single catalyst particle and the bulk phase.
2.1. Intraparticle Mass and Energy Balances
Under dynamic conditions, the mass balance of an arbitrary component in a single spherical particle can be written as Equation (1) [24],
To simulate non-uniform active-phase profiles, distribution functions need to be defined. In this work, analytical functions (Ωk) have been chosen, whose co-domains vary from 0 to 1. Defining a smoothing factor (b) (needed to modify the function steepness), as and ast are the coordinates of the distribution domains, Equations (2)–(4),
Egg-shell
Egg-yolk
Egg-white
Two coordinates for the egg-white catalyst are needed; hence, the active phase thickness can be defined as in Equation (5).
It should be noted that egg-white distribution could be centered differently within the support particle. Thus, a31 and a32 can be correctly calculated as in Equations (6) and (7).
where χ is the midpoint coordinate.
Regarding the egg-shell distribution, the active-phase thickness layer (δ) is defined as 1 − a1, while it is equal to a2 for the egg-yolk catalyst.
The distribution functions are illustrated in Figure 2, setting an active phase layer thickness of 0.4 for all the mentioned cases, with a1 = 0.6, a2 = 0.4, a31 = 0.7, a32 = 0.3, centering the catalytic layer for the egg-white case in the middle of the particle.
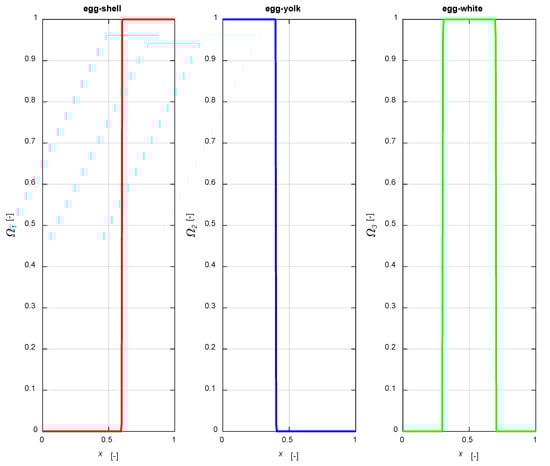
Figure 2.
The distribution functions (2)–(4).
The distribution functions were introduced in Equation (1), in the reaction rate term, that becomes Equation (8) after introducing a dimensionless particle radius x = rp/Rp.
The generation term is multiplied by Ωk x; thus, it is possible to discriminate the inert zone (Ωk x = 0, (no reaction) and a catalytically active zone (Ωk x ≠ 0, where both reaction and diffusion take place. The boundary conditions (BCs) needed to solve the partial differential equation are listed in Equation (9),
In detail, symmetry was considered in the centre of the particle (x = 0); the boundary condition at the particle surface includes the possibility of external mass transfer limitation, as the flux in the film must be equal to the intraparticle diffusion rate at x = 1 (no accumulation is considered). This aspect is seldom considered in the published models in this field.
For highly exothermic or endothermic reactions, temperature gradients can become important. Hence, it is necessary to implement both mass and energy balances to investigate the intraparticle temperature profiles and their influence on the concentration profiles inside the catalyst particle.
Energy balance is written as follows [24],
It should be noted that the temperature dependences of density, specific heat and diffusivity are assumed to be negligible to simplify the calculations, particularly because in the present study no specific chemical system was considered, as the model is based on generic terms.
The boundary conditions needed to solve the energy balance are reported in Equation (11).
The external thermic resistance is not neglected at this stage. The Chilton–Colburn analogy was implemented as it provides an easy relationship between the heat and mass transport coefficients in the fluid bulk, Equation (12).
2.2. Reaction Network
The reference reaction network being studied is
Both reactions are assumed to be described by first order kinetics, and the temperature dependences of the kinetic constants are described with the modified Arrhenius law,
The stoichiometric matrix for the system is given by Equation (15),
The Thiele modulus for a first-order reaction rate can be roughly estimated by Equation (16),
It is possible to calculate two Thiele moduli for the proposed reaction network; nevertheless, only φ1 was considered, as A→B is the desired reaction. This calculation does not account for the specific distribution.
The catalytic efficiency is determined by Equation (17),
The model was implemented in Matlab R2018b, solving the partial differential equations system using the built-in pdepe function, fixing 50 grid points for the dimensionless particle radius coordinate.
3. Results and Discussion
3.1. Model Validation
The mass and energy balances were implemented, fixing a set of parameters that are valid for a generic gas–solid system. The reference parameters for all the simulations conducted in the present work are listed in Table 1, Table 2 and Table 3, inspired by the properties of the main components involved in ethylene oxide synthesis reaction promoted by silver catalyst [9,12]. The listed parameters can be considered valid for all the active phase distributions. Within the parametric investigations, a chosen parameter is varied in a range that is cited in the related text.

Table 1.
Main parameters for the fluid and solid phases.
Table 2.
Fluid component parameters.
Table 3.
Kinetic and thermodynamic data. Tref = 298 K.
The reaction occurs within an egg-shell catalyst (distribution function, as in Equation (2)); the active phase is located on the outer shell of the solid particle, accounting for the 40% of the total radius (1 cm). The external mass transfer coefficient is sufficiently high to neglect the film diffusion resistance. In order to investigate the possibility of temperature gradients in the particle, h is not calculated with Equation (12): if external mass transfer is too high, an isothermal condition could be obtained.
The calculated intraparticle concentration and temperature profiles are displayed in Figure 3.
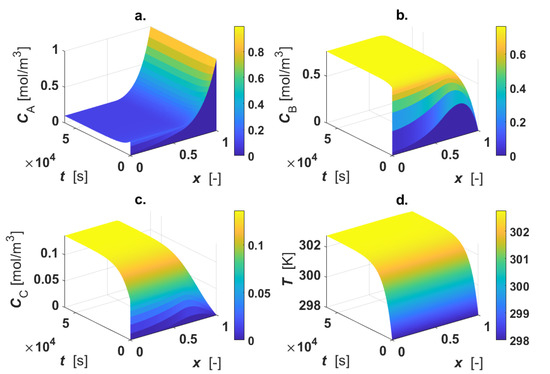
Figure 3.
Intraparticle profiles for egg-shell catalyst. Calculated profiles for: (a) CA; (b) CB; (c) CC; (d) T. Color-bar of each plot is located on the right-hand-side.
As revealed by the figure, the reactant A is consumed only in the active region, where a1 ≤ x ≤ 1 (Figure 3a); CB shows a maximum inside the particle, since the intermediate B is formed in reaction 1 and consumed in reaction 2 (Figure 3b). For 0 ≤ x < a1, each profile is described by the diffusive mechanism only, as no active phase is present in the inner part of the particle. The final product C is formed in the outer shell of the catalyst particle by the progress of the second reaction, then it diffuses in the inner core of the particle (Figure 3c). A temperature rise (4 K) under steady-state conditions was calculated (Figure 3d).
Thiele modulus and the catalytic efficiency were calculated under steady-state conditions by means of Equations (16) and (17), obtaining φ = 8.15 and η = 0.32. Under the selected conditions, the system is highly limited by intraparticle mass transfer.
3.2. Egg-Shell: Sensitivity Study
The influence of the active phase thickness layer was investigated. The physical and chemical parameters adopted in the sensitivity study are listed in Table 1, Table 2 and Table 3. The egg-shell distribution domain coordinate, a1, is varied from 0 to 1, simulating the cases ranging from a uniform distribution to an inert particle. Figure 4 shows the steady state intraparticle profiles of component A conversion, yield and selectivity to B for a1 = [0, 0.2, 0.4, 0.6, 0.8, 1].
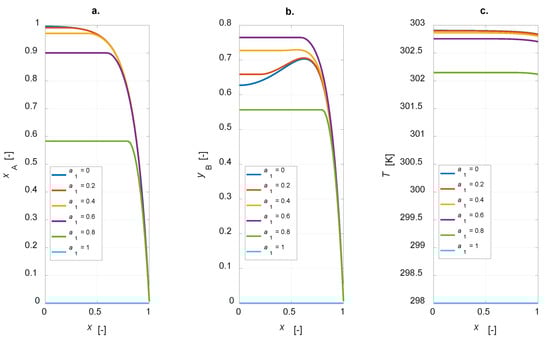
Figure 4.
Intraparticle profiles calculated for the egg-shell catalyst varying the active phase content: (a) A conversion; (b) yield to B; (c) temperature.
The conversion degree is in inverse relationship with a1: an increase in the amount of the active phase leads to a corresponding increase in the conversion of component A (Figure 4a). The selectivity to B is equal to 1 for an inert particle, since, considering an infinitesimal active-phase thickness, A reacts to give the only the intermediate, thus a fictitious unitary selectivity is computed. It is interesting to observe that the yield to B is zero for an inert particle and a finite value, not the maximum one, for a uniform distribution (Figure 4b). Temperature profiles at steady state show a maximum temperature gradient of roughly 5 K for the uniformly distributed active phase catalyst (Figure 4c). This value decreases when a lower amount of the active phase is present in the catalyst particle. Maximizing the yield to B is surely possible with the developed model, as the simulation results suggest the possibility of optimizing the steady state yield of the desired product by varying the active-phase thickness. The plot yB vs. a1 is depicted in Figure 5.
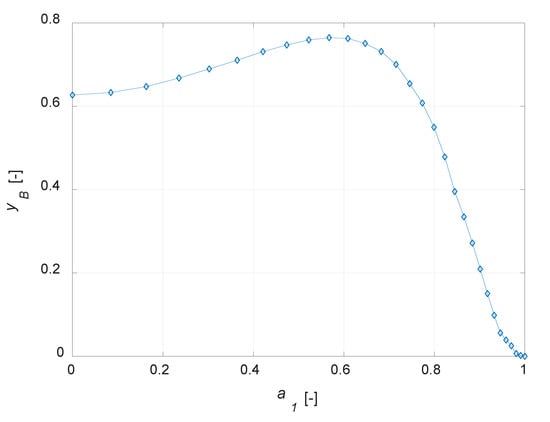
Figure 5.
Yield to B (yB) vs. active phase inert fraction coordinate (a1) for the egg-shell catalyst.
It emerges that the yield of the intermediate component can be optimized designing correctly the catalyst active phase distribution. It should be noted that, in the case of maximum yield to B, the reactant conversion is not the maximum possible, as a uniform distribution would surely lead to a higher conversion.
A sensitivity study on the influence of the kinetic constants on the steady state intraparticle profiles was conducted. The ratio σ = kref2/kref1 is defined for each simulation; intraparticle profiles under steady-state conditions for σ = [0.01, 0.05, 0.1] are displayed in Figure 6.
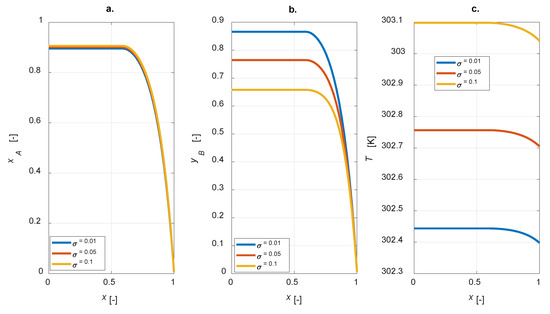
Figure 6.
Intraparticle profiles computed varying the ratio between the kinetic constants at the reference temperature of reactions 2 and 1 for the egg-shell catalyst: (a) A conversion; (b) yield to B; (c) temperature.
As expected, the yield of component B is improved for lower σ, i.e., lower kref2 (Figure 6b); besides, σ does not affect the conversion degree, as kref1 is constant (Figure 6a). Moreover, by increasing σ, a corresponding increase in the temperature inside the particle is predicted (Figure 6c).
The overall thermal conductivity of the particle is included in the energy balance (Equation (10)). This parameter affects the intraparticle steady state temperature profiles and, therefore, the concentrations of the gaseous components inside the particle. In Figure 7, a sensitivity study on kT,p is shown, with kT,p = [0.01, 0.05, 0.1] W m−1 K−1.
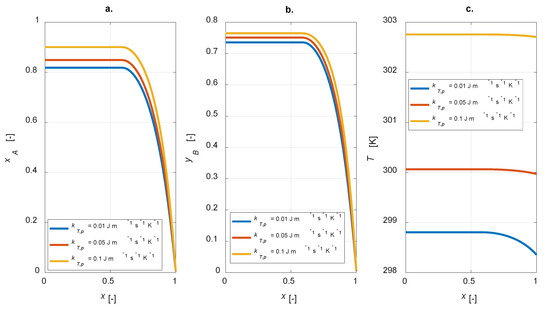
Figure 7.
Intraparticle profiles: kT,p sensitivity study. (a) A conversion; (b) yield to B; (c) temperature.
For high values of the thermal conductivity, flat temperature profiles are observed (Figure 7c); both the conversion and yield increase were simulated (Figure 7a,b). Therefore, it must be pointed out that the overall selectivity becomes lower. Besides, higher heat conductivity leads to higher temperatures within the particle: this is the main reason for the improved conversion degrees.
The influence of external mass transfer coefficient on the concentration profiles is shown in Figure 8, adopting the thermal conductivity of air for the fluid phase (Table 1). The simulation was executed by diminishing the fluid–solid mass transfer coefficient, km, by a factor of 100 (km = 1 m s−1), and the heat transfer coefficient h was calculated from Equation (12).
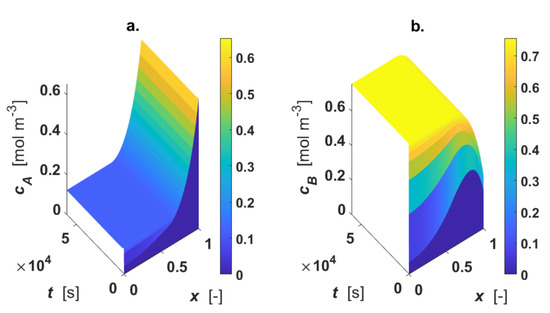
Figure 8.
Intraparticle concentration and temperature profiles; km = 1 m s−1; h = 4218 W m−1 K−1. (a) concentration of A; (b) concentration of B. Color-bar of each plot is located on the right-hand-side.
The surface plots show the appearance of external mass transfer limitation because at x = 1, Ci ≠ Ci0. This fact strongly influences the concentration gradients, as demonstrated.
The influence of effective diffusivity values was studied through a dedicated parametric investigation, varying Deff,i = [1 × 10⁻⁷, 1 × 10⁻⁸, 1 × 10⁻⁹] m2 s−1. The steady state results are reported in Figure 9.
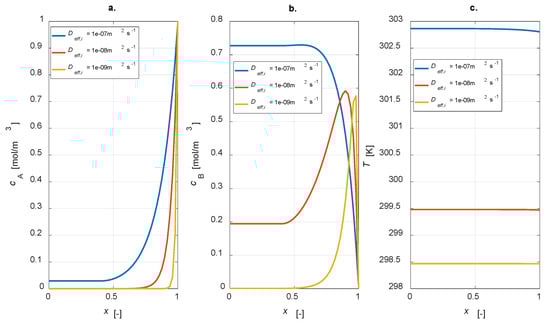
Figure 9.
Intraparticle profiles: Deff,i sensitivity study. (a) A concentration; (b) B concentration; (c) temperature.
It is evident that, by increasing the effective diffusivity value, reactant A is transported from the catalyst interface to the inner part with a higher velocity (Figure 9a). In these conditions, conversion is not complete. Moreover, a higher diffusivity value leads to an increase in the concentration of the intermediate B, leading to a higher yield. This result is reasonable as, by lowering the diffusivity, a lower amount of B is produced, which is converted to C (Figure 9b). Temperature profiles are rather flat in any case, but the higher the diffusivity, the higher the temperature level, which is connected to the major activity of the system in the case of high diffusion coefficients.
3.3. Egg-Yolk, Egg-White and Comparisons
The model can be simply extended to other active-phase distributions by using a suitable distribution function (respectively, egg-yolk and egg-white are simulated with Equations (3) and (4)).
To implement egg-white balances, χ = 0.5 was adopted. In analogy with egg-shell distribution, the sensitivity studies on egg-yolk and egg-white catalyst were carried out by varying the amount of active phase and calculating the steady state yield to B. The results are shown in Figure 10.
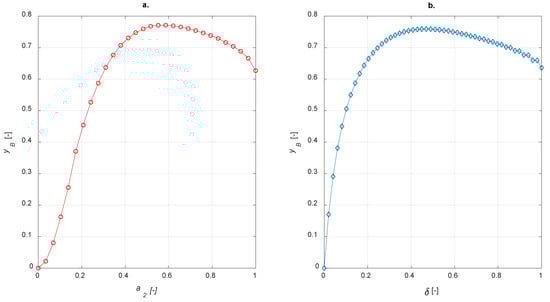
Figure 10.
Yield to B vs. active phase thickness for (a) egg-yolk catalyst (b) egg-white catalyst.
As expected, both egg-yolk and egg-white catalysts enhance the yield of the intermediate product compared to the uniform distribution of the active phase. It is interesting to compare different active-phase distributions in order to establish which one is the best for the current case study. With regard to the egg-shell structure, the active-phase thickness layer is defined as 1−a1; it is equal to a2 for the egg-yolk catalyst. No comparisons with the egg-white distribution are possible because δ, in this case, requires two coordinates to be determined.
The curves of steady state yB vs. δ for different distributions are depicted in Figure 11. It must be noted that, when δ = 1, the active phase is uniformly distributed within the catalyst. Thus, Figure 10 and Figure 11 show identical values of yB when δ = 1.
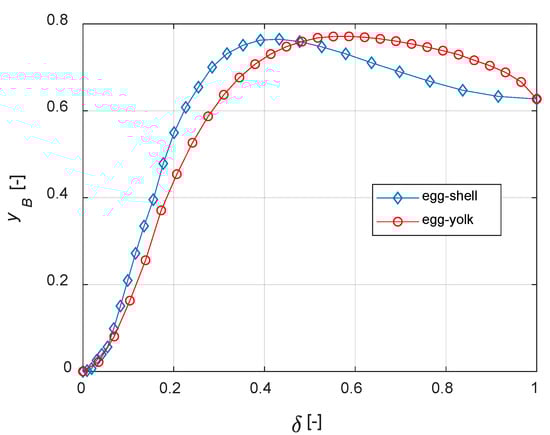
Figure 11.
Egg-shell vs. egg-yolk: comparisons.
It is finally demonstrated that, for the current case study, egg-shell catalysts maximize the yield of B with a lower active phase usage. The present model can be applied to real reaction networks to investigate the optimal catalyst design; if the active phase cost is high, this a priori analysis can also have a high economic impact on the process.
4. Conclusions
In this work, the influence of the active phase distribution toward the yield of a desired product was investigated. The consecutive reaction scheme A→B→C was adopted as a reference study, where B is the desired product. Assuming a spherical support particle, mass and energy balances were widely implemented for the egg-shell catalyst investigating by simulations the best conditions to maximize the yield to the component B. The egg-yolk and egg-white distributions were simulated using the respective distribution functions: the maximum yield to B was found for each profile. General comparisons concluded that, for the reference case-study, egg-shell catalysts maximize the yield of B with a lower active-phase usage.
The implemented model can be easily adapted for a preliminary study in real systems to correctly design the active phase distribution within the supported catalyst.
Future works will include the development of bulk phase mass and energy balance to extend the treatise from a single particle to a real reactor, possibly working under flow condition, extending the treatise by including other possible reaction mechanisms.
Author Contributions
Conceptualization, V.R., R.T., T.S. and M.D.S.; Project administration, V.R.; Software, V.R. and L.M.; Supervision, V.R.; Writing—original draft, V.R. and L.M.; Writing—review and editing, R.T., T.S. and M.D.S. All authors have read and agreed to the published version of the manuscript.
Acknowledgments
MDPI chemengineering is acknowledged for the 2019 Travel Award given to Vincenzo Russo.
Conflicts of Interest
The authors declare no conflict of interest.
Notation
| A | reactant |
| a1 | inflection point for egg-shell profile, [-] |
| a2 | inflection point for egg-yolk profile, [-] |
| a31 | inflection point 1 for egg-white profile, [-] |
| a32 | inflection point 2 for egg-white profile, [-] |
| B | intermediate |
| b | smoothing factor, [-] |
| C | product |
| Ci0 | concentration of species i in bulk phase at time = 0, [mol m−3] |
| Ci | concentration of species i, [mol m−3] |
| cp,i | specific heat of the fluid component, [J mol−1 K−1] |
| cp,p | specific heat of the particle, [J mol−1 K−1] |
| Deff,i | effective diffusivity, [m2 s−1] |
| Ea,j | activation energy, [J mol−1] |
| h | heat exchange coefficient, [W m−2 K−1] |
| kj | kinetic constant, [m3 kg−1 s−1] |
| km | mass transfer coefficient, [m s−1] |
| kref,j | reference kinetic constant, [m3 kg−1 s−1] |
| kT,f | fluid thermal conductivity, [W m−1 K−1] |
| kT,p | particle thermal conductivity, [W m−1 K−1] |
| MWi | molecular weight, [-] |
| Nc | number of components, [-] |
| rj | reaction rate j, [mol kg−1 s−1] |
| Rp | particle radius, [m] |
| rp | radial coordinate, [m] |
| T | temperature, [K] |
| t | time, [s] |
| T0 | surface temperature at time = 0, [K] |
| x | dimensionless radial coordinate, [-] |
| xA | conversion degree, [-] |
| yB | yield in B, [-] |
| Subscripts | |
| f | fluid |
| i | component |
| j | reaction |
| k | distribution type |
| p | particle |
| s | coordinate domain |
| t | coordinate domain |
| Greek letters | |
| ∆r Hj | reaction enthalpy j, [J mol−1] |
| δ | active-phase thickness, [-] |
| ε | void degree, [-] |
| ϕB | selectivity to B, [-] |
| φ | Thiele modulus, [-] |
| η | efficiency factor, [-] |
| νij | stoichiometric matrix, [-] |
| ρp | particle density, [kg m−3] |
| σ | kinetic constant ratio, [-] |
| Ωk | distribution function, [-] |
References
- Chaudhuri, R.G.; Paria, S. Core/Shell Nanoparticles: Classes, Properties, Synthesis Mechanisms, Characterization, and Applications. Chem. Rev. 2012, 112, 2373–2433. [Google Scholar] [CrossRef]
- Morbidelli, M.; Varma, A. On shape normalization for non-uniformly active catalyst pellets. Chem. Eng. Sci. 1983, 38, 297–305. [Google Scholar] [CrossRef]
- Perego, C.; Villa, P. Catalyst preparation methods. Catal. Today 1997, 34, 281–305. [Google Scholar] [CrossRef]
- Deraz, N.M. The importance of catalyst preparation. J. Ind. Environ. Chem. 2018, 2, 16–18. [Google Scholar]
- Silva, H.; Nielsen, M.G.; Fiordaliso, E.M.; Damsgaard, C.D.; Gundlach, C.; Kasama, T.; Chorkendorff, I.B.; Chakraborty, D. Synthesis and characterization of Fe-Ni/γ-Al2O3 egg-shell catalyst for H2 generation by ammonia decomposition. Appl. Catal. A-Gen. 2016, 505, 548–556. [Google Scholar] [CrossRef]
- Bueno, A.C.; Mayer, M.; Weber, M.; Bachelany, M.; Klotz, M.; Farruseng, D. Impregnations protocols on Alumina Beads for Controlling the Preparation od Supported Metal Catalysts. Catalysts 2019, 9, 577. [Google Scholar] [CrossRef]
- Komiyama, M. Design and Preparation of Impregnated Catalysts. Catal. Rev. 1985, 27, 341–372. [Google Scholar] [CrossRef]
- ReportsnReports. Available online: https://www.reportsnreports.com (accessed on 1 October 2019).
- Hwang, S.; Linke, P.; Smith, R. Heterogeneous catalytic reactor design with optimum temperature profile II: Application of non-uniform catalyst. Chem. Eng. Sci. 2004, 59, 4245–4260. [Google Scholar] [CrossRef]
- Gavriilidis, A.; Varma, A. Optimal catalyst activity profiles in pellets: 9. Study of ethylene epoxidation. AIChE J. 1992, 38, 291–296. [Google Scholar] [CrossRef]
- Johnson, D.L.; Verykios, X. Selectivity enhancement in ethylene oxidation employing partially impregnated catalysts. J. Catal. 1983, 79, 156–163. [Google Scholar] [CrossRef]
- Russo, V.; Kilpiö, T.; Hernandez, J.C.; Di Serio, M.; Salmi, T.O. Modelling of microreactors for ethylene epoxidation and total oxidation. Chem. Eng. Sci. 2015, 134, 563–571. [Google Scholar] [CrossRef]
- Zarrin, H.; Sadeghi, M.T.; Marvast, M.A. Modeling of a catalyst pellet with non-uniform activity distribution in Fisher-Tropsch synthesis. Int. J. Chem. React. Eng. 2009, 7. [Google Scholar] [CrossRef]
- Bukur, D.B.; Mandić, M.; Todić, B.; Nikačević, N. Pore diffusion effects on catalyst effectiveness and selectivity of cobalt based Fisher-Tropsch catalyst. Catal. Today 2018, 343, 146–155. [Google Scholar] [CrossRef]
- Gardezi, A.G.; Babu, J. Performance Characteristics of Eggshell Co/SiO2 Fischer-Tropsch Catalysts: A Modeling Study. Ind. Eng. Chem. Res. 2015, 54, 8080–8092. [Google Scholar] [CrossRef]
- Mandić, M.; Todić, B.; Živanić, L.; Nikačević, N.; Bukur, D.B. Effects of Catalyst Activity, Particle Size and Shape, and Process Conditions on Catalyst Effectiveness and Methane Selectivity for Fischer−Tropsch Reaction: A Modeling Study. Ind. Eng. Chem. 2017, 56, 2733–2745. [Google Scholar] [CrossRef]
- Mazdidi, S.K.; Sadeghi, M.T.; Marvast, M.A. Optimization of Fischer-Tropsch Process in a Fixed-Bed Reactor Using Non-uniform Catalysts. Chem. Eng. Technol. 2012, 36, 62–72. [Google Scholar] [CrossRef]
- Boukezoula, T.F.; Bencheikh, L. Theoretical investigation of non-uniform bifunctional catalyst for the aromatization of methyl cyclopentane. React. Kinet. Mech. Catal. 2017, 124, 15–25. [Google Scholar] [CrossRef]
- Zhou, Z.; Zeng, T.; Cheng, Z.; Yuan, W. Kinetics of selective dehydrogenation of pyrolysis gasoline over an egg-shell catalyst. Chem. Eng. Sci. 2010, 65, 1832–1839. [Google Scholar] [CrossRef]
- Liu, B.; Chai, Y.; Liu, Y.; Wang, Y.; Liu, Y.; Liu, C. A simple method for preparation of presulfided eggshell CoMoS/γ-Al2O3 catalysts for hydrodesulfurization of dibenzothiophene. Fuel 2012, 95, 457–463. [Google Scholar] [CrossRef]
- Vakros, J.; Papadopoulou, C.; Lycourghiotis, A.; Kordulis, C. Hydrodesulfurization catalyst bodies with various Co and Mo profiles. Appl. Catal. A-Gen. 2011, 399, 211–220. [Google Scholar] [CrossRef]
- Liu, Y.; Cherkasov, N.; Gao, P.; Fernández, J.; Lees, M.R.; Evgeny, V.R. The enanchement of direct amide synthesis reaction rate over TiO2@SiO2@NiFe2O4 magnetic catalysts in the continuous flouw under readiofrequency heating. J. Catal. 2017, 355, 120–130. [Google Scholar] [CrossRef]
- Morbidelli, M.; Gavriilides, A.; Varma, A. Optimal Distribution of Catalyst in Pellets, Reactors and Membranes; Cambridge University Press: Cambridge, UK, 2001. [Google Scholar]
- Fogler, H.S. Elements of Chemical Reaction Engineering, 5th ed.; Prentice Hall Press: Boston, MA, USA, 2016. [Google Scholar]


© 2020 by the authors. Licensee MDPI, Basel, Switzerland. This article is an open access article distributed under the terms and conditions of the Creative Commons Attribution (CC BY) license (http://creativecommons.org/licenses/by/4.0/).